developers report on their use of wireless protocols for ... developers report on... · developers...
TRANSCRIPT
Developers Report on their Use of Wireless Protocols for
Embedded Applications
Jerry Krasner, PhD.
January 2013
Developers Report on their Use of Wireless Protocols for Embedded
Applications
Jerry Krasner, Ph.D., MBA
January 2013
Copyright 2013 by American Technology International, Inc, 638 Main St., Ashland, MA 01721. All rights
reserved. No part of this book covered by copyright hereon may be reproduced or copied in any manner whatsoever. Every effort has been made to provide accurate data. To the best of the editor’s knowledge, data is reliable and complete, but no warranty is made for this.
1
About EMF: www.embeddedforecast.com 508-881-1850
EMF is the premier market intelligence and advisory firm in the embedded technology industry. Embedded technology refers to the ubiquitous class of products which use some type of processor as a controller. These products include guided missiles, radars, and avionics as well as robots, automobiles, telecom gear, and medical electronics.
EMF has been conducting research into the embedded market for more than a decade. EMF survey work is recognized as the most comprehensive and statistically accurate set of measures in the embedded market space by LSA, IBM, Microsoft and a number of other firms. Using research discipline from medical inquiry, EMF has developed a series of survey questions for developers which provide insight into the following areas:
Trends in Integrated Development Environments (IDEs) and Real Time Operating Systems (RTOS)
Trends in host processors (both standard microprocessors and Digital Signal Processors (DSPs)
Trends in Interfaces and Trends in Bus and Board Standards Trends in Systems Engineering and Systems Architecture Trends in Software Languages Trends in simulation Trends in testing Trends in product life cycle management Trends in product development performance, practices and management
Embedded Market Forecasters (EMF) is the market research division of American Technology International, Inc. EMF clients range from startups to Global 100 companies worldwide. Founded by Dr. Jerry Krasner, a recognized authority on electronics markets, product development and channel distribution; EMF is headquartered in Ashland, Massachusetts.
About the author:
Jerry Krasner, Ph.D., MBA is Vice President of Embedded Market Forecasters and its parent company, American Technology International. A recognized authority with over 30 years of embedded industry experience, Dr. Krasner was formerly Chairman of Biomedical Engineering at Boston University, and Chairman of Electrical and Computer Engineering at Wentworth Institute of Technology and Bunker Hill Community College. In addition to his academic appointments, Dr. Krasner served as President of Biocybernetics, Inc. and CLINCO, Inc., Executive Vice President of Plasmedics, Inc. and Clinical Development Corporation, and Director of Medical Sciences for the Carnegie-Mellon Institute of Research. Earlier, he was Senior Engineer at the MIT Instrumentation Laboratory. Dr. Krasner earned BSEE and MSEE degrees from Washington University, a Ph.D. in Medical Physiology / Biophysics from Boston University and an MBA from Nichols College. He is a visiting professor at the Universidad de Las Palmas (Spain) where he was recognized for his work in neurosciences and computer technology.
2
Regarding the Data in this report The data that is referred to in this report is statistically accurate and authentic and is based on: A statistically generated comprehensive and detailed survey of embedded
developers and managers who reported on their design results (number of developers per project, vertical market of their design, time to market, percent of designs completed behind schedule or cancelled, closeness of final design outcomes to pre-design expectations, testing outcomes, etc.), the tools they used (development, modeling, Java, Eclipse, and other development tools), their choice of OS, IDE, communication middleware, processors used as well as where they go to learn about new products, tools and concepts.
An EMF Dashboard – a unique tool that allows the user to simultaneously
compare similar products (vendors can do competitive comparative analysis); that marketing executives can use for sales promo and strategic planning; that allows developers beginning a project to compare the experiences of hundreds of fellow developers that undertook similar projects to gain insights before making a commitment; and that allows CFOs and senior managers to look at what tools and processes resulted in the greatest cost savings.
For the interested reader, the following link demonstrates the power of the Dashboard and how we used it in developing the data that is presented herein: http://www.embeddedforecast.com/EMF_DashboardIntro/EMF_DashboardIntro.html
Overview: 2012 Embedded Developer Survey Developer Profile
Embedded development engineers were interviewed via a comprehensive survey designed to elicit information regarding current and anticipated tool usage, design starts, completions and cancellations, development (host) and target platforms, microprocessors used, desirable and undesirable product features, vendor evaluation criteria and purchasing decision processes, among other important information. This survey also inquired about the use of wireless protocols by responding developers.
Six hundred and forty two developers responded to the online survey, of which 60 were hardware engineers, 204 were software engineers, 61 were systems developers, 61 were systems architects, 55 were firmware engineers and 138 were engineering managers. In addition 63 developers gave titles other than these listed. This provided an excellent distribution of experiences and viewpoints from which to draw inferences and conclusions. Statistically, the response is at a 95% confidence level, plus or minus 4.1%. 72.0% of respondents came from North America, while 8.3% were from Asia and 19.8% were from Europe. Responses from these six hundred and forty two embedded developers comprised the comprehensive survey, which explored the attitudes, preferences and values of embedded developers to the current and projected use of embedded technologies usages and best practices. The survey was constructed such that the responses could be evaluated from many perspectives, including total response, specific job title of the respondent, architecture employed in embedded design, processor family, and each of ten embedded vertical market applications (e.g., telecom, industrial controls, etc.).
The Emergence of Wireless Protocols for Embedded Applications Wireless protocols are deployed across a large number of markets More than a decade ago, the telecommunications marketplace was undergoing a significant restructuring. Landline communications were more prevalent than wireless applications and the Regional Bell Operating Companies (RBOCS) were using their financial clout to drive the Competitive Local Exchange Companies (CLECS) out of business. They did this by dropping the cost charged to customers significantly (the cost of transmitted bit was falling precipitously due to enhanced communications technologies) which the CLECS couldn’t match. For a brief time the RBOCS were able to run at a loss to drive their competition away. With the CLECS failing, their equipment was quickly bought up by the RBOCS and absorbed into their infrastructure. Of course the market for new telecom equipment took a significant hit. At that time the wireless spectrum was limited and governed by Time Division Multiplexing (TDM) which increased the number of devices using the spectrum by sampling each device sequentially in thousands of seconds. Yet the spectrum didn’t
4
5
allow for the expansion of wireless applications and landline telecom dominated the industry. Today, wireless devices have overtaken landline usage and many folks have dropped their landline subscriptions and now use only handheld wireless devices as their primary communication modality. Given the extraordinary computational capabilities of “smart phones”, it is no surprise that wireless technologies have created new worlds for today’s casual, business and scientific usages (which are embedded applications). For the automotive industry the uptake of multiple and complex wireless protocols in still underway. Traditionally AM/FM radio was installed, but then remote access was added; Bluetooth came later, and the future promises increased use of Bluetooth, WiFi and DSRC. Within the medical industry, barriers to technology uptake have slowed the introduction of wireless protocols. However, this seems to be an industry on the cusp of widespread development utilizing both long range technologies for telehealth applications and low power short range technologies for sensor network, continuous monitoring and home based care scenarios. Among these short range technologies, Bluetooth classic, Bluetooth Low Energy, WiFi, ZigBee, and ANT are just some of the technologies being deployed. So let’s take a look at what wireless protocols developers are using for the varieties of embedded applications and how they are using them. We also include in this paper what they report as their preferences and what they report as complaints and concerns. The data presented shows that Bluetooth is the most frequently used wireless protocol followed by WiFi (802.11) and Zigbee. As a guide to developers and to embedded RTOS and modeling vendors, we present competitive offerings from Bluetooth providers to indicate which provide more than one wireless solution.
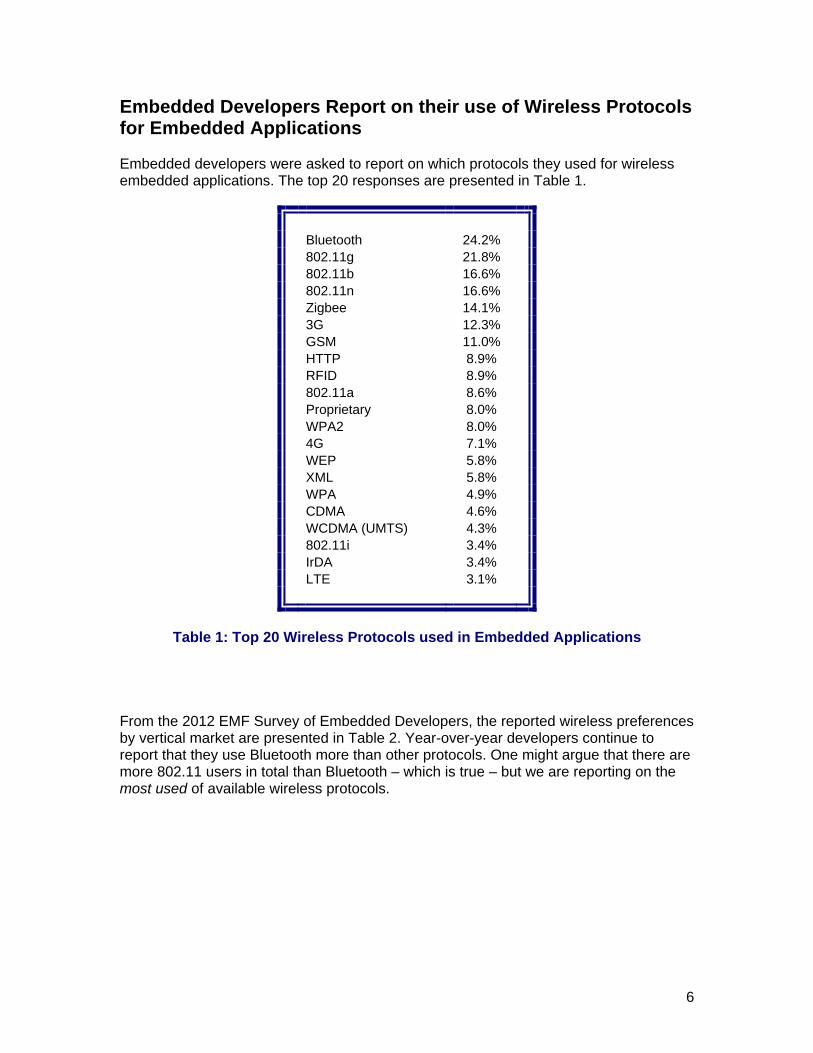
Embedded Developers Report on their use of Wireless Protocols for Embedded Applications Embedded developers were asked to report on which protocols they used for wireless embedded applications. The top 20 responses are presented in Table 1.
Bluetooth 24.2% 802.11g 21.8% 802.11b 16.6% 802.11n 16.6% Zigbee 14.1% 3G 12.3% GSM 11.0% HTTP 8.9% RFID 8.9% 802.11a 8.6% Proprietary 8.0% WPA2 8.0% 4G 7.1% WEP 5.8% XML 5.8% WPA 4.9% CDMA 4.6% WCDMA (UMTS) 4.3% 802.11i 3.4% IrDA 3.4% LTE 3.1%
Table 1: Top 20 Wireless Protocols used in Embedded Applications
From the 2012 EMF Survey of Embedded Developers, the reported wireless preferences by vertical market are presented in Table 2. Year-over-year developers continue to report that they use Bluetooth more than other protocols. One might argue that there are more 802.11 users in total than Bluetooth – which is true – but we are reporting on the most used of available wireless protocols.
6
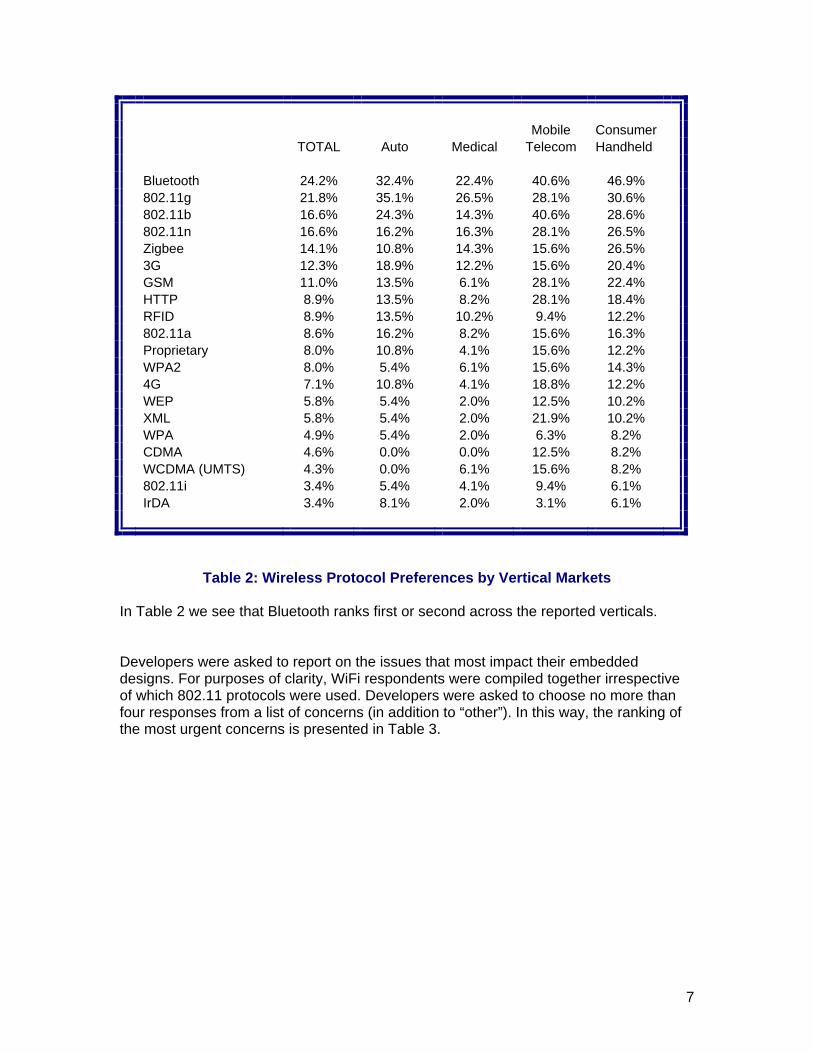
Mobile Consumer TOTAL Auto Medical Telecom Handheld Bluetooth 24.2% 32.4% 22.4% 40.6% 46.9% 802.11g 21.8% 35.1% 26.5% 28.1% 30.6% 802.11b 16.6% 24.3% 14.3% 40.6% 28.6% 802.11n 16.6% 16.2% 16.3% 28.1% 26.5% Zigbee 14.1% 10.8% 14.3% 15.6% 26.5% 3G 12.3% 18.9% 12.2% 15.6% 20.4% GSM 11.0% 13.5% 6.1% 28.1% 22.4% HTTP 8.9% 13.5% 8.2% 28.1% 18.4% RFID 8.9% 13.5% 10.2% 9.4% 12.2% 802.11a 8.6% 16.2% 8.2% 15.6% 16.3% Proprietary 8.0% 10.8% 4.1% 15.6% 12.2% WPA2 8.0% 5.4% 6.1% 15.6% 14.3% 4G 7.1% 10.8% 4.1% 18.8% 12.2% WEP 5.8% 5.4% 2.0% 12.5% 10.2% XML 5.8% 5.4% 2.0% 21.9% 10.2% WPA 4.9% 5.4% 2.0% 6.3% 8.2% CDMA 4.6% 0.0% 0.0% 12.5% 8.2% WCDMA (UMTS) 4.3% 0.0% 6.1% 15.6% 8.2% 802.11i 3.4% 5.4% 4.1% 9.4% 6.1% IrDA 3.4% 8.1% 2.0% 3.1% 6.1%
Table 2: Wireless Protocol Preferences by Vertical Markets
In Table 2 we see that Bluetooth ranks first or second across the reported verticals. Developers were asked to report on the issues that most impact their embedded designs. For purposes of clarity, WiFi respondents were compiled together irrespective of which 802.11 protocols were used. Developers were asked to choose no more than four responses from a list of concerns (in addition to “other”). In this way, the ranking of the most urgent concerns is presented in Table 3.
7
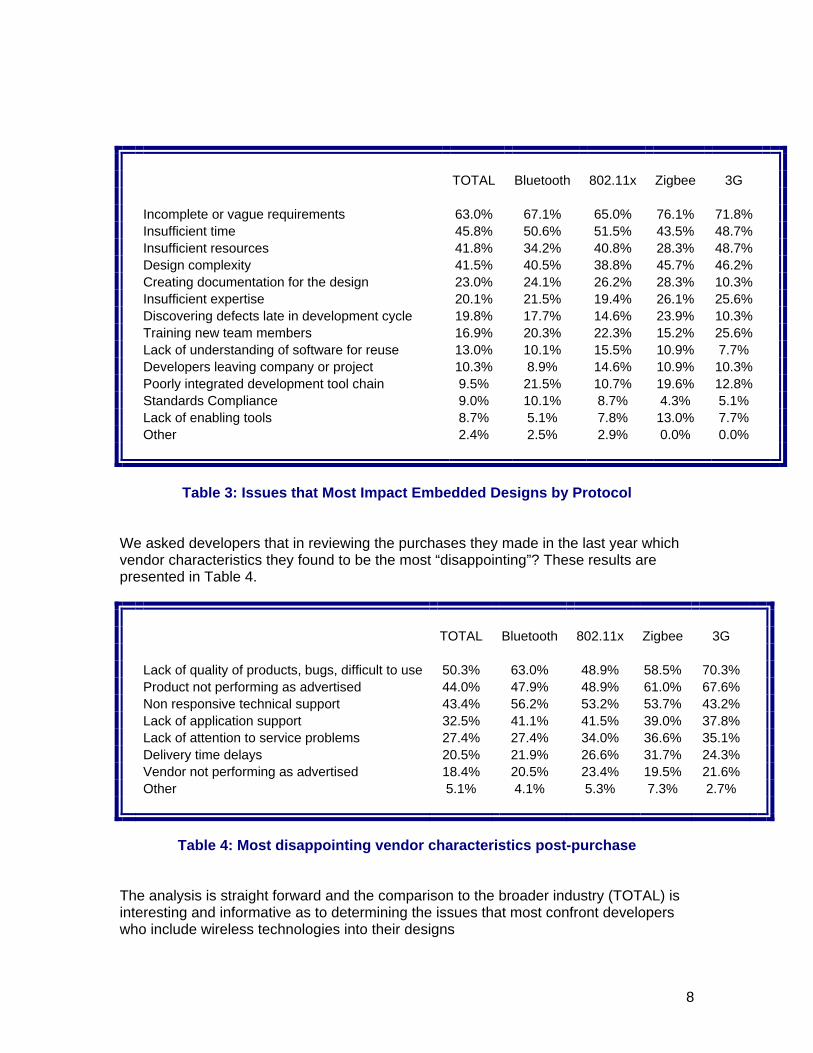
TOTAL Bluetooth 802.11x Zigbee 3G Incomplete or vague requirements 63.0% 67.1% 65.0% 76.1% 71.8% Insufficient time 45.8% 50.6% 51.5% 43.5% 48.7% Insufficient resources 41.8% 34.2% 40.8% 28.3% 48.7% Design complexity 41.5% 40.5% 38.8% 45.7% 46.2% Creating documentation for the design 23.0% 24.1% 26.2% 28.3% 10.3% Insufficient expertise 20.1% 21.5% 19.4% 26.1% 25.6% Discovering defects late in development cycle 19.8% 17.7% 14.6% 23.9% 10.3% Training new team members 16.9% 20.3% 22.3% 15.2% 25.6% Lack of understanding of software for reuse 13.0% 10.1% 15.5% 10.9% 7.7% Developers leaving company or project 10.3% 8.9% 14.6% 10.9% 10.3% Poorly integrated development tool chain 9.5% 21.5% 10.7% 19.6% 12.8% Standards Compliance 9.0% 10.1% 8.7% 4.3% 5.1% Lack of enabling tools 8.7% 5.1% 7.8% 13.0% 7.7% Other 2.4% 2.5% 2.9% 0.0% 0.0%
Table 3: Issues that Most Impact Embedded Designs by Protocol
We asked developers that in reviewing the purchases they made in the last year which vendor characteristics they found to be the most “disappointing”? These results are presented in Table 4.
TOTAL Bluetooth 802.11x Zigbee 3G Lack of quality of products, bugs, difficult to use 50.3% 63.0% 48.9% 58.5% 70.3% Product not performing as advertised 44.0% 47.9% 48.9% 61.0% 67.6% Non responsive technical support 43.4% 56.2% 53.2% 53.7% 43.2% Lack of application support 32.5% 41.1% 41.5% 39.0% 37.8% Lack of attention to service problems 27.4% 27.4% 34.0% 36.6% 35.1% Delivery time delays 20.5% 21.9% 26.6% 31.7% 24.3% Vendor not performing as advertised 18.4% 20.5% 23.4% 19.5% 21.6% Other 5.1% 4.1% 5.3% 7.3% 2.7%
Table 4: Most disappointing vendor characteristics post-purchase
The analysis is straight forward and the comparison to the broader industry (TOTAL) is interesting and informative as to determining the issues that most confront developers who include wireless technologies into their designs
8
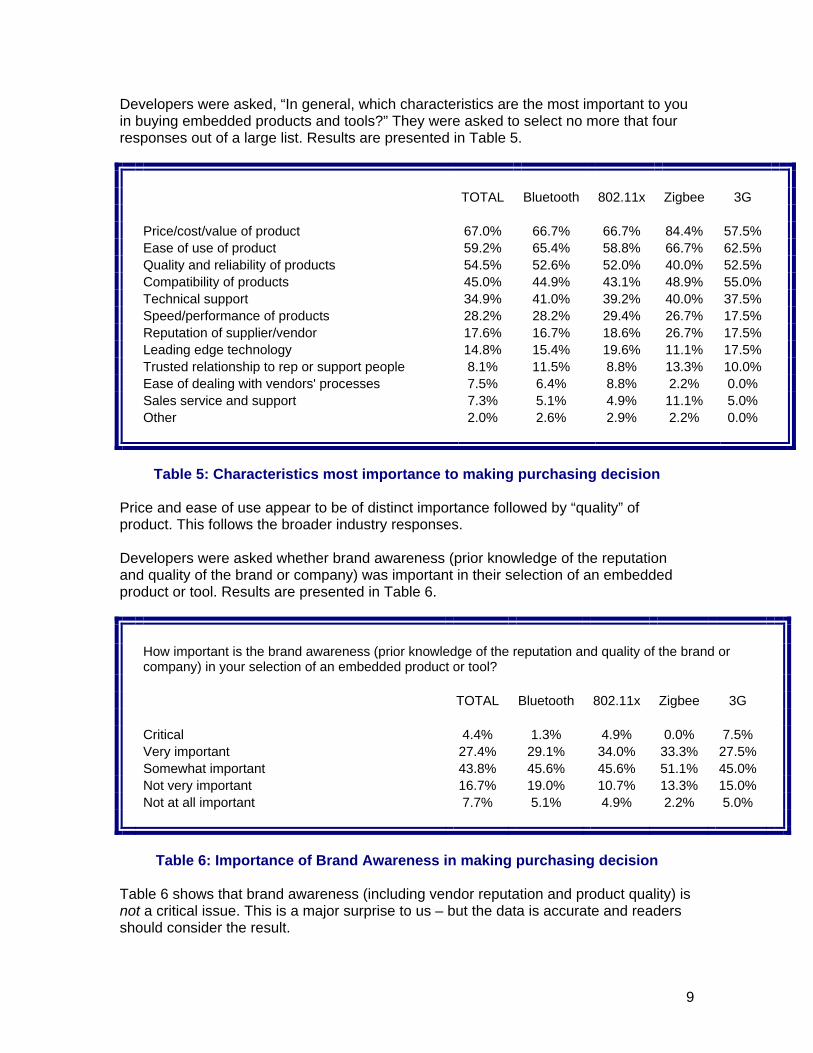
Developers were asked, “In general, which characteristics are the most important to you in buying embedded products and tools?” They were asked to select no more that four responses out of a large list. Results are presented in Table 5.
TOTAL Bluetooth 802.11x Zigbee 3G Price/cost/value of product 67.0% 66.7% 66.7% 84.4% 57.5% Ease of use of product 59.2% 65.4% 58.8% 66.7% 62.5% Quality and reliability of products 54.5% 52.6% 52.0% 40.0% 52.5% Compatibility of products 45.0% 44.9% 43.1% 48.9% 55.0% Technical support 34.9% 41.0% 39.2% 40.0% 37.5% Speed/performance of products 28.2% 28.2% 29.4% 26.7% 17.5% Reputation of supplier/vendor 17.6% 16.7% 18.6% 26.7% 17.5% Leading edge technology 14.8% 15.4% 19.6% 11.1% 17.5% Trusted relationship to rep or support people 8.1% 11.5% 8.8% 13.3% 10.0% Ease of dealing with vendors' processes 7.5% 6.4% 8.8% 2.2% 0.0% Sales service and support 7.3% 5.1% 4.9% 11.1% 5.0% Other 2.0% 2.6% 2.9% 2.2% 0.0%
Table 5: Characteristics most importance to making purchasing decision
Price and ease of use appear to be of distinct importance followed by “quality” of product. This follows the broader industry responses. Developers were asked whether brand awareness (prior knowledge of the reputation and quality of the brand or company) was important in their selection of an embedded product or tool. Results are presented in Table 6.
How important is the brand awareness (prior knowledge of the reputation and quality of the brand or company) in your selection of an embedded product or tool?
TOTAL Bluetooth 802.11x Zigbee 3G Critical 4.4% 1.3% 4.9% 0.0% 7.5% Very important 27.4% 29.1% 34.0% 33.3% 27.5% Somewhat important 43.8% 45.6% 45.6% 51.1% 45.0% Not very important 16.7% 19.0% 10.7% 13.3% 15.0% Not at all important 7.7% 5.1% 4.9% 2.2% 5.0%
Table 6: Importance of Brand Awareness in making purchasing decision
Table 6 shows that brand awareness (including vendor reputation and product quality) is not a critical issue. This is a major surprise to us – but the data is accurate and readers should consider the result.
9
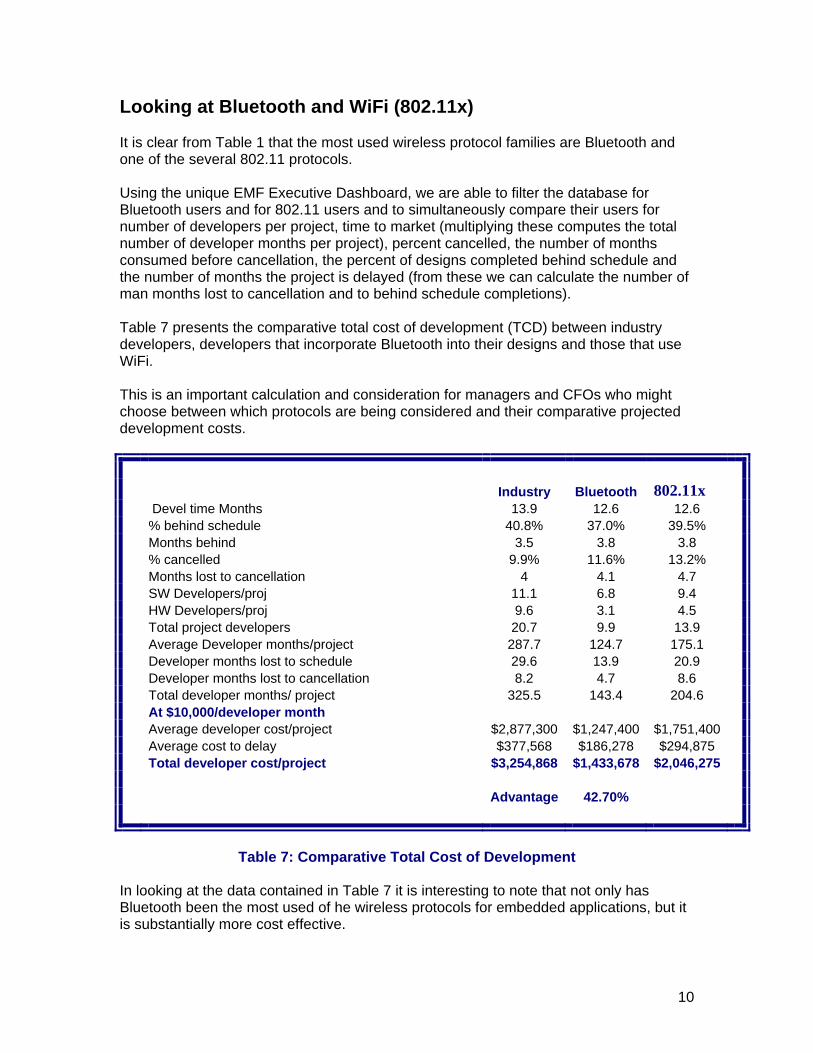
Looking at Bluetooth and WiFi (802.11x) It is clear from Table 1 that the most used wireless protocol families are Bluetooth and one of the several 802.11 protocols. Using the unique EMF Executive Dashboard, we are able to filter the database for Bluetooth users and for 802.11 users and to simultaneously compare their users for number of developers per project, time to market (multiplying these computes the total number of developer months per project), percent cancelled, the number of months consumed before cancellation, the percent of designs completed behind schedule and the number of months the project is delayed (from these we can calculate the number of man months lost to cancellation and to behind schedule completions). Table 7 presents the comparative total cost of development (TCD) between industry developers, developers that incorporate Bluetooth into their designs and those that use WiFi. This is an important calculation and consideration for managers and CFOs who might choose between which protocols are being considered and their comparative projected development costs.
Industry Bluetooth 802.11x Devel time Months 13.9 12.6 12.6 % behind schedule 40.8% 37.0% 39.5% Months behind 3.5 3.8 3.8 % cancelled 9.9% 11.6% 13.2% Months lost to cancellation 4 4.1 4.7 SW Developers/proj 11.1 6.8 9.4 HW Developers/proj 9.6 3.1 4.5 Total project developers 20.7 9.9 13.9 Average Developer months/project 287.7 124.7 175.1 Developer months lost to schedule 29.6 13.9 20.9 Developer months lost to cancellation 8.2 4.7 8.6 Total developer months/ project 325.5 143.4 204.6 At $10,000/developer month Average developer cost/project $2,877,300 $1,247,400 $1,751,400 Average cost to delay $377,568 $186,278 $294,875 Total developer cost/project $3,254,868 $1,433,678 $2,046,275 Advantage 42.70%
Table 7: Comparative Total Cost of Development
In looking at the data contained in Table 7 it is interesting to note that not only has Bluetooth been the most used of he wireless protocols for embedded applications, but it is substantially more cost effective.
10
11
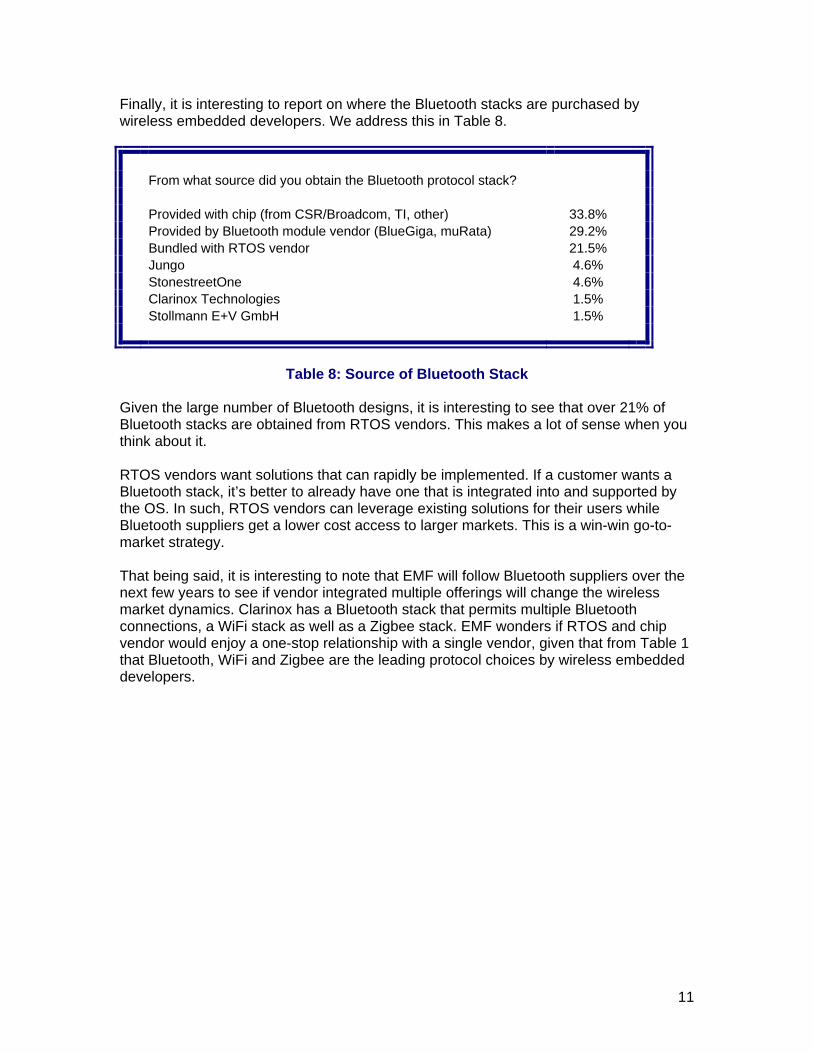
Finally, it is interesting to report on where the Bluetooth stacks are purchased by wireless embedded developers. We address this in Table 8.
From what source did you obtain the Bluetooth protocol stack? Provided with chip (from CSR/Broadcom, TI, other) 33.8% Provided by Bluetooth module vendor (BlueGiga, muRata) 29.2% Bundled with RTOS vendor 21.5% Jungo 4.6% StonestreetOne 4.6% Clarinox Technologies 1.5% Stollmann E+V GmbH 1.5%
Table 8: Source of Bluetooth Stack
Given the large number of Bluetooth designs, it is interesting to see that over 21% of Bluetooth stacks are obtained from RTOS vendors. This makes a lot of sense when you think about it. RTOS vendors want solutions that can rapidly be implemented. If a customer wants a Bluetooth stack, it’s better to already have one that is integrated into and supported by the OS. In such, RTOS vendors can leverage existing solutions for their users while Bluetooth suppliers get a lower cost access to larger markets. This is a win-win go-to- market strategy. That being said, it is interesting to note that EMF will follow Bluetooth suppliers over the next few years to see if vendor integrated multiple offerings will change the wireless market dynamics. Clarinox has a Bluetooth stack that permits multiple Bluetooth connections, a WiFi stack as well as a Zigbee stack. EMF wonders if RTOS and chip vendor would enjoy a one-stop relationship with a single vendor, given that from Table 1 that Bluetooth, WiFi and Zigbee are the leading protocol choices by wireless embedded developers.
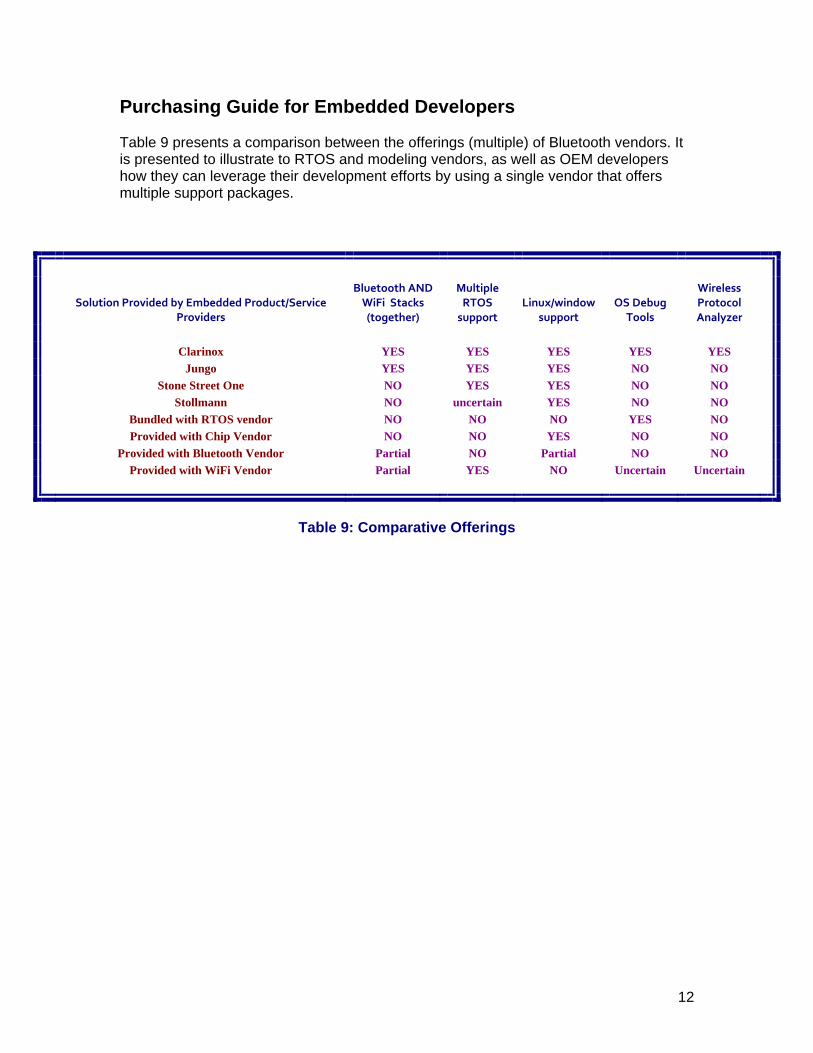
Purchasing Guide for Embedded Developers Table 9 presents a comparison between the offerings (multiple) of Bluetooth vendors. It is presented to illustrate to RTOS and modeling vendors, as well as OEM developers how they can leverage their development efforts by using a single vendor that offers multiple support packages.
Solution Provided by Embedded Product/Service
Providers
Bluetooth AND WiFi Stacks (together)
Multiple RTOS support
Linux/window support
OS Debug Tools
Wireless Protocol Analyzer
Clarinox YES YES YES YES YES
Jungo YES YES YES NO NO
Stone Street One NO YES YES NO NO
Stollmann NO uncertain YES NO NO
Bundled with RTOS vendor NO NO NO YES NO
Provided with Chip Vendor NO NO YES NO NO
Provided with Bluetooth Vendor Partial NO Partial NO NO
Provided with WiFi Vendor Partial YES NO Uncertain Uncertain
Table 9: Comparative Offerings
12