empea industry statistics q2 2015_official member
TRANSCRIPT

INDUSTRY STATISTICS Q2 2015
Emerging Markets Private Capital
Fundraising & Investment Analysis

2 | EMPEA
Announcements & AcknowledgementsImportant Update to EMPEA’s Research MethodologyPlease note that this release incorporates several changes to EMPEA's research methodology. Unless otherwise specified, EMPEA's data and statistics now include expanded coverage of private infrastructure and real assets and private credit funds, in addition to previously reported private equity activity.
For more information, please see our full Research Methodology here: http://empea.org/research/data-and-statistics/data-methodology
Terms of UseAll material and underlying data contained within this presentation are the intellectual property of EMPEA. Any reference to the material must be properly cited with notation attributing EMPEA as the source.
Contact UsFor additional information, inquiries, or questions, please contact us at [email protected] or call +1.202.333.8171 ext. 224.
AcknowledgmentsEMPEA would like to acknowledge the information provided by Asociación Mexicana de Capital Privado (AMEXCAP), Associação Brasileira de Private Venture Capital (ABVCAP), Association Marocaine des Investisseurs en Capital (AMIC), Czech Private Equity & Venture Capital Association (CVCA), Hong Kong Venture Capital & Private Equity Association (HKVCA) and Latin American Private Equity & Venture Capital Association (LAVCA). We thank these Industry Partners for their support.
3 | EMPEA
Table of Contents
• Overview of EM Private Capital• Global Private Equity• EM Private Capital: Fundraising• EM Private Capital: Investment• Cambridge Associates Private Equity & Venture
Capital Fund Performance
Note: “Private Capital” includes private equity, private credit, private infrastructure and real assets.

4 | EMPEA
Accessing EMPEA’s Quarterly Data
• For in-depth look at the data behind the charts in this presentation, EMPEA Members have exclusive access to:– Right click on the chart, and click “Edit Data” to view the full
table(s), or– Visit empea.org for the accompanying Excel data pack.
• EMPEA Members may also contact us to request a custom cut of the data via HelpDesk.
• For additional information, inquiries or questions, please contact us at [email protected] or call +1.202.333.8171 ext. 224.

5 | EMPEA
Overview of EM Private CapitalEmerging Markets │ Q2 2015 Industry Statistics

6 | EMPEA
Overall EM Fundraising & Investment
2011 2012 2013 2014 1H 2015$0
$20
$40
$60
48 4744
51
19
3128 28
36
14
Funds Raised Capital Invested
US
$ B
illio
ns
Data as of 30 June 2015. Published 5 August 2015.
Note: Includes private equity, private credit, private infrastructure and real assets.
Funds Raised
Capital Invested
$0
$5
$10
$15
$20
14 13
4.3
0.9
Private Equity
Infrastructure & Real Assets
Private Credit
US
$ B
illio
ns
1H 2015
19
14

7 | EMPEA
EM Fundraising by Asset Class
2011 2012 2013 2014 1H 20150%
20%
40%
60%
80%
100%
90% 86%79% 85%
72%
6% 9%12%
9%23%
5% 8% 6% 5%
Private Equity Infrastructure & Real Assets Private Credit
% o
f T
ota
l Ca
pit
al R
ais
ed
Data as of 30 June 2015. Published 5 August 2015.
Note: Includes private equity, private credit, private infrastructure and real assets.

8 | EMPEA
EM Investment by Asset Class
2011 2012 2013 2014 1H 20150%
20%
40%
60%
80%
100%
95% 96% 94% 91% 91%
4%4% 7%5%
Private Equity Infrastructure & Real Assets Private Credit
% o
f T
ota
l Ca
pit
al I
nv
es
ted
Data as of 30 June 2015. Published 5 August 2015.
Note: Includes private equity, private credit, private infrastructure and real assets.

9 | EMPEA
Global Private EquityEmerging Markets │ Q2 2015 Industry Statistics

10 | EMPEA
EM PE as % of Global PE Fundraising
2011 2012 2013 2014 1H 2015$0
$100
$200
$300
$400
0%
5%
10%
15%
20%19%
18%
10%
13%
11%
Developed Asia (JANZ) United States Western Europe Emerging Markets EM Fundraising as % of Global Total
US
$ B
illio
ns E
M a
s %
of G
lob
al
Sources: Developed Asia - Asia Private Equity Review, U.S. – PitchBook, Western Europe – EVCA, EM – EMPEA
Data as of 30 June 2015. Published 5 August 2015.
Note: Only includes private equity.

11 | EMPEA
EM PE as % of Global PE Investment
Sources: Developed Asia - Asia Private Equity Review, U.S. – PitchBook, Western Europe – EVCA, EM – EMPEA
Data as of 30 June 2015. Published 5 August 2015.
2011 2012 2013 2014 1H 2015$0
$100
$200
$300
$400
0%
5%
10%10% 10% 10% 10%
8%
Developed Asia (JANZ) United States Western Europe Emerging Markets EM Investment as % of Global Total
US
$ B
illio
ns E
M a
s %
of G
lob
al
Note: Only includes private equity.

12 | EMPEA
Global PE Penetration
Israel United States
United Kingdom
India South Korea
China Brazil Japan SSA* South Africa
Poland MENA** Turkey Russia0.00
0.20
0.40
0.60
0.80
1.00
1.20
1.40
1.60
1.80
1.47
1.09
0.93
0.190.23
0.080.13
0.040.11
0.050.09
0.010.05
0.01
1.65
1.46
0.79
0.20 0.19 0.15 0.13 0.13 0.11 0.100.04
0.01 0.02 0.004
2013
2014
PE
Inv
es
tme
nt/
GD
P (
%)
Data as of 30 June 2015. Published 5 August 2015.
Sources:• Emerging Markets – EMPEA• United Kingdom – Centre for Management Buy-Out Research• United States – PitchBook• Israel – Israel Venture Capital Research Center• Japan – Asia Private Equity Review• All GDP data – International Monetary Fund
*Sub-Saharan Africa; **Middle East & North Africa
Note: Only includes private equity.

13 | EMPEA
EM PE Fundraising & Investment as % of Global PE
2011 2012 2013 2014 1H 20150%
5%
10%
15%
20% 19%18%
10%
13%
11%
10% 10% 10% 10%
8%
EM PE Fundraising EM PE Investment
% o
f G
lob
al T
ota
l
Data as of 30 June 2015. Published 5 August 2015.
Note: Only includes private equity.

14 | EMPEA
EM Private Capital: FundraisingEmerging Markets │ Q2 2015 Industry Statistics

15 | EMPEA
Overall EM Fundraising
2011 2012 2013 2014 1H 2015$0
$20
$40
$60
$80
0
50
100
150
200
250
48 4744
51
19
228236
220 223
100
Total Capital Raised (US$B) No. of Funds
US
$ B
illio
ns
No
. of F
un
ds
Data as of 30 June 2015. Published 5 August 2015.
Note: Includes private equity, private credit, private infrastructure and real assets.

16 | EMPEA
EM Fundraising by Region
2011 2012 2013 2014 1H 20150%
20%
40%
60%
80%
100%
70%61%
67% 62% 64%
4%11% 4%
19%13% 13% 19%
15%
4%
5% 9% 15%8% 12%
4%
Emerging Asia CEE & CIS Latin America MENA Sub-Saharan Africa Multi-Region
% o
f T
ota
l Ca
pit
al R
ais
ed
Data as of 30 June 2015. Published 5 August 2015.
Note: Includes private equity, private credit, private infrastructure and real assets.

17 | EMPEA
EM Fundraising by Strategy
2011 2012 2013 2014 1H 20150%
20%
40%
60%
80%
100%
22%
41%32% 36%
24%
51%
38%
42% 35%
35%
17% 7%5% 14%
14%
5% 7%11%
8%
18%
5% 8% 6% 5%5%
Buyout Growth Venture Capital Infrastructure Real Assets Private Credit
% o
f T
ota
l Ca
pit
al R
ais
ed
Data as of 30 June 2015. Published 5 August 2015.
Note: Includes private equity, private credit, private infrastructure and real assets.

18 | EMPEA
EM Fund Size Distribution
2011 2012 2013 2014 1H 20150%
20%
40%
60%
80%
100%
38%49% 44%
33%39%
22%
21% 26%
31% 22%
21%
16% 12%
12% 19%
10%8% 11%
14% 11%
9% 7% 6% 10% 9%
<US$100m US$100m-US$249m US$250m-US$499m US$500m-US$999m >US$1 billion
% o
f T
ota
l No
. of
Fu
nd
s
Data as of 30 June 2015. Published 5 August 2015.
Note: Based on total capital raised by funds reaching a final close in the designated year.
Note: Includes private equity, private credit, private infrastructure and real assets.

19 | EMPEA
EM Median Fund Size by Asset Class
Data as of 30 June 2015. Published 5 August 2015.
2011 2012 2013 2014 1H 2015$0
$100
$200
$300
$400
152
84104
150
113
356
167
220
119
274
111
256
175
136
NS
155
100
127146 154
Private Equity Infrastructure & Real AssetsPrivate Credit All Asset Classes
US
$ M
illio
ns
Note: NS = Not Significant.
Note: Includes private equity, private credit, private infrastructure and real assets.
20 | EMPEA
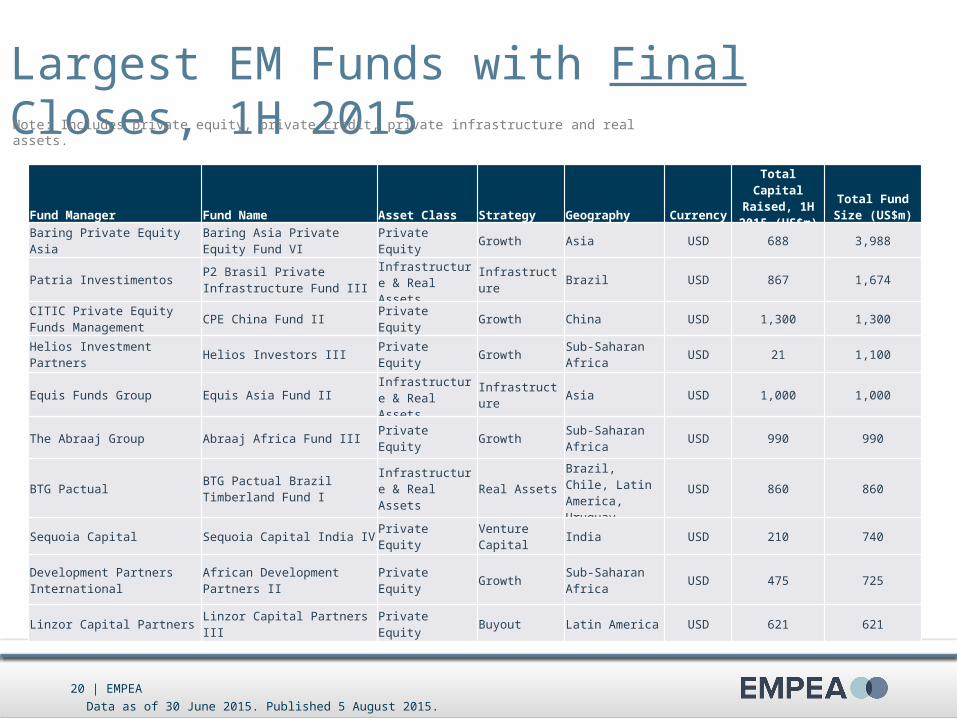
Largest EM Funds with Final Closes, 1H 2015
Data as of 30 June 2015. Published 5 August 2015.
Fund Manager Fund Name Asset Class Strategy Geography Currency
Total Capital Raised, 1H
2015 (US$m)Total Fund Size
(US$m)
Baring Private Equity AsiaBaring Asia Private Equity Fund VI
Private Equity Growth Asia USD 688 3,988
Patria InvestimentosP2 Brasil Private Infrastructure Fund III
Infrastructure & Real Assets
Infrastructure Brazil USD 867 1,674
CITIC Private Equity Funds Management
CPE China Fund II Private Equity Growth China USD 1,300 1,300
Helios Investment Partners Helios Investors III Private Equity GrowthSub-Saharan Africa
USD 21 1,100
Equis Funds Group Equis Asia Fund IIInfrastructure & Real Assets
Infrastructure Asia USD 1,000 1,000
The Abraaj Group Abraaj Africa Fund III Private Equity GrowthSub-Saharan Africa
USD 990 990
BTG PactualBTG Pactual Brazil Timberland Fund I
Infrastructure & Real Assets
Real AssetsBrazil, Chile, Latin America, Uruguay
USD 860 860
Sequoia Capital Sequoia Capital India IV Private Equity Venture Capital India USD 210 740
Development Partners International
African Development Partners II Private Equity GrowthSub-Saharan Africa
USD 475 725
Linzor Capital Partners Linzor Capital Partners III Private Equity Buyout Latin America USD 621 621
Note: Includes private equity, private credit, private infrastructure and real assets.

21 | EMPEA
Largest EM Funds with Closes, 1H 2015
Data as of 30 June 2015. Published 5 August 2015.
*Fundraising as of 30 June 2015.
Fund Manager Fund Name Asset Class Strategy Geography Currency
Total Capital Raised, 1H
2015 (US$m)Total Fund Size
(US$m)
Baring Private Equity AsiaBaring Asia Private Equity Fund VI
Private Equity Growth Asia USD 688 3,988
RRJ Capital RRJ Capital Master Fund III* Private Equity BuyoutAsia, China, Southeast Asia
USD 2,600 2,600
Patria InvestimentosP2 Brasil Private Infrastructure Fund III
Infrastructure & Real Assets
Infrastructure Brazil USD 867 1,674
CITIC Private Equity Funds Management
CPE China Fund II Private Equity Growth China USD 1,300 1,300
Helios Investment Partners Helios Investors III Private Equity GrowthSub-Saharan Africa
USD 21 1,100
Equis Funds Group Equis Asia Fund IIInfrastructure & Real Assets
Infrastructure Asia USD 1,000 1,000
The Abraaj Group Abraaj Africa Fund III Private Equity GrowthSub-Saharan Africa
USD 990 990
BTG PactualBTG Pactual Brazil Timberland Fund I
Infrastructure & Real Assets
Real AssetsBrazil, Chile, Latin America, Uruguay
USD 860 860
Sequoia Capital Sequoia Capital India IV Private Equity Venture Capital India USD 210 740
Development Partners International
African Development Partners II Private Equity GrowthSub-Saharan Africa
USD 475 725
Note: Includes private equity, private credit, private infrastructure and real assets.

22 | EMPEA
EM Private Capital: InvestmentEmerging Markets │ Q2 2015 Industry Statistics

23 | EMPEA
Overall EM Investment
2011 2012 2013 2014 1H 2015$0
$10
$20
$30
$40
$50
0
500
1,000
1,500
3128 28
36
14
1,081 1,0631,128
1,391
738
Total Capital Invested (US$B) No. of Deals
US
$ B
illio
ns
No
. of D
ea
ls
Data as of 30 June 2015. Published 5 August 2015.
Note: Includes private equity, private credit, private infrastructure and real assets.

24 | EMPEA
EM Investment by Quarter
Q2 Q3 Q4 Q1 Q2 Q3 Q4 Q1 Q2 Q3 Q4 Q1 Q22012 2013 2014 2015
$0
$5
$10
$15
$20
0
100
200
300
400
6.4
9.5
6.1
3.7
7.15.8
10.9
7.4
9.1
11.4
8.5
6.0
8.4
266286
209
284
251266
327347
327
365352 345
393
Total Capital Invested (US$B) No. of Deals
US
$ B
illio
ns N
o. o
f De
als
Data as of 30 June 2015. Published 5 August 2015.
Note: Includes private equity, private credit, private infrastructure and real assets.

25 | EMPEA
EM Investment by Region
2011 2012 2013 2014 1H 20150%
20%
40%
60%
80%
100%
69%58%
66%74% 78%
11%
9%8%
5%5%
14%
22%18%
14% 11%
5% 4% 7% 6% 4%7%
Emerging Asia CEE & CIS Latin America MENA Sub-Saharan Africa
% o
f T
ota
l Ca
pit
al I
nv
es
ted
Data as of 30 June 2015. Published 5 August 2015.
Note: Includes private equity, private credit, private infrastructure and real assets.

26 | EMPEA
EM Investment by Sector
2011 2012 2013 2014 1H 20150%
20%
40%
60%
80%
100%
30% 29% 27%32% 35%
15% 18%17%
16%16%
11% 10% 13%
15%15%
13% 14% 14%
11%10%9% 10% 11%
10%11%7%
9% 8%7%
6%5%
TelecommunicationsUtilitiesBasic MaterialsOil & GasHealth CareFinancialsConsumer GoodsTechnologyIndustrialsConsumer Services
% o
f N
o. o
f D
ea
ls
Data as of 30 June 2015. Published 5 August 2015.
FTSE ICB Industry†
† The Industry Classification Benchmark (“ICB”) is owned by FTSE International Limited (“FTSE”). “FTSE®” is a trademark of the London Stock Exchange Group companies and is used by FTSE under license. FTSE does not accept any liability to any person for any loss or damage arising out of any error or omission in the ICB.
Note: Includes private equity, private credit, private infrastructure and real assets.

27 | EMPEA
EM Investment by Stage
Data as of 30 June 2015. Published 5 August 2015.
2011 2012 2013 2014 1H 20150%
20%
40%
60%
80%
100%
46% 43%33% 26% 26%
10% 12%12%
10%
33% 35%44% 54% 64%
9% 9% 7%Mezzanine
Debt
PIPE
Venture Capital
Buyout
Growth
% o
f N
o. o
f D
ea
ls
2011 2012 2013 2014 1H 20150%
20%
40%
60%
80%
100%
44% 51%33% 37% 41%
26%24%
41% 30%10%
12% 8% 10% 19%31%
18% 17% 12% 9% 15%Mezzanine
Debt
PIPE
Venture Capital
Buyout
Growth% o
f C
ap
ita
l In
ve
ste
d
Note: Includes private equity, private credit, private infrastructure and real assets.

28 | EMPEA
EM Investment Size Distribution
2011 2012 2013 2014 1H 20150%
20%
40%
60%
80%
100%
38%47% 50% 46% 51%
26%20%
24% 28%26%
15%15%
10% 9% 7%10% 8% 7% 7% 6%
9% 8% 7% 7% 9%
300+
100-299
50-99
25-49
10-24
<10
% o
f N
o. o
f D
ea
ls
Data as of 30 June 2015. Published 5 August 2015.
US$m
Note: Includes private equity, private credit, private infrastructure and real assets.

29 | EMPEA
EM Median Deal Size by Region
Emerging Asia CEE & CIS Latin America MENA Sub-Saharan Africa
$0
$10
$20
$30
15
6
23
5
8
10
13
25
9
5
10
6
15
5
6
10
4
11
6
1010
7 7
2
9
2011 2012 2013 2014 1H 2015
US
$ M
illio
ns
Data as of 30 June 2015. Published 5 August 2015.
Note: Includes private equity, private credit, private infrastructure and real assets.

30 | EMPEA
EM Median Deal Size by Asset Class
2011 2012 2013 2014 1H 2015$0
$20
$40
$60
$80
$100
1410 9 10 9
90
58
75
85
75
1711
1518
141410 10 10 10
Private Equity Infrastructure & Real Assets Private Credit All Asset Classes
US
$ M
illio
ns
Data as of 30 June 2015. Published 5 August 2015.
Note: Includes private equity, private credit, private infrastructure and real assets.

31 | EMPEA
EM Median Deal Size by Investment Stage
Buyout Growth PIPE Venture CapitalDebt & Mezzanine$0
$20
$40
$60
$80
$100
65
16
30
6
17
35
17
26
4
11
72
1518
4
15
98
15 15
5
18
85
1621
6
14
2011 2012 2013 2014 1H 2015
US
$ M
illio
ns
Data as of 30 June 2015. Published 5 August 2015.
*“Private Capital” includes private equity, private credit, infrastructure and real assets.
Note: Includes private equity, private credit, private infrastructure and real assets.

32 | EMPEA
Largest Known EM InvestmentsLargest Known Investments in Emerging Asia, 1H 2015
Data as of 30 June 2015. Published 5 August 2015.
Fund Manager, Co-investors Company Name Country ICB Sector† Asset ClassInvestment Type
Investment Amount (US$m)
Investment Date
Shikumen Capital Management (SCM), CDH Investments, China International Capital Corp (CICC)
Shanghai Lujiazui International Financial Asset Exchange (Lufax)
China Financial Services Private Equity Growth 483 Mar-15
The Carlyle GroupAsia Satellite Telecommunications Holdings (AsiaSat)
ChinaTechnology Hardware & Equipment
Private Equity PIPE 461 May-15
CITIC Private Equity Funds Management
Jin Cai Holdings China General Industrials Private Equity PIPE 407 May-15
KKR Fujian Sunner Development China Food Producers Private Equity PIPE 400 May-15
Silver Lake Qunar.com China Travel & Leisure Private Equity PIPE 330 Jun-15
Cybernaut (China) InvestmentChongqing Zhubajie Network (Zhubajie.com)
ChinaSoftware & Computer Services
Private Equity Growth 258 Jun-15
DST Global, Accel Partners, Tiger Global Management
ANI Technologies (Ola) (Formerly Olacabs)
India Travel & Leisure Private EquityVenture Capital
252 Apr-15
RRJ CapitalShanghai Yupei Company (China Logistics)
China Industrial Transportation Private Equity Growth 250 Jun-15
RRJ Capital Shanghai Bright Holstan China Food Producers Private Equity Growth 244 Jan-15
† The Industry Classification Benchmark (“ICB”) is owned by FTSE International Limited (“FTSE”). “FTSE®” is a trademark of the London Stock Exchange Group companies and is used by FTSE under license. FTSE does not accept any liability to any person for any loss or damage arising out of any error or omission in the ICB.
Note: Includes private equity, private credit, private infrastructure and real assets.

33 | EMPEA
Data as of 30 June 2015. Published 5 August 2015.
Largest Known Investments ex-Emerging Asia, 1H 2015
Fund Manager, Co-investors Company Name Country ICB Sector† Asset ClassInvestment Type
Investment Amount (US$m)
Investment Date
The Carlyle Group Rede D’Or Sao Luiz BrazilHealth Care Equipment & Services
Private Equity Growth 592 Apr-15
Advent International Allied BrazilTechnology Hardware & Equipment
Private Equity Buyout 373 Feb-15
Apollo Global Management Nova KBM Slovenia Banks Private Equity Buyout 224 Jun-15
Actis Lekela PowerSouth Africa
ElectricityInfrastructure & Real Assets
Growth 220 Feb-15
Mid Europa Partners Danube Foods Group Serbia Food Producers Private Equity Buyout 192 Apr-15
The Abraaj GroupNorth Africa Hospital Holdings Group (NAHHG)
North Africa
Health Care Equipment & Services
Private Equity Growth 145 Mar-15
Ethos Private Equity
Nampak's Tissue, Corrugated and Sacks Division (Neopack and TwinSaver)
South Africa
Household Goods & Home Construction
Private Equity Buyout 133 Apr-15
Patria Investimentos Hidrovias do Brasil Brazil Industrial TransportationInfrastructure & Real Assets
Growth 100 May-15
Helios Investment Partners Africa Oil Corp Kenya Oil & Gas Producers Private Equity Growth 100 May-15
The Abraaj Group Hepsiburada Turkey General Retailers Private Equity Growth 100 Feb-15
Largest Known EM InvestmentsNote: Includes private equity, private credit, private infrastructure and real assets.
† The Industry Classification Benchmark (“ICB”) is owned by FTSE International Limited (“FTSE”). “FTSE®” is a trademark of the London Stock Exchange Group companies and is used by FTSE under license. FTSE does not accept any liability to any person for any loss or damage arising out of any error or omission in the ICB.

34 | EMPEA
Most Active Dealmakers
Fund Manager(s) No. of Deals
Sequoia Capital 56
Matrix Partners 34
IDG Capital Partners (IDGVC) 24
SAIF Partners 24
Tiger Global Management 24
500 Startups 21
East Ventures 20
Accel Partners 14
Lightspeed Venture Partners 14
Morningside Ventures 12
Most Active VC Dealmakers, 1H 2015
Data as of 30 June 2015. Published 5 August 2015.
Fund Manager(s) No. of Deals
Aavishkaar Venture Management 8
Investisseurs et Partenaires (I&P) 8
Sequoia Capital 8
Mezzanine Capital Partners 6
RRJ Capital 5
Advent International, Canbank Venture Capital, CDH Investments, Creador, IDG Capital Partners (IDGVC), KKR, Matrix Partners, The Abraaj Group, TPG, Warburg Pincus
4
Most Active Private Capital (ex. VC) Dealmakers, 1H 2015
Note: “VC” includes seed, early-stage and late-stage transactions.
Note: “Private Capital (ex. VC)” includes private equity growth and buyout, private infrastructure and private credit investments.
Note: Includes private equity, private credit, private infrastructure and real assets.

35 | EMPEA
Cambridge Associates Private Equity & Venture Capital Fund Performance
Emerging Markets │ Q2 2015 Industry Statistics

36 | EMPEA
Global PE & VC Fund Performance
Comparative End-to-End Returns by Region (as of 31 March 2015)
Source: Cambridge Associates LLC Proprietary Index: pooled end-to-end returns, net of fees, expenses and carried interest.
Notes: The index is an end-to-end calculation based on data compiled from 553 global emerging markets private equity and venture capital funds (includes funds investing primarily in Africa, Asia/Pacific–Emerging, Europe–Emerging, Latin America & Caribbean and Middle East–Emerging) including fully liquidated partnerships, formed between 1986 and 2014. The Asia Emerging Markets Index consists of 309 funds, the Europe Emerging Markets Index consists of 61 funds, the Latin America & Caribbean Index consists of 52 funds and the Africa Index consists of 49 funds. Please note that the Global Emerging Markets Index contains 82 funds that do not fall into these specific regions stated above. A Middle East index is not calculated because of insufficient sample size.
Data as of 31 March 2015.
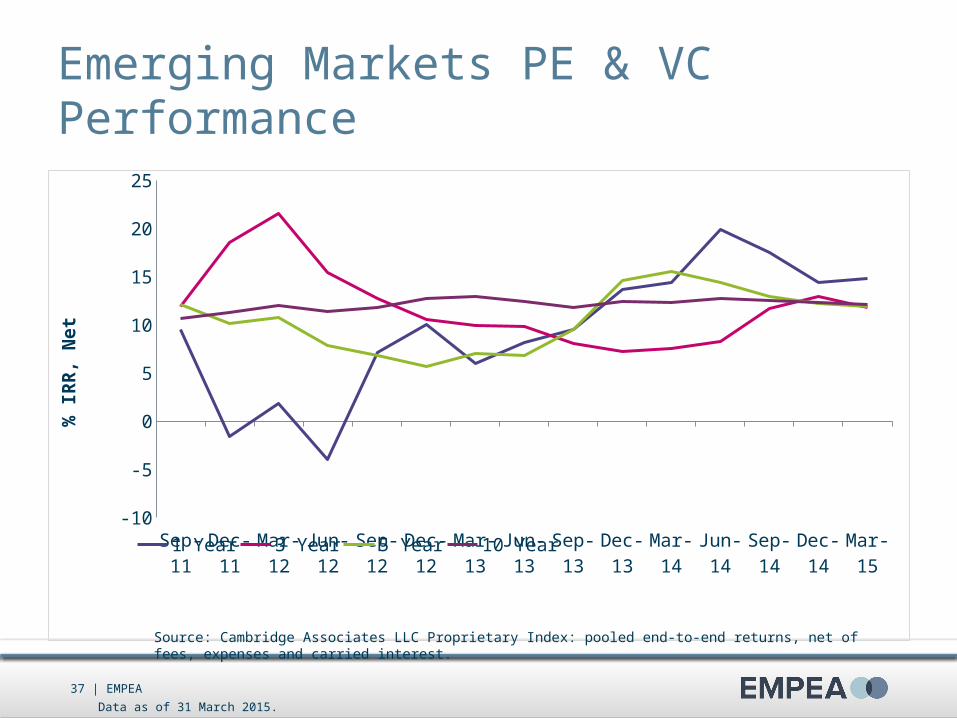
Index One Year Three Year Five Year Ten YearEmerging Markets PE & VC 14.83 11.81 11.94 12.09Emerging Asia PE & VC 23.94 16.39 15.17 14.39CEE & Russia PE & VC -20.29 -2.09 4.35 6.71Latin America & Caribbean PE & VC 0.09 0.04 2.34 9.74Africa PE & VC 0.24 5.99 5.86 7.22MSCI Emerging Markets 0.79 0.67 2.08 8.82US VC 20.21 17.81 16.83 10.82US PE 10.66 14.50 15.43 12.98Western Europe VC 1.53 13.53 12.66 7.09Western Europe PE -4.28 -5.73 8.03 10.64S&P 500 12.73 16.11 14.47 8.01
37 | EMPEA
Emerging Markets PE & VC Performance
Sep-11
Dec-11
Mar-12
Jun-12
Sep-12
Dec-12
Mar-13
Jun-13
Sep-13
Dec-13
Mar-14
Jun-14
Sep-14
Dec-14
Mar-15
-10
-5
0
5
10
15
20
25
1 Year 3 Year 5 Year 10 Year
% IR
R, N
et
Data as of 31 March 2015.
Source: Cambridge Associates LLC Proprietary Index: pooled end-to-end returns, net of fees, expenses and carried interest.

38 | EMPEA
Emerging Asia PE & VC Performance
Sep-11
Dec-11
Mar-12
Jun-12
Sep-12
Dec-12
Mar-13
Jun-13
Sep-13
Dec-13
Mar-14
Jun-14
Sep-14
Dec-14
Mar-15
-10
-5
0
5
10
15
20
25
30
1 Year 3 Year 5 Year 10 Year
% IR
R, N
et
Data as of 31 March 2015.
Source: Cambridge Associates LLC Proprietary Index: pooled end-to-end returns, net of fees, expenses and carried interest.

39 | EMPEA
Central & Eastern Europe* PE & VC Performance
Sep-11
Dec-11
Mar-12
Jun-12
Sep-12
Dec-12
Mar-13
Jun-13
Sep-13
Dec-13
Mar-14
Jun-14
Sep-14
Dec-14
Mar-15
-25
-20
-15
-10
-5
0
5
10
15
20
25
1 Year 3 Year 5 Year 10 Year
% IR
R, N
et
Data as of 31 March 2015.
Source: Cambridge Associates LLC Proprietary Index: pooled end-to-end returns, net of fees, expenses and carried interest.
*The Central & Eastern Europe PE Index includes Russia.

40 | EMPEA
Latin America & Caribbean PE & VC Performance
Sep-11
Dec-11
Mar-12
Jun-12
Sep-12
Dec-12
Mar-13
Jun-13
Sep-13
Dec-13
Mar-14
Jun-14
Sep-14
Dec-14
Mar-15
-15
-10
-5
0
5
10
15
20
25
1 Year 3 Year 5 Year 10 Year
% IR
R, N
et
Data as of 31 March 2015.
Source: Cambridge Associates LLC Proprietary Index: pooled end-to-end returns, net of fees, expenses and carried interest.

41 | EMPEA
Africa PE & VC Performance
Dec-12 Mar-13 Jun-13 Sep-13 Dec-13 Mar-14 Jun-14 Sep-14 Dec-14 Mar-15-5
0
5
10
15
20
1 Year 3 Year 5 Year 10 Year
% IR
R, N
et
Data as of 31 March 2015.
Source: Cambridge Associates LLC Proprietary Index: pooled end-to-end returns, net of fees, expenses and carried interest.

42 | EMPEA
EMPEA’s industry data and statistics provide an overview of fundraising, investment and exit activity among private alternative asset managers active in the emerging markets of Africa, Asia, Europe, Latin America and the Middle East. Unless stated otherwise, the information presented in EMPEA reports and data products is drawn from EMPEA’s proprietary research database, FundLink, and is based on data obtained from surveys of industry participants, direct communications with fund managers, press releases, trade publications and exchanges with regional and local venture capital associations. Fundraising, investment and exit amounts in EMPEA reports have been confirmed wherever possible directly by fund managers. EMPEA updates historical data on a quarterly basis as new data from fund managers and other sources is compiled in FundLink. Any discrepancies between the aggregate statistics published by EMPEA and the constituent data on individual funds and transactions included in tables and raw data files can be attributed to confidential information that has been omitted from public reporting.
EMPEA’s reporting covers activity by long-term, private, direct investment funds, backed by institutional investors, across the following three asset classes: private equity, private infrastructure and real assets and private credit—collectively “private funds” or “private capital”. EMPEA data and statistics exclude activity from real estate funds, fund of funds, secondaries funds, traditional investment holding companies, corporate strategic investors, government-owned or managed entities and captive investment vehicles, as well as funds investing primarily in publicly-traded equity or debt securities.
Funds: Reported fundraising totals reflect only official closes (interim and/or final) as reported in primary and secondary sources or directly by fund managers. Capital commitments accruing prior to or between official closes are not included in reporting.
Investments: EMPEA classifies investments into one of three asset classes—private equity, private infrastructure and real assets or private credit—and into one of the following deal types: buyout, growth, venture capital, PIPE, mezzanine or debt. Venture capital includes seed, early-stage and late-stage investments. When determining how an investment should be classified, EMPEA takes into account the typical investment strategy of the fund manager(s) involved, the type of security acquired, the reported round number or type of transaction, the development stage of the company at the time of investment, the company’s business model and the type of product or service that the company provides. Secondary investments (both traditional and direct) are excluded from reporting. In addition, wherever possible, bank (acquisition) financing and co-investment from excluded entities (mentioned in the first section of this note) are excluded from reported investment values, both to ensure continuity across regions and to provide a more accurate picture of the scale and pace of capital deployment by the funds that are the primary focus of EMPEA’s research.
Geographies: EMPEA data and statistics are compiled based on the “market” approach. Fundraising activity is categorized based on the countries, sub-regions or regions in which fund
managers intend to invest, while investment activity is categorized based on the country headquarters of investee companies. For companies registered in offshore financial centers or developed markets, but operating exclusively or predominately in emerging markets, investment activity is categorized based on the geographic footprint of the operations of investee companies. In the case of global or multi-regional funds, only those funds investing primarily in emerging markets are included in fundraising totals (e.g., pan-Asia funds with a significant portion of capital intended for investment in China and India). Country-dedicated fundraising data and statistics reflect only those funds with a single-country strategy or mandate. Target allocations to individual markets within a broader global or regional fund are not attributed to single-country fundraising totals.
Regions in this report are defined as: • Emerging Asia: Asia Pacific, excluding Japan, Australia and New Zealand. • Central and Eastern Europe (CEE) and Commonwealth of Independent States (CIS): European Union accession countries (2004), Southeastern Europe (excluding Greece) and Turkey, as well as Russia and other CIS countries.• Latin America: Mexico, Central and South America and the Caribbean (excluding Puerto Rico and other overseas territories and departments).• Middle East and North Africa (MENA): Gulf Cooperation Council (GCC), Afghanistan, Iran, Iraq, Jordan, Lebanon, Pakistan, Palestinian Territories, Syria and Yemen, as well as North Africa (Algeria, Egypt, Libya, Morocco, Sudan and Tunisia).• Sub-Saharan Africa: Africa, excluding North Africa as defined above.
Sectors: EMPEA’s fund and company sector classifications are based on the Industry Classification Benchmark (ICB), which is owned by FTSE International Limited (FTSE). FTSE® is a trademark of the London Stock Exchange Group companies and is used by FTSE under license. FTSE does not accept any liability to any person for any loss or damage arising out of any error or omission in the ICB.
Additional Notes: Abbreviations commonly used in EMPEA reports:EM – Emerging marketsPE – Private equityVC – Venture capitalGP – General partner (fund manager)LP – Limited partner (fund investor) In some exhibits in EMPEA publications, percentage labels may not sum to 100% due to rounding. In all tables in which it appears, “N/A” denotes a confidential or otherwise undisclosed value.
EMPEA Research Methodology

43 | EMPEA
EMPEA is the global industry association for private capital in emerging markets. We are an independent non-profit organization. We have over 300 member firms, comprising institutional investors, fund managers and industry advisors, who together manage more than US$1 trillion of assets and have offices in more than 100 countries across the globe. Our members share EMPEA’s belief that private capital is a highly suited investment strategy in emerging markets, delivering attractive long-term investment returns and promoting the sustainable growth of companies and economies. We support our members through global authoritative intelligence, conferences, networking, education and advocacy.
Robert W. van Zwieten │ President & Chief Executive Officer
Shannon Stroud │ VP, Programs & Business Development
Randy Mitchell │ VP, Strategic Engagement
Ann Marie Plubell │ VP, Regulatory Affairs
Holly Radel │ Senior Director, Marketing & Communications
Nadiya Satyamurthy │ Senior Director, Consulting Services
Kyoko Terada │ Senior Director, Membership & Industry Partners
Mike Casey │ Senior Director, Consulting Services
Phillip Reid │ Chief Financial Officer
Maryam Haque │ Senior Director, Research
Kim Bennett │ Senior Manager, Programs & Events
Emily Sandhaus │ Senior Manager, Programs & Business Development
Jeff Schlapinski │ Manager, Research
Cassie Hodges │ Associate, Marketing & Communications
Abigail Beach │ Associate, Strategic Engagement
Molly Brister │ Senior Research Analyst
Brady Jewett │ Research Analyst
Luke Moderhack │ Research Analyst
Rae Winborn │ Research Analyst
Sara Cousins │ Member Services Coordinator
Leela Vosko │ Member Services Coordinator
Michele Rucker │ Marketing & Communications Coordinator
Michael Barth │ Senior Advisor
David Creighton │ Senior Advisor
Pat Dinneen │ Senior Advisor
Sanjiv Kapur │ Senior Advisor
Jamil Kassum │ Senior Advisor
Peter Tropper │ Senior Advisor
Kelly Williams│ Senior Advisor
1077 30th Street NW • Suite 100 • Washington, DC 20007 USAPhone: +1.202.333.8171 • Fax: +1.202.333.3162 • Web: empea.org
About EMPEA