emission factor documentation for ap-42 plywood and ... 2003 emission factor documentation for ap-42...
TRANSCRIPT

July 2003
Emission Factor Documentation for AP-42Chapter 10
Plywood and Composite Wood Products
Final Background Report
Prepared for
U. S. Environmental Protection AgencyOffice of Air Quality Planning and Standards
Emission Factors and Inventory GroupResearch Triangle Park, NC 27711
RTI Project No. 08550.001.014.003
Prepared by
RTI International3040 Cornwallis Road
Research Triangle Park, NC 27709

ii
NOTICE
The information in this document has been funded wholly or in part by the U. S. EnvironmentalProtection Agency under Contract No. 68-D01079 to RTI International. It has been reviewed by theOffice of Air Quality Planning and Standards, U. S. Environmental Protection Agency, and has beenapproved for publication. Mention of trade names or commercial products does not constituteendorsement or recommendation for use.

iii
Table of Contents
Section Page
1.0 Introduction . . . . . . . . . . . . . . . . . . . . . . . . . . . . . . . . . . . . . . . . . . . . . . . . . . . . . . . . . . . . . . . . . 1-1
2.0 Sources of Emission Data . . . . . . . . . . . . . . . . . . . . . . . . . . . . . . . . . . . . . . . . . . . . . . . . . . . . . . 2-12.1 Previous AP-42 Background Reports . . . . . . . . . . . . . . . . . . . . . . . . . . . . . . . . . . . . . . 2-12.2 Emission Test Reports from EPA MACT Survey . . . . . . . . . . . . . . . . . . . . . . . . . . . . . 2-22.3 NCASI Data . . . . . . . . . . . . . . . . . . . . . . . . . . . . . . . . . . . . . . . . . . . . . . . . . . . . . . . . . . 2-2
3.0 Pollutants and Emission Measurement Methods . . . . . . . . . . . . . . . . . . . . . . . . . . . . . . . . . . . . 3-13.1 Hazardous Air Pollutants (HAP) . . . . . . . . . . . . . . . . . . . . . . . . . . . . . . . . . . . . . . . . . . 3-13.2 Non-HAP Data . . . . . . . . . . . . . . . . . . . . . . . . . . . . . . . . . . . . . . . . . . . . . . . . . . . . . . . . 3-2
3.2.1 Organic Compounds . . . . . . . . . . . . . . . . . . . . . . . . . . . . . . . . . . . . . . . . . . . . . 3-23.2.2 Particulate Matter . . . . . . . . . . . . . . . . . . . . . . . . . . . . . . . . . . . . . . . . . . . . . . . 3-43.2.3 Other Non-HAP Compounds . . . . . . . . . . . . . . . . . . . . . . . . . . . . . . . . . . . . . . 3-6
3.3 Emission Testing Issues . . . . . . . . . . . . . . . . . . . . . . . . . . . . . . . . . . . . . . . . . . . . . . . . . 3-73.3.1 Organic Emissions From Dryers and Presses . . . . . . . . . . . . . . . . . . . . . . . . . . 3-73.3.2 Moisture Content of Dryer Exhaust . . . . . . . . . . . . . . . . . . . . . . . . . . . . . . . . . 3-73.3.3 VOC and PM-10 Measurements . . . . . . . . . . . . . . . . . . . . . . . . . . . . . . . . . . . . 3-83.3.4 Interrelationship of PM/PM-10 and VOC Emissions . . . . . . . . . . . . . . . . . . . . 3-93.3.5 Summary of Emission Testing Issues . . . . . . . . . . . . . . . . . . . . . . . . . . . . . . . . 3-9
4.0 Review of Emission Data . . . . . . . . . . . . . . . . . . . . . . . . . . . . . . . . . . . . . . . . . . . . . . . . . . . . . . 4-14.1 AP-42 . . . . . . . . . . . . . . . . . . . . . . . . . . . . . . . . . . . . . . . . . . . . . . . . . . . . . . . . . . . . . . . 4-24.2 Emission Test Reports . . . . . . . . . . . . . . . . . . . . . . . . . . . . . . . . . . . . . . . . . . . . . . . . . . 4-24.3 NCASI Data . . . . . . . . . . . . . . . . . . . . . . . . . . . . . . . . . . . . . . . . . . . . . . . . . . . . . . . . . . 4-4
5.0 Emission Factor Calculations . . . . . . . . . . . . . . . . . . . . . . . . . . . . . . . . . . . . . . . . . . . . . . . . . . . 5-15.1 General Approach . . . . . . . . . . . . . . . . . . . . . . . . . . . . . . . . . . . . . . . . . . . . . . . . . . . . . 5-15.2 Grouping of Emission Data . . . . . . . . . . . . . . . . . . . . . . . . . . . . . . . . . . . . . . . . . . . . . . 5-1
5.2.1 Grouping by Air Pollution Control Device . . . . . . . . . . . . . . . . . . . . . . . . . . . 5-15.2.2 Grouping Within Source Types . . . . . . . . . . . . . . . . . . . . . . . . . . . . . . . . . . . . 5-2
5.3 Calculating Emission Factors . . . . . . . . . . . . . . . . . . . . . . . . . . . . . . . . . . . . . . . . . . . . 5-35.4 Emission Factor Ratings . . . . . . . . . . . . . . . . . . . . . . . . . . . . . . . . . . . . . . . . . . . . . . . . 5-4
6.0 References . . . . . . . . . . . . . . . . . . . . . . . . . . . . . . . . . . . . . . . . . . . . . . . . . . . . . . . . . . . . . . . . . . 6-1
Attachment 1. Acronyms/Codes/Abbreviations . . . . . . . . . . . . . . . . . . . . . . . . . . . . . . . . . . . . . . . . . . A-1
Attachment 2. Example Calculation . . . . . . . . . . . . . . . . . . . . . . . . . . . . . . . . . . . . . . . . . . . . . . . . . . A-11
Attachment 3. Conversion Factors and Equations . . . . . . . . . . . . . . . . . . . . . . . . . . . . . . . . . . . . . . . A-15

iv
This page intentionally left blank.

1.0 Introduction
1-1
1.0 IntroductionThe purpose of this report is to document the development and revision of emission factors for
the EPA’s Compilation of Air Pollutant Emission Factors, Volume I: Stationary Point and Area Sources(commonly referred to as AP-42), Chapter 10, Wood Products Industry. Four previous AP-42 sectionswere revised: Section 10.5, Plywood Manufacturing; Section 10.6.1, Waferboard/Oriented StrandboardManufacturing; Section 10.6.2, Particleboard Manufacturing; and Section 10.6.3, Medium DensityFiberboard Manufacturing. In addition, two new AP-42 sections were developed: Section 10.6.4,Hardboard and Fiberboard Manufacturing; and Section 10.9, Engineered Wood Products Manufacturing. Emission factors were not revised for the remaining sections of Chapter 10 (lumber, chemical woodpulping, pulp bleaching, papermaking, charcoal, and wood preserving).
An emission factor is a representative value that attempts to relate the quantity of a pollutantreleased to the atmosphere with an activity associated with the release of that pollutant. Emission factorsusually are expressed as the weight of pollutant divided by the unit weight, volume, distance, or durationof the activity that emits the pollutant. The emission factors presented in AP-42 may be appropriate touse in a number of situations, such as making source-specific emission estimates for areawide inventoriesfor dispersion modeling, developing control strategies, screening sources for compliance purposes,establishing operating permit fees, and making permit applicability determinations.
This background report consists of six sections. Section 1 is the introduction to the report. Section 2 discusses the sources of the emission data used to develop the emission factors. Section 3discusses the pollutants and the emission measurement methods used to collect the data. Section 4discusses the review of the emission data. Section 5 discusses the calculation of the emission factors. Section 6 lists the references.
1.0 Introduction
1-2
This page intentionally left blank.

2.0 Sources of Emission Data
2-1
2.0 Sources of Emission DataThe emission factors presented in this report are based on data combined from three types of
sources: (1) prior versions of AP-42 sections covering the plywood and composite wood productsindustry; (2) numerous emission test reports (dated 1995 or later) collected from plants during EPA’s1998 maximum achievable control technology (MACT) standard survey; and (3) results from anextensive air emission testing program conducted by the National Council of the Paper Industry for Airand Stream Improvement (NCASI). A total of 111 emission data sources were reviewed in thedevelopment of emission factors for the plywood and composite wood products sections of AP-42. These 111 emission data sources are divided into three groups as follows:
# Background reports for the previous plywood and composite wood products industry sectionsof AP-42 (including reviews of 124 emission test reports) — four reports;
# Emission test reports submitted with responses to EPA’s 1998 MACT survey — 99 reports;and
# NCASI technical bulletins (numbers 768 through 774, dated January 1999) and an associateddatabase — seven bulletins and the database.
When combined, the data from these three emission data sources yielded a total of approximately30,000 individual emission test runs. Sections 2.1 through 2.3 below provide brief descriptions of thethree data sources.
2.1 Previous AP-42 Background Reports
Emission factors for the wood products industry are presented in Chapter 10 of AP-42.1 Chapter 10 is divided into multiple sections according to the type of wood product manufactured. Foreach section published in AP-42, there is an accompanying background report. The AP-42 backgroundreports provide details from each of the emission data references used to develop the AP-42 emissionfactors. Emission test data and process information were extracted from the background reports for thefollowing previous AP-42 sections:2-5
# Plywood Manufacturing (September 1997),# Waferboard/Oriented Strandboard (OSB) Manufacturing (December 1998),# Particleboard Manufacturing (September 1998), and# Medium Density Fiberboard (MDF) Manufacturing (September 1998).
The previous plywood background report includes a review of emission data from five emissiontest reports, NCASI Technical Bulletin No. 405, and the plywood portion of NCASI Technical BulletinNo. 694.6,7 The previous waferboard/OSB background report includes a review of 105 emission testreports and the OSB portion of NCASI Technical Bulletin No. 694. The previous particleboardbackground report includes a review of eight emission test reports and the particleboard portion ofNCASI Technical Bulletin No. 693.8 The previous MDF background report includes a review of sixemission test reports and the MDF portion of NCASI Technical Bulletin No. 693.
2.0 Sources of Emission Data
2-2
The four previous AP-42 background reports were the source of approximately 5,600 emissiontest runs. The background reports include a significant quantity of data for criteria and other non-hazardous air pollutant (HAP) emissions including various particulate matter (PM) fractions, carbonmonoxide (CO), nitrogen oxides (NOx), carbon dioxide (CO2), total hydrocarbon (THC), and 33 othernon-HAP compounds. The emission test data extracted from the AP-42 background reports also includemeasurements for 32 speciated HAP compounds. The background reports include data for uncontrolledemissions sources, as well as data for emissions controlled with a number of air pollution control devices(APCDs), including regenerative thermal oxidizers (RTOs), wet electrostatic precipitators (WESPs),electrified filter beds (EFBs), wet scrubbers, multicyclones (multiclones), and baghouses (fabric filters).
2.2 Emission Test Reports from EPA MACT Survey
In addition to the data from the previous AP-42 background reports, 45 plants (representing14 companies) submitted 99 emission test reports with their responses to a 1998 EPA MACT survey ofthe plywood and composite wood products industry.9-107 These 99 reports represent approximately3,400 emission test runs and include measurements of 21 speciated HAP compounds. These reports alsoinclude measurements of THC, CO, CO2, NOx, and 25 other non-HAP compounds. The reports includemeasurements of uncontrolled emissions, as well as controlled emissions from sources equipped withseveral types of APCDs including RTOs, regenerative catalytic oxidizers (RCOs), thermal oxidizers,exhaust gas recirculation systems, biofilters, wet scrubbers, EFBs, WESPs, baghouses, andmulticyclones.
2.3 NCASI Data
Data from the NCASI MACT sampling program is published in a series of seven technicalbulletins and was also provided to EPA electronically in a consolidated emissions database.108-115 Theconsolidated emissions database includes approximately 21,000 emission test runs and is the largestsingle source of emission data for the wood products industry. Emission tests were conducted at29 wood products mills, representing a cross section of product types, source types, and emission controltechniques.
The data collected from the NCASI program characterize emissions of 20 speciated HAPcompounds, 9 additional non-HAP compounds, THC, and CO. In some cases, methane emissions weremeasured at RTO outlets so that non-methane THC emissions could be calculated. In addition touncontrolled emissions, emissions were measured at the outlets of a number of different APCDs,including RTOs, RCOs, biofilters, wet scrubbers, WESPs, EFBs, and baghouses.

3.0 Pollutants and Emission Measurement Methods
3-1
3.0 Pollutants and Emission MeasurementMethodsA number of different emission test methods were used to collect the emission data used in the
development of emission factors for the plywood and composite wood products sections of AP-42. Table 1 of Attachment 1 lists each emission test method used, the test method code used in the NCASIdatabases and the spreadsheets used to develop the new emission factors, and the pollutants measuredwith each method. Most of the data were collected using EPA reference test methods or the NCASIimpinger/canister method (NICM). With a few exceptions, all emissions data for a given pollutant weretreated equally regardless of the test methods used to collect those data. Data collected using ambienttest methods or National Institute for Occupational Safety and Health (NIOSH) test methods werediscarded if data collected with stack sampling methods were available for the same combination ofsource, control device, and pollutant. In addition, data collected using Method 25 (M25) were not usedfor the reasons provided in Section 3.2.1. Emission test methods for HAP and non-HAP compounds arediscussed in the paragraphs below.
3.1 Hazardous Air Pollutants (HAP)
“Hazardous air pollutants,” as used in this report, refers to the list of pollutants as promulgated in§112(b)(1) of the Clean Air Act (CAA). Emissions data were collected for approximately 30 HAPcompounds as part of this revision of AP-42. These HAP are italicized in Table 1 of Attachment 1. Theavailable HAP emissions data were collected using a variety of emission test methods.
With one exception, formaldehyde, no attempt was made to assess the potential effect of stacksampling methods on measured HAP emissions, primarily because the data sets were too small to showany significant effects. However, a significant amount of formaldehyde data was obtained using twodistinct test methods (described below), and therefore, the formaldehyde data collected with these twomethods were compared to determine if there were any biases associated with the test methods. Theresults of the data analysis showed no discernible differences in the results obtained using the twomethods (in fact, the two data sets completely overlapped), and therefore, all of the availableformaldehyde data were treated as one data set.116
The bulk of the speciated organic HAP data (including formaldehyde) was collected as part ofthe NCASI emissions test program using the NICM. The NCASI test program included the sampling andanalysis of 20 different HAP compounds. A list of these compounds and the analysis methods used tomeasure each HAP is provided in Table 2 of Attachment 1. The NICM testing was done using a self-validating quality assurance program and is described in detail in NCASI Technical Bulletin 774.114
A significant amount of formaldehyde and other aldehyde and ketone emissions data from woodproducts operations also was obtained using EPA Method 0011 (M0011). The procedure collects anintegrated sample isokinetically at points along perpendicular traverses of the stack. The gaseous andparticulate pollutants in the sample gas are collected in an impinger train that contains an aqueous acidicsolution of dinitrophenyl-hydrazine. Formaldehyde reacts with the dinitrophenyl-hydrazine to form a

3.0 Pollutants and Emission Measurement Methods
3-2
formaldehyde dinitrophenylhydrazone derivative. This derivative is extracted, solvent exchanged,concentrated, and analyzed by high performance liquid chromatography.
Although M0011 was developed specifically for formaldehyde emissions, it has not beenvalidated for measuring formaldehyde emissions from wood products industry emission sources. EPAMethod 0011 also has been applied to other aldehyde and ketone compounds including acetaldehyde,acrolein, propionaldehyde, and methyl ethyl ketone. However, EPA recommends that M0011 be usedonly for the determination of formaldehyde, acetophenone, isophorone, acetaldehyde, andpropionaldehyde emissions from stationary sources.117 The EPA further concludes that M0011 is notappropriate for the measurement of quinone, acrolein, methyl ethyl ketone, and methyl isobutyl ketone,due either to poor collection efficiency or analytical problems. The poor collection efficiency andanalytical problems result in emission estimates for these compounds that are biased low.
Some formaldehyde data were collected using California Air Resources Board (CARB) Method430. The EPA’s Emission Measurement Center (EMC) has indicated that this method is similar toM0011.118
Other EPA reference methods used to collect HAP emission data include Method 0010 for semi-volatile organic HAP, Method 0030 for volatile organic HAP, Method 308 for methanol, and Method 18for benzene. In addition, three methods from the EPA Compendium of Methods for the Determination ofToxic Organic Compounds in Ambient Air (TO) were used to collect HAP data: TO-5, TO-8, andTO-14. The limited data available for methylene diphenyl diisocyanate (MDI) were collected using oneof two methods: the 1-(2-pyridyl) piperazine method (1,2-PP) or NIOSH Physical and ChemicalAnalytical Method 142 (P&CAM142).
3.2 Non-HAP Data
Data also were compiled for a number of non-HAP compounds. The majority of the non-HAPemission data collected are measurements taken using EPA reference methods. Emission measurementmethods for organic compounds, PM, and other non-HAP compounds are discussed in the paragraphswhich follow.
3.2.1 Organic Compounds
Organic compound emissions data for the wood products industry have been obtained primarilyvia one of two EPA methods: Method 25 (M25) and Method 25A (M25A). It is important to understandthat these two methods measure different portions of the total organic compounds in the exhaust streamand that results from the two methods are not directly comparable.
Method 25 measures volatile organic compounds (VOC) emissions as total gaseous nonmethaneorganics (TGNMO). Results of M25 measurements are typically reported as carbon concentrations ormass rates. Because organic PM interferes with the analysis of the volatile organics, the sample is drawnthrough a heated filter for PM removal. The sample is drawn from the filter through a condensate trapinto an evacuated sample tank. The material in the trap and sample tank are recovered and analyzedseparately, and the results are combined to determine total VOC. The organic material in the condensatetrap is oxidized to CO2 and collected in an evacuated vessel; then a portion of the CO2 is reduced tomethane (CH4) and measured by flame ionization detector (FID). A portion of the gas collected in thesample tank is first passed through a gas chromatograph to separate CO, CO2, and CH4 from the

3.0 Pollutants and Emission Measurement Methods
3-3
remaining nonmethane organic material (NOM). The NOM is then oxidized to CO2, reduced to CH4, andmeasured by FID. This procedure essentially counts the number of carbon atoms present in thenonmethane volatile organic material and eliminates inconsistencies associated with the variableresponse of the FID to different organic compounds.
Method 25A is used to provide a continuous measure of the concentration of organic vaporsconsisting primarily of alkanes, alkenes, and aromatic hydrocarbons, collectively referred to as THC. The stack gas sample is collected through a heated sample line with either an in-stack or heated filter toremove PM. From the filter, the sample is directed to an FID, and the concentration of organic materialin the gas stream is measured as calibration gas equivalents or as carbon equivalents. The results dependstrongly on the particular constituents that make up the organic content of the gas stream because the FIDhas different response factors for different organic bond structures. In particular, the carbon/oxygenbond (as in formaldehyde) provides a negative interference, so the response of the FID to oxygenatedcompounds (like formaldehyde) is diminished. Consequently, M25A does not include an adequatemeasure of formaldehyde emissions and does not accurately quantify emissions of other oxygenatedcompounds in the THC estimate. Also, M25A measures methane, which is not regulated as a VOC. Thismay result in the overestimation of VOC emissions from gas-fired emission sources which may havesignificant methane emissions.
The limited amount of M25 VOC emission data from the previous AP-42 background reportswas discarded. As mentioned above, measurements of VOC obtained using M25 are not directlycomparable with measurements of THC obtained using M25A. All of the non-speciated organiccompound data from the 99 emission test reports and from the NCASI MACT sampling program werecollected using M25A. In addition, most of the non-speciated organic compound data from the previousAP-42 background reports were obtained using M25A. All THC emission factors presented in this reportare based on M25A and are reported on a carbon basis. The THC emission factors have not beenadjusted to exclude methane.
It is important to note that the THC emission factor for a given source is not directly comparableto the sum of organic HAP emission factors (total HAP) for that source. The THC analysis uses themolecular weight (MW) of carbon (12 grams/mole) to convert measured concentrations into massemission rates. The mass emission rates for the individual HAP are calculated using the molecularweights of the individual compounds. Thus, different mass emission rates would be calculated by thetwo methods even if the measured concentrations were the same. In addition, as mentioned above,M25A underestimates the concentrations of oxygenated compounds in the exhaust stream.
Guidance from EPA’s Emission Factor and Inventory Group (EFIG) indicates that, whenpossible, VOC emission factors should be reported in terms of the actual weight of the emittedcompound. However, when an actual MW of the emitted stream is not feasible (as is the case with themixed streams emitted from wood products industry sources), the VOC should be reported using anassumed MW of 44, and reported “as propane.” Each VOC-as-propane emission factor is estimated byfirst converting the THC from a carbon basis to a propane basis. Propane (MW = 44) includes 3 carbonatoms (total MW of 36) and 8 hydrogen atoms (total MW of 8). Every 36 pounds of carbon measuredcorresponds to 44 pounds of propane. The ratio of the MW of propane to the MW of carbon in propaneis 44/36, or 1.22. The conversion from mass on a carbon basis to mass on a propane basis is expressedby the following equation:

3.0 Pollutants and Emission Measurement Methods
3-4
THC as pounds carbon × 44 pounds propane36 pounds carbon
= THC as pounds propane
orTHC as pounds carbon × 1.22 = THC as pounds propane
After the THC emission factor has been converted from a carbon to a propane basis, theformaldehyde emission factor is added (where available), then the available emission factors fornon-VOC compounds, including acetone, methane, and methylene chloride, are subtracted. Thisprocedure is expressed simply by the following equation:
VOC as propane = (1.22 × THC as carbon) + formaldehyde - (acetone + methane + methylene chloride)
In cases where no emission factor is available (or the emission factor is reported only as below the testmethod detection limit, or “BDL”) for one or more of the compounds used to estimate the VOC-as-propane value, adjustments to the converted THC value are made only for those compounds for whichemission factors are available. That is, a value of zero is inserted in the above equation for the specifiedcompounds where no emission factor is available, or where the emission factor is reported only as BDL. For example, if no methane emission factor is available, the THC-as-carbon emission factor is convertedto THC-as-propane, formaldehyde is added, and only acetone and methylene chloride are subtracted.
3.2.2 Particulate Matter
There are three distinct PM fractions for which EPA has developed emission test methods: (1) filterable PM, (2) condensible PM, and (3) particulate matter equal to or less than an equivalentaerodynamic diameter of nominally 10 micrometers (PM-10). The material collected in the probe andfilter (front-half catch) of an EPA Method 5 (M5) sampling train is considered by EPA to be filterablePM. The material collected in the impingers (back-half catch) of an EPA M5 or Method 202 (M202)sampling train is considered by EPA to be condensible PM. The material collected on the filter and inthe sample line between the cyclone and filter of an EPA Method 201 or 201A (M201 or M201A)sampling train is considered by EPA to be PM-10.
Test methods for PM (both filterable and condensible) include the standard reference method(EPA Methods 1 through 5 with M5 being the primary PM procedure) and derivatives of M5. Othermethods that have been used in the plywood and composite wood products industry are EPA Method 17(M17) for total PM, M201 and M201A for PM-10, M202 for condensible PM, Oregon Department ofEnvironmental Quality Method 8 (ODEQ-8) for filterable PM, and the Oregon Department ofEnvironmental Quality Method 7 (ODEQ-7) for both filterable PM and condensible PM. The paragraphsbelow first describe the essential features of M5 and then describe how the other procedures differ fromM5. No emissions data based on M17, ODEQ-7, or ODEQ-8 have been used to develop emission factorswere used to develop the revised and new wood products AP-42 sections.
The primary components of the M5 sampling train are the nozzle, the probe, a filter (which ismaintained at 120 ± 14°C [250 ± 25°F] in a heated filter box), an impinger train that is kept in an ice bathto cool the gas stream to ambient temperature, a meter box, and a pump. The impinger train containsfour impingers; the first two contain water, the third is dry, and the fourth contains silica gel to dry thegas stream before it enters the dry gas meter. The M5 train collects an integrated sample over one toseveral hours at sample points that span a cross-section of the exhaust duct or stack, typically onperpendicular traverses across the diameter of the stack. At each sampling point, a sample of the gas
3.0 Pollutants and Emission Measurement Methods
3-5
stream is collected isokinetically through the nozzle. The captured gas stream moves through the probeto the filter. Some particles are collected on the walls of the probe, and the remaining material that is inparticle phase at 120°C (250°F) is collected on the filter. The gases that pass through the filter then gothrough the impinger train where any organic or inorganic materials that condense between 16° and120°C (60° and 250°F) are collected. Typically, the material collected in the probe and filter (front halfcatch) is considered for regulatory purposes to be PM, and the material captured in the impingers (backhalf catch) is considered to be condensible PM. The procedures for M5 do not require the back halfcatch of the sampling train to be quantified. However, as explained below, the M5 train may be coupledwith a M202 sampling train for measuring the condensible PM emission rate.
The other two methods that have been used to collect total PM emissions from plywood andcomposite wood products industry operations, M17 and ODEQ-7, encompass the same principles as M5but have specific modifications. The primary difference between M5 and M17 is in the collectiontemperature for the front half catch. In order to maintain a collection temperature of 120°C (250°F), theM5 train employs a heated probe and filter. In contrast, the M17 train employs an in-stack filter, so thecollection temperature is equal to the actual temperature of the stack gas. If the stack gas temperature isless than 120°C (250°F), then any material that condenses at temperatures between the stack gastemperature and 120°C (250°F) will be measured as filterable PM with M17. However, in a M5 train,this material would pass through the front half of the train to the impingers and would not be quantifiedas filterable PM. The measures are reversed if the stack gas temperature is greater than 120°C (250°F).
The ODEQ-7 method modifies M5 by adding a filter between the third and fourth impingers tocollect any condensed material that escapes the impingers. This filter is maintained at approximatelyambient temperature, and the material collected in the first three impingers and on the second filter areadded to the front-half catch to obtain total PM. This procedure is intended to measure those constituentsin the emissions responsible for the formation of PM once the emissions have cooled to ambienttemperature.
Oregon Department of Environmental Quality Method 8 is a high volume method of samplingfilterable PM emissions, primarily designed for wood products handling cyclone and baghouse exhaustsystems, for which the primary emissions are solid PM. The primary components of the ODEQ-8 trainare the nozzle, the probe, a filter (unheated, outside stack), a meter box and a pump. One primarydifference between M5 and ODEQ-8 is in the collection temperature for the filter catch. In order tomaintain a collection temperature of 120°C (250°F), the M5 train employs a heated probe and filter. Incontrast, the ODEQ-8 train uses an unheated probe, and an unheated, out-of-stack filter, so the collectiontemperature is near the actual temperature of the stack gas. If the stack gas temperature is less than120°C (250°F), then any material that condenses at temperatures between the stack gas temperature and120°C (250°F) will be measured as filterable PM with ODEQ-8. However, in a M5 train, this materialwould pass through the front half of the train to the impingers and would not be quantified as filterablePM. The other major difference between M5 and ODEQ-8 is that the Oregon method does not include aseries of impingers, or back half, and, therefore does not quantify condensible PM.
In 40 CFR Part 51, EPA has published a procedure for determining condensible PM emissionrates (M202). Method 202, which applies to determination of condensible PM from stationary sources,measures condensible PM as material that passes through the filter and is collected in the impingers of aPM train. The primary method specifies that condensible PM be based on the back-half catch of a M17train (which uses an in-stack filter), but M5, M201, or M201A procedures are also acceptable. Themethod specifies that the impinger solution be extracted with methylene chloride, the inorganic and

3.0 Pollutants and Emission Measurement Methods
3-6
organic fractions be dried separately, the residues weighed, and the condensible PM be determined fromthe combination of both residues. Note that because the method allows the use of either a heated filtersystem or an in-stack filter system, some ambiguity in results can occur from test to test.
In 40 CFR Part 51, EPA has published two procedures for determining PM-10 emission rates(M201 and M201A). Methods 201 and 201A are derivatives of M5, both of which include an in-stackcyclone to remove particles with an aerodynamic diameter greater than 10 micrometers (:m) from the gasstream followed by an in-stack filter to collect the remaining particles. The back half of the train isidentical to the back half of the M5 train. Both methods require a traverse of the stack, but M201 usesisokinetic sampling with a recirculating system to maintain constant flow through the cyclone, whileM201A uses a constant sampling rate. The PM-10 is determined gravimetrically from the materialcaptured in the sample line between the cyclone and filter and on the filter. Neither of the two methodsspecify procedures for determining condensible PM, but both methods indicate that for applications suchas inventories of sources contributing to ambient PM-10 levels, PM-10 should be the sum of condensiblePM emissions and PM-10 emissions measured by the M201 or M201A procedures.
It is routine for filterable PM and condensible PM emissions to be summed in order to generate atotal, or “primary PM” value. With regard to PM-10 emissions, the applicability sections of EPA M201and M201A state that:
EPA recognizes that condensible emissions not collected by an in-stack method are alsoPM-10, and that emissions that contribute to ambient PM-10 levels are the sum ofcondensible emissions and emissions measured by an in-stack PM-10 method, such as[Method 201] or Method 201A. Therefore, for establishing source contributions toambient levels of PM-10, such as for emission inventory purposes, EPA suggests thatsource PM-10 measurement include both in-stack PM-10 and condensible emissions.
In effect, this means that condensible PM emissions are also PM-10 emissions, and in order to determinetotal “primary PM-10” emissions, PM-10 emissions measured with M201 or M201A should be summedwith condensible PM emissions. In this report, PM-10 emissions measured with M201 or M201A arereferred to as “filterable PM-10” as an indication of EPA’s view that these measurements represent onlythe “front-half” or “dry” portion of total primary PM-10 emissions.
Separate emission factors are presented for filterable PM and condensible PM; they may besummed to determine an emission factor for total primary PM. Similarly, the separate emission factorspresented for filterable PM-10 and condensible PM may be summed to determine an emission factor fortotal primary PM-10.
3.2.3 Other Non-HAP Compounds
Data are available for CO, CO2, NOx, SO2, and a number of volatile and semi-volatile organiccompounds. As noted above, most of the non-HAP data have been collected using EPA referencemethods. Data for these non-HAP compounds are incorporated from the previous AP-42 data and fromthe 99 emission test reports submitted with the MACT survey responses.
Speciated non-HAP aldehyde and ketone data based on M0011 measurements are available,primarily for the MDF and particleboard industry sectors. As mentioned in Section 3.1 of this report,EPA recommends M0011 be used only for the determination of formaldehyde, acetophenone,
3.0 Pollutants and Emission Measurement Methods
3-7
isophorone, acetaldehyde, and propionaldehyde emissions.117 Due to poor collection efficiency andanalytical problems, emission estimates for other compounds may be biased low. The M0011 data forthese compounds have been used to develop emission factors only in cases where no other emission dataare available. For compounds where measurements with other methods are available, the M0011 data forthese compounds have not been used in the development of average emission factors.
Speciated non-HAP data were also extracted from the NCASI MACT sampling database. TheNCASI MACT sampling database includes measurements of nine speciated non-HAP organiccompounds. A list of the nine non-HAP compounds and the analytical methods used to measure eachcompound is provided in Table 3 of Attachment 1. The NCASI MACT sampling database also includesmeasurements of CO and methane at selected sources.
3.3 Emission Testing Issues
Many of the difficulties encountered in developing VOC and PM-10 emission factors forplywood and composite wood products industry dryers and hot presses arise because of the chemicalcomposition of the organic materials found in the emission streams from these processes and the use ofdifferent test methods to collect and analyze these organic compounds for the historical data base. Also,the chemical and physical characteristics of these emission streams, particularly the moisture content andtemperature variations, complicate sampling and analysis and data reduction. Particular issues ofconcern are complications associated with high moisture in exhaust streams, differing VOC and PM-10results from different procedures and associated concerns with the condensible PM-10 as measured byMethod 202, and the interrelationship between the estimates of VOC and PM-10 emissions. These issuesare a general concern in the wood products industry and should be considered in the planning of emissiontest programs for the industry. The paragraphs below first discuss the characteristics of the organicmaterial in wood products exhaust streams and then address the general issues outlined above.
3.3.1 Organic Emissions From Dryers and Presses
As green wood is subjected to heat in plywood and composite wood products dryers, some of theorganic material in the wood is volatilized and carried off with the exhaust stream. These organicmaterials that emanate from the wood are the primary VOCs and condensible organic PM in the dryerexhaust. Consequently, the organic compounds found in wood products dryer emissions typicallyinclude terpenes, terpene-like materials, resins, and fatty acids comparable to those found in wood. Theboiling points of many of these materials are in the range of 155° to 370°C (310° to 700°F). Thesetemperatures are greater than typical dryer temperatures for some industry sectors, but the compoundsexhibit significant vapor pressures at dryer temperatures. Consequently, some of these organiccompounds are at saturation levels in the gas streams and will condense as the gas stream cools.
3.3.2 Moisture Content of Dryer Exhaust
The inherent moisture contents of exhaust streams from plywood and composite wood productsdryers complicate measurement of PM-10 emissions in these streams. This problem is most prevalent forfacilities that have wet control devices such as wet ESPs or wet scrubbers. Because the exhaust fromthese systems is saturated, moisture condensation downstream from the control device is common. TheEPA reference methods for PM-10 prescribe an in-stack filter that operates at stack temperatures. If thegas stream contains water droplets, sample train filter blinding (blockage of gas flow through the filter) islikely to preclude PM-10 sampling. This problem has been encountered during EPA tests conducted on

3.0 Pollutants and Emission Measurement Methods
3-8
wet ESP-controlled dryers as a part of the program to develop emission factors for the wood productsindustry.
One solution to this problem is to use a heated filter rather than an in-stack filter in theMethod 201 or 201A train. As a part of the testing, Method 202 could be used to determine condensiblePM emissions from the back half of the Method 201 or 201A train. The total PM-10 emissions could beestimated as the sum of the PM-10 emissions obtained from Method 201 or 201A and the condensiblePM emissions obtained from Method 202. This solution will eliminate the moisture problem, but it doeshave two drawbacks. First, since this procedure is different from the procedure used for dry controlsystems, the results will not be directly comparable. Second, this procedure exacerbates the problemsrelated to the interrelationship of VOC and PM-10 emissions discussed below.
High levels of moisture in exhaust streams can cause negative bias on Method 25A THCmeasurements. The magnitude of the bias can differ for different Method 25A analyzers. Few analyzershave shown significant biases at moisture contents of less than 10 percent. However, significant negativebias (e.g., around 20 percent) has been shown to occur for some Method 25A analyzers at 20 percentmoisture. One method for preventing the negative bias is to dilute high moisture exhaust streams to lessthan 10 percent moisture using heated air.
3.3.3 VOC and PM-10 Measurements
As suggested by the characteristics of the organic emissions from wood products dryersdescribed above, the dryer exhaust gas contains a substantial amount of organic material that iscondensible in the range of 50° to 120° C (120° to 250°F). Because all of the test methods describedearlier contain a filter to collect PM, the amount of this material that remains on that filter and theamount that will be measured downstream from the filter depend on the operating temperature of thefilter. Consequently, the material classified as PM-10, condensible PM, and VOC differs, depending onfilter temperature. The situation related to VOC emissions is further complicated by the presence ofaldehydes and ketones in the exhaust streams from dryers and presses. The paragraphs below firstaddress the PM-10 issues and then the VOC issues.
The applicability sections for M201 and M201A indicate that if PM-10 results are to be used forpurposes such as inventories, then the PM-10 results from those methods should be added to condensiblePM results from M202 to obtain total PM-10 emissions. Because the primary purpose of AP-42 is to aidin preparing emission inventories, such a combination appears to be appropriate for developing AP-42emission factors. However, condensible PM emissions can be determined via M202 in conjunction witha variety of trains. The available data base on condensible PM emissions from the wood productsindustry has been obtained using a M202 train following M5 and M201A trains. Because these trainsoperate at different filter temperatures, they can generate different measures of condensible PMemissions for the same facility. Furthermore, because M201A operates with an in-stack filter, thedistribution of filterable and condensible fractions will vary from site to site depending on stack gastemperatures. In addition, measurements of filterable PM by M5 and PM-10 by M201 or M201A on thesame stack gas can result in a PM-10 emission rate that is higher than the filterable PM emission ratebecause of the differences in sampling train filter temperatures. Such differences complicate averagingresults across facilities to develop emission factors.

3.0 Pollutants and Emission Measurement Methods
3-9
3.3.4 Interrelationship of PM/PM-10 and VOC Emissions
Due to source characteristics, there is an interrelationship between PM/PM-10 and VOCemissions. Because of this interrelationship, the differences in the test methods described above canresult in measuring some fraction of the organic constituents in the exhaust stream as both PM-10 andVOC emissions.
Available test data for wood products dryer emissions indicate that irrespective of filtertemperature, essentially all of the condensible PM that passes through the filter and is collected in theback half of a PM or PM-10 train is organic material. Also, any organic material that passes through anin-stack filter used with M25A will be measured as VOC. At the same time, organic material thatcondenses between the stack temperature and 120°C (250°F) will be measured as PM-10 by M201 andM201A. Furthermore, material that condenses in the back half of a M5 train will be classified ascondensible PM by M202. An overlap in the measured PM-10 and VOC emissions in the historical database may have occurred. If the recommendations of M201 and M201A related to including condensiblePM in estimating total PM-10 emissions are followed, condensible PM will be measured as both VOCand PM-10.
3.3.5 Summary of Emission Testing Issues
In summary, plywood and composite wood products industry source characteristics anddifferences in test methods used for collecting the historical test data make it difficult to combine theavailable data to obtain average emission factors. Consequently, engineering judgment was used tocombine the data and develop average emission factors.
Several general conclusions can be made regarding the measurement of PM-10 and VOCemissions for these sources. First, the source characteristics result in an interrelationship betweenPM/PM-10 and VOC. The constituent organic pollutants emitted act as both PM and VOC. When an in-stack filter is used during sampling, the measured filterable PM, condensible PM, and VOC will beaffected by the stack gas temperature. Consequently, these measurements should be made under normaloperating conditions; ideally, simultaneous measurements should be taken.
Second, the PM-10 and VOC test methods should be conducted to minimize the amount ofoverlap in their measurement. Use of M201 or M201A for filterable PM-10 in conjunction with M202for condensible PM-10 will provide total PM-10 results on the same basis (distribution of emissionsbetween the filterable and condensible fraction will be dependent upon stack gas temperature because theM201 and M201A trains use an in-stack filter). Use of M25A with an in-stack filter will provide VOCdata on the same basis as the PM-10 measurements. In this case, the condensible organic PM-10 fractionmeasured using M202 will also be measured as VOC by M25A. However, the amount of measurementoverlap can be estimated.
Finally, M25A has a very low response to formaldehyde, and a reduced response to otheraldehydes and ketones; consequently, the VOC emissions measured by M25A will be biased low in caseswhere these compounds are present. A separate measurement method (e.g., NCASI’s impinger methodor M0011) should be used to quantify these compounds when they are expected to be present in theemissions; for example, in the exhaust gases from the presses and from drying operations.
3.0 Pollutants and Emission Measurement Methods
3-10
This page intentionally left blank.
4.0 Review of Emission Data
4-1
4.0 Review of Emission DataAs part of the analysis of the emission data, the quantity and quality of the information contained
in the reference documents were evaluated. The following data were excluded from consideration:
# Test series averages reported in units that cannot be converted to the selected reporting units;
# Test series representing incompatible test methods (i.e., comparison of EPA Method 5 fronthalf with EPA Method 5 front and back half);
# Test series of controlled emissions for which the control device is not specified;
# Test series in which the source process is not clearly identified and described; and
# Test series in which it is not clear whether the emissions were measured before or after thecontrol device.
Test data sets that were not excluded were assigned a quality rating. Data used for AP-42 areassigned A through D letter ratings, where A represents the most reliable data. The rating system usedwas that specified by EFIG for preparing AP-42 sections. The data were rated as follows:
A Multiple test runs that were performed using sound methodology and reported in enoughdetail for adequate validation. These tests do not necessarily conform to the methodologyspecified in EPA reference test methods, although these methods were used as a guide for themethodology actually used.
B Tests that were performed by a generally sound methodology, but lack enough detail foradequate validation.
C Tests that were based on an unproven or new methodology, or that lacked a significantamount of background information.
D Tests that were based on a generally unacceptable method, but may provide anorder-of-magnitude value for the source.
The following criteria were used to evaluate test reports and other primary sources of emissiondata for sound methodology and adequate detail:
1. Source operation. The manner in which the source was operated is well documented in thereport. The source was operating within typical parameters during the test.
2. Sampling procedures. The sampling procedures conformed to a generally acceptablemethodology. If actual procedures deviated from accepted methods, the deviations are well documented. When this occurred, an evaluation was made of the extent to which such alternative procedures couldinfluence the test results.
4.0 Review of Emission Data
4-2
3. Sampling and process data. Adequate sampling and process data are documented in thereport, and any variations in the sampling and process operation are noted. If a large spread between testresults cannot be explained by information contained in the test report, the data are suspect and are givena lower rating.
4. Analysis and calculations. The test reports contain original raw data sheets. Thenomenclature and equations used were compared to those (if any) specified by EPA to establishequivalency. The depth of review of the calculations was dictated by the reviewer’s confidence in theability and conscientiousness of the tester, which in turn was based on factors such as consistency ofresults and completeness of other areas of the test report.
4.1 AP-42
For this study, average emission factors were not taken from the four previous AP-42 sections(plywood, OSB, MDF, and particleboard). Rather, the emission and process data from the individualtests were retrieved from the background reports to allow averaging with the new data (from the 99 newemission test reports and NCASI). The data from the previous AP-42 background reports had alreadyundergone a thorough EPA review and rating process and were ready to be incorporated with the newdata. The review and rating process for AP-42 is described in detail in the EPA manual, Procedures forPreparing Emission Factor Documents.119
Due to the large quantity of data in the previous AP-42 background reports, the additionalemission test reports, and the NCASI database, and the understanding that the additional data wouldgenerally be higher A- and B-rated data, all C- and D-rated data from the previous AP-42 backgroundreports were discarded. The discarded data include emission factors in incompatible units, data based onmeasurements with unspecified test methods, and data where process operations were not clearly defined.
4.2 Emission Test Reports
The review of the 99 new emission test reports consisted primarily of quality assurance andquality control (QA/QC) review of the emissions calculations, extraction of process information, andassigning of a quality rating like that done for AP-42. It is important to note that this review did notinclude an in-depth look at field and laboratory procedures to evaluate the degree to which prescribedmethods were followed. For purposes of this review, it was assumed that testing contractors andanalytical laboratories followed the procedures of the methods that have been indicated in the testreports. However, attention was given to discussions of any problems or unusual circumstancesencountered during the testing. The EMC was asked to review a list of the emissions sources andemissions test methods cited in these reports to ensure that the proper methods were selected. Theapproach used to review and extract data from the emission test reports is discussed below, and is alsopresented in a separate memorandum.120
The QA/QC review of the additional emission test reports involved retrieving run-specific stackparameters, pollutant concentrations, and production rates from the emission test reports and entering theraw data into a series of spreadsheets to recalculate stack gas standard flow rates, mass emission rates ofpollutants in units of pounds per hour (lb/hr), and emission factors in units of pounds of pollutant perprocess rate unit (for example, pounds of pollutant per oven-dried ton of wood). Reports that lacked rawdata sheets or other significant supporting data to allow recalculation of mass emission rates (summaryreports) were generally not reviewed and, consequently, were not used for emission factor development.
4.0 Review of Emission Data
4-3
For test runs with pollutant concentrations below the method detection limit (MDL), a value equal to halfof the MDL was entered and clearly noted in the spreadsheets.
Emissions data for all pollutants (HAP and non-HAP) in the test reports were included in thereview. Data collected with EPA Method 25A were tabulated as THC on a carbon basis. Where THCconcentrations were provided as parts per million by volume (ppmv) as propane, the values weremultiplied by a factor of 3 to obtain ppmv as carbon. No adjustments were made to individual datapoints for non-VOC compounds, such as methane, acetone, and methylene chloride. No adjustmentswere made to individual data points for compounds with reduced response rates to the flame ionizationdetector (FID), such as oxygenated compounds, including formaldehyde. The adjusted VOC emissionfactors were calculated from average emission factors, as described above in Section 3.2.1. There are noEPA Method 25 runs in the test reports submitted.
Particulate matter (PM) emissions data were tabulated as filterable PM, filterable PM-10, orcondensible PM, as appropriate. Recalculation of PM mass emission rates began with raw catch weightsin grams.
All other pollutants were reported on an “as pollutant” basis. Recalculation of mass emissionrates generally began with dry ppmv. Where wet ppmv were provided, these units were first converted todry ppmv (the equation for this conversion is presented in Attachment 3). In the case of CO2, thecalculation began with percent CO2 in the exhaust stream.
After the data were entered into the spreadsheets, a QA/QC check was performed on thespreadsheets. This check included identifying data entry errors, as well as identifying data that appearedto be out of the typical ranges. During the QA/QC check, individual wood products mills were contactedto clarify information contained in the test reports and/or to obtain additional information (e.g., processrates to allow calculation of emission factors). The spreadsheets subsequently were updated to includeany clarifications and new information provided by the mills.
In addition to the stack parameters, process rates, and other data required for the QA/QC review,additional process information was extracted to aid in analyzing the emissions data. These processparameters were entered into a second set of columns to the right of the QA/QC columns in the reviewspreadsheets. A number of process parameters were tabulated for each source type. Because differentparameters were desired for different source types, and to make data entry and analysis easier, separatespreadsheets were created for the eight general source types for which emission test reports weresubmitted: hot presses; board coolers; rotary dryers; tube dryers; veneer dryers; conveyor dryers;hardboard/fiberboard kilns, ovens, and dryers; and miscellaneous sources.
In some cases, plant-specific data from responses to the EPA’s 1998 MACT survey of theplywood and composite wood products industry were used to fill gaps in the process data. However, theonly survey response data used were for process parameters that are relatively constant, such as presssize, dryer type, resin type and dryer firing method. Process data that vary greatly over time (e.g.,equipment throughput) were not pulled from the survey responses, nor was confidential businessinformation (CBI) used to fill data gaps.
Data ratings were assigned to the individual emission test data based on EFIG guidance. Asummary of the rating structure is presented previously in this section. Generally, the data from the testreports were assigned A ratings if they were based on 3 or more emission test runs. If the test included

4.0 Review of Emission Data
4-4
only 2 runs, the data were rated B. If the test included only 1 run, the data were further downrated to C. The emission data were also downrated if the test report noted any conditions that may have adverselyimpacted the validity of the test data.
4.3 NCASI Data
The NCASI provided EPA with an electronic data base of the run-by-run emission test datasummarized in technical bulletins 768 through 774. The run-by-run data in the data base were in units ofconcentration (ppm) and mass rate (lb/hr and lb/unit operation throughput). The method detection limit(MDL) was included in the data base for test runs that were non-detect (i.e., below the MDL, or “BDL”). These run-by-run data were extracted from the NCASI data base.
Due to the extensive data review process within NCASI, review of the NCASI data was lessstringent than that for the emission test reports submitted with survey responses. Pollutantconcentrations and mass emission rates were not recalculated as for the 99 emission test reports. Reviewof the NCASI data essentially consisted of recalculating average emission factors from the individual rundata for each emission source and assigning a data rating. However, attention was also given todiscussions in the technical bulletins of any difficulties or unusual circumstances encountered during thetest program.
Generally, the NCASI data were assigned A ratings if they were based on 3 or more emission testruns. If the test included only 2 runs, the data were rated B. If the test included only 1 run, the data werefurther downrated to C. The emission data were also downrated if any conditions were noted which mayhave adversely impacted the validity of the test data.
The most significant adjustment made to the NCASI data was the recalculation of emissionfactors incorporating “non-detect” test runs. In general, when calculating emission factors, NCASItreated non-detects as “zero.” While there are no set rules for handling non-detect data, the methodologyused by EPA when developing emission factors for AP-42 is to assign a value of one-half of the MDL fornon-detect runs. This same methodology was applied for the data from the emission test reports. Thus,for consistency with the data extracted from the previous AP-42 background reports and the emission testreports, non-detect runs were reassigned a value of one-half the MDL when recalculating the averageNCASI emission factors. A detailed discussion of the treatment of non-detect data by NCASI and byEPA is presented in a separate memorandum.121
Once the run-by-run data were extracted from the NCASI data base and averaged, the averages(where no non-detect runs were involved) were compared with the values calculated by NCASI, asreported in the technical bulletins. Only those emission factors not including BDL data could becompared in this manner. For sources with multiple vents, emissions from the vents must be summed inorder to determine total emissions from the source. The approach to summing emissions for sources withmultiple vents was compared with the approach taken by NCASI, using the technical bulletins as a guide. Process data for each unit operation was provided in the technical bulletins.
5.0 Emission Factor Calculations
5-1
5.0 Emission Factor Calculations5.1 General Approach
First, emission test data (typically averages of three-run tests) from the previous AP-42background reports, the MACT survey test reports, and the NCASI database were combined in aspreadsheet. Next, the test data were grouped by product, pollutant, source type, and APCD. Otherparameters that could significantly impact emissions also were used to group the data when appropriate. Once grouped, the test data were used to calculate average emission factors.
5.2 Grouping of Emission Data
The emission data were sorted into several groups. Grouping by pollutant, wood product, andgeneral source type (e.g., tube dryer, veneer dryer) was straightforward. However, some interpretation ofthe data was necessary for deciding how to group the data by APCD and how to further group theemission data within source types (e.g., segregate plywood veneer dryer data by firing method).
5.2.1 Grouping by Air Pollution Control Device
Primary cyclones installed for product recovery are not considered APCDs. Instead, they areconsidered to be process equipment because they are a necessary part of the production process; withoutthem, the primary raw material would be lost and the manufacturing process could not continue. Emissions test data collected at the outlet of primary cyclones are considered to be uncontrolled for allpollutants including filterable PM, condensible PM, and PM-10.
Based on a review of the control efficiency data, APCDs installed for PM abatement wereconsidered to have no effect on gaseous emissions, such as THC, CO, CO2, NOx, and gaseous HAP. These APCDs include cyclones, multiclones, baghouses, and EFBs. As a result, emission test data forsources with PM controls were averaged with the uncontrolled emission test data for all pollutants exceptfilterable PM, condensible PM, and PM-10.
Wet electrostatic precipitators and wet scrubbers installed for PM control also were consideredto have no effect on gaseous emissions. These wet systems may achieve short-term reductions in THC orgaseous HAP emissions. However, the HAP and THC control efficiency data, which range from slightlypositive to negative values, indicate that the ability of these wet systems to absorb water-solublecompounds (such as formaldehyde) diminishes as the recirculating scrubbing liquid becomes saturatedwith these compounds. Thus, as for the other PM controls, test data for WESPs and wet scrubbers wereaveraged with uncontrolled test data for all pollutants except filterable PM, condensible PM, and PM-10.
One wet scrubbing system, a combination water tray tower/high energy venturi scrubber that usestreated water and is designed to minimize emissions of both PM and odorous compounds from ahardboard press, did achieve notable HAP and THC emissions reductions. This system reducedformaldehyde and methanol emissions by 65 percent and 50 percent, respectively, and reduced THCemissions by 86 percent.113 Separate emission factors were developed for the outlet of this scrubber.

5.0 Emission Factor Calculations
5-2
Data were available for several control technologies that achieve significant THC and HAPremoval. Most of these technologies are incineration-based, including thermal oxidizers, RTOs, RCOs,and exhaust gas recirculation systems. Data were also available for biofiltration systems. Separateemission factors were developed for sources with outlet data for each of these control devices.
5.2.2 Grouping Within Source Types
There are several operating and design parameters which may affect emissions from dryers,presses, and other wood products emission sources. For example, dryer emissions may be affected bywood furnish characteristics (e.g., wood species, age, season), heat source, fuel, temperature, percentfines, resin addition, etc. Press emissions may be affected by type and amount of resin applied, woodspecies, moisture content, cycle time, temperature, addition of catalysts and scavengers, etc. Lists of theparameters EPA attempted to collect for each emission source type are included in the memorandumdescribing the emission test report review process.120 It is not practical to consider all of theseparameters for emission factor development because the data set becomes smaller each time a distinctionis made. Also, in many cases, the source-to-source variability was greater than the variability associatedwith operating parameters.
Some parameters affect emissions more than others. Furthermore, a parameter that increasesemissions of one pollutant may simultaneously decrease emissions of another pollutant. Therefore, carewas taken to select the parameters that may have the most significant effect on HAP emissions whendeciding how to further group emission data within emission source types. Discussions of groupingaccording to source parameters in the NCASI technical bulletins were reviewed in making decisions onhow to group the emission data. In addition, the grouping schemes used in the previous edition of AP-42were also considered because these schemes were reviewed by industry representatives when the AP-42sections were developed.
Dryers within each industry sector were generally differentiated by firing type, fuel type, andwood species. For MDF and hardboard tube dryers, further distinctions were made for blowline versusnon-blowline blending, resin type, and for secondary (relay) dryers. For hardboard and fiberboard boarddryers, distinctions were made for differing binder systems. Hot presses within each industry sector weredifferentiated by resin type only. For the remaining sources, distinctions were made as warranted by thedata.
For particleboard and MDF rotary dryers, a distinction was made between predryers or “green”dryers and “dry” dryers, based on furnish moisture content. Wood moisture content can be expressed onan oven-dry (or dry) basis or on a wet basis. In the plywood and composite wood products industry,percent moisture content is commonly expressed as percent moisture content on a dry basis. The dry-basis moisture content is determined by weighing a sample of wood before and after oven-drying andthen calculating the moisture content based on the weight before and after drying. Moisture content on adry basis is calculated by the following equation:
% Moisture Content (dry basis) =weight of water in wood
× 100weight of oven-dry wood
Alternately, wood moisture content may be expressed on a wet basis. The procedure for determiningwet-basis moisture content involves the same weighing and drying of a wood sample as for the dry-basis

5.0 Emission Factor Calculations
5-3
determination; however, the calculation of the wet-basis value uses the wet weight of the wood, insteadof the dry weight of the wood, as the denominator. Moisture content on a wet basis is calculated by thefollowing equation:
% Moisture Content (wet basis) =weight of water in wood
× 100weight of wet wood
In general, dryers that dried furnish with a moisture content of greater than 50 percent (dry basis) wereconsidered green dryers. Dryers that dried furnish with a moisture content less than 50 percent (drybasis) were considered dry dryers. There were a few instances in which dryers that were used to dryfurnish with a reported moisture content just below the 50 percent threshold were included with the greendryers because the plant considered them to be green dryers or predryers.
In cases where one species (or group of species, e.g., softwoods) accounted for 70 percent ormore of the wood mix processed by a given process unit, the process unit was categorized by thatspecies. For example, if a dryer processed 70 percent pines and 30 percent mixed hardwoods, the dryerwas grouped with softwood dryers. If the dryer processed 40 percent softwood and 60 percent hardwood,the dryer was grouped with mixed wood species dryers.
Where emission factors for mixed hardwood and softwood species have been calculated, thewood species mix has been specified. Emission factors for other mixes of hardwood and softwoodspecies may be calculated by combining the emission factors for hardwoods and softwoods in the ratiospecific to a given application. For example, an uncontrolled THC emission factor for a direct wood-fired OSB rotary dryer processing 70 percent softwood and 30 percent hardwood may be calculated usingthe uncontrolled THC emission factor for softwood (6.7 lb/ODT) and hardwood (1.7 lb/ODT), and theratio of 70 percent to 30 percent. The resultant emission factor, rounded to two significant figures,would be 5.2 lb/ODT.
5.3 Calculating Emission Factors
Once the emission data were grouped according to pollutant, APCD, and source type, they werethen averaged to develop average emission factors. The data available for some of the emission factorsdeveloped included the results of multiple tests on the same piece of equipment. In such cases, the test-specific emission factors for the same piece of equipment were averaged first, and that average emissionfactor then was averaged with the factors for the other pieces of equipment to yield the overall averageemission factor. The averaging of multiple tests on the same piece of equipment was more often an issuefor criteria pollutants; it occurred much less frequently for HAP compounds.
The number of non-detect test runs for each emission data point were considered before theywere subsequently averaged into emission factors. If all of the test data for a source were based on non-detect test runs, then no emission factor was developed and a “BDL” code was substituted for thenumeric emission factor. If some of the data were non-detect and some were above the MDL, thenvalues of one-half of the MDL were averaged into the emission factors for the non-detect test runs.
Some tests have higher MDLs than others in the same data set. This can lead to situations whereusing half of a high MDL will bias the average high. If the half-MDL value for a non-detect test is higherthan all detect values for the other tests in the data set, the non-detect test is discarded. If the half-MDL
5.0 Emission Factor Calculations
5-4
values are less than detect values, they are included in the average. Attachment 2 is a table with anexample calculation to illustrate how the average emission factors were calculated from the individualdata points.
5.4 Emission Factor Ratings
The quality of the emission factors developed from analysis of the test data was rated using thefollowing general criteria:
A – Excellent: Developed from A- and B-rated source test data taken from many randomlychosen facilities in the industry population. The source category is specific enough so that variabilitywithin the source category population may be minimized.
B – Above average: Developed only from A- or B-rated test data from a reasonable number offacilities. Although no specific bias is evident, it is not clear if the facilities tested represent a randomsample of the industries. The source category is specific enough so that variability within the sourcecategory population may be minimized.
C – Average: Developed only from A-, B- and/or C-rated test data from a reasonable number offacilities. Although no specific bias is evident, it is not clear if the facilities tested represent a randomsample of the industry. In addition, the source category is specific enough so that variability within thesource category population may be minimized.
D – Below average: The emission factor was developed only from A-, B-, and/or C-rated testdata from a small number of facilities, and there is reason to suspect that these facilities do not representa random sample of the industry. There also may be evidence of variability within the source categorypopulation. Limitations on the use of the emission factor are noted in the emission factor table.
E – Poor: The emission factor was developed from C- and D-rated test data, and there is reasonto suspect that the facilities tested do not represent a random sample of the industry. There also may beevidence of variability within the source category population. Limitations on the use of these factors arefootnoted.
U – Unrated: For two of the revised AP-42 sections (plywood and OSB) some of the emissionfactors are based on one test conducted at one facility with either a source/control device configuration,or process operating parameters that are specific to that facility and may not be representative of anyother facilities; those emission factors are unrated and are indicated with an emission factor rating of U.
The use of these criteria is somewhat subjective and depends to an extent upon the individualreviewer.
The ratings assigned to the average emission factors are largely a function of the data ratingsassigned to the individual data sets and the number of data sets upon which the average emission factorsare based. Generally, C- and D-rated data were discarded and were not used in the determination ofaverage emission factors. However, C-rated data were used if the data were downrated only because theywere 1-run data. Average emission factors based on a single data set were rated E. For factors based onmultiple data sets, the ratings were based primarily on the number of data sets. In general, the averageemission factors were rated D, if based on less than 10 data sets, emission factors based on 10 to 19 data

5.0 Emission Factor Calculations
5-5
sets were rated C, and factors based on 20 or more data sets were rated B. No emission factors wereassigned an A rating.
The VOC-as-propane emission factors were assigned ratings one rating below the correspondingTHC-as-carbon emission factor rating (unless both were rated E). Emission factors based solely onM0011 data for compounds other than formaldehyde, acetaldehyde, and propionaldehyde weredownrated (unless they were already rated E) because M0011 has not been validated for these othercompounds and the results are likely to be biased low.
5.0 Emission Factor Calculations
5-6
This page intentionally left blank.

6.0 References
6-1
6.0 References1. Compilation of Air Pollutant Emission Factors, Volume I: Stationary Point and Area Sources,
U.S. Environmental Protection Agency, Research Triangle Park, NC, 1995.
2. Emission Factor Documentation for AP-42 Section 10.5, Plywood Manufacturing, U. S.Environmental Protection Agency, Research Triangle Park, NC, September 1997.
3. Emission Factor Documentation for AP-42 Section 10.6.1, Waferboard/Oriented StrandboardManufacturing, prepared for the U. S. Environmental Protection Agency, OAQPS/EFIG, byMidwest Research Institute, Cary, NC, December 1998.
4. Emission Factor Documentation for AP-42 Section 10.6.2, Particleboard Manufacturing,prepared for the U. S. Environmental Protection Agency, OAQPS/EFIG, by Midwest ResearchInstitute, Cary, NC, September 1998.
5. Emission Factor Documentation for AP-42 Section 10.6.3, Medium Density FiberboardManufacturing, prepared for the U. S. Environmental Protection Agency, OAQPS/EFIG, byMidwest Research Institute, Cary, NC, September 1998.
6. A Study of Organic Compound Emissions from Veneer Dryers and Means for Their Control,Technical Bulletin No. 405, National Council of the Paper Industry for Air and StreamImprovement, Inc., New York, NY, August 1983.
7. Oriented Strandboard and Plywood Air Emission Databases, Technical Bulletin No. 694,National Council of the Paper Industry for Air and Stream Improvement, Inc., New York, NY,April 1995.
8. Particleboard and Medium Density Fiberboard Air Emission Databases, Technical Bulletin No.693, National Council of the Paper Industry for Air and Stream Improvement, Inc., New York,NY, April 1995.
9. Results of a Series of Source Emission Tests on the OSB Core Wafer Dryer Exhaust and theBoard Press Hood Exhaust at Northwood Panelboard Co., Solway, Minnesota, October 9-10,1997, prepared for Northwood Panelboard Company, by MMT Environmental Services, Inc.,MMT Report No. 10257, November 18, 1997.
10. Results of a Series of Source Emission Compliance Tests (TSP, PM10, VOC, CO, NOx,Formaldehyde and Opacity) on the OSB Wafer Dryer at Northwood Panelboard Co., Solway,Minnesota, February 28 - March 2, 1997, prepared for Northwood Panelboard Company, byMMT Environmental Services, Inc., MMT Report No. 10235, March 21, 1997.
6.0 References
6-2
11. Volatile Organic Compound Destruction Efficiency Testing of the Regenerative CatalyticOxidizer at the ABTCo. Facility in Alpena, Michigan, Test Dates November 24-25, 1998,prepared for Durr Environmental, Inc., by Clayton Environmental Consultants, Inc., ClaytonProject No. 13-99342.00, December 14, 1998.
12. Emission Studies on Boiler No. 1, 2 and 3 Located at the ABTCo Facility Alpena, Michigan, TestDates December 9-11, 1998, prepared for ABTCo, Inc., by NTH Consultants, Ltd., February 1,1999.
13. Source Emission Test Report, Dryer and Press Exhausts, Allegheny MDF Limited Partnership,Mt. Jewett, Pennsylvania, Test Dates October 22-24 and December 17, 1997, prepared forAllegheny MDF Limited Partnership, by Galson Measurements, Galson Project No. 975540,December 3, 1997.
14. Emissions Test Report, Boise Cascade Corporation, Island City, Oregon, Green Furnish Dryer,March 10 & 11, 1998, prepared for Boise Cascade Corporation, by BWR Associates, Inc.,Project No. 98-042D, 1998.
15. Title V Emissions Test Report, PM10, Particulate Matter, Condensible Particulate Matter,Aldehydes/Ketones, Phenols, Methanol, Oxygen, Carbon Dioxide, Carbon Monoxide, NitrogenOxides, and Cold Total Hydrocarbons from Process Stacks, Georgia Pacific HardboardManufacturing Plant, North Little Rock, Arkansas, Test Dates September 26-29, 1995, preparedfor CH2M Hill and Georgia Pacific Corporation, by DEECO, Inc., Report No. 95-1200-A,October 27, 1995.
16. Engineering Emissions Testing Performed on the Core Dryer and Face Dryer Cyclone ExhaustStacks, Georgia Pacific, Vienna, Georgia, Test Dates: March 1-2, 1995, prepared for GeorgiaPacific Corporation, by Air Techniques, Inc., ATI Job No. 95T03991, 1995.
17. Title V Emissions Testing on the Furnish Dryer Exhaust, Georgia Pacific Corporation,Panelboard Plant, Monticello, Georgia, February 13, 1996, prepared for CH2M Hill, byAnalytical Testing Consultants, Inc., Report No. 5743, March 13, 1996.
18. Emission Test Results for Formaldehyde from the Primary and Secondary Stacks of Dryer 1 andDryer 2, Georgia Pacific Fiber Board Plant, Holly Hill, South Carolina, Test Dates May 31 toJune 1, 1995, prepared for Georgia Pacific Corporation, by DEECO, Inc., Report No. 062895-1235, June 28, 1995.
19. Results of the January 17-19, 1995 Source Emission Tests on the Dryer Stack, Dump Stack andHumidification Kiln Stack at the Georgia Pacific Facility Located in Phillips, Wisconsin,prepared for CH2M Hill, by PACE, Inc., Project No. 941228.401, March 2, 1995.
20. Summary of Test Results, May 11, 1995 Testing, Georgia Pacific, Phillips, Wisconsin, preparedfor CH2M Hill, by PACE, Inc., Project No. 941228.401, May 18, 1995.
21. Results of the September 27-29, 1995 Emission Tests on the Fluidized Bed Boiler Dump Stackand Flash Tube Dryer Stack at the Georgia Pacific Facility Located in Phillips, Wisconsin,

6.0 References
6-3
prepared for Georgia Pacific Corporation, by PACE, Inc., Project No. 950828.401, November 7,1995.
22. Summary of Test Results, March 23-24, 1995 Testing, Georgia Pacific, Phillips, Wisconsin,prepared for CH2M Hill and Georgia Pacific Corporation, by PACE, Inc., April 12, 1995.
23. Stationary Source Sampling Report for Georgia Pacific Corporation, Mt. Hope, West Virginia,Wellons Energy Unit, Press Vent, Test Dates August 7-8, 1996, prepared for Georgia PacificCorporation, by Trigon Engineering Consultants, Inc., Project No. 047-96-004, August 1996.
24. Compliance VOC and Formaldehyde Emissions Testing Performed on the Press Vent RTOSystem at Masonite Corporation, Cordele, Georgia, Test Date February 23, 1995, prepared forMasonite Corporation, by Air Techniques, Inc., ATI Job No. 94T03968, 1995.
25. Engineering VOC and Formaldehyde Emissions Testing Performed on the Press Vent RTOSystem Inlet at Masonite Corporation, Cordele, Georgia, Test Date March 31, 1995, preparedfor Masonite Corporation, by Air Techniques, Inc., ATI Job No. 95T04069, 1995.
26. Formaldehdye and VOC Emissions Testing Performed at Masonite Corporation, Cordele,Georgia, Test Date April 18, 1996, prepared for Masonite Corporation, by Air Techniques, Inc.,ATI Job No. 96T04537, 1996.
27. Formaldehdye and VOC Emissions Testing Performed at Masonite Corporation, Cordele,Georgia, Test Date May 9, 1996, prepared for Masonite Corporation, by Air Techniques, Inc.,ATI Job No. 96T04585, 1996.
28. Formaldehdye and VOC Emissions Testing Performed at Masonite Corporation, Cordele,Georgia, Test Date June 5, 1996, prepared for Masonite Corporation, by Air Techniques, Inc.,ATI Job No. 96T04609, 1996.
29. WESP Emission Test Report, Masonite Corporation, Cordele, Georgia, Test Date September 11,1997, prepared for Masonite Corporation, by Roy F. Weston, Inc., Work Order No. 10414-004-001, October 7, 1997.
30. Report of Particulate/VOC and Formaldehyde Emissions Tests for Masonite Corporation, LinesI and II Press Vents, Laurel, Mississippi, Test Dates March 10-11, 1998, prepared for MasoniteCorporation, by Environmental Monitoring Laboratories, March 27, 1998.
31. Stationary Source Sampling Report, Reference No. 14337, International Paper, Stuart, Virginia,Emissions Testing for Carbon Monoxide, Formaldehyde, Nitrogen Oxides, Particulate, TotalHydrocarbons, Dryer No. 1 Stacks A and B, Boiler, Test Dates June 13-15, 1995, prepared forInternational Paper, by Entropy, Inc., June 1995.
32. Emission Test Report Particleboard Press and No. 2 Rotary Dryer (MEC Dryer with Wood-Fired Burner) Emissions Testing, International Paper, Decorative Products Division, Stuart,Virginia, Test Dates June 8-10, 1998, prepared for International Paper Decorative ProductsDivision, by Roy F. Weston, Inc., Work Order No. 00157-045-002, June 1998.

6.0 References
6-4
33. Report of Air Emissions Tests for Louisiana-Pacific Corporation Clayton MDF Plant, Test DatesAugust 22-23, 1995, prepared for Louisiana-Pacific Corporation, by Environmental MonitoringLaboratories, Inc., September 13, 1995.
34. Report of Particulate/CO/VE/NOx/VOC Emissions Tests for Louisiana-Pacific CorporationClayton MDF Plant Nos. 1 and 2 Wood Waste Boilers, Test Dates June 26-27, 1997, preparedfor Louisiana-Pacific Corporation, by Environmental Monitoring Laboratories, Inc., July 18,1997.
35. Source Test Report: Preliminary Compliance Test of a Regenerative Thermal Oxidizer atLouisiana-Pacific Corporation Oroville, California, Test Dates November 12-13, 1996, preparedfor Louisiana-Pacific Corporation, by Normandeau Associates, Inc., Project No. 16802.000,1996.
36. Butte County Air Quality Management District Compliance Source Test Report for Louisiana-Pacific Corporation Merlo Avenue Facility (Oroville), Regenerative Thermal Oxidizer, TestDates May 5-7, 1998, prepared for Louisiana-Pacific Corporation, by Aeros Environmental, Inc.,Project No. 217-1190, June 16, 1998.
37. Butte County Air Quality Management District Compliance Source Test Report for Louisiana-Pacific Corporation Merlo Avenue Facility (Oroville), Regenerative Thermal Oxidizer, TestDates July 29-31, 1997, prepared for Louisiana-Pacific Corporation, by Aeros Environmental,Inc., Project No. 217-928, September 10, 1997.
38. Source Test Report: Emissions Compliance Test of a Regenerative Thermal Oxidizer atLouisiana-Pacific Corporation Oroville, California, Test Dates December 18-19, 1996, preparedfor Louisiana-Pacific Corporation, by Normandeau Associates, Inc., Project No. 16802.002,1996.
39. Source Test Report: Source Testing of Various Process Emissions at Louisiana-PacificCorporation Oroville, California, Test Dates July 31 - August 4, 1995, prepared for Louisiana-Pacific Corporation, by Normandeau Associates, Inc., Project No. 15747.000, September 7,1995.
40. Source Test Report: Particulate Matter Emissions from Line 1 Filter Box at Louisiana-PacificCorporation Oroville, California, Test Date August 16, 1996, prepared for Louisiana-PacificCorporation, by Normandeau Associates, Inc., Project No. 16605.000, 1996.
41. Results of the November 14-17, 1995 Air Emission Compliance Tests at the Louisiana-PacificWaferboard Plant in Missoula, Montana, prepared for Louisiana-Pacific Corporation, byInterpoll Laboratories, Inc., Report No. 5-6833, December 27, 1995.
42. Report of Air Emissions Tests for Louisiana-Pacific Corporation Silsbee Particleboard FacilityPress Vent Baghouse, Test Date September 25, 1997, prepared for Louisiana-PacificCorporation, by Environmental Monitoring Laboratories, Inc., October 17, 1997.

6.0 References
6-5
43. Report of Air Emissions Tests for Louisiana-Pacific Corporation Silsbee Particleboard FacilityCore and Face Dryer Cyclones, Test Date September 23, 1997, prepared for Louisiana-PacificCorporation, by Environmental Monitoring Laboratories, Inc., October 18, 1997.
44. Report of Formaldehyde/CO/NOx Emissions Tests for Louisiana-Pacific Corporation SilsbeeParticleboard Facility Core and Face Dryer Cyclones, Test Date September 23, 1997, preparedfor Louisiana-Pacific Corporation, by Environmental Monitoring Laboratories, Inc., October 18,1997.
45. Emission Test Report, MDI Emission Testing, Batch Press Vent, Louisiana-Pacific, Tomahawk,Wisconsin, Test Dates August 25-26, 1997, prepared for ICI Polyurethanes Group, by Roy F.Weston, Inc., Work Order No. 11251-004-001, November 10, 1997.
46. Report for PM-10 Emission Measurements from the Press Vents, SierraPine, Ltd., Rocklin,California, Test Dates May 17-19, 1995, prepared for SierraPine, Ltd., by Carnot,December 1995.
47. Report for 1995 VOC Emission Compliance Tests at the Press Vents, SierraPine, Ltd., Rocklin,California, Test Date August 21, 1995, prepared for SierraPine, Ltd., by Carnot, August 1995.
48. Report for 1995 VOC Emission Compliance Tests at the Wood Fiber Dryers and Press Vents,SierraPine, Ltd., Rocklin, California, Test Dates April 10-13, 1995 and May 17-19, 1995,prepared for SierraPine, Ltd., by Carnot, May 1995.
49. Final Report for 1998 Emission Compliance Tests SierraPine, Ltd., Rocklin, California, TestDates August 12-20, 1998, prepared for SierraPine, Ltd., by The Avogadro Group, October 27,1998.
50. Report for PM-10 Emission Measurements from the Wood Fiber Dryers, SierraPine, Ltd.,Rocklin, California, Test Dates April 10-13, 1995, prepared for SierraPine, Ltd., by Carnot,April 1995.
51. Report for 1996 PM-10 Emission Measurements for Emission Reduction Credits, SierraPine,Ltd., Rocklin, California, Test Dates November 19-26, 1996, prepared for SierraPine, Ltd., byCarnot, April 1997.
52. Results of 1996 Emission Testing of the Regenerative Thermal Oxidizer System at SierraPine,Ltd., Rocklin, California, Test Dates November 19 and 25, 1996, prepared for SierraPine, Ltd.,by Carnot, December 1996.
53. Engineering Emissions Testing for Particulate Performed on the #1 & 3 Dryer Cyclone Exhaustsand Engineering Emissions Testing for Methanol Performed on the Press Vents at Temple InlandCorporation, Monroeville, Alabama, Test Dates February 10-14, 1997, prepared for TempleInland, by Air Techniques, Inc., ATI Job No. 97TO4908, 1997.
54. In-House Air Emissions Testing of Primary Dryer Outlet, Hope Particleboard Plant, Hope,Arkansas, Test Dates January 29-31, 1997, prepared for Temple-Inland Forest ProductsCorporation, by Maxim Technologies, Inc., Project No. 1411700875A, March 14, 1997.

6.0 References
6-6
55. In-House Air Emissions Testing of Primary Dryer Outlet and RTO Press Vent Inlet, HopeParticleboard Plant, Hope, Arkansas, Test Dates February 12-14, 1997, prepared for Temple-Inland Forest Products Corporation, by Maxim Technologies, Inc., Project No.1411700875B,March 17, 1997.
56. RTO Outlet Emission Test Report, Temple-Inland Forest Products Corporation, Thomson,Georgia, Test Dates April 21-22, 1998, prepared for Temple-Inland Forest Products Corporation,by Roy F. Weston, Inc., Work Order No. 06598-010-002, May 11, 1998.
57. Lumber Kiln Emissions Testing, Diboll and Buna, Texas, Test Dates January 20-23, 1998(Diboll) and January 26-29, 1998 (Buna), prepared for Temple-Inland Forest ProductsCorporation, by Roy F. Weston, Inc., Work Order No. 06598-011-001, April 1, 1998.
58. In-House Air Emissions Testing of the Diboll Particleboard Plant, Diboll, Texas, Test DatesOctober 8-9 and 15, 1997, prepared for Temple-Inland Forest Products Corporation, by MaximTechnologies, Inc., Project No. 9711254A, January 12, 1998.
59. Volatile Organic Compound Sampling and Analysis of Adel’s Full Scale Biofilter, Test DatesFebruary 1, 1996 to May 14, 1996, prepared for Weyerhaeuser, by Weyerhaeuser, Project No.721-9569, June 1996.
60. Volatile Organic Compound and Formaldehyde Sampling of Adel’s Biofilter, Test Dates June 18,1996 to December 23, 1996, prepared for Weyerhaeuser, by Weyerhaeuser, Project No. 721-3086.
61. Weyerhaeuser Company–Adel, Georgia Particleboard Press Vent VOC and HAP Testing, TestDates March 6-18, 1995, prepared for Weyerhaeuser, by Weyerhaeuser, Project No. 721-9520,September 1995.
62. Source Test Report, Weyerhaeuser Corporation, Adel, Georgia Biofilter Inlet/Outlet Particulate,Test Date September 10, 1996, prepared for Weyerhaeuser, by Technical Services, Inc., September 1996.
63. Source Test Report, Biofilter VOC Emissions Reduction, Weyerhaeuser Corporation, Adel,Georgia, Test Date September 10, 1996, prepared for Weyerhaeuser, by Technical Services, Inc.,September 1996.
64. Source Test Report, Weyerhaeuser Corporation, Adel, Georgia, Biofilter Inlet/OutletFormaldehyde, Test Date September 11, 1996, prepared for Weyerhaeuser, by TechnicalServices, Inc., September 1996.
65. Test Report Determination of Formaldehyde, Methanol, Particulate and Carbon MonoxideEmissions, Press Biofilter, Weyerhaeuser Structurwood, Grayling, Michigan, Test DatesDecember 11-12, 1996, prepared for Weyerhaeuser Structurwood, by Earth Tech, Inc.,January 1997.
6.0 References
6-7
66. Stationary Source Sampling Report Reference No. 0301, Weyerhaeuser Company, Moncure,North Carolina, Dry ESP Inlet and Stack, Test Dates March 17-18, 1997, prepared forWeyerhaeuser Company, by Environmental Technical Group, Inc., April 16, 1997.
67. Stationary Source Sampling Report Reference No. 0097, Weyerhaeuser Company, Moncure,North Carolina, Wood Boiler Multiclone Inlet and Outlet, Test Dates July 25-27, 1995, preparedfor Weyerhaeuser Company, by Environmental Technical Group, Inc., September 22, 1995.
68. Formaldehyde Methods Comparison, NCASI Acetylacetone Method vs. EPA Method 0011,Weyerhaeuser Company, Springfield, Oregon, MEC #3 Rotary Particle Dryer, Test DatesFebruary 27-28, 1996, prepared for Weyerhaeuser Company, by BWR Associates, Inc., 1996.
69. Weyerhaeuser Company–Marshfield, Wisconsin, Steam-Thru Door Core Plant Press Vents, VOCCompliance Testing 1998.3, Test Dates August 6-7, 1998, prepared for Weyerhaeuser Company,by Weyerhaeuser Company, Project No. 721-9850, September 15, 1998.
70. Weyerhaeuser Company–Marshfield, Wisconsin, Formaldehyde Emissions Variability Study,Press Area Common Stack, Test Dates April 1, 1998 to June 30, 1998, prepared forWeyerhaeuser Company, by Weyerhaeuser Company, Project No. 721-9753, 1998.
71. Weyerhaeuser Company–Marshfield, Wisconsin, Steam-Thru Door Core Press Vent Testing1995.3, Test Dates August 25, 1995, prepared for Weyerhaeuser Company, by WeyerhaeuserCompany, Project No. 721-9547, January 8, 1997.
72. Weyerhaeuser Company–Marshfield, Wisconsin, Door Core Dryer, Particulate Compliance1996.4, Test Date October 19, 1996, prepared for Weyerhaeuser Company, by WeyerhaeuserCompany, Project No. 721-9640, December 12, 1996.
73. Weyerhaeuser Company–Marshfield, Wisconsin, Steam Muffler Vent, Formaldehyde and VOCTest Method Study 1998.3, Test Dates August 6-7, 1998, and July 25, 1997, prepared forWeyerhaeuser Company, by Weyerhaeuser Company, Project No. 721-9850, September 29,1998.
74. Weyerhaeuser Company–Marshfield, Wisconsin, Steam-Thru Door Core Dryer and PressTesting, Formaldehyde Air Emissions 1996.4, Test Dates October 19 and 21, 1996, prepared forWeyerhaeuser Company, by Weyerhaeuser Company, Project No. 721-9640, December 30,1996.
75. Weyerhaeuser Company–Marshfield, Wisconsin, Steam-Press Testing, Formaldehyde AirEmissions 1997.3, Test Date July 25, 1997, prepared for Weyerhaeuser Company, byWeyerhaeuser Company, Project No. 721-9741, 1997.
76. Weyerhaeuser Company–Marshfield, Wisconsin, Door Core Press Scavenger Trials, Press VentFormaldehyde Air Emissions 1997.3, Test Dates July 21-24, 1997, prepared for WeyerhaeuserCompany, by Weyerhaeuser Company, Project No. 721-9741, 1997.

6.0 References
6-8
77. Weyerhaeuser Company–Marshfield, Wisconsin, Formaldehyde Emissions Variability Study,Press Area Common Stack, Test Dates December 18, 1997 to March 26, 1998, prepared forWeyerhaeuser Company, by Weyerhaeuser Company, Project No. 721-9753, May 26, 1998.
78. Press Room Vent Emissions Sampling, Willamette Industries, Inc., Emerson, Louisiana, TestDates February 8-9, 1995, prepared for Willamette Industries, Inc., by ArmstrongEnvironmental, Inc., Project W-1653-95, February 20, 1995.
79. Engineering Evaluation Test Report, Formaldehyde, Total Hydrocarbons, and MethaneEmissions from Four Process Stacks, Willamette Industries, Inc., Emerson, Louisiana, TestDates April 23-24, 1998, prepared for Willamette Industries, Inc., by DEECO, Inc., ProjectNo. 1559, June 7, 1998.
80. Report of Particulate, VOC, and Formaldehyde Tests for Willamette Industries–Malverne MDFFacility Line I and Line II Press Vent Baghouses, Malverne, Arkansas, Test Dates May 7-8,1998, prepared for Willamette Industries, by Environmental Monitoring Laboratories, May 28,1998.
81. Report of VOC and Formaldehyde Emissions Test for Willamette Industries–Malverne MDFFacility Line I Press Vent Baghouse, Malverne, Arkansas, Test Date July 24, 1998, prepared forWillamette Industries, by Environmental Monitoring Laboratories, August 14, 1998.
82. Report of VOC and Formaldehyde Emissions Test for Willamette Industries–Malverne MDFFacility Line II Press Vent Baghouse, Malverne, Arkansas, Test Date September 10, 1998,prepared for Willamette Industries, by Environmental Monitoring Laboratories, September 29,1998.
83. Report of Air Emissions and Inlet Loading Tests for Willamette Industries–Malverne MDFFacility Line II Dryers Thermal Oxidizer, Malverne, Arkansas, Test Dates March 5-6, 1998,prepared for Willamette Industries, by Environmental Monitoring Laboratories, April 3, 1998.
84. Report of Air Emissions Tests for Willamette Industries–Arcadia OSB Facility Press VentExhaust, Arcadia, Louisiana, Test Dates October 2-4, 1996, prepared for Willamette Industries,by Environmental Monitoring Laboratories, November 16, 1996.
85. Report of Air Emissions Tests for Willamette Industries–Arcadia OSB Facility Press VentExhaust, Arcadia, Louisiana, Test Date July 12, 1996, prepared for Willamette Industries, byEnvironmental Monitoring Laboratories, July 17, 1996.
86. Report of Air Emissions Tests for Willamette Industries–Arcadia OSB Facility Press VentExhaust, Arcadia, Louisiana, Test Date May 20, 1996, prepared for Willamette Industries, byEnvironmental Monitoring Laboratories, August 3, 1996.
87. Report of Air Emissions Tests for Willamette Industries–Arcadia OSB Facility, Arcadia,Louisiana, Test Dates July 11-12, 1996, prepared for Willamette Industries, by EnvironmentalMonitoring Laboratories, August 3, 1996.

6.0 References
6-9
88. Emissions Test Report, Willamette Industries MDF, Eugene, Oregon, Primary Dryer and SanderDust Baghouse, Test Dates October 3 and 16-18, 1996, prepared for Willamette Industries, byBWR Associates, Inc., Project No. 96-165X, 1996.
89. Emissions Test Report, Willamette Industries MDF, Eugene, Oregon, Press Vents, Test DatesNovember 13-14, 1996, prepared for Willamette Industries, by BWR Associates, Inc., ProjectNo. 96-165X, 1996.
90. Emissions Test Report, Willamette Industries, Springfield, Oregon, Veneer Dryer #1 and VeneerDryer #2, Test Dates June 1-2, 1998, prepared for Willamette Industries, by BWR Associates,Inc., Project No. 98-092D, 1998.
91. Compliance Test, Formaldehyde and VOC, Board Press Area, Dominance Industries, Inc., PanPacific Products, Broken Bow, Oklahoma, Test Dates September 25-26, 1997, prepared for PanPacific Products, by CETCON, Job No. CJ-1813, October 28, 1997.
92. Compliance Test, Formaldehyde, PM, VOC and CO, Dryer Cyclone 13E, Dominance Industries,Inc., Pan Pacific Products, Broken Bow, Oklahoma, Test Dates September 22-23, 1997, preparedfor Pan Pacific Products, by CETCON, Job No. CJ-1812, October 23, 1997.
93. Compliance Test, Formaldehyde, PM, VOC and CO, Wood Fired Boiler, Dominance Industries,Inc., Pan Pacific Products, Broken Bow, Oklahoma, Test Dates September 24-25, 1997, preparedfor Pan Pacific Products, by CETCON, Job No. CJ-1814, October 27, 1997.
94. Emissions Test Report, Willamette Industries Duraflake Division, Albany, Oregon, Dry Dryers 1,2, 3 and 4, Test Dates May 19-22, 1998, prepared for Willamette Industries, by BWR Associates,Inc., Project No. 98-044D, 1998.
95. Emissions Test Report, Willamette Industries Duraflake Division, Millersburg (Albany), Oregon,Green Dryer #3, Test Dates March 27-28, 1997, prepared for Willamette Industries, by BWRAssociates, Inc., Project No. 97-043D, 1997.
96. Emissions Test Report, Willamette Industries Duraflake Division, Albany, Oregon, Boiler #1,Green Dryer #1, and Green Dryer #2, Test Dates April 22-23 and 25-26, 1996, prepared forWillamette Industries, by BWR Associates, Inc., Project No. 96-048X, 1996.
97. Potential Volatile Organic Compound (VOC) Emissions from Borden Cascophen® SP-C32KDuring Pressing and Press Cool Down (Southern Pine), prepared for Borden, June 13, 1996.
98. Potential Volatile Organic Compound (VOC) Emissions from Borden Cascophen® 7CA31HDuring Pressing and Press Cool Down (Douglas Fir), prepared for Borden, June 13, 1996.
99. Potential Volatile Organic Compound (VOC) Emissions from Borden Cascophen® SP-C32KDuring Pressing and Press Cool Down (Yellow Poplar), prepared for Borden, June 13, 1996.
100. Emissions Testing for Particulate, Formaldehyde, CO, NOx, VOCs on Various Process Exhausts,Trus-Joist Macmillan, a Limited Partnership, Buckhannon, West Virginia, Test Dates
6.0 References
6-10
December 12-16, 1995, prepared for Trus-Joist MacMillan, by Analytical Testing Consultants,Inc., Report No. 5712, January 25, 1996.
101. Information Stack Test Report, Wellons Cyclo-Blast Wood-Fired Furnaces, Wood Strand Dryers,Fuel Energy Analysis for Trus-Joist MacMillan, Hazard, Kentucky, Test Date March 1, 1996,prepared for Trus-Joist MacMillan, by Commonwealth Technology, Inc., June 18, 1996.
102. Compliance Stack Test Report, Test Results for Wellons Cyclo-Blast Wood-Fired Furnaces,Wood Strand Dryers, Siempelkamp Steam Injection Press for Trus-Joist MacMillan, Hazard,Kentucky, Test Dates February 28-29 and March 27, 1996, prepared for Trus-Joist MacMillan,by Commonwealth Technology, Inc., June 18, 1996.
103. Volatile Organic Compound (VOC) Emissions from Neste Resins 4001/H1003 Adhesive,prepared for Boise Cascade Corporation, May 9, 1997.
104. Determination of Carbon Monoxide Emissions from the Thermal Oil Heater Exhaust Stack andthe Strand Dryer Exhaust Stack when Firing Hardwood Species Other than Aspen,Determination of MDI Emissions from the Press Vent Exhaust Stack, Trus-Joist MacMillan,Deerwood, Minnesota, Test Dates August 15-16, 1995, prepared for Trus-Joist MacMillan, byBraun Intertec Corporation, Report No. CMXX-95-0493, September 11, 1995.
105. Determination of Pollutant Emissions from the Strand Dryer System at the Trus-Joist MacMillanFacility, Deerwood, Minnesota, Test Dates June 8-10, 1998, prepared for Trus-Joist MacMillan,by Braun Intertec Corporation, Report No. CMXX-98-0389, July 8, 1998.
106. Determination of Carbon Monoxide Emissions from the Thermal Oil Heater and the StrandDryer at Trus-Joist MacMillan, Deerwood, Minnesota, Test Date November 18, 1997, preparedfor Trus-Joist MacMillan, by Braun Intertec Corporation, Report No. CMXX-97-0710,December 22, 1997.
107. Determination of Pollutant Emissions from Six Emission Points at the Trus-Joist MacMillanFacility, Deerwood, Minnesota, Test Dates November 19-22, 1996 and March 4-5, 1997,prepared for Trus-Joist MacMillan, by Braun Intertec Corporation, Report No. CMXX-96-0984,April 1, 1997.
108. Volatile Organic Compound Emissions From Wood Products Manufacturing Facilities, Part I -Plywood, Technical Bulletin No. 768, National Council of the Paper Industry for Air and StreamImprovement, Inc., Research Triangle Park, NC, 1999.
109. Volatile Organic Compound Emissions From Wood Products Manufacturing Facilities, Part II -Engineered Wood Products, Technical Bulletin No. 769, National Council of the Paper Industryfor Air and Stream Improvement, Inc., Research Triangle Park, NC, 1999.
110. Volatile Organic Compound Emissions From Wood Products Manufacturing Facilities, Part III -Medium Density Fiberboard, Technical Bulletin No. 770, National Council of the Paper Industryfor Air and Stream Improvement, Inc., Research Triangle Park, NC, 1999.
6.0 References
6-11
111. Volatile Organic Compound Emissions From Wood Products Manufacturing Facilities, Part IV -Particleboard, Technical Bulletin No. 771, National Council of the Paper Industry for Air andStream Improvement, Inc., Research Triangle Park, NC, 1999.
112. Volatile Organic Compound Emissions From Wood Products Manufacturing Facilities, Part V -Oriented Strandboard, Technical Bulletin No. 772, National Council of the Paper Industry forAir and Stream Improvement, Inc., Research Triangle Park, NC, 1999.
113. Volatile Organic Compound Emissions From Wood Products Manufacturing Facilities, Part VI -Hardboard/Fiberboard, Technical Bulletin No. 773, National Council of the Paper Industry forAir and Stream Improvement, Inc., Research Triangle Park, NC, 1999.
114. Volatile Organic Compound Emissions From Wood Products Manufacturing Facilities, Part VII- Test Methods, Quality Assurance/Quality Control Procedures and Data Analysis Protocol,Technical Bulletin No. 774, National Council of the Paper Industry for Air and StreamImprovement, Inc., Research Triangle Park, NC, 1999.
115. Wood Products MACT Study Database, National Council of the Paper Industry for Air andStream Improvement, Inc., Research Triangle Park, NC, 1999.
116. Comparison of EPA M0011 and NCASI Impinger Method Emission Factors for Formaldehyde,memorandum to project file, from D. Bullock, Midwest Research Institute, November 4, 1999.
117. Field Validation of the DNPH Method for Aldehydes and Ketones, EPA No. 68-D4-0022, DCNNo. 95-650-049-12-04, prepared for J. Knoll, National Exposure Research Laboratory, AirMeasurements Research Division, Methods Branch, U.S. Environmental Protection Agency,Research Triangle Park, NC, January 30, 1996.
118. Memorandum from G. McAlister, EMAD/EMC, to D. Safriet, EMAD/EFIG. California AirResources Board (CARB) Method 430. February 7, 2001.
119. Procedures for Preparing Emission Factor Documents, EPA-454/R-95-015, U.S. EnvironmentalProtection Agency, Research Triangle Park, NC, May 1997.
120. Approach to Reviewing Test Reports Submitted With Responses to the 1998 EPA InformationCollection Request (MACT Survey)–Plywood and Composite Wood Products, to Mary TomKissell, OAQPS/ESD/WCPG, from D. Bullock, Midwest Research Institute, June 8, 1999.
121. Approach to Using Values Below Test Method Detection Limits in the Development of EmissionFactors and Control Efficiencies, to Mary Tom Kissell, OAQPS/ESD/WCPG, from D. Bullock,Midwest Research Institute, November 3, 1999.

6.0 References
6-12
This page intentionally left blank.
Attachments
A-1
Attachment 1
Acronyms/Codes/Abbreviations
Attachments
A-2
This page intentionally left blank.

Attachments
A-3
Table 1. Emission Test Method Codes
Code Test Method Pollutant(s) Measureda
1,2-PP 1-(2-pyridyl) piperazine method Methylene diphenyl diisocyanate (MDI)
BCA Bacharach combustion analyzer Carbon monoxide
CARB430 California Air Resources BoardMethod 430
Formaldehyde
DNPH Unspecified DNPH method Formaldehyde
GC Unspecified gas chromatography Methane
GC/FID Unspecified gaschromatography/flame ionizationdetector method
Ethane, methane
M0010 SW-846 Method 0010, Semi-VOST(Semivolatile Organic SamplingTrain)
1,2,4-trimethylbenzene, acetophenone, a-pinene,a-terpene, biphenyl, bis-(2-ethylhexyl phthalate),b-pinene, butylbenzyl phthalate, cumene, p-cymene,di-N-butyl phthalate, hydroquinone
M0011 BIF Method 0011, for Aldehydesand Ketones
2,5-dimethyl benzaldehyde, acetaldehyde, acetone,acrolein, benzaldehyde, butylaldehyde, butyraldehyde,crotonaldehyde, formaldehyde, hexaldehyde,isovaleraldehyde, methyl ethyl ketone, o-,m-,p-tolualdehyde, propionaldehyde, valeraldehyde
M0030 SW-846 Method 0030, VOST(Volatile Organic Sampling Train)
1,1,1-trichloroethane, 4-methyl-2-pentanone, a-pinene,acetone, b-pinene, benzene, bromomethane, carbondisulfide, carbon tetrachloride, chloroform,chloromethane, cumene, dimethyl sulfide, ethylbenzene, n-hexane, methyl ethyl ketone, methylenechloride, p-cymene, styrene, toluene, o-,m-,p-xylene
M10 EPA Method 10 Carbon monoxide
M10B EPA Method 10B Carbon monoxide
M18 EPA Method 18 Benzene, methane
M201A EPA Method 201A PM-10
M202 EPA Method 202 Condensible PM
M25A EPA Method 25A Total hydrocarbons (THC)
M3 EPA Method 3 Carbon dioxide
M3A EPA Method 3A Carbon dioxide
M308 EPA Method 308 Methanol
M5 EPA Method 5 Filterable PM
M6 EPA Method 6 Sulfur dioxide

Table 1. (continued)
Attachments
Code Test Method Pollutant(s) Measureda
A-4
M6C EPA Method 6C Sulfur dioxide
M7 EPA Method 7 Nitrogen oxides
M7C EPA Method 7C Nitrogen oxides
M7E EPA Method 7E Nitrogen oxides
MM5 Modified EPA Method 5 Phenol
MM0011 Modified BIF Method 0011, forAldehydes and Ketones
Formaldehyde
NCASI NCASI impinger method Formaldehyde, methanol
NICM NCASI impinger/canister method Acetaldehyde, acetone, acrolein, a-pinene, b-pinene,benzene, bromomethane, camphene, 3-carene,chloroethane, chloroethene, cis-1,2-dichloroethylene,cumene, 1,2-dichloroethane, formaldehyde, limonene,p-mentha-1,5-diene, methanol, methyl ethyl ketone,methyl isobutyl ketone, methylene chloride, p-cymene,phenol, propionaldehyde, styrene, toluene,1,2,4-trichlorobenzene, o-,m-,p-xylene
P&CAM142 NIOSH Physical and ChemicalAnalytical Method 142
Methylene diphenyl diisocyanate (MDI)
TO-5 TO-5 (Compendium of Methods forthe Determination of Toxic OrganicCompounds in Ambient Air)
2,4-dimethylbenzaldehyde, acetone, benzaldehyde,butyraldehyde, crotonaldehyde, formaldehyde, hexaldehyde, isovaleraldehyde, o-,m-,p-tolualdehyde,valeraldehyde
TO-8 TO-8 (Compendium of Methods forthe Determination of Toxic OrganicCompounds in Ambient Air)
Benzo-a-pyrene, o-,m-,p-cresol, naphthalene, phenol,pyridine
TO-14 TO-14 (Compendium of Methods forthe Determination of Toxic OrganicCompounds in Ambient Air)
Acetone, benzene, bromomethane, chloroethane,chloromethane, ethanol, ethylbenzene, isobutanol,methyl ethyl ketone, methyl propyl ketone, methylenechloride, propanol, styrene, toluene,trichlorofluoromethane, xylenes
TO-14(mod) Modification of TO-14 Methanola HAP compounds in italic.

Attachments
A-5
Table 2. HAP Analytes and Analysis Techniques forNCASI MACT Sampling Program
HAP Analyte
Analysis Methoda
Impinger Canister
Acetaldehyde GC/FID GC/MS
Acrolein GC/FID GC/MS
Benzene none GC/MS
Bromomethane none GC/MS
Chloroethane none GC/MS
Chloroethene none GC/MS
Cumene none GC/FID
1,2-Dichloroethane none GC/MS
Formaldehyde Colorimetric none
Methanol GC/FID GC/MS
Methyl Ethyl Ketone GC/FID GC/MS
Methyl Isobutyl Ketone GC/FID GC/MS
Methylene Chloride none GC/MS
Phenol GC/FID GC/MS
Propionaldehyde GC/FID GC/MS
Styrene none GC/MS
Toluene none GC/MS
1,2,4-Trichlorobenzene none GC/MS
m,p-Xylene none GC/MS
o-Xylene none GC/MSa GC/FID = gas chromatography/flame ionization detector; GC/MS = gas
chromatography/mass spectrometer.
Table 3. Non-HAP Analytes and Analysis Techniques forNCASI MACT Sampling Program
Non-HAP Analyte
Analysis Methoda
Impinger Canister
Acetone GC/FID GC/MS
Camphene none GC/FID
3-Carene none GC/FID
p-Cymene none GC/FID
cis-1,2-Dichloroethylene none GC/MS
Limonene none GC/FID
p-mentha-1,5-Diene none GC/FID
Alpha-pinene none GC/FID
Beta-pinene none GC/FIDa GC/FID = gas chromatography/flame ionization detector; GC/MS = gas
chromatography/mass spectrometer.
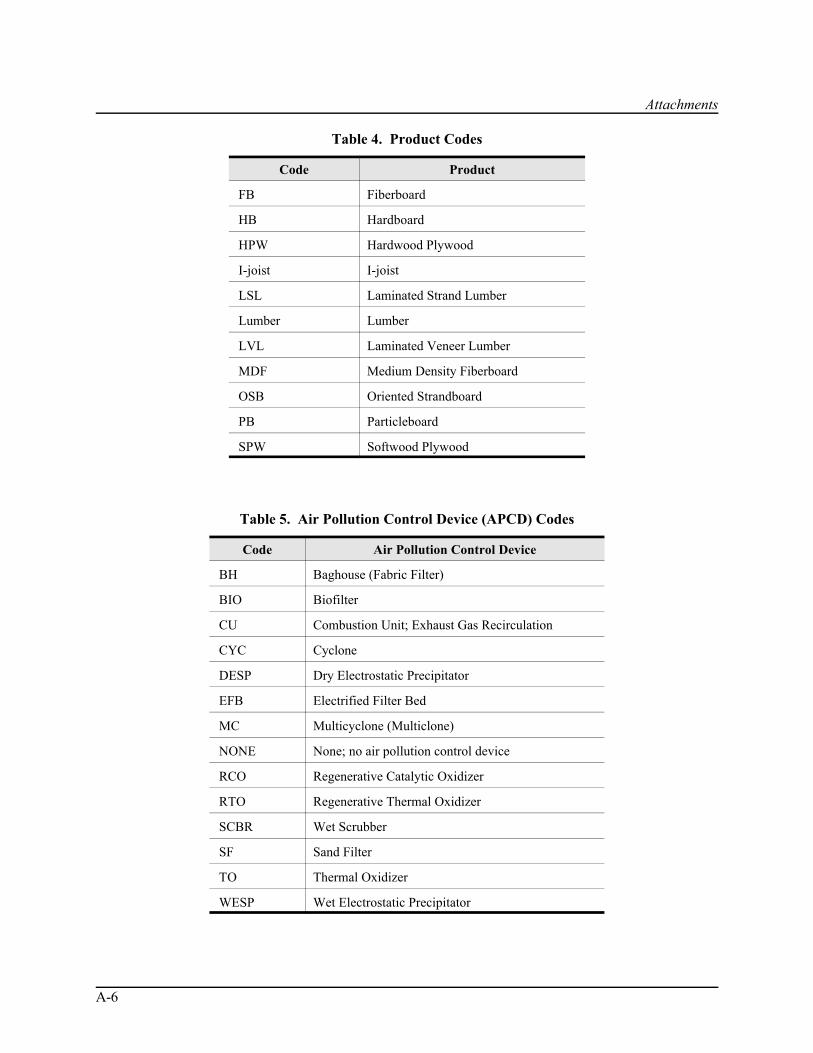
Attachments
A-6
Table 4. Product Codes
Code Product
FB Fiberboard
HB Hardboard
HPW Hardwood Plywood
I-joist I-joist
LSL Laminated Strand Lumber
Lumber Lumber
LVL Laminated Veneer Lumber
MDF Medium Density Fiberboard
OSB Oriented Strandboard
PB Particleboard
SPW Softwood Plywood
Table 5. Air Pollution Control Device (APCD) Codes
Code Air Pollution Control Device
BH Baghouse (Fabric Filter)
BIO Biofilter
CU Combustion Unit; Exhaust Gas Recirculation
CYC Cyclone
DESP Dry Electrostatic Precipitator
EFB Electrified Filter Bed
MC Multicyclone (Multiclone)
NONE None; no air pollution control device
RCO Regenerative Catalytic Oxidizer
RTO Regenerative Thermal Oxidizer
SCBR Wet Scrubber
SF Sand Filter
TO Thermal Oxidizer
WESP Wet Electrostatic Precipitator
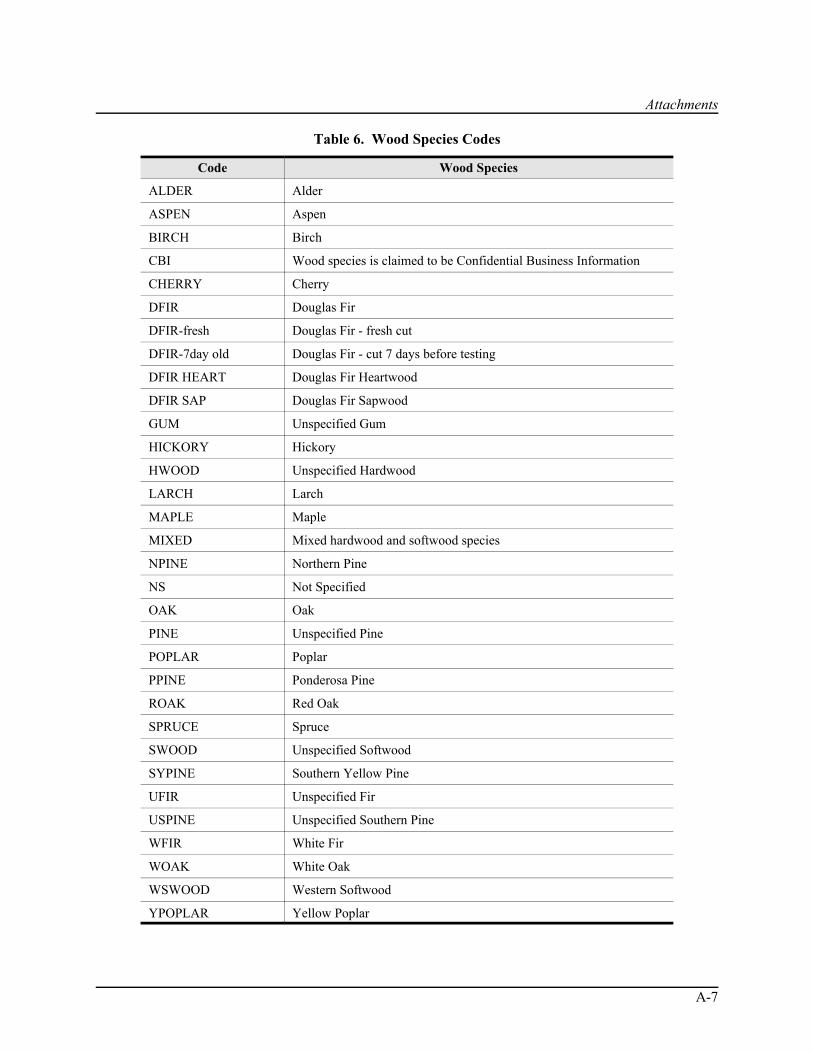
Attachments
A-7
Table 6. Wood Species Codes
Code Wood Species
ALDER Alder
ASPEN Aspen
BIRCH Birch
CBI Wood species is claimed to be Confidential Business Information
CHERRY Cherry
DFIR Douglas Fir
DFIR-fresh Douglas Fir - fresh cut
DFIR-7day old Douglas Fir - cut 7 days before testing
DFIR HEART Douglas Fir Heartwood
DFIR SAP Douglas Fir Sapwood
GUM Unspecified Gum
HICKORY Hickory
HWOOD Unspecified Hardwood
LARCH Larch
MAPLE Maple
MIXED Mixed hardwood and softwood species
NPINE Northern Pine
NS Not Specified
OAK Oak
PINE Unspecified Pine
POPLAR Poplar
PPINE Ponderosa Pine
ROAK Red Oak
SPRUCE Spruce
SWOOD Unspecified Softwood
SYPINE Southern Yellow Pine
UFIR Unspecified Fir
USPINE Unspecified Southern Pine
WFIR White Fir
WOAK White Oak
WSWOOD Western Softwood
YPOPLAR Yellow Poplar

Attachments
A-8
Table 7. Resin Codes
Code Resin Type
LINSEED Linseed Oil Binder System
MDI Methylene diphenyl diisocyanate
PF Phenol-Formaldehyde
PF-dry Dry Phenol-Formaldehyde
UF Urea-Formaldehyde
Table 8. Dryer Firing Type Codes
Code Dryer Firing Type
DF Direct-Fired
IF Indirect Heated
IF/DF Indirect and Direct Heat
RF Radio-Frequency Heated
Table 9. Dryer Fuel Type Codes
Code Dryer Fuel Type
DFINE Dry Wood Fines (unspecified)
FINES Wood Fines (unspecified)
NGAS Natural Gas
PROP Propane
SDUST Sanderdust
STEAM Steam Heated (indirect heated)
TRIM Wood Trim
WDUST Wood Dust (unspecified)
WREF Wood Refuse (unspecified)
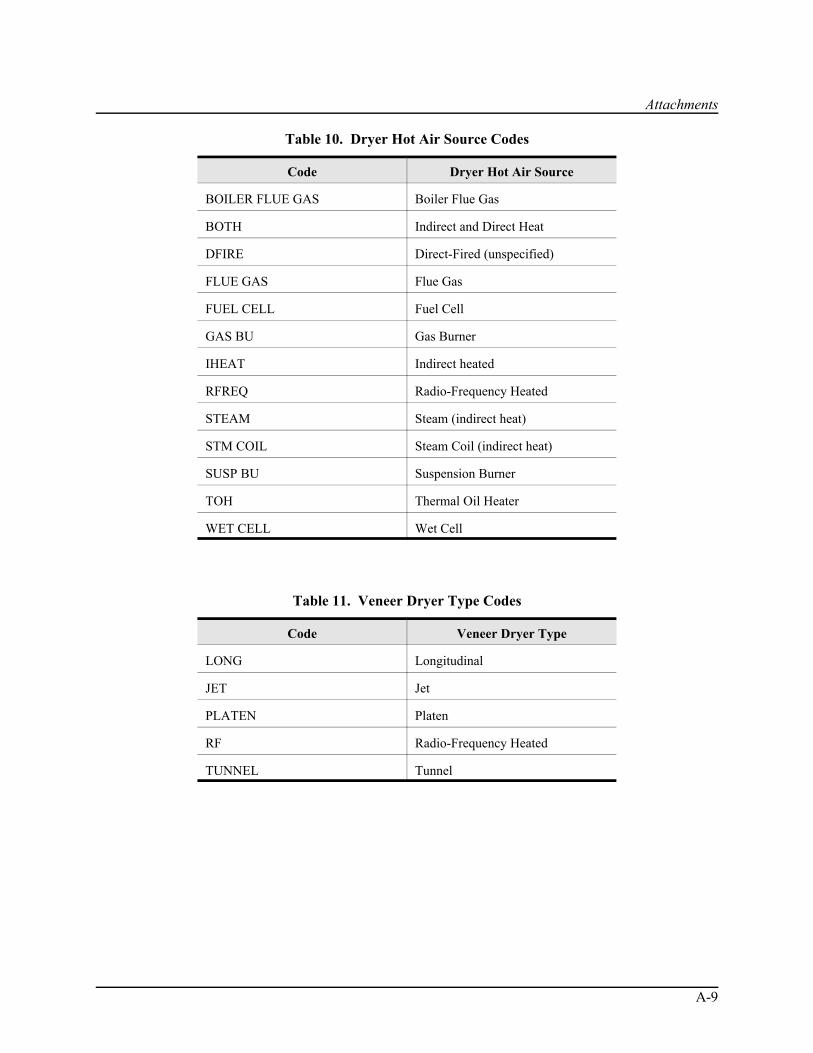
Attachments
A-9
Table 10. Dryer Hot Air Source Codes
Code Dryer Hot Air Source
BOILER FLUE GAS Boiler Flue Gas
BOTH Indirect and Direct Heat
DFIRE Direct-Fired (unspecified)
FLUE GAS Flue Gas
FUEL CELL Fuel Cell
GAS BU Gas Burner
IHEAT Indirect heated
RFREQ Radio-Frequency Heated
STEAM Steam (indirect heat)
STM COIL Steam Coil (indirect heat)
SUSP BU Suspension Burner
TOH Thermal Oil Heater
WET CELL Wet Cell
Table 11. Veneer Dryer Type Codes
Code Veneer Dryer Type
LONG Longitudinal
JET Jet
PLATEN Platen
RF Radio-Frequency Heated
TUNNEL Tunnel

Attachments
A-10
Table 12. Emission Factor Unit Abbreviations
Emission FactorUnit Abbreviation
Definition
lb/1000 ft3 pounds per thousand cubic feet
lb/MLF pounds per thousand linear feet
lb/MSF pounds per thousand square feet of surface area
lb/MSF reclaim pounds per thousand square feet of reclaimed material surface area
lb/MSF 1/2 pounds per thousand square feet of 1/2-inch thick board
lb/MSF 1/8 pounds per thousand square feet of 1/8-inch thick board
lb/MSF 3/4 pounds per thousand square feet of 3/4-inch thick board
lb/MSF 3/8 pounds per thousand square feet of 3/8-inch thick board
lb/ODT pounds per oven-dried ton

Attachments
A-11
Attachment 2
Example Calculation

Attachments
A-12
This page intentionally left blank.

Attachments
A-13
Example Calculation
Unit OperationTestdate
No. ofruns
No. ofrunsBDL
Test emission factor value(average of test runs),
lb/ODTUnit emission factor
value, lb/ODT
Plant 30, dryer A 1/19/93 3 0 0.000413 0.000413
Plant 10, dryer A 10/22/97 3 3 0.008121 0.008121a
Plant 10, dryer B 10/22/97 3 3 0.003042 0.003042
Plant 156, dryer A 9/22/97 6 0 0.006574
0.007113Plant 156, dryer A 9/22/97 3 0 0.007652
Plant 183, dryer A 5/2/97 3 2 0.003555
0.004664Plant 183, dryer A 5/2/97 3 0 0.005773
Plant 30, dryer B 1/20/93 3 0 0.002676 0.002676
Overall emission factor for unit operation (average of unit emission factor values),lb/ODT
0.0036
a This unit average emission factor was disregarded when calculating the overall emission factor for the unitoperation. This value is one-half of the MDL for a test where all runs were non-detect, and is higher than all of theother detect runs. Using this value would bias the overall average emission factor high.

Attachments
A-14
This page intentionally left blank.

Attachments
A-15
Attachment 3
Conversion Factors and Equations

Attachments
A-16
This page intentionally left blank.

Attachments
A-17
Useful Conversion Factors
To convert from . . . to . . . multiply by . . .
board feet cubic feet 0.0833
lb as carbon lb as propane 1.22
lb as methane lb as carbon 0.75
lb as propane lb as carbon 0.82
MSF “X” basis MSF “Y” basis X/Y (see example below)
ppm as carbon ppm as propane 0.33
ppm as methane ppm as carbon 1
ppm as propane ppm as carbon 3.0
Example of conversion from MSF 3/4-inch basis to MSF 3/8-inch basis:
1,000 MSF 3/4-inch basis = 1,000 MSF 3/8-inch basis × (3/4)/(3/8) = 2,000 MSF 3/8-inch basis

Attachments
A-18
Useful Equations
Wood moisture content calculations:
% Moisture Content (dry basis) =weight of water in wood
× 100weight of oven-dry wood
% Moisture Content (dry basis) =%MCWB ÷ 100
× 1001 ! (%MCWB ÷ 100)
% Moisture Content (wet basis) =weight of water in wood
× 100weight of wet wood
% Moisture Content (wet basis) =%MCDB ÷ 100
× 1001 + (%MCDB ÷ 100)
where:%MCDB = moisture content (dry basis)%MCWB = moisture content (wet basis)
Parts per million by volume, dry:
ppmvd =ppmvw
1 ! (%moisture ÷ 100)
where:ppmvd = concentration, parts per million by volume, dryppmvw = concentration, parts per million by volume, wet%moisture = stack gas moisture content, %
Grains/dscf from grams collected:
gr/dscf =grams × 15.43
dscf
where:gr/dscf = concentration, grains per dry standard cubic footgrams = grams of pollutant collecteddscf = gas volume sampled, dry standard cubic feet
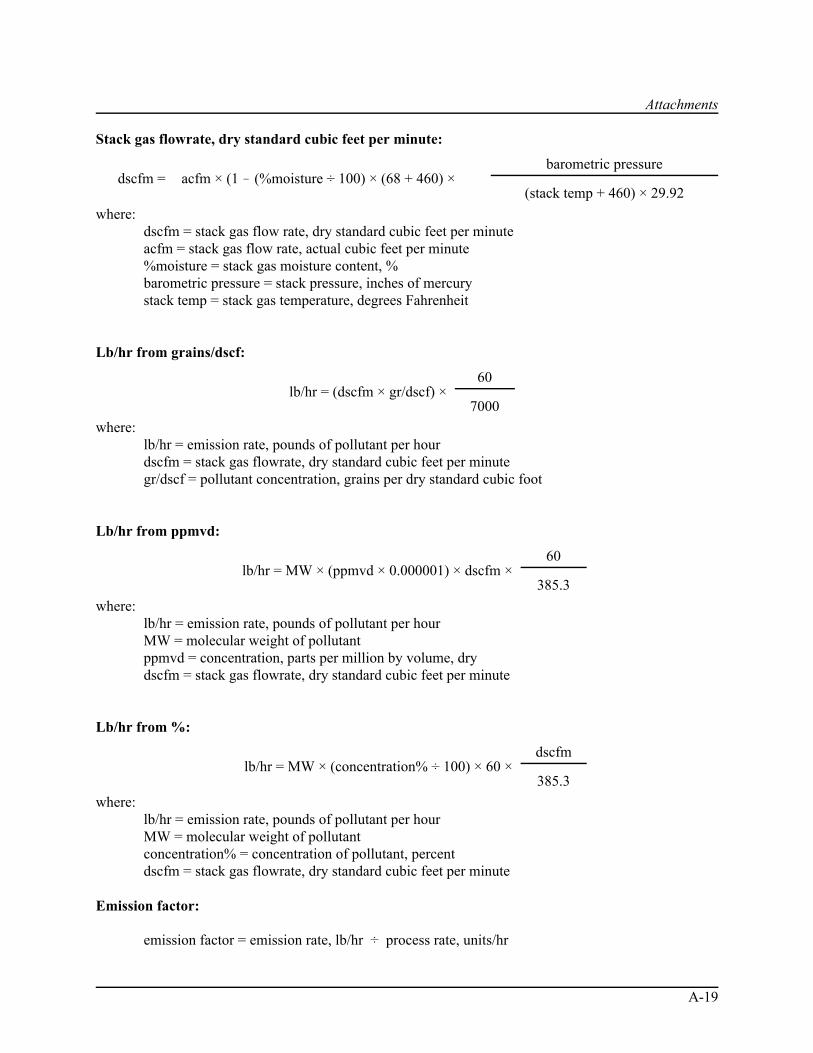
Attachments
A-19
Stack gas flowrate, dry standard cubic feet per minute:
dscfm = acfm × (1 ! (%moisture ÷ 100) × (68 + 460) ×barometric pressure
(stack temp + 460) × 29.92
where:dscfm = stack gas flow rate, dry standard cubic feet per minuteacfm = stack gas flow rate, actual cubic feet per minute%moisture = stack gas moisture content, %barometric pressure = stack pressure, inches of mercurystack temp = stack gas temperature, degrees Fahrenheit
Lb/hr from grains/dscf:
lb/hr = (dscfm × gr/dscf) ×60
7000
where:lb/hr = emission rate, pounds of pollutant per hourdscfm = stack gas flowrate, dry standard cubic feet per minutegr/dscf = pollutant concentration, grains per dry standard cubic foot
Lb/hr from ppmvd:
lb/hr = MW × (ppmvd × 0.000001) × dscfm ×60
385.3
where:lb/hr = emission rate, pounds of pollutant per hourMW = molecular weight of pollutantppmvd = concentration, parts per million by volume, drydscfm = stack gas flowrate, dry standard cubic feet per minute
Lb/hr from %:
lb/hr = MW × (concentration% ÷ 100) × 60 ×dscfm
385.3
where:lb/hr = emission rate, pounds of pollutant per hourMW = molecular weight of pollutantconcentration% = concentration of pollutant, percentdscfm = stack gas flowrate, dry standard cubic feet per minute
Emission factor:
emission factor = emission rate, lb/hr ÷ process rate, units/hr

Attachments
A-20
Control efficiency:
Control efficiency =inlet mass emissions ! outlet mass emissions
× 100inlet mass emissions
Conversion from THC-as-carbon to THC-as-propane:
THC as pounds carbon × 44 pounds propane36 pounds carbon
= THC as pounds propane
orTHC as pounds carbon × 1.22 = THC as pounds propane
Calculation of VOC-as-propane from THC-as-carbon:
VOC as propane = (1.22 × THC as carbon) + formaldehyde ! (acetone + methane + methylene chloride)