emini junkie day trading plan - newbie tradernewbie-trader.com/files/tradingplan/market...
TRANSCRIPT

Day Trading PlanMarket Internals, Entries and Exits
Version 2.0 – February 2013
Do Not Email, Copy, Scan or Re-Distribute in Any Form©2013 SMARE Investment Group, LLC
CFTC RULE 4.41 HYPOTHETICAL OR SIMULATED PERFORMANCE RESULTS HAVE CERTAIN LIMITATIONS.UNLIKE AN ACTUAL PERFORMANCE RECORD, SIMULATED RESULTS DO NOT REPRESENT ACTUAL TRADING. ALSO, SINCE THE TRADES HAVE NOT BEEN EXECUTED, THE RESULTS MAY HAVE UNDER-OR-OVER COMPENSATED FOR THE IMPACT, IF ANY, OF CERTAIN MARKET FACTORS, SUCH AS LACK OF LIQUIDITY. SIMULATED TRADING PROGRAMS IN GENERAL ARE ALSO SUBJECT TO THE FACT THAT THEY ARE DESIGNED WITH THE BENEFIT OF HINDSIGHT. NO REPRESENTATION IS BEING MADE THAT ANY ACCOUNT WILL OR IS LIKELY TO ACHIEVE PROFIT OR LOSSES SIMILAR TO THOSE SHOWN.
DISCLAIMER: Futures and options trading involves substantial risk of loss and is not suitable for every investor. The valuation of futures and options may fluctuate, and, as a result, clients may lose more than their original investment. The impact of seasonal and geopolitical events is already factored into market prices. The highly leveraged nature of futures trading means that small market movements will have a great impact on your trading account and this can work against you, leading to large losses or can work for you, leading to large gains. If the market moves against you, you may sustain a total loss greater than the amount you deposited into your account.
You are responsible for all the risks and financial resources you use and for the chosen trading system. You should not engage in trading unless you fully understand the nature of the transactions you are entering into and the extent of your exposure to loss. If you do not fully understand these risks you must seek independent advice from your financial adviser. All trading strategies are used at your own risk. This software should not be relied upon as advice or construed as providing recommendations of any kind. It is your responsibility to confirm and decide which trades to make. Trade only with risk capital; that is, trade with money that, if lost, will not adversely impact your lifestyle and your ability to meet your financial obligations.
www. EminiJunkie .com ©2013

TRADING TIME FRAMES
Earlier in the manual we discussed setting up our charts. As you probably already have guessed, we use the 400 tick chart as our main chart for pin pointing trade entries. However, all of our longer term setups come off our higher time frame charts of 5 or 15 minutes. The reason for this is we can play both with the trend and against the trend on any given trade, but counter trend trading is always more dangerous if done out of context. Conversely, trading with the trend can be quite advantageous to us, but one needs to make sure they are not at a previous point of support or resistance that would adversely affect the trade.
I define the trend on both the 5 and the 15 minute chart as positive when the 20 period EMA is above the 40 period EMA. The opposite is true for downtrends… the 20 EMA must be below the 40 EMA. As your education in the Emini Junkie system continues you will have access to our KIS signal tool which has a Bias Filter that does more advance trend definition. The tool also has a chop filter that warns you when the market has a potential to go sideways and you should avoid trading our Basic Trading Plan.
Here is the KIS Tool signaling a trade in the direction of the EJ Bias Filter.
Here is the KIS Tool Yellow/Gold Chop Filter warning of danger.
20/40 EMA TRADE – This trade is a favorite of one of my past mentors and it works quite well. In strong down trend days ((^ADVN-^DECL) < -1300) price tends to bounce down off the 20/40 EMA on its first touch. In strong up trend days ((^ADV-^DECL) > 1300) price tends to bounce up off the 20/40 EMA on its first touch.
www. EminiJunkie .com ©2013

Both of the above graphs (5Min Heikin-Ashi) represents strong trend days when the ^ADV-^DECL was well below -1300 or well above +1300. Please note how well the 20(red) and 40(blue) EMA resisted price throughout the day. Do not expect to see price be rejected by the EMA’s every time they touch during the day, but this setup usually works 70-80% of the time on the first touch. We use this setup as a signal for us to start looking for confirmation on our 400 tick chart.
www. EminiJunkie .com ©2013

MARKET INTERNALS
There are four main graphs I watch continuously to keep me abreast of market internals. The NYSE Advancers less Decliners (^ADV-^DECL), the NYSE Tick (^TICK), the Dow Futures (YM) and the NASDAQ Bank Index (BANK) if your platform does not have BANK you can watch the XLF.
^ADV-^DECL - This indicator is used by many traders to confirm the strength of a current trend and its likelihood of reversing. If the markets are up but the ^ADV-^DECL line is sloping downwards, it's usually a sign that the markets are losing their breadth and may be setting up to head in the other direction. If the slope of the ^ADV-^DECL line is up and the market is trending upward then the market is said to be healthy. Not only is the slope of the ^ADV-^DECL important but the total values are as well. When the value of the ^ADV-^DECL is between -400 and 400 the market is neutral. Readings above +1000 is slightly bullish and above +1500 is very bullish. The opposite is true for readings below -1000 and -1500.
www. EminiJunkie .com ©2013

The below graph of the ^ADV-^DECL shows the 9 Period DEMA (Teal Line) and the 20 Period EMA (Gold Line) as described in the chart setup. When the Teal Line is below the Gold Line decliners are outpacing advancers and it is an opportunity to look for shorts especially if the value is below -1000. The opposite is also true. When the Teal Line is above the Gold Line advancers are outpacing decliners and it is an opportunity to look for longs especially if the value is above +1000.
www. EminiJunkie .com ©2013

^TICK – The TICK is used to determine very short-term changes in market momentum. A reading above 0 is bullish and a reading below 0 bearish. Extreme readings above +680 or below -680 (On Ninja Trader) could signify a short-term turn in price action. Readings between 400 and 680 are very bullish while readings below -400 and -680 are very bearish. Although the numeric values of the ^TICK are very important we see that the tick tends to channel up and down throughout the day creating a high and low range. We use the ^TICK to help pin point our entries on the 400 tick chart of the ES. When we get a signal to go short we only enter when the ^TICK is in the top portion of its range (top of its channel) and if we get a signal to go long we only enter when ^TICK is in the low portion of its range (bottom of its channel).
www. EminiJunkie .com ©2013

The tick also has a tendency to confirm or diverge from price action of the ES. For example, in an uptrend, if the ^TICK makes a new high of the day and the ES price action does not make a concurrent new high… Price tends to trade higher until both ^TICK and ES make new highs at or near the same time. The opposite is also true. In a downtrend, if the ^TICK makes a new low of the day and the ES price action does not make a concurrent new low… Price tends to trade lower until both ^TICK and ES make new lows at or near the same time. However, if price is making new highs and the ^TICK is making lower highs (diverging from the price action of the ES), this is a heads up that a trend reversal may be coming.
NASDAQ BANK INDEX – BANK (or XLF) is a chart I did not speak of when we discussed setting up our charts. I use the same settings on BANK as I do my 5 minute ES chart. The BANK is an index of the 492 securities in the Bank Index. There is a saying that goes… “As goes the market, goes the banks”. I track this chart as a confirming and sometimes leading indicator to the ES. On most occasions the ES cannot move higher unless BANK moves higher and vice versa.
www. EminiJunkie .com ©2013

NEWS
Trading the news can be a trading strategy all in its own. As Emini Junkies, our rules do not change due to impending news, we just need to be aware of it and already be in a position well prior to the release or stay flat until a few minutes after the release. If we are in a position and we expect the news to really move the markets, we may want to flatten our position or tighten up stops accordingly. A good rule of thumb is not to initiate any new trades 3 min in front of a news announcement.
When trading news, you first have to know which releases are actually expected that week. There are many ways to do this, and I have found Econoday provides a very comprehensive calendar. Second, it is axiomatic that you to know which data are important. The Econoday calendar stars the important releases and also lists the "consensus" figures and past reports. Generally speaking, the following are the most important economic releases for any given week:
Interest Rate Decision Retail Sales Inflation (consumer price or producer price) Unemployment Industrial Production Business Sentiment Surveys Consumer Confidence Surveys Trade Balance Manufacturing Sector Surveys Housing Starts
Depending on the current state of the economy, the relative importance of these releases may change. For example, unemployment may be more important this month than trade or interest rate decisions. Therefore, it is important to keep on top of what the market is focusing on at the moment.
FOMC Meeting Minutes tend to create havoc on the entire trading day. Be very cautious on these days and consider trading only the morning session. I tend to avoid trades for 15 minutes after the FOMC announcement.
www. EminiJunkie .com ©2013

TRADE ENTRIES AND TARGETS
Earlier in this manual I discussed how to set up our Apex Trader DOM to provide us an edge on getting a reduced risk trade using multiple contracts. If you recall we are risking 7 ticks per contract as our stop initially. Once our first target of +2 ticks is hit, our position moves to break even minus 4. Understanding why we do this leads us to one of the underlying rules we have on risk vs. reward when trading. Never enter a trade if Target #2 (-23.6% Fib Extension) is not a minimum of 7 ticks away from our 50% swing retrace line (a measured swing length of 9 ticks will provide a 7 tick 50% - 23.6% measurement). Now you are probably asking yourself… What in the heck is a 50% swing retrace line? It is nothing more than the 50% Fibonacci Line as measured on our entry swing.
FIBONACCI SETUP
www. EminiJunkie .com ©2013
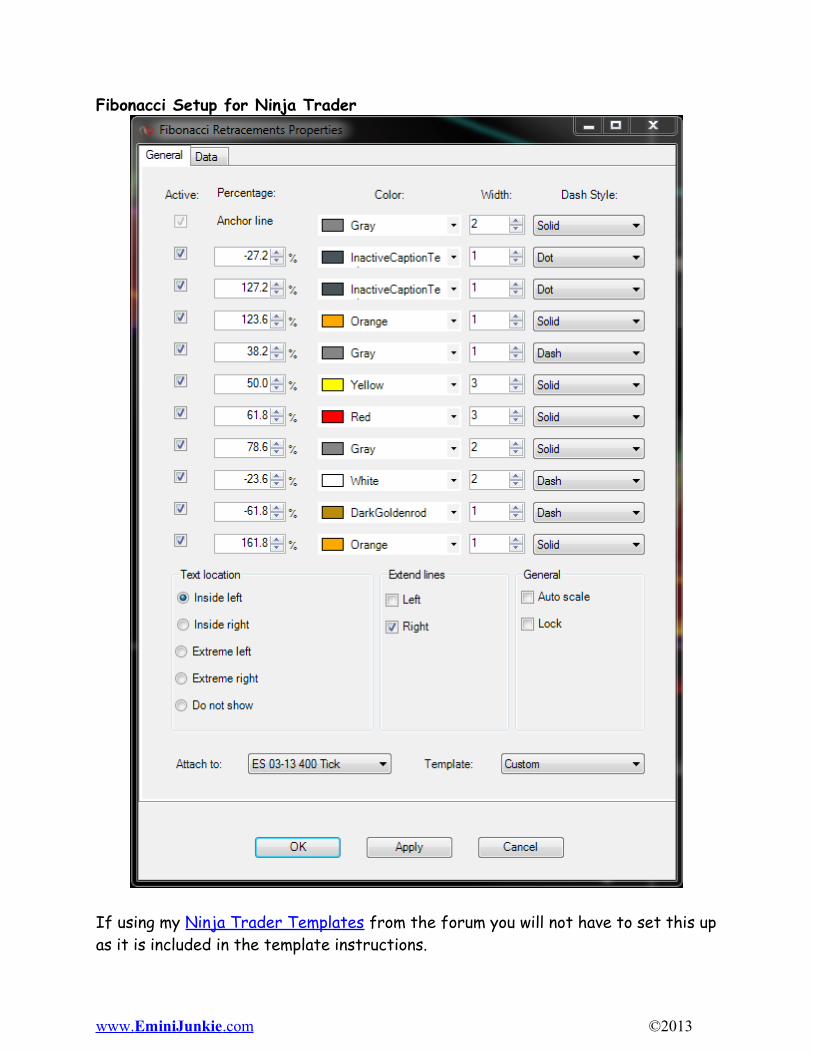
Fibonacci Setup for Ninja Trader
If using my Ninja Trader Templates from the forum you will not have to set this up as it is included in the template instructions.
www. EminiJunkie .com ©2013

Fibonacci Setup for ThinkOrSwim
On my ThinkOrSwim properties I choose to show the following levels:
-50.0% Dashed Green Line – Maximum Non-Runner Target-23.6% Dashed White Line – Target #2 (T2)38.2% Dashed Grey – Potential Fib Expansion Entry50.0% Solid Yellow – Ambush Signal Line61.8% Solid Red – Ambush Break Down Line
One of my mentors termed the zone between the 50% and 61.8% Fibonacci Line as the “Ambush Zone” and often you will see me refer to this as an “AL” Ambush Long or “AS” Ambush Short when referencing trade set ups on the 3200 Tick or 5
www. EminiJunkie .com ©2013

minute chart. When we drop to the 400 tick chart I refer to the swing entries as a “MAL” Micro Ambush Long or “MAS” Micro Ambush Short.
DRAWING FIBONACCI’S
The art of identifying and drawing the correct fib lines may be your toughest skill to acquire when learning to trade the ES or any other market. The reason this skill is so difficult to learn is that they are continually forming on all time-frames meaning you could have both a long and short ambush at the same time depending on your time perspective. They also overlap forming areas of confluence and consolidation. To prove my point I am going to show you a series of charts from the extreme monthly chart perspective down to our current tick chart. Due to the relatively “newness” of the ES E-mini Futures contract I will use the SPX for the larger time-frames.
www. EminiJunkie .com ©2013


TYPES OF FIBONACCI’S
Unfortunately the only way to get proficient at correctly identifying the fib swing to measure is practice, practice, practice. Everyday you should look at both your 5 minute and 400 Tick chart and measure moves. During the trading day I am constantly measuring swings to identify areas that are in play.
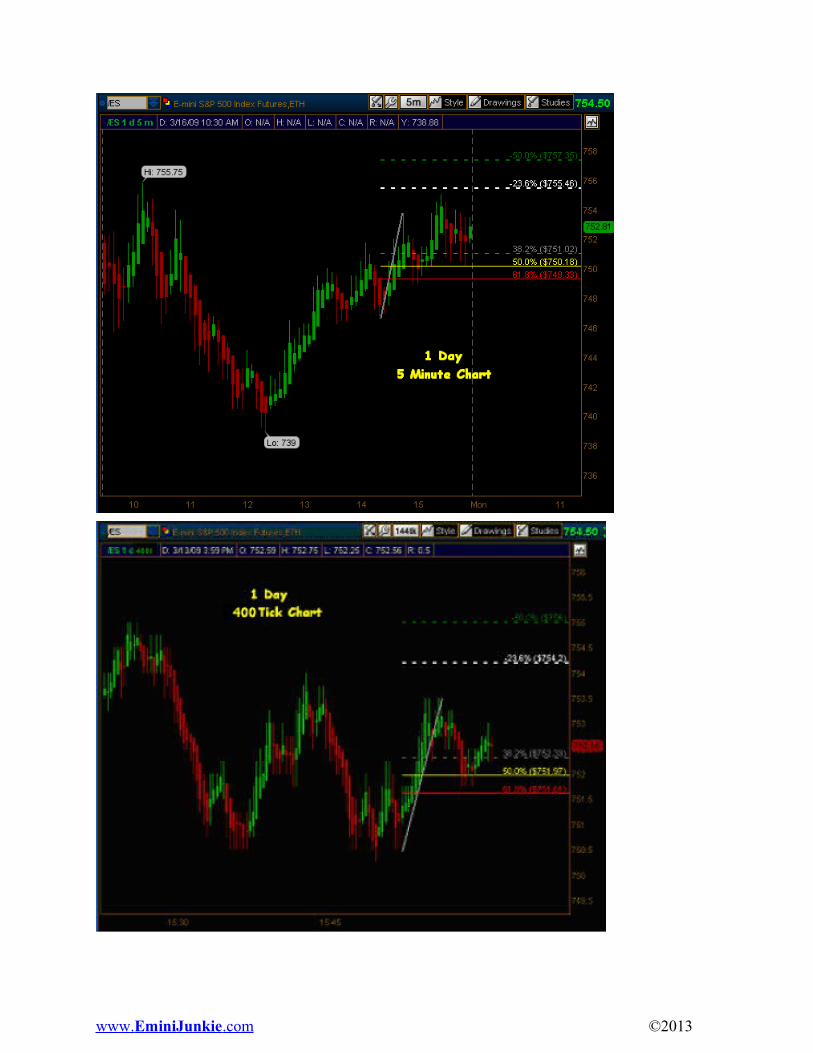
Normal Fibs – I define a Normal Fib as a Fibonacci that is measured from a swing low to a swing high or a swing high to swing low. The 5 Minute and the 400 Tick charts above both show a swing low to swing high measurement from the bottom of the lowest red Heikin-Ashi (prior to a green) to the top of the highest green Heikin-Ashi (prior to a red series of 2 or more candles).
Fib Extensions – I define a Fib Extension as a Fibonacci that is measured from a previous swing high to the most recent swing high or from a previous swing low to the most recent swing low. The 1 Hour and 15 Minute charts above both show a previous swing high (top of the previous highest green Heikin-Ashi prior to a series of 2 or more red candles) to the most recent swing high (top of the highest green Heikin-Ashi prior to a series of 2 or more red candles).
The art comes into play when determining when to use Normal Fibs vs. Fib Extensions. Unfortunately, there are not any hard and fast rules which say to use one vs. the other, it depends on what most of the other traders are seeing and which area reacts on the retrace. My general guideline is to be aware of fast moving markets, large time based candles as compared to average size candles in a series. When a market moves parabolic one should immediately think to look for a Fib Extension prior to a Normal Fib. Notice on both the 1 Hour and 5 Minute charts above how the size of the candles increase and the slope of the expansions are steep.
Fib Confluence – I define a Fib Confluence as an area closely represented by two separate Fibonacci Lines measured in the same swing or series of swings. When measured in the same swing we are looking at a Normal Fib drawn with a Fib Extension. When measured in a series of swings we are really talking about measurements of multiple time-frames on the same chart.
www. EminiJunkie .com ©2013


Fib Consolidation – I define Fib Consolidation as the range between opposing time-frame and directions. Notice on the above chart how we are in a longer time-frame larger swing at the same time we are in a shorter time-frame smaller counter-trend move against the larger move down. In this example the 5 Minute ultimately reaches it -23.6% extension (T2). Notice how the price action chops (consolidates) between these key Fib Levels prior to ultimately moving down. Once price test the 400 Tick 61.8% Fib Level it bounces to what would be a 400 Tick 50% Normal Fib Confluence (not shown) to the downside with the original 5 Minute 50% Fib Level prior to ultimately breaking down.
Fib Consolidations are ever present between several various time-frames on the ES. Our job as Emini Junkies is to best define the main fib levels in control of the market and enter trades accordingly. Often times you could enter either direction and still reach your 2 tick (T1) reducing the risk of the trade as observed above.
www. EminiJunkie .com ©2013