trading divergences - kiss-trader.comkiss-trader.com/freetradingarticles/tradingdivergencesr.pdf ·...
TRANSCRIPT

40
STRATEGIES
May 2005 www.traders-mag.com
Trading Divergences
Divergences occur when the trend of a security’s price does notcorrespond with the trend of an indicator. Frequently used indicatorsin divergence analysis include the RSI, the CCI, Stochastics, and theMACD. Divergence analysis serves to indicate an impending changein trend. Trend changes are announced by the indicator’s failure toconfirm a price move. The failures can be interpreted as inherent priceweakness or strength preceding a rapid directional change in pricetrend. It’s implicitly assumed that indicators are always right and pricemisleading.
A classic example is when an indicator fails to confirm a new pricehigh by not making a new high of its own.
An ExampleThis can be seen with the RSI(14) in the upper window of figure 1:Whilst the index clearly makes a new high, the RSI makes a lower high(red circles). This kind of “negative” divergence is interpreted as a signof impending price weakness, and is in fact followed immediately inthis case by a slight decrease in prices.
The blue circles in figure 1 show the opposite. Here the index
Discovering divergences between price formations and the trends ofa technical indicator is a popular form of visual market analysis. Theproblem with the approach is its high degree of subjectivity: somedivergences appear after the fact, others literally seem to vanish. Whena divergence is found, its validity is often a matter of opinion. Thefollowing article deals not only with finding divergences, but also withsystemising a trading approach around them.
F1) Divergences in the RSI
7570656055504540353025
4300
4200
4100
4000
3900
3800
17 243 1019 265 13MayAprilMarchFebruary2004
2915823 1 221692261912529
7570656055504540353025
4300
4200
4100
4000
3900
3800
The red circles show a negative divergence between the RSI (upperwindow) and the Dax (lower window). This indicates a weakness in theunderlying. The blue circles are showing a positive divergence, whichindicates rising prices.

41
makes a low followed by a lower low. The RSI forms a double bottomat this point, failing to confirm price weakness. The formation is thenfollowed by a picture perfect trend reversal.
A Divergence Isn’t Always a DivergenceIf you examine the examples in figure 1 closely, you will notice that inthe first case the price trend and indicator run counter to one another,whilst in the second example the indicator merely forms a doublebottom. Might this indicate various degrees of divergence strengthand ultimately different types of divergences? This can be answeredwith a definite yes! Organising divergences into categories not onlyhelps classify them, but also helps to use them in a practical way -strong divergences lead to strong price moves.
The following classifications includes examples of both positiveand negative forms of the same divergence type:
A-Class Divergences: strongest type of divergenceExample 1: Prices form a new low. The indicator forms a low, higher
than its previous low. (Rising prices expected)Example 2: Prices make a new high. The indicator forms a high, lower
than its previous high. (Falling prices expected)
B-Class Divergences: medium strength divergencesExample 1: Prices form a double bottom, whilst the indicator marks a
low, higher than its previous low. (Rising prices expected)Example 2: Prices form a double bottom, whilst the indicator marks a
low, lower than its previous low. (Decreasing prices expected)
C-Class Divergences: weakest form of divergenceExample 1: Prices reach a low, lower than the previous low. The
indicator forms a double bottom. (Rising prices expected)Example 2: Prices reach a high, higher than the previous high. The
indicator forms a double top. (Falling prices expected)
According to their strength, A-Class divergences should be closelymonitored, whilst C-Class divergences can be considered relativelyunimportant. With a second glance at figure 1, it’s clear the examplecircled in red is a bearish A-Class divergence, confirming our definition:“Prices make a new high.
The indicator forms a high lower than the previous high. (Fallingprices expected).” The second example in blue on the other hand is aC-Class divergence that, in this case, indicates rising prices: “Pricesreach a low, lower than the previous low. The indicator forms a doub-le bottom. (Rising prices expected).”
Why should divergence analysis work?So what’s the theory behind divergence analysis? How can you becertain that divergences aren’t just the random behaviour of indicators,or even hocus-pocus?
The fundamental idea behind divergences is the assumption thattechnical indicators show market behaviour and psychology moreobjectively then prices do. After all, indicators do nothing more thanput price behaviour into perspective, making it comparable.
Whilst prices can never be too high or too low, indicators (at leastoscillators) actually have well defined limits, indicating that prices may
have moved too far too fast. This hints that the masses may be toooptimistic or too pessimistic.
When prices reach a new low, but the indicator marks a higherlow, its assumed investor sentiment has shifted. This positivedivergence indicates that despite the new price low, investors are less“shocked” than they were at the previous low. The positive turn insentiment is the first sign of a potential trend change. A negativedivergence indicates the opposite. On a purely technical level,however, an indicator failing to confirm new price highs or lowsindicates nothing other than a decrease in price dynamic.
MomentumMomentum measures the rate at which prices change over a givenperiod of time by calculating the difference between two price points.For example, the standard 12-period setting subtracts the price 12days ago from the current price. Momentum begins to recede whenprices no longer rise as quickly as they did in the previous 12-dayperiod. It also moves horizontally when prices increase at the samerate over the period.
If prices simply increase less-strongly, momentum fades. It doesn’ttake much to imagine the indicator tends to cause divergences toappear everywhere. This slight defect doesn’t make momentum totallyuseless in divergence analysis, but it shows that it can never be reliedupon by itself.
The Relative Strength Index (RSI)The RSI, on the other hand, is different. In fact, there is probably nobetter indicator for showing divergences. It was said that divergenceanalysis functions because indicators make relative price strengthcomparisons possible. Measurable differences in price dynamicsallow conclusions to be drawn about price movement strength. TheRSI’s ability to measure relative price strength makes it an idealindicator for divergence analysis. However, despite its obviousadvantages, exclusive use of the RSI for analysing divergences wouldbe a mistake.
F2) Comparison of RSI and Momentum
15
25
65
55
45
35
70
80
120
110
100
90
6000
5500
5000
4500
4000
15
25
65
55
45
35
70
80
120
110
100
90
6000
5500
5000
4500
4000
September October November 2002December21 287 1417 273 102612529 1922158124171027 313 20
C H A R T
R S I
M O M E N T U M
While the RSI (upper window) showed the upmove in the Dax correctly,the momentum (middle window) shows too many divergences. Becausedivergences appear too often in the momentum indicator, they are notreally useful.
42
STRATEGIES
May 2005 www.traders-mag.com
F3) One Possible Set-up
70
-200
200
100
0
-100
60
50
40
30
4300
4200
4100
4000
3900
-150
-50
150
50
3800
70
-200
200
100
0
-100
60
50
40
30
4300
4200
4100
4000
3900
-150
-50
150
50
3800EnterStopp loss
2612 19 2 2613529 1922158123169March AprilFebruary
RSI vs. MomentumLet’s examine the strengths and weaknesses of the RSI and momentumindicators with the aid of an example: Figure 2 plainly shows thatmomentum (middle window) quickly forms divergences toward theend of strong upward price movements. As prices continue makingnew highs momentum decreases gradually. On the other hand, theRSI (top window) shows no divergences where none exist. At thelow prior to the trend change it did form a double bottom (justifiablyso), but its progression correctly follows the subsequent upwardmove.
The right SettingAfter choosing the appropriate indicator, the timeframe parametersneed to be set. In almost all cases though, the standard settings canbe used i.e., 14-period for the RSI or 12-period for momentum.Distinctly longer or shorter settings are of no added value.
Divergence BasicsBefore beginning the hunt for divergences, there are a couple of pointsthat need to be remembered.
Trading with divergences is a fascinating concept that appeals toa lot of people because of its visual and intuitive nature. Newcomers,however, should keep their enthusiasm in check. The desire to seedivergences at every possible point on the chart looms large in thebeginning. Perhaps the most important rule here is: “if you must askyourself if it’s a divergence, it probably isn’t one!”
Divergences must be distinct and jump out of the chart at you –they are the only kind that should be considered.
ProportionalityThe second fundamental rule could be described as theproportionality principle: Divergences appear often in a chart,sometimes at extreme turning points, sometimes during the middleof a low volatility market phase. Important here is the time horizonand the magnitude of the price patterns used when measuring thedivergences. Divergences at major highs and lows on the chart aremore significant than others.
One Divergence is Not EnoughIf a divergence has been spotted, try in advance to improve the riskreward ratio. There are two ways of doing this. One is to search formultiple divergences - a row of divergences one after the other.Another is to find divergences that simultaneously appear with differentindicators. Multiple divergences can be thorny, as their appearanceoften accompanies strong trends leading to counter-trend trading,which is naturally very risky.
Not at all risky and highly recommended is trading divergencessimultaneously confirmed by multiple indicators. A confirmation inthis case means, for instance, if three indicators are used, two of themshould show the divergence. The majority decides.
The Choice of MeansAfter several indicators showing clear divergences have been found,the question arises as to how a trading strategy would be applied.When are the divergences completed? How are entry and exit points
decided? The standard indicators for divergence analysis are not wellsuited as entry and exit triggers. As is known, applying classic entryand exit rules in connection with indicators and their standard settingswould likely lead to financial ruin.
Additionally, indicators used as signal generators often lag priceaction, whilst divergences usually deliver signals too early. How canthat be combined sensibly? The answer is, not at all!
Divergences and Classic Technical AnalysisIn contrast to indicators, classic technical analysis (support/resistance,formations, trend lines) is outstandingly compatible with divergenceanalysis because generated signals do not lag. Also, technical analysis’basic problem is the all to frequent false breakouts. Since divergenceshail possible trend changes, they are ideal in reducing the number offalse signals associated with technical analysis.
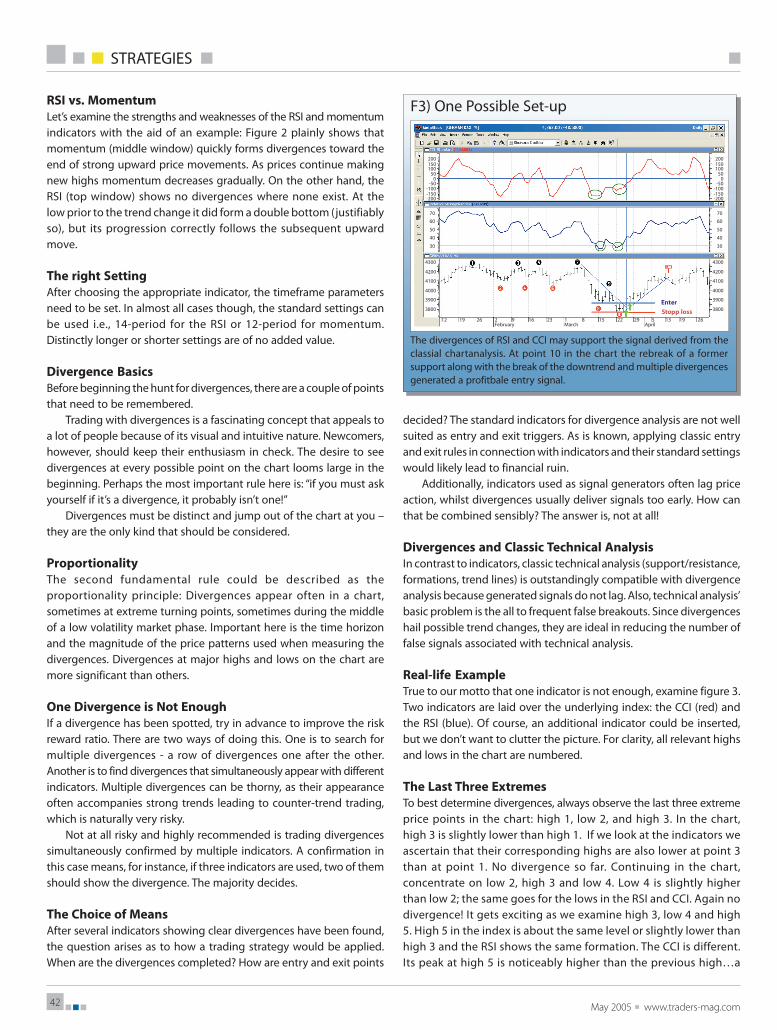
Real-life ExampleTrue to our motto that one indicator is not enough, examine figure 3.Two indicators are laid over the underlying index: the CCI (red) andthe RSI (blue). Of course, an additional indicator could be inserted,but we don’t want to clutter the picture. For clarity, all relevant highsand lows in the chart are numbered.
The Last Three ExtremesTo best determine divergences, always observe the last three extremeprice points in the chart: high 1, low 2, and high 3. In the chart,high 3 is slightly lower than high 1. If we look at the indicators weascertain that their corresponding highs are also lower at point 3than at point 1. No divergence so far. Continuing in the chart,concentrate on low 2, high 3 and low 4. Low 4 is slightly higherthan low 2; the same goes for the lows in the RSI and CCI. Again nodivergence! It gets exciting as we examine high 3, low 4 and high5. High 5 in the index is about the same level or slightly lower thanhigh 3 and the RSI shows the same formation. The CCI is different.Its peak at high 5 is noticeably higher than the previous high…a
The divergences of RSI and CCI may support the signal derived from theclassial chartanalysis. At point 10 in the chart the rebreak of a formersupport along with the break of the downtrend and multiple divergencesgenerated a profitbale entry signal.
43
divergence!As previously mentioned though, we want the confirmation of
more than one indicator (in our case two) before we identify a tradabledivergence. So this particular divergence in the CCI can be ignored inthis case.
The indicators correctly follow all subsequent highs and lows untilwe reach low 8, high 9 and low 10. Low 10 is clearly lower in the indexthan low 8; the indicators, however, paint a different picture. The RSIforms a double bottom whilst the CCI even shows an A-Classdivergence. Now the question is how can we be sure these divergencesare real, as they form before and not after the fact? What’s certain iswe can only assume low 10 if no further price declines occur. We canalso assume with relative certainty that if prices rise above low 8, wecan consider low 10 to be completed.
The day that prices cross back up through low 8 is marked with avertical blue line (figure 3). This day is decisive for the divergences. At theindicator level, the RSI’s double bottom and the CCI’s A-Class divergenceare clearly visible. Both are now confirmed. Based on that, we go long atthe closing price of the day crossing the blue horizontal line. An alterna-tive would be to wait one more day to confirm the line’s crossover.
ExitingAs previously mentioned divergences should help reduce false signalsin classic technical analysis. If the entry is a success, then stops arebest placed at obvious charting points. In this case, it’s simple becauseour scenario of rising prices would be proven wrong if prices fell underlow 10, so the stop is placed at or just below this point. The exit can betriggered with a profit target (ideally a few times higher than thepossible loss), or placed at a technical point in the chart. In figure 3,the first price pull back following entry is used to draw a trend linewhose eventual break serves as an exit trigger.
Some WarningsThe above example proves there are ways to systemise divergencetrading. Unsolved, however, is how to ascertain the significance of thedivergence itself. There is a lot of room for interpretation and muchdepends on the observer.
Further PossibilitiesLuckily, the wish to fully systemise a trading approach based ondivergences does not have to go unfulfilled. Here, there are twopossible ways.
The most traditional way consists of continually calculating thecorrelation between the underlying and a divergence indicator. Acorrelation is a statistical measure of how two variables move inrelation to each other. It’s output is a number ranging between 1 and–1. A correlation of zero shows there is no relationship to the twovalues. 1 indicates perfect correlation and –1 indicates an exactreciprocal relationship. Divergences are strong when the underlyingand the divergence indicator show a correlation value near –1. Toimplement this, a low enough correlation threshold must bedetermined in order to make an entry in the market attractive.
Correlation indicators are available in most common chartingsoftware products, but have the disadvantage of a double delay: firstly,all technical indicators lag current price because their calculations arebased on historical data. The second delay results from calculatingthe correlation of indicator and price. This kind of approach makes itdifficult to grasp current market action.
A Better WayThe other possibility avoids this double delay by making comparisonson the indicator level. Instead of comparing indicator and price, anindicator is compared with itself using various settings. Simplesubtraction is all it takes. In this way, divergence analysissimultaneously becomes an analysis of various timeframes.
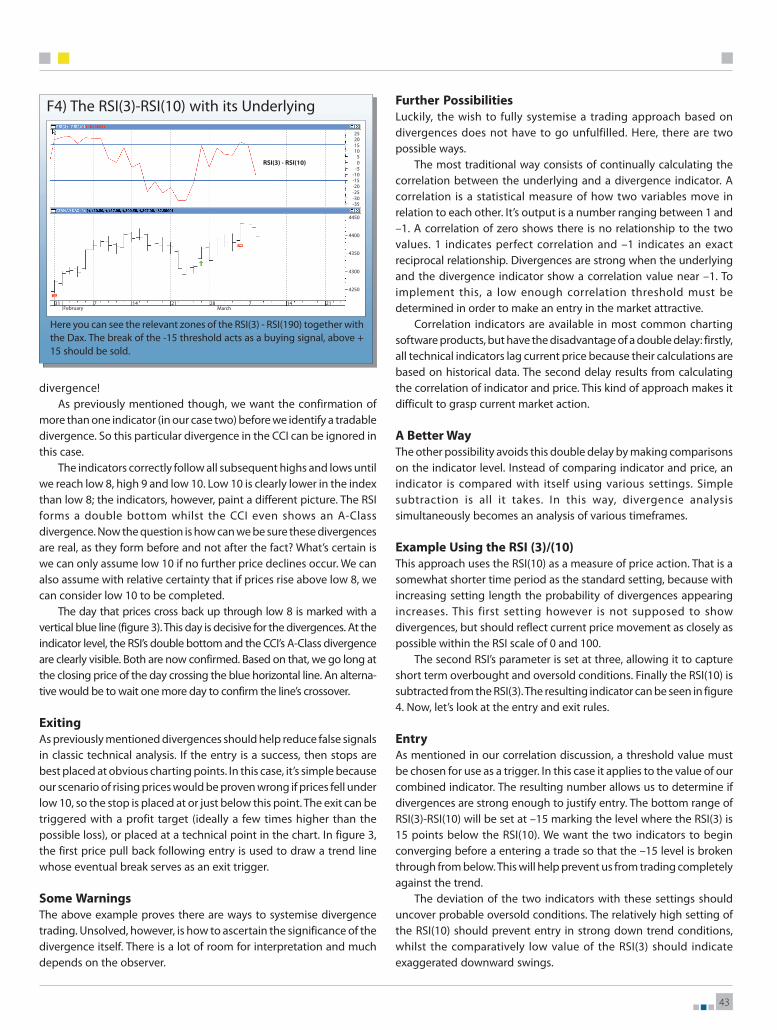
Example Using the RSI (3)/(10)This approach uses the RSI(10) as a measure of price action. That is asomewhat shorter time period as the standard setting, because withincreasing setting length the probability of divergences appearingincreases. This first setting however is not supposed to showdivergences, but should reflect current price movement as closely aspossible within the RSI scale of 0 and 100.
The second RSI’s parameter is set at three, allowing it to captureshort term overbought and oversold conditions. Finally the RSI(10) issubtracted from the RSI(3). The resulting indicator can be seen in figure4. Now, let’s look at the entry and exit rules.
EntryAs mentioned in our correlation discussion, a threshold value mustbe chosen for use as a trigger. In this case it applies to the value of ourcombined indicator. The resulting number allows us to determine ifdivergences are strong enough to justify entry. The bottom range ofRSI(3)-RSI(10) will be set at –15 marking the level where the RSI(3) is15 points below the RSI(10). We want the two indicators to beginconverging before a entering a trade so that the –15 level is brokenthrough from below. This will help prevent us from trading completelyagainst the trend.
The deviation of the two indicators with these settings shoulduncover probable oversold conditions. The relatively high setting ofthe RSI(10) should prevent entry in strong down trend conditions,whilst the comparatively low value of the RSI(3) should indicateexaggerated downward swings.
F4) The RSI(3)-RSI(10) with its Underlying
-5
-20
2015
5
-10
-25-30-35
4450
4400
4300
4350
4250
-15
0
25
10
7 211428MarchFebruary
7 211431
RSI(3) - RSI(10)
Here you can see the relevant zones of the RSI(3) - RSI(190) together withthe Dax. The break of the -15 threshold acts as a buying signal, above +15 should be sold.