emergency evacuation draft final report- · pdf file · 2008-08-28framework for...
TRANSCRIPT

Final Report
Submitted to
Florida Department of Transportation
Framework for Modeling Emergency Evacuation
Contract BD548, RPWO #5
By
Essam Radwan, Ph.D., P.E. CATSS Executive Director
Mansooreh Mollaghasemi, Ph.D.
IEMS Department
Steven Mitchell Ph.D. Candidate CEE Department
Gonca Yildirim
Ph.D. Student IEMS Department
Center for Advanced Transportation Systems Simulation University of Central Florida
Orlando, FL 32816 Phone: (407) 823-0808
Fax: (407) 823-4676
April 2005

Technical Report Documentation Page 1. Report No.
2. Government Accession No.
3. Recipient's Catalog No.
5. Report Date
4. Title and Subtitle Framework For Modeling Emergency Evacuation
6. Performing Organization Code
7. Author(s) Essam Radwan, Mansooreh Mollaghasemi, Steven Mitchell, and Gonca Yildirim
8. Performing Organization Report No.
10. Work Unit No. (TRAIS)
9. Performing Organization Name and Address Center for Advanced Transportation Systems Simulation University of Central Florida Orlando, FL 32816 11. Contract or Grant No.
13. Type of Report and Period Covered
12. Sponsoring Agency Name and Address Research Center Florida Department of Transportation 605 Suwannee Street Tallahassee, Florida 32399-0450
14. Sponsoring Agency Code
15. Supplementary Notes
16. Abstract This study investigated the relationships between a number of identifiable components that make up emergency evacuation,
and how they can be integrated into a framework for modeling hurricane events. A thorough review of the literature
revealed that the available computer simulation models on the market are proprietary, they are designed to simulate current
conditions on existing roads and they have no capabilities to estimate network clearance time. A framework for emergency
evacuation was developed and tested on a selected site in the Central Florida region (Ormond Beach, Florida). The results
of runs with the INTEGRATION software using three different loading curves confirm findings of previous research. As
expected, the best loading curve is the linear case. The standard loading curve has produced clearance times that fell
between the linear and steep cases showing an overall network average clearance time of 17.1 hours. The standard loading
curve has produced clearance times that extend beyond the 12 hour evacuation window. A comparison between the
INTEGRATION and ARENA simulation model outputs clearly showed that there are statistically significant differences in
the results. It is hypothesized that because of the logic that ARENA uses in moving entities in the network, the procedure
used in coding origin-destination information, and the lack of interaction among different entities (car-following and lane
change logics), the results obtained from this model were vastly different from the INTEGRATION model. It is safe to say
that the INTEGRATION model has produced reasonable results and the developed framework can be expanded and applied
to bigger urban areas. 17. Key Word
18. Distribution Statement
19. Security Classif. (of this report)
20. Security Classif. (of this page)
21. No. of Pages
22. Price
Form DOT F 1700.7 (8-72) Reproduction of completed page authorized

Acknowledgment and Disclaimer
The authors would like to acknowledge the cooperation and support of Ms. Elizabeth Birriel for
serving as the Project Manager and providing guidance during the course of this research. We
also would like to thank Mr. Richard Long for his continued support of the transportation
program at UCF. "The opinions, findings, and conclusions expressed in this publication are those
of the authors and not necessarily those of the State of Florida Department of Transportation."
Executive Summary
This study investigated the relationships between a number of identifiable components that make
up emergency evacuation, and how they can be integrated into a framework for modeling
hurricane events. A thorough review the literature was conducted and it was found that the
available computer simulation models on the market are proprietary and the developers are
reluctant to release these models for us to investigate further. It was also found that other micro-
simulation traffic models are designed to simulate current conditions on existing roads and they
have no capabilities to estimate network clearance time. Furthermore, all emergency evacuation
models adopt a loading curve for the transportation network that follows an “S” curve. Published
studies on human behavior lacked the data to support this assumption about the “S” curve and it
appears that there is a need to carryout further investigations on this subject. A framework for
emergency evacuation was developed and tested on a selected site in the Central Florida region
(Ormond Beach, Florida).
The results of runs with the INTEGRATION software using three different loading curves
confirm findings of previous research. As expected, the best loading curve is the linear case. For
this case the overall network average clearance time was 14.6 hours. The steep loading curve
resulted in overall network average clearance time of 18.2 hours. The standard loading curve has
produced clearance times that fell between the linear and steep cases showing an overall network
average clearance time of 17.1 hours. The standard loading curve has produced clearance times
that extend beyond the 12 hour evacuation window.
Being the traffic simulation software, INTEGRATION output was used as the baseline for
assessing the ARENA model. A comparison between the two model outputs clearly showed that
there are statistically significant differences for this network. It is hypothesized that because of
the logic that ARENA uses in moving entities through the network (constant speed belt

movements), the procedure used in coding origin-destination information, the simplified
assumptions about turning movements and signal timings, and the lack of interaction among
different entities (car-following and lane change logics), the results obtained from this model
were vastly different from the INTEGRATION model. It is safe to say that the INTEGRATION
model has produced reasonable results and the developed framework can be expanded and
applied to bigger urban areas.

i
TABLE OF CONTENTS
INTRODUCTION .......................................................................................................................................................1
OBJECTIVE AND TASKS: .............................................................................................................................................1
LITERATURE REVIEW ...........................................................................................................................................1
CATEGORIES...............................................................................................................................................................1
Modeling................................................................................................................................................................2
Behavior ................................................................................................................................................................5
Operations .............................................................................................................................................................6
Hazards..................................................................................................................................................................8
FINDINGS OF LITERATURE REVIEW ............................................................................................................................9
EVACUATION PROCEDURES........................................................................................................................................9
CONCEPTUAL FRAMEWORK OF EMERGENCY EVACUATION...............................................................12
HAZARD PREDICTION MODULE (HPM)....................................................................................................................12
HUMAN BEHAVIOR MODULE (HBM) .......................................................................................................................13
EMERGENCY MANAGEMENT DECISION SUPPORT MODULE (EMDSM)....................................................................13
EVACUATION TRAFFIC SIMULATION MODULE (ETSM) ...........................................................................................13
TRAFFIC MODELING AND SIMULATION .......................................................................................................13
INTEGRATION ......................................................................................................................................................14
ARENA (ROCKWELL SOFTWARE) ...........................................................................................................................14
Building Models...................................................................................................................................................15
Animating and Verifying Models .........................................................................................................................16
Analyzing Models ................................................................................................................................................16
RESEARCH METHODOLOGY .............................................................................................................................16
DATA COLLECTION ..................................................................................................................................................16
Roadway ..............................................................................................................................................................16
Census..................................................................................................................................................................17

ii
DATA PROCESSING/FUSION......................................................................................................................................17
PROJECT CASE STUDY ........................................................................................................................................17
STUDY OUTLINE.......................................................................................................................................................18
MODEL DEVELOPMENT ............................................................................................................................................20
INTEGRATION....................................................................................................................................................20
ARENA.................................................................................................................................................................23
SIMULATION ASSUMPTIONS .....................................................................................................................................27
Evacuation Volume..............................................................................................................................................27
Departure Window ..............................................................................................................................................27
Destinations .........................................................................................................................................................27
Background Traffic..............................................................................................................................................28
Signalization ........................................................................................................................................................28
SIMULATION SCENARIOS..........................................................................................................................................28
Loading Curve .....................................................................................................................................................29
ANALYSIS/RESULTS..............................................................................................................................................30
INTEGRATION ......................................................................................................................................................30
Loading Curve N1 ...............................................................................................................................................30
Loading Curve N2 ...............................................................................................................................................31
Loading Curve L3................................................................................................................................................32
ARENA ...................................................................................................................................................................32
CONCLUSIONS AND RECOMMENDATIONS FOR FURTHER RESEARCH..............................................33
OUTPUT COMPARISON..............................................................................................................................................34
OBSERVATIONS ........................................................................................................................................................35
IMPLEMENTATION ....................................................................................................................................................36
RECOMMENDATIONS FOR FURTHER RESEARCH........................................................................................................37

iii
LIST OF TABLES
TABLE 1 – EVACUATION DESTINATIONS ......................................................................................................................28
TABLE 2 – LOADING CURVE PARAMETERS...................................................................................................................29
TABLE 3 – N1 OVERALL NETWORK STATISTICS...........................................................................................................30
TABLE 4 – N1 STATISTICS BY DESTINATION ................................................................................................................31
TABLE 5 – N2 OVERALL NETWORK STATISTICS...........................................................................................................31
TABLE 6 – N2 STATISTICS BY DESTINATION ................................................................................................................31
TABLE 7 – L3 OVERALL NETWORK STATISTICS ...........................................................................................................32
TABLE 8 – L3 STATISTICS BY DESTINATION.................................................................................................................32
TABLE 9 – N1 OVERALL NETWORK STATISTICS...........................................................................................................33
TABLE 10 – N1 STATISTICS BY DESTINATION ..............................................................................................................33
TABLE 11 – CLEARANCE TIME CONFIDENCE INTERVALS .............................................................................................34
TABLE 12 – DESTINATION VOLUME CONFIDENCE INTERVALS .....................................................................................35
LIST OF FIGURES
FIGURE 1 – CONCEPTUAL FRAMEWORK FOR EVACUATION ..........................................................................................12
FIGURE 2 – ARENA SCREENSHOT ...............................................................................................................................15
FIGURE 3 – DAYTONA BEACH AREA OF STUDY............................................................................................................18
FIGURE 4 – VOLUSIA COUNTY ZIP CODE MAP .............................................................................................................19
FIGURE 5 – IDENTIFIED STORM SURGE AREAS .............................................................................................................20
FIGURE 6 – INTEGRATION SCREEN CAPTURE...........................................................................................................21
FIGURE 7 – I-95 / US-1 INTERCHANGE .........................................................................................................................22
FIGURE 8 – ORMOND BEACH TAZ/OD LAYOUT ..........................................................................................................23
FIGURE 9 – ACCUMULATING CONVEYOR TERMINOLOGY.............................................................................................24
FIGURE 10 – ARENA NETWORK..................................................................................................................................26
FIGURE 11 – I-95 /US-1 INTERCHANGE IN ARENA......................................................................................................26
FIGURE 12 – LOADING CURVE SCENARIOS...................................................................................................................29
1
Introduction
Emergency situations can require a regional ability to move large numbers of people in a safe
and timely manner. A region’s evacuation strategy encompasses a variety of areas and needs,
many of these interdependent and interrelated.
Objective and Tasks:
The main objective of this project is to examine the policies, procedures, and components that
affect and are affected by emergency evacuation events. It will further look at the relationships
between a number of identifiable components that make up emergency evacuation, and how they
can be integrated into a framework for modeling emergency evacuation. The proposed tasks for
this study include:
1. Thoroughly review the literature for past studies.
2. Identify available transportation evacuation models that are in the public domain and
proprietary.
3. Formulate the framework for emergency evacuation.
4. Test the proposed framework on a selected site in the Central Florida region.
Literature Review
Emergency evacuation encompasses a wide variety of subjects and specific situations. Within the
body of literature are discussions ranging from individual evacuation from ships and buildings to
regional evacuations. It is this latter subject area that is of interest in this project.
Categories
Regional evacuation literature covers numerous aspects of the evacuation process, from high
level management and governmental resource allocation, to individual reactions to hazards or
threats. For the purposes of this review, these areas have been subdivided into four separate
categories: Modeling, Behavior, Operations, and Hazards.
2
Modeling
Modeling encompasses an examination of the simulation aspects of the evacuation problem. It
addresses the use of various traffic simulation packages, including PARAMICS, as well as other
packages developed specifically for evacuation, such as OREMS. (1) A simulation model was
developed to predict with a certain degree of probability the optimal escape routes from the
coastal areas of the Rio Grand Valley using Witness 7.0. (2)
One paper presents a software architecture whose main goal is the support of coordination
operations during the management of an emergency and in particular during a population
evacuation from a risky urban zone. The paper also describes the multimodal system and all the
actors involved. ["multimodal" does NOT refer to transportation modes]. (3)
In another study, researchers investigated the effectiveness of simultaneous and staged
evacuation strategies in different road network structures using agent-based simulation. With the
aid of agent-based modeling, this study was able to model traffic flow at the level of individual
vehicles and to present the collective behaviors resulting from the interactions of individual
vehicles during an evacuation in a natural way. The study used the default rules in a simulation
software package called PARAMICS for trip generation, destination choice, and route choice in
the simulations. (4)
Another article documents the development of a computer simulation model for rural network
evacuation under natural disasters. The model testing and validation are also discussed.
Evacuation time is more sensitive to changes in the S-curve slope factor than the loading time
factor. (5) A model has also been developed specifically to target evacuation planning and
operation around nuclear power plants (TEDSS 3.0). (6,7)
Urbanizing development into high fire risk areas at this interface is at the highest risk of possible
evacuation. It is important that modeling techniques be explored to estimate this risk in such
areas by estimating the time it would take to clear a residential neighborhood if an evacuation is
needed. To test the efficacy of a bulk lane demand model, this report presents a special
transportation simulation model that was developed for this neighborhood to test evacuation
scenarios. The simulation model was developed using a special purpose micro-scale traffic
simulation system, called PARAMICS. (8)

3
The major focus of another research project was to model transit issues associated with hurricane
evacuation planning. However, the specific objectives were to use a traffic operations based
hurricane evacuation model to determine the expected time to evacuate the entire population;
identify the locations of the potential traffic bottlenecks; and assess traffic operation strategies
aimed at mitigated the resulting congestion. (9)
The Hurricane/Flood Transportation Evacuation Study for the City of Virginia Beach addresses
the most important question in a comprehensive emergency plan as to when an evacuation order
should be issued in case of imminent disaster. Using a computer simulation model called
MASSVAC and based on different levels of hurricane/flood intensities and various threat
scenarios, evacuation routes were identified, Shelter assignments were made, traffic bottlenecks
were spotted and traffic management strategies were introduced to solve them, and the travel
times for evacuating threatened populations to safe areas were calculated. (9)
One study presents a conceptual framework for an integrated and modular decision support
system for hurricane emergency management. In this framework, the integration technology is
considered to be a distributed computer and communications network which integrates all the
other modules (GIS, emergency planning, prediction and tracking, emergency management and
control, damage assessment before and after the hurricane, communication) under a particular
coordination. Software called REMS (Regional Evacuation Modeling System developed at
University of Florida) is used to estimate the evacuation time and the traffic flow on a given
transportation road network by simulation and several network optimization models incorporated
into the software. REMS is used to find the optimal allocation of evacuees to shelters based on
minimum evacuation time and through the least congested roads. Furthermore, input data
regarding traffic conditions could be fed into the software to analyze the effects of these
conditions on the bottleneck roads and evacuation times. (10)
Another study presented an integrated system design for evacuation similar to the study cited
above. In their case, a traffic flow simulator (a multi agent system in which agents represent road
lanes containing groups of cars, observers and actors who address vehicles towards specific
roads) is used to integrate several human behavioral parameters and fortuitous factors such as
different type of accidents and to simulate evacuation scenarios. (11)

4
One study presented an integrated information management system called IMASH (Information
Management System for Hurricane disasters) which can provide data pertaining to emergency
planning and response for hurricane disasters. It is based on an object-oriented database
containing geographical environment and related data and it employs a decision support system
utilizing the internet and the World Wide Web. (12)
An investigation reported on challanges faced in simulation modeling and geographical
information systems in a spatial decision support system (SDSS) which is viewed as a linkage
between GIS and modeling approaches such as OR/MS. The challanges mentioned include the
realistic modeling of evacuee behavior, decision-making process that takes place during an
evacuation, logistical issues, the generation of realistic scenarios, the validation of assumptions
made in SDSS design and the validation of the SDSS. (13)
Another study explored a prototype spatial decision support system, particularly CEMPS
(Configurable Emergency Management and Planning System) under development to use in
developing contingency plans for evacuations. The system is not intended for real-time use but
rather as an aid for emergency planning which integrates a geographical information system with
a specially written object-oriented micro-simulator. They basically discuss several properties of
CEMPS and how it runs together with the difficulties such as slow run times. (14)
This paper presented an optimization model called the critical cluster model which can be used
to identify small areas or neighborhoods which have high ratios of population to exit capacity,
i.e. risky evacuation regions where two simple measures are used as surrogate measures of
evacuation risk. The first one is the clearing time for a particular neighborhood. It is calculated as
the ratio of the population of the neighborhood (estimated as the product of the number of houses
times the number of people per household) divided by the people per vehicle during a sudden
evacuation of the neighborhood over the capacity of outbound lanes of the neighborhood in
vehicles per minute. In this case, the evacuation risk is the ratio of bulk demand per lane in units
of vehicles per lane that must evacuate. They formulate the problem as a nonlinear constrained
optimization problem and then gave an equivalent special mixed integer program by putting a
bound on the original nonlinear objective function and putting it into the constraints which can
be solved optimally or using a heuristic algorithm. The model basically takes a given node of
interest in a small region and tries to find the smallest critical neighborhood of the connected
nodes and arcs about that node (i.e. the objective function) with the evacuation risk bigger than a

5
specified bound. Once the critical neighborhoods with high evacuation risk are identified, these
can be mapped using a risk contour map or by classifying each node according to its relative risk
values and mapping nodes and arcs using coloring according to risk values. The paper also
discussed the integration of the critical cluster model with the GIS and a small application is
presented. (15)
This study documented a network flow model for identifying optimal lane-based evacuation
routing which can be used in neighborhoods and rural areas. They formulated the problem as a
mixed-integer program as an extension of the minimum-cost flow problem and solved a sample
network routing problem via CPLEX 7.0. They consider minimizing the total travel distance
with two other objectives of reducing (or eliminating) merging by imposing an upper bound on
the number of merges and intersection crossing. Several routing plans were generated under
various demand levels and different traffic volume to capacity ratios. They used microscopic
traffic simulation (PARAMICS) to reinforce the results obtained through the model by
comparing the routing plans generated by the model to the no routing plan (i.e. random
destination choice) for a sample network using the mean network clearing time as the
performance measure. They found out that removing crossing conflicts are beneficial regardless
of the level of merging. They also observed that minimizing merging-conflicts has
approximately the same network clearance time as a shortest distance or balanced plan when an
efficient intersection control via timed signaling is introduced at merging traffic. (16)
Behavior
Behavior addresses the human reaction to the emergency evacuation situation. Papers covered a
number of factors, including gender, age, type of emergency, and model considerations. (17) A
review of the literature on how the elderly respond in disasters indicates there are patterns of
vulnerability in the social, psychological, and physiological dimensions. Differential
vulnerability between elderly and non-elderly disaster victims is summarized and discussed.
Effective disaster policies and programs will specifically target the elderly population. (18)
Another paper undertakes a series of bivariate and multivariate analyses to examine the
relationship between evacuation and gendered variations in socioeconomic states, care-giving
roles in the household, evacuation incentives, exposure to risks, and perception of risk. Results
indicate that women are more likely to evacuate than men. (19)

6
The authors of another paper examined the experiences of households that included a member
with a physical disability and contrasted them with those of other households. It was found that
households with physically disabled members were less likely to evacuate than others. (20) A
survey of coastal South Carolina residents addressed the role of household decisions in
amplifying demand on transportation infrastructure. Three major findings reveal that traffic
problems are becoming a major consideration in whether people evacuate. How they evacuate is
emerging as an issue for evacuation traffic planning. First, about 25% took two or more cars.
Nearly 50% left in one 6-hr period. Second, while the majority of respondents carried road maps,
only 51% of those used them to determine their route.
Operations
Work in this area examines the various policies and procedures that can be implemented to speed
the evacuation process. One such example is the conversion of highways to one-way facilities to
in effect double the traffic capacity. This policy is not without concerns, however; traffic
management is a key issue, both in implementation and enforcement. (21)
It is now apparent that coastal areas are not all suitably equipped to deal with the threat of severe
hurricanes. As a result, a significant percentage of the coastal population is forced to evacuate
under the threat of major hurricanes. One method suggested to address the need to evacuate large
numbers of people in a rapid and efficient manner is to contra-flow segments of interstate
freeway. This paper discusses the advantages and disadvantages of contra-flow operation. (22)
As a result of the SWIDRCC-Sandia partnership, a policy portfolio for the SWIDRCC has been
developed and a significant technology development activity has been structured using the
virtual issue process (VIP). VIP is a strategic planning tool developed by Sandia to provide
concise information from a community or group that can be used to resolve complex issues and
problems. The disaster management system that was defined as the result of the VIP will
integrate sensor technologies, modeling and simulation tools, telemetry systems, and computing
platforms, in addition to non-automated elements including increased community education and
involvement. The prototype (infrastructure modeling tool), which was developed using AweSim
simulation software, presents three animations that convey the tool's potential to display disaster
effects and responses with various levels of detail. (23)

7
So far, modeling of human behavior is one of the weakest components of the flood management
policy analysis. Better understanding of the human behavior in response to a disaster and our
ability to capture it in a model is a valuable addition to flood management policy analysis. This
paper presents a system dynamics model that captures dynamic interaction among different
components of the flood management system. The model provides a decision support tool for
evaluation of both economic impacts and evacuation preparedness for various policy alternatives
for flood management in an integrated way. Social factors such as age, income group, etc, along
with external factors like rain and inundation conditions give rise to danger recognition rate.
Then based on evacuation orders and behavior of others, evacuation decision is made. The
simulation model is implemented in the STELLA environment. (24)
To better deal with future evacuations, emergency management and transportation officials in
hurricane threatened states are seeking to apply traffic and weather sensing technologies to gain
access to more timely and accurate information on the status of evacuation routes. (25)
One paper presents a methodology to analyze and evaluate the impacts of different factors
affecting large-scale emergency evacuations from a traffic operations perspective. The
methodology revolves around a microcomputer-based system developed at Oak Ridge National
Laboratory (ORNL) to simulate traffic flow during emergency vehicular evacuations that are the
results of natural disasters or man-made catastrophes. This discussion concentrates mainly on
how the features and capabilities of the ORNL system can be used to model those alternatives
and, where available, some quantitative results are also presented. (26)
One article describes the plan to evacuate the city of New Orleans when under threat of a major
hurricane. It also highlights the problems that are particular to evacuating the city and the
creative ways that disaster and transportation planning agencies are working to solve them. This
feature also presents, from a transportation perspective, several other critical issues that affect the
movement of people during evacuations. (27) Along the same line, another study was conducted
to review the current emergency evacuation procedures in Alabama and to investigate the
potential use of GIS and ITS technologies along the Gulf Coast of Alabama. (28)
Public warning practices are decentralized across different governments and the private sector.
Uneven preparedness to issue warnings exists across local communities; hence, people are
unevenly protected from the surprise onset of natural disasters. Without changes in this situation,

8
inequalities will grow larger, and the gains made in saving lives over the past decades may well
be reversed. (29)
Another report described a simplified vulnerability assessment model applied to the state of
Rhode Island for use in statewide disaster mitigation planning. A practical scoring approach was
developed to quantify vulnerability for multiple hazards and exposures in different regions of the
state. (30)
Storm-damage assessment, for both repairs and assessing vulnerability, involves a subjective
process of working with local communities to identify their highest priorities and support
combined with objective inventory of the transportation system and identification of hazards and
repair options. Through two grants awarded to FDOT’s ITS Office (one by the Federal Highway
Administration, and one by FDEM grant), a web-based tool has been designed by PBS&J for
entering, editing, and tracking statewide hurricane evacuation traffic data. This tool, known as
HEADSUP, allows the user to run alternate evacuation scenarios based on user-specified
behavioral and socioeconomic information. The web-based tool includes a Graphical User
Interface (GUI) that allows users with permitted access, the capability of running storm scenarios
utilizing county evacuation plans to project evacuee travel movements across county lines and
along designated evacuation routes. In addition, the tool allows the user to see expected
evacuation congestion levels to assist in determining evacuation times. (31)
Hazards
There are a number of hazards that are of concern to the transportation community; these hazards
can require the massive relocation of people to safe areas. Each type has unique concerns that
can affect the transportation network in different ways. (32)
One element of this research, planning, and outreach initiative is a natural hazard mitigation and
emergency preparedness planning process that combines technical expertise with local
stakeholder values and perceptions. This paper summarizes and examines one component of the
process, the vulnerability assessment methodology, used in the pilot port and harbor community
of Yaquina River, Oregon. (33)
Far less attention has been spent on the warning communications process, behavioral response,
and epidemiology of tornadoes. The translation of improved technologies into better tornado

9
forecasting and warning services must also involve the incorporation of physical and social
science. (34) Because locally generated tsunamis provide such little time for warning,
communities need to be informed of the exact areas that could be inundated and the precise
routes for self-evacuation. (35)
Findings of Literature Review
The thorough review of past studies and available simulation and optimization models resulted in
the following observations:
1. All emergency evacuation models adopt a loading curve for the transportation network
that follows an “S” curve. Published studies on human behavior lacked the data to
support this assumption about the “S” curve and it appears that there is a need to carryout
further investigations on this subject.
2. The available computer simulation models like HEADSUP, IDYNAV, and OREMS are
proprietary. The developers are reluctant to release these models for us to investigate
further. Other traffic models like PARAMICS and WATSIM are designed to simulate
current conditions on existing roads and they have no capabilities to estimate network
clearance time. We may investigate the option of developing our own software to meet
our needs.
3. Top level optimization algorithms are limited in scope and there is room for improvement
to these models. A scoring system may be used to identify areas with highest priority for
evacuation. It also proposed that a GIS system supplemented by contour line mapping be
used to identify traffic bottlenecks downstream of an evacuation route. By addressing
these problem points first a smoother evacuation process may be developed that will
reduce network clearance time.
Evacuation Procedures
In order to reduce the threat levels of at-risk populations in the event of a hazardous situation,
regional and local agencies implement procedures developed based upon the various components
identified in the previous section. These procedures, however, require that personnel be able to
evaluate particular areas within a region for risk level.

10
The Federal Emergency Management Agency (FEMA), through its Chemical Stockpile
Emergency Preparedness Program (CSEPP), has developed a system of evacuation based on
Emergency Planning Zones (EPZ). This program was established in response to a congressional
mandate to destroy existing stockpiles of chemical weapons while limiting potential risk to local
populations and environment. [4] According to FEMA1, most CSEPP communities have
established two planning zones for emergency planning purposes. The Immediate Response
Zone (IRZ) is
the area closest to the site where chemical munitions and agents are being stored
until they can be destroyed. This zone, usually within a six to nine mile radius of the
stockpile, would require the quickest warning and response. People living or
working in this zone may need to take protective measures quickly.
The Protective Action Zone (PAZ) is
the area immediately beyond the Immediate Response Zone, This zone extends to a
radius of six to 31 miles from the stockpile. Protective measures may be necessary in
this zone, but there would be more time for warning and response.
A third zone, the precautionary zone (PZ), is the outermost EPZ and extends from the PAZ outer
boundary to a distance where the risk of adverse impacts to humans is negligible.
Within the transportation management realm, planners subdivide study regions (typically non-
rural) into traffic analysis zones (TAZ). A number of guidelines are used to establish TAZ
boundaries. [2]
1. Socioeconomic characteristics should be homogeneous.
2. Intrazonal trips should be minimized.
3. Physical, political, and historical boundaries should be utilized where possible.
4. Zones should not be created within other zones.
1 CSEPP: Protective Actions, http://www.fema.gov/rrr/csepp4.shtm
11
5. The zone system should generate and attract approximately equal trips, households,
population, or area.
6. Zones should use census tract boundaries where possible.
Within the state of Florida, the Florida Geographic Data Library (FGDL)2, maintained by the
University of Florida, serves as a clearinghouse for satellite imagery, aerial photographs and
spatial (GIS) data. According to the website, “The Florida Department of Environmental
Protection (FDEP) has been the lead agency contributing to the development of the FGDL, but
the Florida Department of Transportation (FDOT) has also contributed a great deal to the
FGDL.”
The metadata definition for a TAZ is “a statistical entity delineated by state and/or local
transportation officials for tabulating traffic-related census data.” According to the US Census
definition, this data focuses particularly on journey-to-work and place-of-work statistics. In
addition, a TAZ usually consists of one or more census blocks, groups, or census tracts.3
Whereas EPZ boundaries are determined based upon risk analyses that take into consideration
the specific types of agents and munitions stored, as well as local weather and geographic
conditions, TAZ boundaries consider none of these, and to a certain extent are the antithesis of
the EPZ. However, most if not all urbanized areas are divided into TAZs, while only regions
subject to known chemical or nuclear hazards are required to have defined EPZs.
Given the variability of many evacuation events, the use of EPZ is too limited to provide
guidance in evaluating regional evacuation needs. It is here that the use of TAZs could prove
beneficial, and will be one subject of this project.
It should be noted that each of these optimization techniques described earlier utilizes the
concept of the EPZ when developing evacuation strategies.
2 http://www.fgdl.org 3 http://www.census.gov
12
Conceptual Framework of Emergency Evacuation
Evacuation of a region involves a number of inputs, controls, and assumptions. This is
particularly important when developing a computer simulation model; these external factors
affect the initial and operating conditions of the simulation, directly affecting the model outputs.
Based upon the literature review, the four general areas can serve as “modules” in a conceptual
framework for evacuation. These modules represent the type of hazard, evacuee behavior,
agency decisions, and transportation modeling.
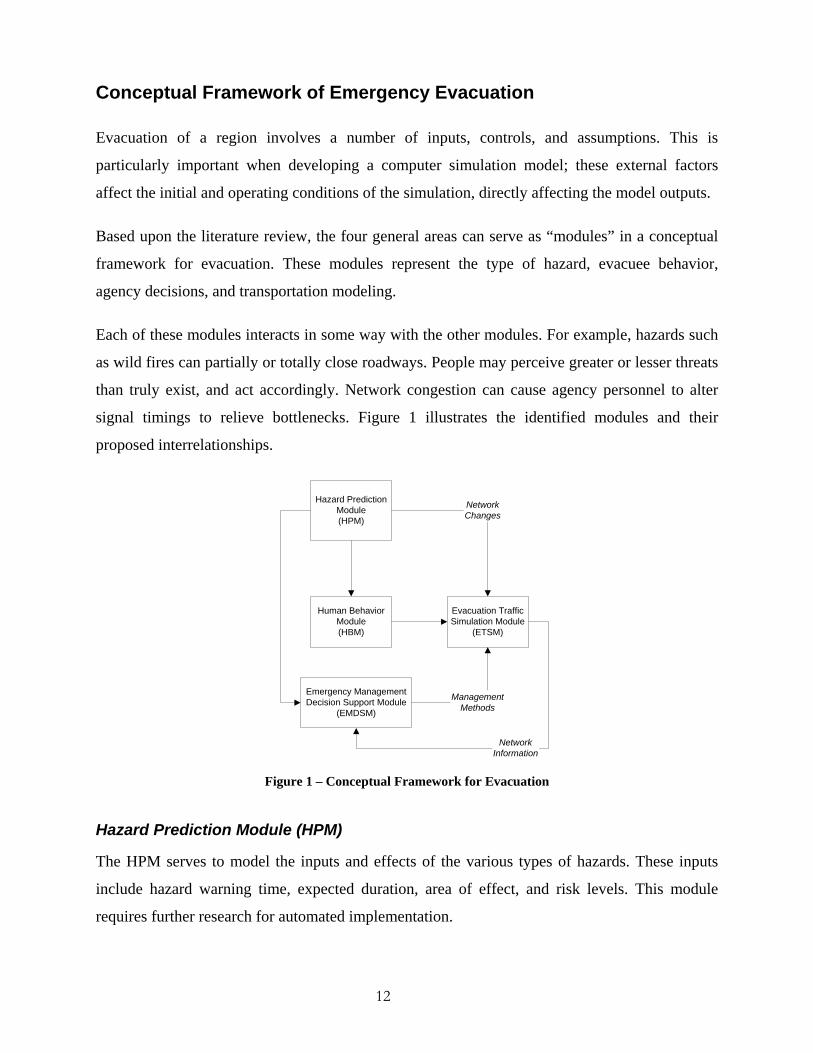
Each of these modules interacts in some way with the other modules. For example, hazards such
as wild fires can partially or totally close roadways. People may perceive greater or lesser threats
than truly exist, and act accordingly. Network congestion can cause agency personnel to alter
signal timings to relieve bottlenecks. Figure 1 illustrates the identified modules and their
proposed interrelationships.
Hazard PredictionModule(HPM)
Human BehaviorModule(HBM)
Evacuation TrafficSimulation Module
(ETSM)
NetworkChanges
Emergency ManagementDecision Support Module
(EMDSM)
ManagementMethods
NetworkInformation
Figure 1 – Conceptual Framework for Evacuation
Hazard Prediction Module (HPM)
The HPM serves to model the inputs and effects of the various types of hazards. These inputs
include hazard warning time, expected duration, area of effect, and risk levels. This module
requires further research for automated implementation.

13
Human Behavior Module (HBM)
The HBM represents the various behavioral aspects of evacuees. Input parameters include age,
gender and economic demographics, expected evacuation compliance, and assumed loading
curve parameters. Work is ongoing in identifying and developing human behavior models as
regards emergency evacuation.
Emergency Management Decision Support Module (EMDSM)
The EMDSM takes into account agency decisions such as resource allocation and road closures.
Also part of this is signal timing plan implementation, phasing changes, and field control of
signals. This module represents agency-level discussions and decision making; therefore
automation is likely not functional, nor suggested.
Evacuation Traffic Simulation Module (ETSM)
The ETSM represents the traffic simulation program, and includes the model parameters inherent
in the application. It also includes the physical data from the traffic network, such as intersection
coordinates, link lengths, lanes, speed limits, etc. Program selection for this module is subject to
local needs and program capabilities.
Traffic Modeling and Simulation
Numerous traffic modeling packages were available for use in this project. Proprietary software
was eliminated from consideration, and only commercially available software was evaluated.
Flexibility, output data options, ease of implementation, and applicability were primary factors in
software selection. Two candidates were seriously considered for this research, INTEGRATION
and DYNASMART. A lead member of the research team has had experience with the
INTEGRATION model at the inception of this project. Furthermore, at the time this project
commenced DYNASMART was not officially released for public use. It was decided to use
INTEGRATION as the research tool for this project.
Microscopic traffic simulation models have been on the market for over thirty years. They have
been proven to be good tools for evaluating network performance under different operation and
control settings. They require large amount of data inputs and because of its microscopic nature
14
then tend to require long running times to accurately simulate existing conditions. To explore
other simulation alternatives we, the research team have decided to use another software,
ARENA, which uses discrete event simulation, as an alternative to the INTEGRATION model. It
is hoped that ARENA provides an alternative tool that is easy to code, runs faster, and produce
credible and reliable results.
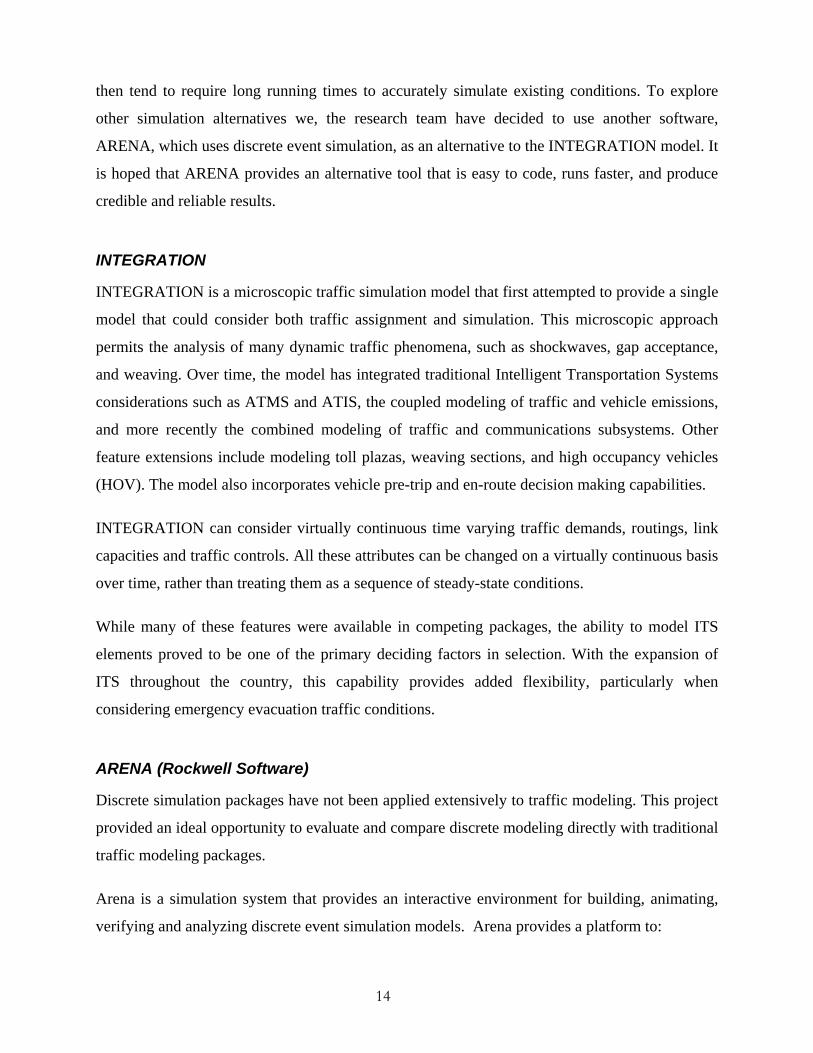
INTEGRATION
INTEGRATION is a microscopic traffic simulation model that first attempted to provide a single
model that could consider both traffic assignment and simulation. This microscopic approach
permits the analysis of many dynamic traffic phenomena, such as shockwaves, gap acceptance,
and weaving. Over time, the model has integrated traditional Intelligent Transportation Systems
considerations such as ATMS and ATIS, the coupled modeling of traffic and vehicle emissions,
and more recently the combined modeling of traffic and communications subsystems. Other
feature extensions include modeling toll plazas, weaving sections, and high occupancy vehicles
(HOV). The model also incorporates vehicle pre-trip and en-route decision making capabilities.
INTEGRATION can consider virtually continuous time varying traffic demands, routings, link
capacities and traffic controls. All these attributes can be changed on a virtually continuous basis
over time, rather than treating them as a sequence of steady-state conditions.
While many of these features were available in competing packages, the ability to model ITS
elements proved to be one of the primary deciding factors in selection. With the expansion of
ITS throughout the country, this capability provides added flexibility, particularly when
considering emergency evacuation traffic conditions.
ARENA (Rockwell Software)
Discrete simulation packages have not been applied extensively to traffic modeling. This project
provided an ideal opportunity to evaluate and compare discrete modeling directly with traditional
traffic modeling packages.
Arena is a simulation system that provides an interactive environment for building, animating,
verifying and analyzing discrete event simulation models. Arena provides a platform to:

15
• Model processes to define, document and communicate
• Simulate the future performance of a system to understand complex relationships and
identify opportunities of improvement
• Visualize operations with dynamic animation graphics
• Analyze how the system will perform in its “as-is” configuration and under a myriad of
possible “to-be” alternatives.
Building Models
Arena is composed of discrete event simulation libraries that contain the basic simulation
building blocks or modules; such as create, process, queue and resources, and more advanced
ones such as resource schedules and entity holds. Users can build simulation models to fit their
specific business needs by using these modules. Arena allows users to build models by using the
dynamics of building a process map. Arena uses a graphical, drag and drop interface. Users can
select a specific module from one of the module libraries and drop it in the model window, as
illustrated in Figure 2.
Figure 2 – ARENA Screenshot
By double clicking on the selected modules users can input the information that defines the
process that is being modeled. Once a model of the process is built, users can run the simulation
for a specified amount of time and collect statistics on performance measures of interest.

16
Animating and Verifying Models
Arena allows for model animation to provide users with a graphical tool to visualize their
processes. The animation functionality also provides users with a valuable means to verify that
the model being built is as the user intended to model it.
Analyzing Models
Arena also provides users with the tools to analyze the processes modeled. After each model run
Arena outputs a series of reports that reflect the behavior of the system modeled over the
specified time frame. Some common outputs include resource utilizations, process cycle times
and entity statistics. Users can then perform “what if” analysis by changing parameters within
the model and analyzing their impact on the results. Users can also make use of additional tools
within the Arena tool suite to statically analyze the results obtained and determine, for example,
if the “as is” system is in fact statistically different than the “what if” system.
Research Methodology
Two elements are necessary in order to accurately model a transportation network. First, detailed
and accurate data regarding the transportation network, demographics, etc., must be collected
and evaluated. Second, this data must be processed and formatted for consistency and ease of
implementation.
Data Collection
Data for a region comes from a variety of sources, including federal, state, and local government
agencies. Data can also come from private sources, such as tourism boards, and field
measurements.
Roadway
Roadway data includes roadway segment lengths, number of lanes, widths, etc. Signal timing
data, ITS equipment, and traffic volume data are also necessary.

17
Census
In addition to roadway data, it is necessary to know where traffic originates, its destinations, and
the timing of these origin-destination trips. This information is part of available TAZ data. In
addition, US Census data has a number of data subsets that can be used to create departure rates
for tracts, sections, and regions.
Data Processing/Fusion
Once the necessary data has been collected, it must be examined for consistency and errors. Data
points are collated and confirmed, either through correlation of the various sources or based on
field observations and measurements. Some programs may require abstractions of these data,
necessitating the interpolation of existing data to generate the new data sets. Finally, it is
necessary to convert this data into program-compatible numbers and formats.
Project Case Study
This project will examine the use of two separate tools and techniques for evaluating and
improving evacuation planning for regions and situations. The models will focus on the City of
Ormond Beach, a major coastal metropolitan area that is subject to the threat of hurricanes. In
addition, the region is host to a major sporting event, the Daytona 500, which attracts hundreds
of thousands of visitors, and is a potential target for terrorist activity. Figure 3 shows the study
area boundaries.

18
Figure 3 – Daytona Beach Area of Study
Study Outline
One piece of this project will evaluate microscopic versus discrete simulation for use in
evacuation modeling. A number of factors that will be considered include time to build the
network and calibrate the models, the ability to quickly evaluate various traffic and emergency
scenarios, and the usefulness of the models in identifying the congestion and routing problems
that occur during an evacuation event.
A second piece of this project will examine the possibility of using the discrete event modeling
software to develop and optimize evacuation priority strategies and use the output as input to the
microscopic simulation for testing and validation.
Volusia County has established guidelines specifically for hurricane evacuation, though these
requirements could be interpreted as necessary for other emergency events. The County has
implemented evacuation procedures based on zip code. According to the Volusia County
Emergency Management website4, residents must evacuate for any category hurricane if:
4 http://www.volusia.org/storm/map.htm

19
• Live in a mobile or manufactured home (any zip code)
• Live in a low-lying or flood-prone area.
• Live in one of the following zip codes; 32110, 32136, 32176, 32118, 32169 and
peninsula residents in 32127.
In addition, residents may need to evacuate, depending on the category hurricane, if they reside
in the following zip code areas: 32174, 32114, 32117, 32119, 32129, 32132, 32141, 32759,
32168 and non-peninsula residents in 32127. Figure 4 shows Volusia zip codes.
Figure 4 – Volusia County Zip Code Map
The County also provides storm surge maps for the nine municipalities within the area. Figure 5
illustrates the identified surge areas for the area around Ponce Inlet.

20
Figure 5 – Identified Storm Surge Areas
Consideration must also be given to various procedures that the County will implement prior to
hurricane landfall. Of particular interest are actions taken regarding bridges, which will affect
route choices. According to the County:
• All bridges will be locked down when winds reach a sustained speed of 39 miles per hour
or and evacuation is ordered.
• Before a complete lock-down, drawbridges will be raised on the hour for 15 minutes
when boat traffic is present.
Model Development
One aspect of computer simulation is accurately replicating and representing the field elements
of the network within the computer model. Different models require a mix of data, some
identical, some very specific in nature and format.
INTEGRATION
INTEGRATION requires a number of specific sets of data in order to accurately model a
transportation network. Following are the minimum sets necessary for the program:
• Link – includes lengths, number of lanes, speed limits, turning movement restrictions
• Node – intersection and roadway geometry change coordinates

21
• Signal – timing and phasing
• Origin/Destination – vehicle origin, destination, and departure rates
Link/Node
The INTEGRATION network model is based on ArcInfo GIS data available through Volusia
County. From the GIS data, link and node information was derived and translated into a
program-compatible format. Figure 6 illustrates the INTEGRATION transportation network.
Figure 7 illustrates the I-95/US-1 interchange.
Figure 6 – INTEGRATION Screen Capture

22
Figure 7 – I-95 / US-1 Interchange
Signal
Signal timing data was acquired through the Volusia County Traffic Engineering department.
These timings were translated into a program-compatible format.
Origin/Destination
INTEGRATION models traffic data through the use of origin/destination matrices. These
matrices consist of vehicle origins, destinations, rates in vehicle per hour, and start and end times
for these rates. This data is read in and processed by the program, and vehicles are randomly
generated accordingly.
Origin and destination nodes were determined through manual evaluation of the region’s
transportation network and TAZ data. Due to software requirements and limitations, not all
streets can be included in the model. This limitation makes the traffic network development, and
consequently origin/destination determination somewhat subjective. Figure 8 illustrates the TAZ
and origin/destination configuration of the study area.

23
Each TAZ was identified and evaluated, and one or more corresponding origin/destination nodes
were placed to represent the TAZ. These nodes typically represent neighborhoods or subdivision,
though some represent specific traffic generators/attractors such as tourist destinations, schools,
or shopping centers. In addition, a node may represent a homogeneous origin, such as a mobile
home park, that is of particular interest when determining evacuation priorities.
Figure 8 – Ormond Beach TAZ/OD Layout
ARENA
ARENA offers built-in templates of graphical simulation modeling and analysis modules which
are combined to build models of quite high complexity and detail for various types of systems.
24
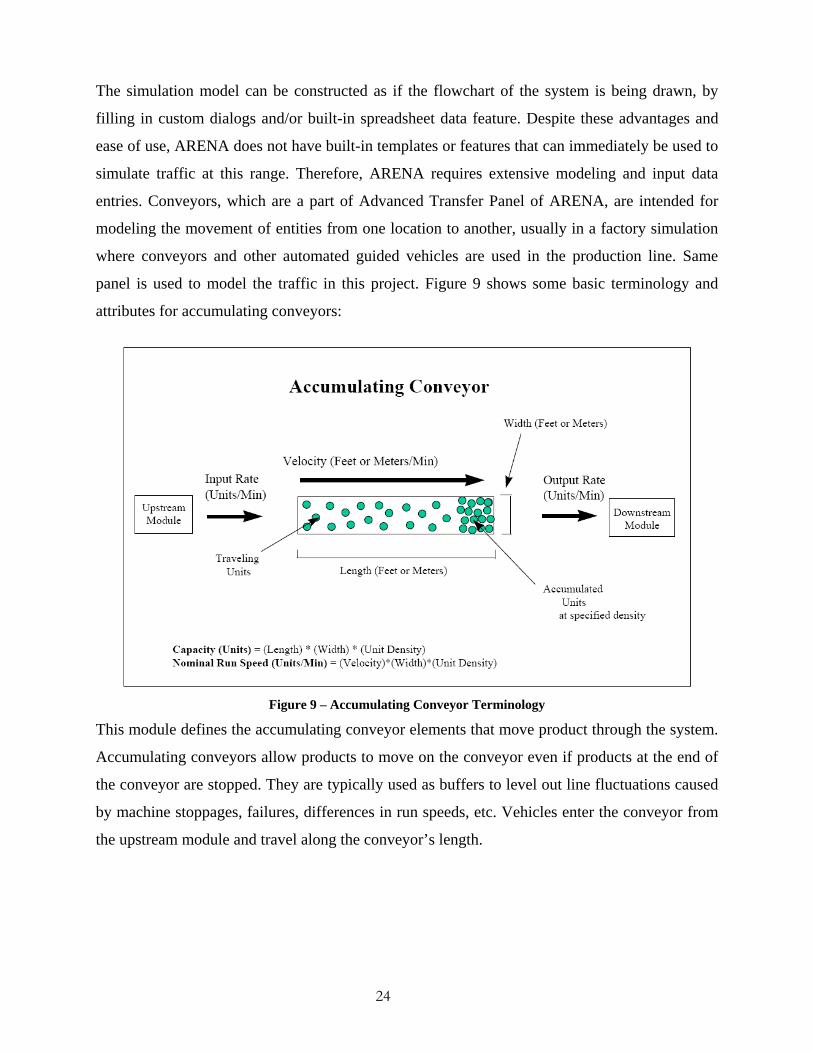
The simulation model can be constructed as if the flowchart of the system is being drawn, by
filling in custom dialogs and/or built-in spreadsheet data feature. Despite these advantages and
ease of use, ARENA does not have built-in templates or features that can immediately be used to
simulate traffic at this range. Therefore, ARENA requires extensive modeling and input data
entries. Conveyors, which are a part of Advanced Transfer Panel of ARENA, are intended for
modeling the movement of entities from one location to another, usually in a factory simulation
where conveyors and other automated guided vehicles are used in the production line. Same
panel is used to model the traffic in this project. Figure 9 shows some basic terminology and
attributes for accumulating conveyors:
Figure 9 – Accumulating Conveyor Terminology
This module defines the accumulating conveyor elements that move product through the system.
Accumulating conveyors allow products to move on the conveyor even if products at the end of
the conveyor are stopped. They are typically used as buffers to level out line fluctuations caused
by machine stoppages, failures, differences in run speeds, etc. Vehicles enter the conveyor from
the upstream module and travel along the conveyor’s length.

25
Data required to model the system are the following:
• Road Network Map – background image of the road network
• Link (segment) – includes the lengths, number of lanes, speed limits, turning movement
restrictions, origin and destination nodes (stations)
• Node (station) – intersection, origin, destination and turning points, not determined based
on coordinates, but rather relative to the background image of the road network
• Signal – timing and phasing
• Origin/Destination and Turning Movement Modules – departure rates at the origins,
turning percentages at each node including from and to nodes.
Road Network Map
Network model obtained through the ArcInfo GIS data available through Volusia County is
imported from AutoCAD into ARENA as a background image and used as a guide in putting the
nodes and links.
Link/Node
Each link and node information is coded individually and manually based on the data acquired
through the ArcInfo GIS data available through Volusia County as is the case for the
INTEGRATION model. Automation for data entry for the links and the nodes is not possible
when conveyors are used; therefore, dialogs and spreadsheet data features of the software are
used to fill in the necessary data. Figure 10 shows the roadway network in ARENA. Figure 11
illustrates the I-95/US-1 interchange.

26
Figure 10 – ARENA Network
Figure 11 – I-95 /US-1 Interchange in ARENA
Signal
Signal timings and phases are coded into the program manually.
Origin/Destination and Turning Movement Modules
Extensive data input are required at each node (origin, intersection, destination nodes) for the
turning movements and signals. Turning percentages were obtained from the output of the
INTEGRATION model and entered into ARENA model manually at each intersection.
27
Departure rates are converted into scheduled releases at each origin, randomized based on non-
homogenous Poisson process. ARENA’s Graphical Schedule Editor is used to enter the data.
All modeling elements are constructed to comply with the model built using INTEGRATION in
order to provide a basis for fair comparison of the results.
Simulation Assumptions
Given the variability of regional factors, such as evacuation compliance levels, specific
assumptions must be made in conducting simulation of an evacuation event. Following are event
level assumptions used for the various simulation scenarios.
Evacuation Volume
Population and housing data was taken from the 1997 TAZ data provided by Volusia County.
The base case assumption is one evacuating vehicle per household; therefore, total vehicles
evacuating is equivalent to total domestic units (households) as indicated in the TAZ data.
Departure Window
All vehicles depart within a 12 hour window. It is postulated that the hurricane eye-fall through
the region is confirmed around 18 hours in advance. Once an order is issued to evacuate the
region, the residents will be confronted with few decisions to make. There is a period of four to
six hours during which families accommodate their needs and prepare for evacuation. This
assumption may not always be true however. In the 2004 hurricane season, hurricane Charlie
was predicted to make landfall in Tampa and residence of that region started evacuating. In the
last few hours Charlie changed directions and headed to Central Florida. In addition, it is
assumed that each departure origin utilizes the same departure curve, with the same departure
offset (i.e. all origins begin at the same time).
Destinations
It was assumed that all evacuees would depart to the west and north, away from an assumed
threat from the southeast. Evacuation traffic destinations were as follows:

28
Table 1 – Evacuation Destinations
Model ID Roadway Macro Destination 4 I-95 NB Interior states 14 LPGA Deland/Orlando 16 SR 40 Ocala/Deland 17 US 1 Inland 18 Old Dixie Inland
In addition, each origin had an assumed destination percentage, i.e. the percent of vehicles
(evacuees) heading to each of the identified destinations.
Background Traffic
Initial model conditions assume no traffic on the network. This represents an early morning
evacuation order, and establishes a best case condition for the network at the start of evacuation.
Included in this category is a given level of concurrent northbound thru traffic along I-95. This
traffic represents evacuees from regions south of the project study area heading to interior state
destinations (Model ID 4).
Signalization
Field timings were evaluated and found that they are insufficient for heavily directional traffic
conditions, specifically a westbound movement along the major arterials. Therefore, timings
were modified with an emphasis on favoring this directional bias. North/south arterial signals
were timed to favor movements tending to the west, or in the direction of the nearest evacuation
route.
The model assumes fixed timing operations. Cycle lengths were set to 180 seconds, and signal
offsets were calculated for SR 40 and LPGA based on posted speed limits. All other offsets were
set to zero. In addition, no phasing changes were made where protected only operations existed.
Permitted operations were eliminated where appropriate for predominant evacuation flow.
Simulation Scenarios
Three scenarios were conducted using the stated assumptions. These scenarios were based on
three different loading curves. In addition, all scenarios assumed evacuation out of the region,

29
i.e. no shelters were used as destinations. Compliance level was set at worst case, i.e. 100%. The
clearance time estimate is based on the time of arrival of the last vehicle at its destination.
Loading Curve
Using behavior literature as a guide, three loading curves were utilized. Two were based on the
S-curve and assumed a normal distribution; the third utilized a linear rate of departure.
Table 2 – Loading Curve Parameters
Curve Type Mean (Hours)
SD
N1 Normal 5.5 1.25
N2 Normal 5.5 0.75
L3 Linear 8.3 NA
Figure 12 shows the loading curves utilized, along with their cumulative functions. Curve N1
represents the nominal S-curve behavior.
Loading Curves
0
0.2
0.4
0.6
0.8
1
1.2
1 2 3 4 5 6 7 8 9 10 11 12Time Period
Pct
N1Cum N1N2Cum N2L3Cum L3
Figure 12 – Loading Curve Scenarios

30
Analysis/Results
In order to evaluate simulation results, a number of measures of effectiveness (MOE) are used
that represent real world measures of performance. The following MOEs have been identified
that will be used to judge simulation outcomes for each simulation, and between simulation
packages.
• Total Vehicle (TV) – total vehicles within simulation that complete trip
• Clearance Time (CTE) – total time required to clear the network of vehicles identified for
evacuation
• Travel Time (TT) – total travel time for all vehicles, and average time per vehicle
• Travel Delay (TD) – total delay for all vehicles, and average delay per vehicle
INTEGRATION
INTEGRATION run times varied considerably based on loading curve assumptions and
processor speed. For a 2.53 MHz Pentium 4, run times ranged from approximately 5 (L3) to 20
(N2) hours. The N1 runs required around 12 hours of clock time to complete a single run.
Loading Curve N1
Table 3 and Table 4 show the overall network statistics and statistics by destination respectively
for loading curve N1 (nominal).
Table 3 – N1 Overall Network Statistics
Run 1 Run 2 Run 3 Run 4 Run 5 Run 6 Average SD
TV 39914 39913 39912 39913 39911 39913 39912.7 1.0
CTE (hr) 18.0 17.3 16.1 17.2 16.0 18.1 17.1 0.90
TT (hr) 137444.0 150471.6 140114.5 150745.2 128804.7 158007.4 144264.6 10697.1
TD (hr) 66326.7 70737.7 64974.2 69537.1 61818.5 72873.3 67711.2 4081.0
TT (hr/veh) 3.4 3.8 3.5 3.8 3.2 4.0 3.6 0.27
TD (hr/veh) 1.7 1.8 1.6 1.7 1.6 1.8 1.7 0.10

31
Table 4 – N1 Statistics by Destination
Destination I-95 LPGA SR40 US1 Old Dixie
Measure Mean SD Mean SD Mean SD Mean SD Mean SD
TV 3935.3 1.6 17634.7 1.0 16477.7 1.6 1082.0 0.0 783.0 0.0
TT (hr) 13346.5 1496.6 67734.7 2678.8 56995.5 5972.8 2054.3 410.6 4133.6 331.7
TV (hr) 4799.5 834.5 32229.2 1885.6 29554.5 4113.4 894.4 206.3 233.7 23.6
CTE (hr) 16.9 0.9 16.7 0.8 16.7 0.9 16.0 1.8 16.2 0.6
Loading Curve N2
Table 5and Table 6 show the overall network statistics and statistics by destination respectively
for loading curve N2 (steep normal).
Table 5 – N2 Overall Network Statistics
Run 1 Run 2 Run 3 Run 4 Run 5 Run 6 Average SD
TV 40188 40187 40189 40185 40189 40186 40187.3 1.6
CTE (hr) 17.8 18.3 18.25 18.2 18.6 18.3 18.2 0.3
TT (hr) 186082.7 193017.8 187287.2 190384.4 192524.9 188332.8 189605.0 2834.7
TD (hr) 94431.4 100717.5 95290.3 100873.9 100194.8 98854.6 98393.7 2840.4
TT (hr/veh) 4.6 4.8 4.7 4.7 4.8 4.7 4.7 0.07
TD (hr/veh) 2.4 2.5 2.4 2.5 2.5 2.5 2.5 0.07
Table 6 – N2 Statistics by Destination
Destination I-95 LPGA SR40 US1 Old Dixie
Measure Mean SD Mean SD Mean SD Mean SD Mean SD
TV 4017.3 0.8 17719.3 1.2 16546.8 0.8 1116.0 0.0 787.8 0.4
TT (hr) 14396.8 387.9 90511.1 1183.9 81124.3 1492.8 2858.2 72.0 714.5 90.6
TD (hr) 7076.6 372.8 43289.4 1459.3 46631.2 1195.3 1158.1 50.0 238.4 29.4
CTE (hr) 18.2 0.3 18.2 0.3 18.1 0.3 18.1 0.3 14.2 0.3

32
Loading Curve L3
Table 7 and Table 8 show the overall network statistics and statistics by destination respectively
for loading curve L3 (linear).
Table 7 – L3 Overall Network Statistics
Run 1 Run 2 Run 3 Run 4 Run 5 Run 6 Average SD
TV 40164 40164 40164 40164 40164 40164 40164 0.00
CTE (hr) 14.6 14.6 14.6 14.6 14.7 14.5 14.6 0.05
TT (hr) 29365.4 29557.9 29396.9 29142.5 29210.5 30113.4 29464.4 349.94
TD (hr) 18055.2 18138.5 18066.1 18021.4 17730.1 18651.4 18110.5 300.35
TT (hr/veh) 0.7 0.7 0.7 0.7 0.7 0.8 0.7 0.01
TD (hr/veh) 0.5 0.5 0.5 0.5 0.4 0.5 0.5 0.01
Table 8 – L3 Statistics by Destination
Destination I-95 LPGA SR40 US1 Old Dixie
Measure Mean SD Mean SD Mean SD Mean SD Mean SD
TV 4020.0 0.0 17688.0 0.0 16524.0 0.0 1140.0 0.0 792.0 0.0
TT (hr) 2078.0 40.0 16870.1 234.1 9491.0 319.2 723.7 78.3 312.7 6.9
TD (hr) 533.9 42.4 12038.5 264.8 5292.0 279.4 194.7 57.9 65.4 3.9
CTE (hr) 14.5 0.1 14.6 0.0 14.3 0.1 14.3 0.1 12.8 0.1
ARENA
Simulations were run for loading curve N1 only. ARENA run times were approximately one
hour on a 2.5 MHz Pentium 4. Table 9 and Table 10 show the overall network statistics and
statistics by destination respectively for loading curve N1 (nominal).
33
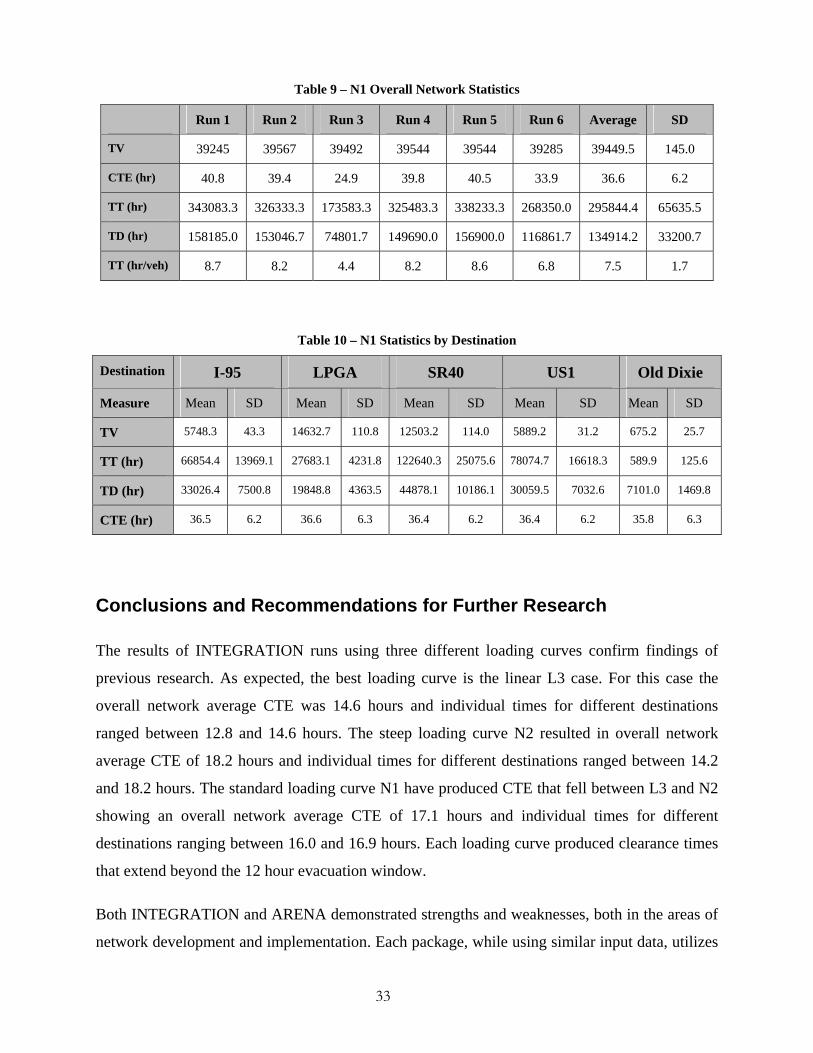
Table 9 – N1 Overall Network Statistics
Run 1 Run 2 Run 3 Run 4 Run 5 Run 6 Average SD
TV 39245 39567 39492 39544 39544 39285 39449.5 145.0
CTE (hr) 40.8 39.4 24.9 39.8 40.5 33.9 36.6 6.2
TT (hr) 343083.3 326333.3 173583.3 325483.3 338233.3 268350.0 295844.4 65635.5
TD (hr) 158185.0 153046.7 74801.7 149690.0 156900.0 116861.7 134914.2 33200.7
TT (hr/veh) 8.7 8.2 4.4 8.2 8.6 6.8 7.5 1.7
Table 10 – N1 Statistics by Destination
Destination I-95 LPGA SR40 US1 Old Dixie
Measure Mean SD Mean SD Mean SD Mean SD Mean SD
TV 5748.3 43.3 14632.7 110.8 12503.2 114.0 5889.2 31.2 675.2 25.7
TT (hr) 66854.4 13969.1 27683.1 4231.8 122640.3 25075.6 78074.7 16618.3 589.9 125.6
TD (hr) 33026.4 7500.8 19848.8 4363.5 44878.1 10186.1 30059.5 7032.6 7101.0 1469.8
CTE (hr) 36.5 6.2 36.6 6.3 36.4 6.2 36.4 6.2 35.8 6.3
Conclusions and Recommendations for Further Research
The results of INTEGRATION runs using three different loading curves confirm findings of
previous research. As expected, the best loading curve is the linear L3 case. For this case the
overall network average CTE was 14.6 hours and individual times for different destinations
ranged between 12.8 and 14.6 hours. The steep loading curve N2 resulted in overall network
average CTE of 18.2 hours and individual times for different destinations ranged between 14.2
and 18.2 hours. The standard loading curve N1 have produced CTE that fell between L3 and N2
showing an overall network average CTE of 17.1 hours and individual times for different
destinations ranging between 16.0 and 16.9 hours. Each loading curve produced clearance times
that extend beyond the 12 hour evacuation window.
Both INTEGRATION and ARENA demonstrated strengths and weaknesses, both in the areas of
network development and implementation. Each package, while using similar input data, utilizes

34
different formats, and so this data is not interchangeable between the two without much
manipulation.
Output Comparison
Being the traffic simulation software, INTEGRATION output was used as the baseline for
expected results. Using the clearance time and total vehicle measures, ARENA was compared to
INTEGRATION. Table 11 shows the 95% confidence intervals for each destination CTE, along
with the overall network CTE. It also shows the results of the statistical null hypothesis that the
difference of means is zero.
Table 11 – Clearance Time Confidence Intervals
Destination INTEGRATION ARENA Ho = 0
I-95 [15.7 - 18.1] [29.9 – 43.0] False
LPGA [15.7 – 17.2] [30.0 – 43.1] False
SR40 [15.7 – 17.8] [29.9 – 43.0] False
US1 [13.7 – 18.3] [29.8 – 42.9] False
Old Dixie [15.4 – 17.0] [29.2 – 42.4] False
Overall [16.2 – 18.1] [30.0 – 43.1] False
By inspection of the confidence intervals, it is clear that the results of the two models are
significantly different. Statistical testing of the null hypothesis supports this conclusion.
Due to the nature of the routing technique utilized in ARENA, there was no way to assign
specific destinations for vehicles departing each origin. Because of this, there was no guarantee
that destination volumes in ARENA would match those established in the INTEGRATION OD
matrix. Table 12 illustrates the destination counts for both packages, along with the results of the
statistical hypothesis that the difference of means is zero.

35
Table 12 – Destination Volume Confidence Intervals
Destination INTEGRATION ARENA Ho = 0
I-95 3935 [3933.6 – 3937.0] 5748 [5702.9 – 5793.8] False
LPGA 17635 [17633.6 – 17635.8] 14633 [14516.4 – 14748.9] False
SR40 16478 [16476.0 – 16479.4] 12503 [12383.6 – 12622.8] False
US1 1082 [1082.0 – 1082.0] 5889 [5856.4 – 5921.9] False
Old Dixie 783 [783.0 – 783.0] 675 [648.2 – 702.1] False
Overall 39913 [39911.6 – 39913.8] 39449 [39285.1 – 39602.9] False
By inspection, and statistical analysis, it is clear that the routing mechanism implemented in
ARENA does not replicate the one utilized by INTEGRATION.
Observations
Clearly there are differences between the results of ARENA and INTEGRATION models for
this network. The most important reason for the difference lies in the technique used to
implement origin-destination routing in ARENA. While INTEGRATION uses an OD matrix,
fixing the number of vehicles for each destination, ARENA does not utilize an OD matrix.
Consequently, ARENA required each intersection to have hard-coded turning movement
percentages. These percentages were provided from the results of an INTEGRATION run. The
reason for not implementing routing mechanism in ARENA to match that in INTEGRATION is
the complexity of the logic and components using a conveyor system in a microscopic level
system.
From this, it is very difficult to determine specific vehicle turning directions at each intersection.
Therefore, only overall turning percentages are available, which results in longer travel times for
vehicles following indirect paths to their destinations. This is also a likely reason for the
differences in destination volumes as shown in Table 12.
Furthermore, the turning movement percentages used at each intersection are fixed throughout
the ARENA simulation, whereas they vary over time in INTEGRATION. To implement varying
percentages in ARENA would require extensive time and resources, and even then would only

36
replicate those derived from INTEGRATION. In addition, this information would require
modification to the INTEGRATION program, or development of a unique third-party
application.
Other factors contributing to the differences may include the following:
• Signal timings and phases have been simplified to fit into the ARENA modeling
structure.
• Turning lanes were not implemented in the ARENA model due to high modeling
complexity. This affected the signal timing implementation discussed above.
• Since conveyors were used, the vehicles are assumed to follow a constant speed that is
based on the speed limit data. Acceleration and deceleration were not incorporated into
the ARENA model structure due to inflexibility in the conveyor logic. On the other hand,
the modeling multiple lanes was balanced by assigning equal entry probabilities to each
lane of a multi-lane conveyor link.
Based on this case study, there are a number of lessons learned regarding ARENA as a traffic
simulation package:
• ARENA, specifically conveyor logic, is not suitable for modeling networks of this scale.
The lower size limit was not readily identifiable.
• Building traffic models in ARENA is extremely complex and time consuming.
• ARENA models are not easily modified.
• Too many untested traffic performance assumptions are necessary to utilize ARENA.
However, ARENA simulation run times are significantly faster than INTEGRATION, though
this benefit may diminish as the network model size decreases.
Implementation
Although the city of Ormond Beach has not been involved in this research study, it is felt that the
results of the transportation evacuation can be of benefit to them. It is believed that a set of static
evacuation plans can be made available to the city decision makers to assist them with hurricane

37
preparedness plans. If the mesoscale version of INTEGRATION is acquired and used for the
same network, the run time will be cut down significantly and real time simulation runs can be
attained.
Recommendations for Further Research
A number of further steps could be taken regarding the case study region and the use of ARENA
and INTEGRATION as a traffic modeling package.
1. Determine the limiting traffic network size for ARENA.
2. Determine the sensitivity of this model to background traffic.
3. Determine the sensitivity to evacuation loading assumptions. Specifically, at what
point does the CTE cease to be a function of the loading curves.
4. Determine the sensitivity of the CTE to destination assumptions.
5. Acquire the mesoscopic version of INTEGRATION and assess its capabilities to run
the same case study in terms of running time and results.
6. Explore the impact of various background traffic scenarios on I-95 on the region
evacuation times
7. Evaluate the effectiveness of contra-flow lanes on the MOEs.
8. Assess the impact of utilizing shelters in the region on the network clearance times.
9. Identify possible ITS solutions to reduce the CTE. This might include changeable
message signs, centralized traffic control, and in-vehicle navigation systems.
10. Identify potential evacuation scheduling strategies to reduce the CTE.

38
References: 1. Farahmand, Kambiz, Application of Simulation Modeling to Emergency Population
Evacuation, Proceedings of the 1997 Winter Simulation Conference, p1181-1188, 1997.
2. Demontis, Roberto, A Multimodal Approach to Emergency Situations: Modeling with
Multi-Agent System, 9pp.
3. Chen, Xuwei, Agent-Based Simulation of Evacuation Strategies under Different Road
Network Structures, 24pp.
4. Pidd, M, A Simulation Model for Emergency Evacuation, European Journal of
Operational Research 90, p413-419, 1996.
5. Radwan, Essam, A Computer Simulation Model for Rural Network Evacuation Under
Natural Disasters, ITE Journal, p25-30, September 1985.
6. Hobeika, A, TEDSS - A Software for Evacuating People Around Nuclear Power Stations,
Applications of Advanced Technology in Transportation, p688-695.
7. Church, Richard, Modeling Small Area Evacuation: Can Existing Transportation
Infrastructure Impede Public Safety?, California DOT Final Report, April 2002.
8. Perkins, Judy, Modeling Transit Issues Unique to Hurricane Evacuations: North
Carolina’s Small Urban and Rural Areas, North Carolina A&T State University
Transportation Institute, 69pp, December 2001.
9. Hobeika, A, Virginia Beach Hurricane/Flood Transportation Evacuation Study, Virginia
Tech Department of Civil Engineering, January 1985.
10. Tufekci, S., “An integrated emergency management decision support system for
hurricane emergencies”, Safety Science, 1995, 39-48.
11. Demontis, R., Lorrai, E., Marras, V. and Moulin, C., “A Multimodal Approach to
Emergency Situations: Modelling with Multi-Agent System”, Paper presented in
Workshop on Complex Reasoning on Geographical Data, Cyprus, December 1, 2001.
12. Iakovou, E. and Douligeris, C., “An information management system for the emergency
management of hurricane disasters”, International Journal of Risk Assessment and
Management, 2001, Vol. 2, Nos. 3/4, 243-262.
13. De Silva, F.N., “Challenges in Designing Spatial Decision Support Systems for
Evacuation Planning”, Natural Hazards Research Working Paper Number 105, Natural
Hazards Research and Applications Information Center , Institute of Behavioral Science,
University of Colorado, Boulder, Co., 2000.

39
14. Pidd, M., De Silva, F.N. and Eglese, R.W., “Theory and Methodology A simulation
model for emergency evacuation”, European Journal of Operational Research, 1996, 90,
413-419.
15. Church, R.L. and Cova, T.J., “Mapping evacuation risk on transportation networks using
a spatial optimization model”, Transportation Research Part C, 2000, 8, 321-336.
16. Cova, T.J. and Johnson, J.P., “A network flow model for lane-based evacuation routing”,
Transportation Research Part A, 2003, 37, 579-604.
17. Ngo, Ehren, When Disasters and Age Collide: Reviewing Vulnerability of the Elderly,
Natural Hazards Review, p80-89, May 2001
18. Bateman, Julie, Gender and Evacuation: A Closer Look at Why Women Are More Likely
to Evacuate for Hurricanes, Natural Hazards Review, p107-117, August 2002
19. Van Willigen, Marieke, Riding Out the Storm: Experiences of the Physically Disabled
during Hurricanes Bonnie, Dennis, and Floyd, Natural Hazards Review, p98-106, August
2002.
20. Dow, Kirstin, Emerging Hurricane Evacuation Issues: Hurricane Floyd and South
Carolina, Natural Hazards Review, p12-18, February 2002
21. Wolshon, Brian, "One-Way-Out": Contraflow Freeway Operation for Hurricane
Evacuation, Natural Hazards Review, p105-112, August 2001.
22. Uddin, Nasim, Disaster Management System for Southwestern Indiana, Natural Hazards
Review, p19-30, February 2002.
23. Ahmad, Sajjad, A Decision Support Tool for Evaluation of Impacts of Flood
Management Policies.
24. Surface Transportation Security and Reliability Model Deployment.
www.ifloridanet.org/PDFs/iFL_Overview.pdf
25. Franzese, Oscar, A Methodology for the Assessment of Traffic Management Strategies
for Large-Scale Emergency Evacuations, 11pp, 2001.
26. Wolshon, Brian, Planning for the evacuation of New Orleans, ITE Journal, p44-49,
February 2002.
27. Kilim, Ramgiridhar Reddy, Evaluation of evacuation procedures during extreme weather
events for the Gulf Coast of Alabama, 15pp.
28. Sorensen, John, Hazard Warning Systems: Review of 20 Years of Progress, Natural
Hazards Review, p119-125, May 2000.

40
29. Odeh, David, Natural Hazards Vulnerability Assessment of Statewide Mitigation
Planning in Rhode Island, Natural Hazards Review, p177-187, November 2002.
30. Keller, Gordon, Rural Roads Vulnerability Reduction Assessment, Mitigation Measures,
and Training, Natural Hazards Review, p139-147, November 2002.
31. HEADSUP (Hurricane Evacuation Analysis and Decision Support Utility Program), Don
Lewis, PBS&J in Tallahassee, (850) 575-1800, email [email protected].
http://www.floridadisaster.org/
32. Wood, Nathan, Vulnerability Assessment of a Port and Harbor Community to Earthquake
and Tsunami Hazards: Integrating Technical Expert and Stakeholder Input, Natural
Hazards Review, p148-157, November 2002.
33. Golden, Joseph, The Tornado Problem: Forecast, Warning, and Response, Natural
Hazards Review, p107-118, May 2000.
34. Eisner, Richard, State of California tsunami 5-year review (1997-2001), ITS 2001
Proceedings, NTHMP Review Session, Paper R-13, p183-186, 2001.
35. Connor, Charles, Estimation of Volcanic Hazards from Fallout, Natural Hazards Review,
p33-42, February 2001.