emco title - emco - homeemco.com.pk/images/financials/2014_06_annual_accounts.pdf · mr. ahsan...
TRANSCRIPT


1

2

3
CONTENTS
Company Information and Business Items ................................................................4
Notice of Annual General Meeting ............................................................................5
Directors’ Report to the Members ............................................................................6
Financial Highlights of Last Ten Years ......................................................................10
Review Report to the Members on Statement of Compliance with Code of Corporate Governance ....................................................................11
Statement of Compliance with the Code of Corporate Governance ......................12
Auditors’ Report To The Members ..........................................................................14
Balance Sheet ..........................................................................................................16
Profit and Loss Account ...........................................................................................17
Statement of Comprehensive Income .....................................................................18
Cash Flow Statement ...............................................................................................19
Statement of Changes in Equity ..............................................................................20
Notes to the Financial Statements ..........................................................................21
Pattern of Shareholdings .........................................................................................67
Form of Proxy ..........................................................................................................71

4
Company Information
COMPANY INFORMATION
Board of Directors
Mr. Tariq RehmanMr. Shafiq A. SiddiqiMr. Haris NooraniMr. Suhail MannanMr. Javaid Shafiq SiddiqiMr. Usman HaqMr. Salem RehmanMr. Ahsan Suhail Mannan
Audit Committee
Mr. Usman HaqMr. Javaid Shafiq SiddiqiMr. Salem RehmanMr. Ahsan Suhail Mannan
Chief Financial Officer/Manager (F & A)
Mr. Riaz Ahmad
Auditors
M/s. Horwath Hussain Chaudhury & Co.,Chartered Accountants, Lahore.
Bankers
Habib Bank LimitedNational Bank of PakistanStandard Chartered Bank (Pakistan) LimitedFaysal Bank LimitedBank of PunjabNIB Bank Limited
Share Registrar
Corplink (Pvt) LimitedWings Arcade. I-K , Commercial,Model Town, Lahore.
Registered Office
4th Floor, National Tower,28-Egerton Road,Lahore.
Factory
19-Kilometre, Lahore Sheikhupura Road, Lahore.
BUSINESS ITEMS
Porcelain Insulators
• Suspension Insulator• Pin Insulator• Line Post Insulator• Cap and pin Insulator• Station Post Insulator• Indoor Switch and Bus Insulator• Apparatus Insulator• Insulator for Railway Electrification• Telephone Insulator• Low Voltage Insulator• Dropout Cutout Insulator• Bushings
Switchgear
• Disconnect Switch upto 145 kv• Metal Oxide Surge Arresters upto 430 kv(Under License from Siemens Genmany)
Chemical Porcelain
• Acid Proof Wares and Bricks• Rasching Ring and Saddles• Acid Proof Porcelain Pipes and Fitting• Acid Proof Cement
Special Porcelain
• High Alumina Porcelain• Lining Special Refractories• & Grinding Media
Ceramic Glazed Wall Tiles
• Coloured & Decorative Glazed Wall Tiles 20 cm x 20 cm x 7 mm 20 cm x 30 cm x 7 mm 25 cm x 33 cm x 7 mm
Ceramic Glazed Floor Tiles
• Vitreous & Semi Vitreous Decorative Glazed Floor Tiles 30 cm x 30 cm x 8 mm 38 cm x 38 cm x 8 mm

5
Notice of Annual General Meeting
Notice is hereby given that 59th Annual General Meeting of Members of EMCO Industries Limited will be held on 31st October, 2014 at 11.00 a.m. at the Registered Office of the Company, 4th Floor, National Tower, 28-Egerton Road, Lahore, to transact the following business;
1. To confirm the minutes of the last Extraordinary General Meeting held on 27th June, 2014
2. To receive, approve and adopt the Audited Accounts of the Company for the year ended 30th June, 2014 together with Directors’ and Auditors’ Report thereon.
3. To appoint Auditors for the next financial year and fix their remuneration. The present auditors M/s Horwath Hussain Chaudhary & Co., Chartered Accountants, retaire and being eligible, offer themselves for re-appointment.
4. To transact any other business with the permission of the Chairman.
By Order of the Board
Place: Lahore;Dated: 02.10.2014
(HARIS NOORANI) DIRECTOR CORPORATE AFFAIRS
NOTES; -
1. The Share Transfer Books of the Company will remain closed and no transfer of Shares will be accepted for registration from 23.10.2014 to 31.10.2014 (both days inclusive). No transfer will be accepted for registration during this period.
2. A member entitled to attend and vote at the General Meeting may appoint another member as his/her proxy to attend and vote instead of him/her at the meeting. Proxies must be deposited at the Company’s Registered Office not less than forty-eight hours before the time of holding the meeting. (Form of proxy is enclosed.)
3. Members through CDC, entitled to attend and vote at this meeting, must bring his/her NIC or passport to prove his/her identity and in case of Proxy must enclose an attested copy of his/her NIC or Passport. Representatives of corporate members should bring the usual documents required for such purpose.
4. Members are requested to promptly notify the change in their address, if any, to the Company’s Share Registrar M/s. Corplink (Pvt) Limited, Wings Arcade, I-K Commercial, Model Town, Lahore.

6
On behalf of the Board of Directors I welcome you to the 59th Annual General Meeting of the Company and present to you the audited report for the period ending June 30, 2014. Financial Results are as follows: -
2014 2013 (restated) Rupees Rupees Profit /(Loss) before taxation (105,878,525) (39,136,031)Taxation 2,118,963 4,426,901
(103,759,562) (34,709,130)Profit/(Loss) after Tax 1,337,042 1,350,835
Other Comprehensive Income (102,422,520) (36,264,580)
Total Comprehensive Loss (463,345,211) (446,290,910)Un-appropriated profit / (Loss) b/f 19,437,410 19,210,279
Incremental Depreciation on revaluation (443,907,801) (427,080,631)
(546,330,321) (463,345,211)Profit / (Loss) carried forward Profit / (Loss) per share (2.96) (0.99)
Review of Operating Results
In this period under review, Punjab based industry faced an unprecedented shortage of gas and electricity across the sector. Based on this situation, the Management of the Company took a strategic decision to consolidate its position through an operational restructuring that led to temporary suspension of manufacturing operations of the ceramic tile division commencing from the peak winter season of this financial year. As part of this operational restructuring, the Company is re-focusing its efforts in enhancing production in the Porcelain Insulator division.
The Company has taken strong steps to reduce direct costs and overhead costs associated with the Tile plant, and is confident the shutdown of the Tile Division will lead to significant improvement in financial results. However, the year under review has been extraordinary given the reconfiguration of cost centers, leading to significant negative pressure on the financial results of the Company.
It is to be noted that the in accordance with International Accounting Standards, the Company has stated its financial results by charging the full year depreciation of the Tile Division despite discontinuing operations for 6 months of the financial year.
Results of the individual plants are as follows:
Insulator Plant
There is an overall drop in production of the Insulator Division. Although we had sizable orders for insulators for the year under review, we could only produce 1480 tons as compared to 2282 ton last year, owing to more resources including natural gas being diverted for Tile division in the first 6 months. We also had to pay liquidated damages for delay in deliveries due to the above reasons.
This division has posted an improved operating profit of 85.726 Million as compared to Rs. 84.299 Million in the previous year due to better pricing and sales of value added products. Given the Company’s strategic plan to re-focus its energies on the Insulator plant, production and sales figures for this division will improve in the
Directors’ Report

7
immediate future. Export sales have increased marginally from Rs. 46.192 Million to Rs. 50.734 Million. The Company’s product continues to be received well in the Middle East and Europe.
Tile Plant
FY 2013 – 14 witnessed unprecedented levels of Natural Gas curtailment to the Punjab Industrial sector. Furthermore, Punjab Industries were subjected to a complete natural gas shut down for over 90 days from December 2013 till March 2014. To address this deteriorating situation, the Company Management took a decision in November 2014 to shutdown production of the tile plant in the peak winter season of the present financial year. Resultantly, the production of tile was 1.126 million M2, which is reduced from 2.617 million M2 last year. The Company Management took radical steps to curtail losses in this division through retrenchment of manpower and reduction in overhead costs. However, despite its best efforts, for the period under review, the Tile Division has declared an operating loss Rs. 100.904 Million as compared to an operating loss of Rs. 59.807 Million last year.
Future Outlook
The Company Management has taken a strategic decision to temporarily discontinue manufacturing operations of the Tile Division. The decision will be reviewed in Q3 of FY 2014 – 15 based on natural gas availability. In the mean time, the Company Management will channel available natural gas resources towards the Insulator Plant. There has been considerable investment in adding new power generation plants into the country’s energy system, which boosted demand for Insulators in FY 2013 – 14. Given that EMCO’s Insulator Division continues to remain the only plant of its kind in Pakistan and serves over 80% of the needs of the Pakistan market, the Insulator Division is expected to produce healthy financial results. Simultaneously, the Company is aggressively pursuing international product testing and international marketing campaign to capture a larger portion of the international market for Insulators.
Despite the future economic downturn, the Management is optimistic and will strive to produce better results for its stakeholders. We should pray together for a better Pakistan.
The company’s contribution to the exchequer in the year under review is Rs. 217.558 Million in the shape of import duty, sales tax, income tax and other government levies.
Code of Corporate Governance
The requirements of the Code of Corporate Governance set out by the Karachi, Lahore, and Islamabad Stock Exchanges in their Listing Regulations, relevant for the year ended June 30, 2014 have been adopted by the Company and have been duly complied with. A statement to this effect is annexed with the report.
In compliance with the provisions of the Code, the Board members are pleased to place the following statement on record:
• The financial statements for the year ended June 30, 2014 present fairly its state of affairs, the results of its operations, cash flow and changes in equity;
• Proper books of accounts have been maintained; • Appropriate accounting policies have been consistently applied in preparation of financial statements
for the year ended June 30, 2014 accounting estimates are based on reasonable and prudent judgment;• International Accounting Standards (IAS), as applicable in Pakistan, have been followed in preparation
of financial statements;• The system of internal control is sound in design and has been effectively implemented and monitored;• There are no significant doubts about the company’s ability to continue as a going concern;• There has been no material departure from the best practices of corporate governance, as detailed in
listing regulations;

8
• The value of investment of Provident Fund based on its audited accounts as at December 31, 2013 was Rs 226.867 Million. The value of investment includes accrued interest.
Board Meetings
The Board of Directors, which consist of eight members, have responsibility to independently and transparently monitor the performance of the company and take strategic decisions to achieve sustainable growth in the company value. All members of the Board are elected in the general meeting after every three years. The term of the existing members of the Board will expire on 30-06-2017, along with their consent to act so, filed a declaration on the prescribed form as requirements of the Code of Corporate Governance.
A written notice of the Board meeting along with working papers was sent to the members seven days before meetings. A total of five meetings of the Board of Directors were held during the year ended June 30, 2014. The attendance of the board members was as follows: -
Sr. # Name Of Director Meetings Attended
1. Mr. Tariq Rehman 042. Mr. Shafiq A. Siddiqi 04 3. Mr. Haris Noorani 044. Mr. Suhail Mannan 055. Mr. Javaid Shafiq Siddiqi 056. Mr. Usman Haq 04 7. Mr. Salem Rehman 038. Mr. Ahsan Suhail Mannan 05
Leave of absence was granted to a Director who could not attend the meetings.
During the financial year the trading in shares of the company by the Directors, CEO, CFO, Company Secretary and their spouses and minor children is as follows:
S. No. Name Purchase Sale Nil Nil
Audit Committee
The AC reviews the annual and quarterly financial statements, internal audit report, and information before dissemination to stock exchanges and proposes appointment of the external auditors for approval of the shareholders, apart from other matters of significant nature. The AC holds its meeting prior to the Board meeting. A total of four meetings of Audit Committee were held during the year under review. It includes statutory meeting with external auditors before start of annual audit and meeting with external auditors without CFO and head of internal audit being present. Name of the members of Audit Committee are as follows:
1. Mr. Usman Haq Chairman2. Mr. Javaid S. Siddiqi Member3. Mr. Salem Rehman Member4. Mr. Ahsan Suhail Mannan Member

9
Employees’ relations
Despite the high inflationary pressure the management would like to place on record a very positive and cooperative role of employees during the year. The management would like to place on record its appreciation in this regard and will look forward to their continuous support during the difficult time that the nation is presently undergoing. The management would also like to place on record the very cooperative role played by the Union in increasing the output on virtually each stage of production and reducing losses wherever possible.
AcknowledgementWe would like to thank our valued customers, dealers and especially the banks which have shown not only cooperation but patience in some payments which were delayed over which the management has no control and finally we would like to thank our shareholders for their unwavering support.
Dividend Considering the brought forward losses, no dividend is recommended for the year ended June 30, 2014.
Pattern of ShareholdingThe pattern of shareholding as on June 30, 2014 and its disclosure, as required by the Code of Corporate Governance is annexed with this report.
Financial HighlightsThe key financial highlights for the last 10 years performance of the company are available in this report.
Auditors As recommended by the Audit Committee, the present auditors M/s Horwath Hussain Chaudhary & Co., Chartered Accountants, retire and being eligible, offer themselves for re-appointment.
For and on behalf of the board of Directors
(Haris Noorani)Lahore: October 02, 2014 Director
As the chief executive of the company is out of country for the time being, these financial statements have been signed by two directors of the company pursuant to section 241 of companies ordinance 1984.

10
Financial Highlights of Last Ten Years 2014 2013 2012 2011 2010 2009 2008 2007 2006 2005
......................................(Rupees in Million) .......................................
Net Total sales 932 1,596 1,856 1,855 1,861 1,550 1,260 1,208 1,045 898
Exports 51 46 61 104 164 93 79 151 164 108
Employees Costs 213 313 285 325 307 301 271 241 219 191
Profit/(Loss) before tax (106) (39) (14) (35) (76) (103) (16) 11 (14) 105
Profit/(Loss) after tax (104) (35) (21) (46) (71) (81) (14) 20 (56) 86
Earning per share (2.96) (0.99) (0.61) (1.32) (2.05) (2.39) (0.09) 1.30 (3.66) 5.62
Capital Expenditure 13 23 37 8 18 149 222 55 99 15
Cash Dividend Rate - - - - - - - 5% - -
Stock Dividend Rate - - - - - - - - - -
Shareholder’s Equity (66) 17 33 36 64 118 (16) (34) (84) (49)

11
REVIEW REPORT TO THE MEMBERS ON STATEMENT OF COMPLIANCE WITH BEST PRACTICES OF CODE OF CORPORATE GOVERNANCE
We have reviewed the enclosed Statement of Compliance with the best practices contained in the Code of Corporate Governance (“the Code”) prepared by the Board of Directors of EMCO Industries Limited for the year ended June 30, 2014 to comply with requirements of the Listing Regulation No. 35 (Chapter XI) of both the Karachi Stock Exchange, Lahore Stock Exchange and Islamabad Stock Exchange, where the Company is listed.
The responsibility for compliance with the Code is that of the Board of Directors of the Company. Our responsibility is to review, to the extent where such compliance can be objectively verified, whether the Statement of Compliance reflects the status of the Company’s compliance with the provisions of the Code and report if it does not and to highlight any non-compliance with the requirements of the Code. A review is limited primarily to inquiries of the Company’s personnel and review of various documents prepared by the Company to comply with the Code.
As a part of our audit of financial statements we are required to obtain an understanding of the accounting and internal control systems sufficient to plan the audit and develop an effective audit approach. We are not required to consider whether the Board of Directors’ statement on internal control covers all risks and controls or to form an opinion on the effectiveness of such internal controls, the Company’s corporate governance procedures and risks.
The Code requires the Company to place before the Audit Committee, and upon recommendation of the Audit Committee, place before the Board of Directors for their review and approval its related party transactions distinguishing between transactions carried out on terms equivalent to those that prevail in arm’s length transactions and transactions which are not executed at arm’s length price and recording proper justification for using such alternate pricing mechanism. We are only required and have ensured compliance of this requirement to the extent of the approval of the related party transactions by the Board of Directors upon recommendation of the Audit Committee. We have not carried out any procedures to determine whether the related party transactions were undertaken at arm’s length price or not.
Following instances of non-compliance with the requirements of the Code were observed which are not stated in the Statement of Compliance:
a) There are no independent directors on the Board of Directors of the Company and there is no representation of minority shareholders on the Board of Directors.
b) The mechanism for annual evaluation of the Board’s own performance has not been put in place.
c) The Company has not appointed a new CFO in place of the outgoing CFO.
Based on our review, except for the above instances of non-compliance, nothing has come to our attention which causes us to believe that the Statement of Compliance does not appropriately reflect the Company’s compliance, in all material respects, with the best practices contained in the Code as applicable to the Company for the year ended June 30, 2014.Further, we highlight below instances of non-compliance with the requirements of the Code as reflected in the note reference where these are stated in the Statement of Compliance:
Serial No.: Description
9 The financial statements of the Company for the year ended June 30, 2014 have not been endorsed by the CFO.
16 The Board has not formed an HR and Remuneration Committee
17 Sales and purchase of goods from related parties were not placed before the Audit Committee and the Board of Directors for their approval
18 Directors’ training program was not conducted during the year.
Lahore HORWATH HUSSAIN CHAUDHURY & CO.October 02, 2014 Chartered Accountants
(Engagement partner: Muhammad Nasir Muneer)

12
Statement Of ComplianceWith the Code of Corporate Governance for the year ended June 30, 2014
This statement is being presented to comply with the Code of Corporate Governance in the listing regulations of Karachi, Lahore & Islamabad Stock Exchanges for the purpose of establishing a framework of good governance, whereby a listed company is managed in compliance with the best practices of corporate governance.
The company has applied the principles contained in the Code in the following manner:
1. The Directors have confirmed that none of them is serving as a director in more than seven listed companies, including this company (Excluding the Listed Subsidiaries of the listed holding companies where applicable).
2. All the resident directors of the company are registered as taxpayers and none of them has defaulted in payment of any loan to a banking company, a DFI or an NBFI or, being a member of stock exchange, has been declared as a defaulter by that stock exchange.
3. No casual vacancy occurred during the year under review.
4. The Board has developed a vision statement, overall corporate strategy and significant policies of the company. A complete record of particulars of significant policies alongwith the date on which they were approved or amended has been maintained.
5. All the powers of the Board have been duly exercised and decisions on material transactions, including appointment, determination of remuneration and terms and conditions of employment of the Chief Executive Officer (CEO) and other Executive Directors, have been taken by the Board.
6. The meetings of the Board were presided over by the Chairman, the Board met at least once in every quarter. Written notices of the Board meetings, alongwith agenda and working papers, were circulated at least seven days before the meetings. The minutes of the meetings were appropriately recorded and circulated.
7. The Board has approved the appointment, remuneration and terms and conditions of employment of Chief Financial Officer, Head of Internal Audit and the Company Secretary.
8. The directors’ report for the year ended June 30, 2014 has prepared in compliance with the requirements of the Code and fully describes the salient matters required to be disclosed.
9. The financial statements of the Company were duly endorsed by CEO and M (F&A) before approval of the Board.
10. The directors, CEO and executive do not hold any interest in the shares of the company other than that disclosed in the pattern of shareholding.
11. The Company has prepared a “Code of Conduct” and has ensured that appropriate steps have been taken to disseminate throughout the Company along with its supporting Policies and Procedures.
12. The company has complied with all the corporate and financial reporting requirements of the Code.
13. The Board has formed an audit committee. It comprises of four members.
14. The meetings of the audit committee were held at least once every quarter prior to recommend the approval of interim and final results of the company and as required by the Code. The terms of references of the committee have been formed and advised to the committee for compliance.

13
15. The Board has set up an internal audit function manned by suitably qualified and experienced personnel who are conversant with the policies and procedures of the company and are involved in the Internal Audit function on a full time basis.
16. The board has not formed an HR and Remuneration Committee. The board intends to form an HR and Remuneration Committee in future.
17. All related party transactions entered during the year were at arm’s length basis and these have been placed before the Audit Committee and Board of Directors and are duly reviewed and approved except for sale and purchase of goods from related parties.
18. The directors were apprised about the changes in the Code, applicable laws and their duties and responsibilities to effectively manage the affairs of the Company for and on behalf of the shareholders. The directors of the Company having 15 years of experience on the board of a listed company are exempt from the requirements of directors training program. All the board members except two qualify for exemption under this provision of the Code. The Company will arrange the training program for the directors as provided under Code in future.
19. The ‘closed period’, prior to the announcement of interim/final results, and business decisions, which may materially affect the market price of Company’s securities, was determined and intimated to directors, employees and stock exchanges.
20. The statutory auditors of the company have confirmed that they have been given satisfactory rating under the quality control review programme of the Institute of Chartered Accountants of Pakistan, that they or any of the partners of the firm, their spouses and minor children do not hold shares of the company and that the firm and all its partners are in compliance with International Federation of Accountants (IFAC) guidelines on code of ethics as adopted by Institute of Chartered Accountants of Pakistan.
21. The statutory auditors or the persons associated with them have not been appointed to provide other services except in accordance with the listing regulations and the auditors have confirmed that they have observed IFAC guidelines in this regard.
22. Material/price sensitive information has been disseminated among all market participants at once through stock exchanges.
23. We confirm that all material principles enshrined in the Code have been complied with.
(Haris Noorani) Director

14
Auditors’ Report To The MembersWe have audited the annexed balance sheet of Emco Industries Limited as at June 30, 2014 and the related profit and loss account, statement of comprehensive income, cash flow statement and statement of changes in equity, together with the notes forming part thereof, for the year then ended and we state that we have obtained all the information and explanations which, to the best of our knowledge and belief, were necessary for the purposes of our audit.
It is the responsibility of the Company’s management to establish and maintain a system of internal control, and prepare and present the above said statements in conformity with the approved accounting standards and the requirements of the Companies Ordinance, 1984. Our responsibility is to express an opinion on these statements based on our audit.
We conducted our audit in accordance with the auditing standards as applicable in Pakistan. These standards require that we plan and perform the audit to obtain reasonable assurance about whether the above said statements are free of any material misstatement. An audit includes examining, on a test basis, evidence supporting the amounts and disclosures in the above said statements. An audit also includes assessing the accounting policies and significant estimates made by management, as well as, evaluating the overall presentation of the above said statements. We believe that our audit provides a reasonable basis for our opinion and, after due verification, we report that:
a) in our opinion, proper books of accounts have been kept by the Company as required by the Companies Ordinance, 1984;
b) in our opinion;
(i) the balance sheet and profit and loss account together with the notes thereon have been drawn up in conformity with the Companies Ordinance, 1984, and are in agreement with the books of account and are further in accordance with the accounting policies consistently applied, except for the change in accounting policy as stated in note 3 to the accompanying financial statements with which we concur;
(ii) the expenditure incurred during the year was for the purpose of the Company’s business; and
(iii) the business conducted, investments made and the expenditure incurred during the year were in accordance with the objects of the Company;in our opinion and to the best of our information and according to the explanations given to us, the balance sheet, profit and loss account, statement of comprehensive income, cash flow statement and statement of changes in equity together with the notes forming part thereof conform with approved accounting standards as applicable in Pakistan and give the information required by the Companies Ordinance, 1984, in the manner so required and respectively give a true and fair view of the state of the Company’s affairs as at June 30, 2014 and of the loss, total comprehensive loss, its cash flows and changes in equity for the year then ended; and
(d) in our opinion, no Zakat was deductible at source under the Zakat and Ushr Ordinance, 1980 (XVIII of 1980).

15
We draw attention to note 1.2 of accompanied financial statements which states that the Company has incurred net loss of Rs. 103.759 during the year ended June 30, 2014 while the accumulated loss stand at Rs. 546.330 million as at June 30, 2014. As of June 30, 2014 the current liabilities of the Company exceed its current assets by Rs. 211.700 million. Further, the Company has shut down its tile manufacturing unit since January 2014. These situations along with the matters as explained in note 18, indicates the existence of an uncertainty, which may cast doubt about the Company’s ability to continue as going concern. Our opinion is not qualified in respect of this matter.
Financial statements of the Company for the year ended June 30, 2013 were audited by another firm of Chartered Accountants who expressed an unmodified opinion on those financial statements on October 9, 2013. However, their report contained an emphasis of matter paragraph with regard to going concern assumption.
Lahore HORWATH HUSSAIN CHAUDHURY & CO.October 02, 2014 Chartered Accountants
(Engagement partner: Muhammad Nasir Muneer)

16
2014 2013 2012 Note Rupees Rupees Rupees (Restated) (Restated)
EQUITY AND LIABILITIES Share Capital and Reserves Authorized share capital 40,000,000 (2013: 40,000,000) ordinary shares of Rs 10 each 400,000,000 400,000,000 400,000,000 Issued, subscribed and paid up capital 5 350,000,000 350,000,000 350,000,000 35,000,000 (2013: 35,000,000) ordinary shares of Rs 10 each Reserves 6 129,898,526 129,898,526 129,898,526 Accumulated loss (546,330,321) (463,345,211) (446,290,910) (66,431,795) 16,553,315 33,607,616 Surplus on Revaluation of Property, Plant and Equipment 7 594,237,181 604,623,040 414,829,694 Non Current Liabilities Long term financing 8 267,104,642 257,268,254 181,373,772 Long term loans from directors 9 115,708,828 115,708,828 114,071,523 Liabilities against assets subject to finance lease 10 - - 4,609,791 Deferred liabilities 11 37,458,473 46,398,539 42,427,017 Deferred taxation 12 90,343,639 110,277,352 27,837,160 510,615,582 529,652,973 370,319,263 Trade and other payables 13 276,589,259 324,608,021 344,795,286 Accrued finance cost 14 144,359,698 104,588,388 95,078,924 Finances under mark-up arrangements - secured 15 339,246,739 366,576,111 564,358,988 Short term borrowings from related parties - unsecured 16 186,452,269 125,538,486 139,245,882 Current portion of non-current liabilities 17 133,875,204 180,234,071 163,354,480 1,080,523,169 1,101,545,077 1,306,833,560 Contingencies and Commitments 18 - - - Total Equity and Liabilities 2,118,944,137 2,252,374,405 2,125,590,133 ASSETS Non Current Assets Property, plant and equipment - owned 19 1,232,816,782 1,305,834,295 1,087,203,565 Assets subject to finance lease 20 10,371,057 13,929,065 15,821,682 Intangible assets 21 3,455,661 3,839,623 4,266,250 Long term loans 22 3,206,109 1,114,295 1,506,097 Long term deposits 23 271,163 809,778 3,966,692 1,250,120,772 1,325,527,056 1,112,764,286 Current Assets Stores, spares and loose tools 24 105,971,710 118,406,907 111,479,777 Stock in trade 25 317,276,956 363,706,465 440,928,589 Trade debts 26 322,931,715 258,080,528 342,371,744 Loans, advances, deposits, prepayments and other receivables 27 83,371,541 74,206,533 44,663,180 Income tax refundable from the Government 37,417,388 65,345,820 55,319,335 Cash and bank balances 28 1,854,055 47,101,096 18,063,222 868,823,365 926,847,349 1,012,825,847 Total Assets 2,118,944,137 2,252,374,405 2,125,590,133 The annexed notes form an integral part of these financial statements. As the chief executive of the company is out of country for the time being, these financial statements have been signed by two directors of the company pursuant to section 241 of companies ordinance 1984.
BALANCE SHEET AS AT JUNE 30, 2014
DIRECTOR DIRECTOR

17
2014 2013 Note Rupees Rupees (Restated)
Sales 29 932,348,371 1,595,788,170 Cost of sales 30 (788,553,281) (1,350,928,550) Gross Profit 143,795,090 244,859,620 Administrative expenses 31 (57,726,420) (64,930,125)Selling and distribution expenses 32 (101,246,108) (155,437,056) (158,972,528) (220,367,181) Operating (Loss) / Profit (15,177,438) 24,492,439 Other operating expenses 33 (4,576,015) (13,660,856)Other income 34 13,131,019 58,193,150 Finance cost 35 (99,256,091) (108,160,764) Loss before Taxation (105,878,525) (39,136,031) Taxation 36 2,118,963 4,426,901 Net Loss for the Year (103,759,562) (34,709,130)
Loss per Share - Basic and Diluted 37 (2.96) (0.99)
The annexed notes form an integral part of these financial statements.
As the chief executive of the company is out of country for the time being, these financial statements have been signed by two directors of the company pursuant to section 241 of companies ordinance 1984.
PROFIT AND LOSS ACCOUNT FOR THE YEAR ENDED JUNE 30, 2014
DIRECTOR DIRECTOR
18
2014 2013 Rupees Rupees (Restated)
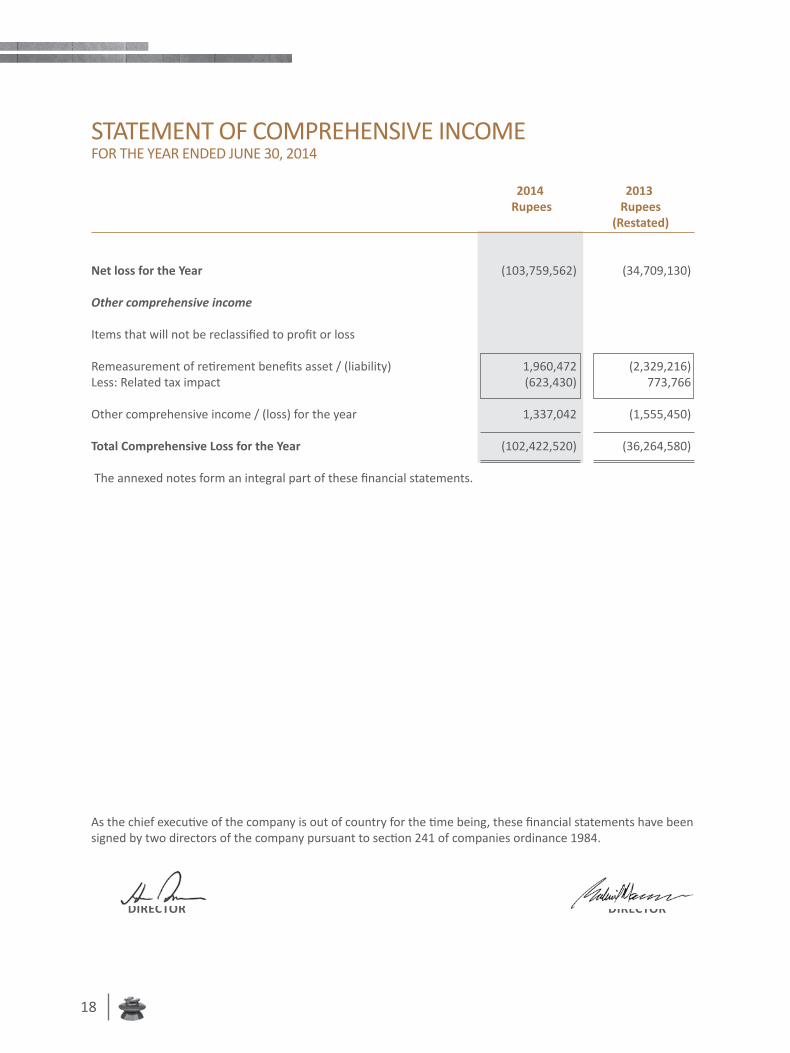
Net loss for the Year (103,759,562) (34,709,130) Other comprehensive income Items that will not be reclassified to profit or loss Remeasurement of retirement benefits asset / (liability) 1,960,472 (2,329,216)Less: Related tax impact (623,430) 773,766 Other comprehensive income / (loss) for the year 1,337,042 (1,555,450) Total Comprehensive Loss for the Year (102,422,520) (36,264,580) The annexed notes form an integral part of these financial statements.
STATEMENT OF COMPREHENSIVE INCOME FOR THE YEAR ENDED JUNE 30, 2014
As the chief executive of the company is out of country for the time being, these financial statements have been signed by two directors of the company pursuant to section 241 of companies ordinance 1984.
DIRECTOR DIRECTOR

19
2014 2013 Rupees Rupees (Restated)
CASH FLOWS FROM OPERATING ACTIVITIES Cash generated from operations 15,336,371 252,882,476 Finance cost paid (59,484,781) (98,651,300)Gratuity paid (10,761,440) (3,010,636)Income tax paid - (18,036,486)Payments against discontinued provident fund (4,846,968) (5,878,361)Tax refunded during the period 18,541,803 - (56,551,386) (125,576,783) Net Cash (used in) / generated from Operating Activities (41,215,015) 127,305,693 CASH FLOWS FROM INVESTING ACTIVITIES Property, plant and equipment purchased (12,545,830) (23,327,423)Long term loans and other receivables (841,972) 3,929,589 Proceeds from disposal of property, plant and equipment 4,293,844 2,818,701 Net Cash used in Investing Activities (9,093,958) (16,579,133) CASH FLOWS FROM FINANCING ACTIVITIES Long term financing repaid (26,070,763) 115,719,853 Lease rentals paid (2,451,716) (6,118,266)Short term borrowings acquired - net 33,584,411 (191,290,273) Net Cash generated from / (used in) Financing Activities 5,061,932 (81,688,686) Net Decrease / (increase) in Cash and Cash Equivalents (45,247,041) 29,037,874 Cash and cash equivalents at the beginning of the year 47,101,096 18,063,222 Cash and Cash Equivalents at the End of the Year 1,854,055 47,101,096 The annexed notes form an integral part of these financial statements.
CASH FLOW STATEMENT FOR THE YEAR ENDED JUNE 30, 2014
As the chief executive of the company is out of country for the time being, these financial statements have been signed by two directors of the company pursuant to section 241 of companies ordinance 1984.
DIRECTOR DIRECTOR

20
Reserves Particulars Share Share General Accumulated Capital Premium Reserve Loss Reserve Total Rupees Rupees Rupees Rupees Rupees Balance as at June 30, 2012 as previously eported 350,000,000 39,898,526 90,000,000 (447,269,291) 32,629,235 Effect of change in accounting policy (Note - 3) - - - 978,381 978,381 Balance as at June 30, 2012 - as restated 350,000,000 39,898,526 90,000,000 (446,290,910) 33,607,616 Net loss for the Year - - - (34,709,130) (34,709,130) Other comprehensive loss for the year - - (1,555,450) (1,555,450) Total comprehensive loss for the year - - - (36,264,580) (36,264,580) Incremental depreciation for the year on surplus on revaluation of Property, Plant and Equipment net of deferred tax - - - 19,210,279 (36,264,580) Balance as at June 30, 2013 - as restated 350,000,000 39,898,526 90,000,000 (463,345,211) 16,553,315 Balance as at June 30, 2013 as previously reported 350,000,000 39,898,526 90,000,000 (461,994,376) 17,904,150 Effect of change in accounting policy (Note - 3) - - - (1,350,835) (1,350,835) Balance as at June 30, 2013 - as restated 350,000,000 39,898,526 90,000,000 (463,345,211) 16,553,315 Net loss for the year - - - (103,859,562) (103,859,562) Other comprehensive income for the year - - 1,337,042 1,337,042 Total comprehensive loss for the year - - - (102,422,520) (102,422,520) Incremental depreciation for the year on surplus on revaluation of Property, Plant and Equipment net of deferred tax - - - 19,437,410 19,437,410 Balance as at June 30, 2014 350,000,000 39,898,526 90,000,000 (546,330,321) (66,431,795)
The annexed notes form an integral part of these financial statements.
STATEMENT OF CHANGES IN EQUITY FOR THE YEAR ENDED JUNE 30, 2014
As the chief executive of the company is out of country for the time being, these financial statements have been signed by two directors of the company pursuant to section 241 of companies ordinance 1984.
DIRECTOR DIRECTOR

21
1. THE COMPANY AND ITS OPERATIONS
1.1 EMCO Industries Limited (“the Company”) is incorporated in Pakistan and is listed on Karachi, Lahore and Islamabad Stock Exchanges. The Company was incorporated as a Joint Stock Company in Pakistan under the Companies Act, 1913, (now the Companies Ordinance 1984) as a private limited company on August 17, 1954 by the name of Electric Equipment Manufacturing Company (Private) Limited. Later, it was converted into a public company on August 20, 1983 and its name was changed to EMCO Industries Limited on September 12, 1983. The Company was listed on the stock exchanges on December 29, 1983. Its registered office is situated at 4th Floor, National Tower, 28 Egerton Road, Lahore.
The Company is principally engaged in the manufacture and sale of high/low tension electrical porcelain insulators, switchgear and ceramic tiles.
1.2 Going concern assumption
The Company has incurred net loss of Rs. 103.760 million (2013: Rs. 33.935 million) during the year ended June 30, 2014 while the accumulated loss stands at Rs. 546.330 million (2013: 463.345 million) as at June 30, 2014. Current liabilities of the Company exceed its current assets by Rs 211.700 million as at the balance sheet date. The existing borrowing facilities are fully utilized and there are overdue payments of Rs. 184.454 million relating to loan repayments and Rs. 92.116 million relating to the accrued finance costs. Further, the Company has shut down its tile manufacturing unit since January 2014. These factors along with matters set forth in Note 18 raise doubts about the Company being a going concern and therefore, it may be unable to realize its assets and discharge its liabilities in the normal course of business.
The directors have injected interest free funds of Rs. 72.92 million during the year and are committed to support the liquidity requirements of the Company. Keeping in view the continuous support from directors and favourable negotiation with lenders, the going concern assumption is considered appropriate and, therefore, these financial statements have been prepared on going concern basis.
2. BASIS OF PREPARATION 2.1 Statement of compliance These financial statements have been prepared in accordance with the requirements of the Companies
Ordinance, 1984 (the Ordinance) and approved accounting standards as applicable in Pakistan. Approved accounting standards comprise of such International Financial Reporting Standards (IFRS) issued by the International Accounting Standards Board and Islamic Financial Accounting Standards (IFAS) issued by the Institute of Chartered Accountants of Pakistan as are notified under the Companies Ordinance, 1984, provisions of and directives issued under the Companies Ordinance, 1984. Wherever the requirements of the Companies Ordinance, 1984 or directives issued by Securities and Exchange Commission of Pakistan differ with the requirements of IFRS or IFAS, the requirements of the Companies Ordinance, 1984 or the requirements of the said directives prevail.
2.2 Basis of measurement These financial statements have been prepared under the historical cost convention except to the extent
of the following: Certain property, plant and equipment Note 19 Revalued amount Employee retirement benefits (Gratuity) Note 11 Present value
NOTES TO AND FORMING PART OF THE FINANCIAL STATEMENTS FOR THE YEAR ENDED JUNE 30, 2014

22
2.3 Functional and presentation currency These financial statements are prepared and presented in Pak Rupees which is the Company’s functional
and presentation currency. All the figures have been rounded off to the nearest rupee, unless otherwise stated.
2.4 Use of estimates and judgments The preparation of financial statements in conformity with IFRSs requires management to make
judgments, estimates and assumptions that affect the application of policies and reported amounts of assets, liabilities, income and expenses. These estimates and related assumptions are based on historical experience and various other factors that are believed to be reasonable under the circumstances.
These estimates and related assumptions are reviewed on an on going basis. Accounting estimates are revised in the period in which such revisions are made. Significant management estimates in these financial statements relate to the useful life and residual values of property, plant and equipment, amortization of intangible assets, provisions for doubtful receivables, provisions for defined benefit obligations, slow moving inventory, obsolescence of inventory and taxation. However, the management believes that the change in outcome of estimates would not have a material effect on the amounts disclosed in these financial statements.
2.5 Changes in accounting standards, interpretations and pronouncements
2.5.1 Standards, interpretations and amendments to approved accounting standards which became effective during the year
During the year certain new amendments to standards or new interpretation became effective as
mentioned in Note 3. 2.5.2 Standards, interpretations and amendments to approved accounting standards which became effective
during the year but are not relevant New standards, amendments and interpretations that are mandatory for accounting period beginning on
or after January 01, 2013 and not considered relevant for the Company’s financial statements have not been detailed here.
2.5.3 Standards, interpretations and amendments to approved accounting standards that are relevant but not yet effective
The following standards, amendments and interpretations of approved accounting standards will be effective for accounting periods beginning on or after July 01, 2014 and relevant. These amendments are not likely to have any impact on the Company’s financial statements:
i) Offsetting Financial Assets and Financial Liabilities (Amendments to IAS 32) – (effective for annual periods beginning on or after January 01, 2014). The amendments address inconsistencies in current practice when applying the offsetting criteria in IAS 32 Financial Instruments: Presentation. These amendments clarify the meaning of ‘currently has a legally enforceable right of set-off’ and certain gross settlement systems that may be considered equivalent to net settlement.

23
ii) Amendment to IAS 36 “Impairment of Assets” Recoverable Amount Disclosures for Non-Financial Assets (effective for annual periods beginning on or after January 01, 2014). These amendments address the disclosure of information about the recoverable amount of impaired assets if that amount is based on fair value less costs of disposal and require the disclosure of additional information about the fair value measurement and discount rates used in present value technique.
iii) Amendments to IAS 19 “Employee Benefits” (effective for annual periods beginning on or after July 01, 2014). It introduces a narrow scope amendment to simplify the requirements for contributions from employees or third parties to a defined benefit plan, when those contributions are applied to a simple contributory plan that is linked to services.
iv) Amendments to IAS 38 Intangible Assets and IAS 16 Property, Plant and Equipment (effective for annual periods beginning on or after January 01, 2016) introduce severe restrictions on the use of revenue-based amortization for intangible assets and explicitly state that revenue-based methods of depreciation cannot be used for property, plant and equipment. The rebuttable presumption that the use of revenue-based amortisation methods for intangible assets is inappropriate and can be overcome only when the revenue and the consumption of the economic benefits of the intangible asset are ‘highly correlated’ or when the intangible asset is expressed as a measure of revenue.
Annual Improvements 2010-2012 and 2011-2013 cycles (most amendments will apply prospectively for annual periods beginning on or after July 01, 2014). The new cycle of improvements contains amendments to the following standards:
i) Amendments to IAS 16 ’Property, plant and equipment’ and IAS 38 ‘Intangible Assets’. The amendments clarify the requirements of the revaluation model in IAS 16 and IAS 38, recognizing that the restatement of accumulated depreciation (amortization) is not always proportionate to the change in the gross carrying amount of the asset.
ii) IFRS 8 ‘Operating Segments’ has been amended to explicitly require the disclosure of judgments made by the management in applying the aggregation criteria. In addition this amendment clarifies that a reconciliation of the total of the reportable segment’s assets to the entity’s assets is required only if this information is regularly provided to the entity’s chief operating decision maker. This change aligns the disclosure requirements with those for segment liabilities.
iii) IAS 24 ‘Related Party Disclosure’. The definition of related party is extended to include a management entity that provides key management personnel services to the reporting entity, either directly or through a group entity.
2.5.4 Standards, interpretations and amendments to approved accounting standards that are not relevant and not yet effective
Revision / improvements / amendments to IFRS and interpretations Effective Date
(Period beginning on or after)
- IFRIC 21- Levies ‘an Interpretation on the accounting for January 1, 2014 levies imposed by governments’ - IAS 39 “Financial Instruments: Recognition and Measurement” January 1, 2014 Continuing hedge accounting after derivative novation - Agriculture: Bearer Plants [Amendment to IAS 16 and IAS 41] January 1, 2016
- Annual Improvements 2010-2012 and 2011-2013 Cycle July 1, 2014
24
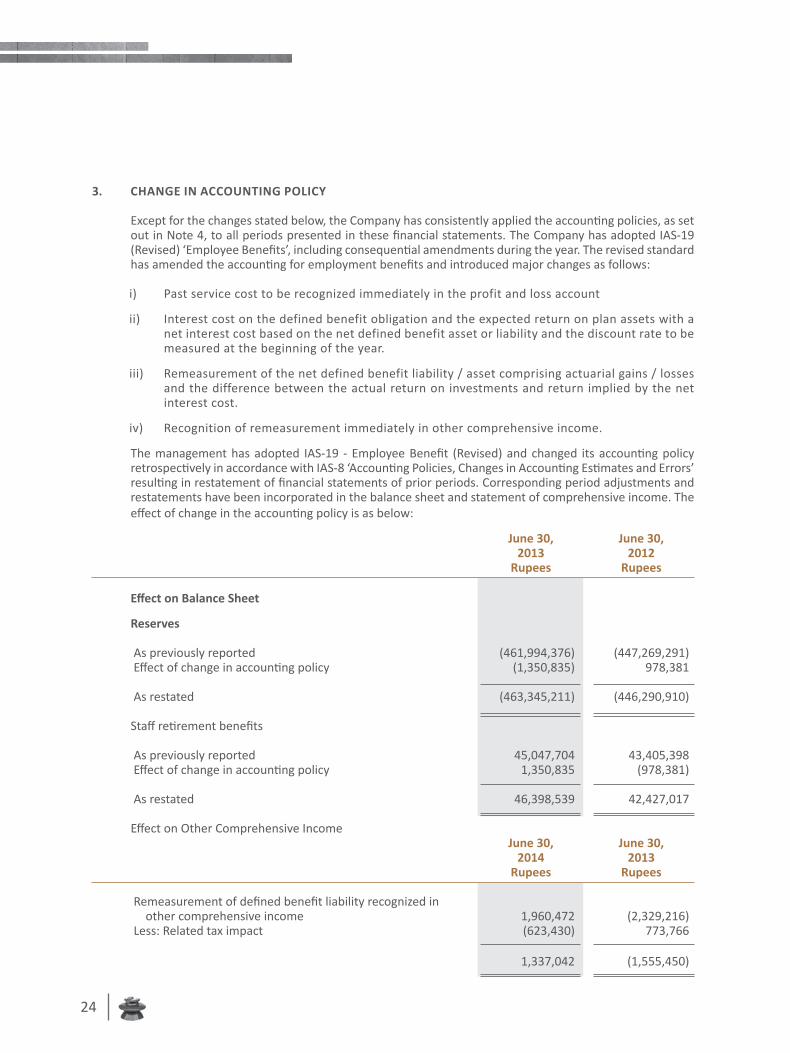
3. ChANgE IN ACCOUNTING POLICY
Except for the changes stated below, the Company has consistently applied the accounting policies, as set out in Note 4, to all periods presented in these financial statements. The Company has adopted IAS-19 (Revised) ‘Employee Benefits’, including consequential amendments during the year. The revised standard has amended the accounting for employment benefits and introduced major changes as follows:
i) Past service cost to be recognized immediately in the profit and loss account
ii) Interest cost on the defined benefit obligation and the expected return on plan assets with a net interest cost based on the net defined benefit asset or liability and the discount rate to be measured at the beginning of the year.
iii) Remeasurement of the net defined benefit liability / asset comprising actuarial gains / losses and the difference between the actual return on investments and return implied by the net interest cost.
iv) Recognition of remeasurement immediately in other comprehensive income.
The management has adopted IAS-19 - Employee Benefit (Revised) and changed its accounting policy retrospectively in accordance with IAS-8 ‘Accounting Policies, Changes in Accounting Estimates and Errors’ resulting in restatement of financial statements of prior periods. Corresponding period adjustments and restatements have been incorporated in the balance sheet and statement of comprehensive income. The effect of change in the accounting policy is as below:
June 30, June 30, 2013 2012 Rupees Rupees
Effect on Balance Sheet
Reserves As previously reported (461,994,376) (447,269,291) Effect of change in accounting policy (1,350,835) 978,381 As restated (463,345,211) (446,290,910) Staff retirement benefits As previously reported 45,047,704 43,405,398 Effect of change in accounting policy 1,350,835 (978,381)
As restated 46,398,539 42,427,017 Effect on Other Comprehensive Income June 30, June 30, 2014 2013 Rupees Rupees
Remeasurement of defined benefit liability recognized in other comprehensive income 1,960,472 (2,329,216) Less: Related tax impact (623,430) 773,766 1,337,042 (1,555,450)

25
4. SIGNIFICANT ACCOUNTING POLICIES
The significant accounting policies adopted in the preparation of these financial statements are set out below. These policies have been consistently applied to all the years presented, unless otherwise stated.
4.1 Provisions Provisions are recognised when the Company has a present legal or constructive obligation as a result of
past events and it is probable that an outflow of resources shall be required to settle the obligation and the amount has been reliably estimated. Provisions are reviewed at each balance sheet date and adjusted to reflect the current best estimate.
4.2 Employee retirement benefits The main features of the schemes operated by the Company for its employees are as follows:
The Company operates a recognised provident fund for all its permanent workmen employees. Equal
monthly contributions are made by the Company and employees into the fund at the rate of 10% of the basic salary for officers and 10% of basic salary plus cost of living allowance for workers. Obligation for contributions to defined contribution plan is recognised as an expense in the profit and loss account as and when incurred.
Defined benefit plan The Company operates an unfunded gratuity scheme for non-workmen employees who are not covered
under the provident fund scheme. The unfunded gratuity scheme is a defined benefit final salary plan. Provisions are made in the financial statements to cover obligations on the basis of actuarial valuations carried out annually. Most recent valuation was carried out as at June 30, 2014 using the “Projected Unit Credit Method”.
The future contribution rate of the plan includes allowances for deficit and surplus. Projected Unit Credit Method, using the following significant assumptions, is used for valuation of this scheme:
Discount rate 12% p.a.
Expected rate of increase in salary level per annum 11% p.a.
Average expected remaining working lives of employees 7 Year
Expected mortality rate EFU 61-66 mortality table.
Retirement benefits are payable to staff on resignation, retirement or termination from service, subject to the completion of prescribed qualifying period of service under these schemes.
Actuarial gains / (losses) arising from experience adjustments and changes in actuarial assumptions for defined benefit plan are charged or credited to other comprehensive income in the period in which they arise. Past service costs are recognized immediately as income.

26
4.3 Taxation Income tax expense comprises current and deferred tax. Income tax expense is recognised in the profit
and loss account except to the extent that relates to items recognised directly in equity, in which case it is recognised in equity.
Current The charge for current tax is based on taxable income for the year determined in accordance with the
prevailing laws of taxation. All tax credits and tax rebates are taken into account in calculating this charge. However, in case of loss for the year, income tax expense is recognised as minimum tax liability on turnover of the Company in accordance with the provisions of the Income Tax Law. The charge for current tax is calculated using prevailing tax rates expected to apply to the profit for the year, if enacted. The charge for current tax also includes adjustments, where considered necessary, to provision for tax made in previous years arising from assessments framed during the year for such years.
Deferred Deferred tax is recognised using the balance sheet liability method on all temporary differences between
the carrying amount of assets and liabilities and their tax bases.
Deferred tax liabilities are recognised for all major taxable temporary differences.
Deferred tax assets are recognised for all major deductible temporary differences to the extent that it
is probable that taxable profit will be available against which deductible temporary differences can be utilised, unused tax losses and tax credits can be utilized.
The carrying amount of deferred tax asset is reviewed at each balance sheet date and is recognised only to the extent that it is probable that future taxable profits will be available against which assets may be utilised. Deferred tax assets are reduced to the extent that it is no longer probable that related tax benefit will be realised.
Unrecognised deferred tax assets are reassessed at each balance sheet date and are recognised to the extent of probable future taxable profit available that will allow deferred tax asset to be recovered.
Deferred tax assets and liabilities are calculated at the rates that are expected to apply to the period when the asset is realised or the liability is settled, based on the tax rates (and tax laws) that have been enacted or substantively enacted by the balance sheet date. Deferred tax is charged or credited to the profit and loss account, except in the case of items charged or credited to equity in which case it is included in the statement of changes in equity.
4.4 Leases Finance leases Leases where the Company has substantially all the risks and rewards of ownership are classified as finance
leases. Assets subject to finance lease are initially recognized at the lower of present value of minimum lease payments under the lease agreements and the fair value of the assets. Subsequently, these assets are stated at cost less accumulated depreciation and any identified impairment loss.

27
Related rental obligations, net of finance charges, are included in liabilities against assets subject to finance lease. Liabilities are classified as current and non-current depending upon the timing of the payment.
Each lease payment is allocated between the liability and finance charges so as to achieve a constant rate on the balance outstanding. The interest element of the rental is charged to profit over the lease term. Assets acquired under finance lease are depreciated over the useful life of the asset on diminishing balance method at the same rates as owned assets. Depreciation on leased assets is charged to the profit and loss account.
Depreciation on additions to leased assets is charged from the month in which an asset is acquired while
no depreciation is charged for the month in which an asset is disposed off/ transferred.
Operating leases Leases where a significant portion of risks and rewards of ownership are retained by the lessor are
classified as operating leases. Payments made under operating leases (net of any incentives received from the lessor) are charged to profit on straight line basis over the lease term.
4.5 Borrowings Interest bearing borrowings are recognised initially at fair value less attributable transaction cost.
Subsequent to initial recognition, these are stated at amortised cost with any difference between cost and redemption value being recognised in the profit and loss over the period of the borrowings on effective interest rate basis.
4.6 Trade and other payables Trade and other payables are recognised initially at fair value and subsequently measured at amortised
cost using the effective interest method. Other amounts payable are carried at cost which is the fair value of the consideration to be paid in future for goods and services.
4.7 Property, plant and equipment Property, plant and equipment are stated at cost less accumulated depreciation and identified impairment
losses, if any, except freehold land which is stated at revalued amount. Revaluation is carried out with sufficient regularity to ensure that the carrying amounts of assets do not differ materially from their fair value. Additions, subsequent to revaluation, are stated at cost less accumulated depreciation and any identified impairment loss.
The cost of an item of property, plant and equipment comprises its purchase price and any directly attributable costs of bringing the asset to its working condition and location for its intended use. Cost in relation to certain assets also includes cost of borrowing during construction period in respect of loans taken for specific projects.
Depreciation on property, plant and equipment, except freehold land, is charged to profit on straight line method with the exception of tools and equipment, furniture and fixture, office equipment and vehicles, machinery spares included in plant and machinery, whose depreciation is charged to profit on diminishing balance method so as to write off the cost or revalued amount of an asset over its estimated useful life. Incremental depreciation representing the difference between actual depreciation based on revalued carrying amount of the asset and equivalent depreciation based on the original carrying amount of the

28
asset is transferred to equity from surplus on revaluation of property, plant and equipment. All transfers to/from surplus on revaluation of property, plant and equipment are net of applicable deferred income taxes.
Depreciation on additions is charged from the month in which the assets are available for use while no
depreciation is charged in the month in which the assets are disposed off.
The principal annual rates used for depreciation purpose are as follows:
Buildings on freehold land 5% Plant and machinery 4% - 35% Tools and equipment 20% - 40% Furniture and fittings 20% Office equipment 20% Vehicles 20%
Depreciation method, residual value and useful lives of assets are reviewed at least at each financial year
end and adjusted if impact on depreciation is significant.
The Company assesses at each balance sheet date whether there is any indication that property, plant and equipment is impaired. If such indication exists, the carrying amounts of such assets are reviewed to assess whether they are recorded in excess of their recoverable amount. Where carrying amounts exceed the respective recoverable amount, assets are written down to their recoverable amounts and the resulting impairment loss is recognised in the profit and loss account. The recoverable amount is the higher of an asset’s fair value less cost to sell and value in use. Where an impairment loss is recognised, the depreciation charge is adjusted in future periods to allocate the asset’s revised carrying amount over its estimated useful life.
Maintenance and normal repairs are charged to income as and when incurred. Major renewals and
replacements are capitalised. Gains or losses on disposal of property, plant and equipment are included in the current year’s income.
Increases in the carrying amounts arising due to revaluation of land and buildings are credited to revaluation surplus on property, plant and equipment. Decreases that offset previous increases of any other fixed asset of the Company are debited against revaluation surplus directly in equity. All other decreases are charged to the profit and loss account.
4.8 Capital work-in-progress Capital work-in-progress is stated at cost less any identified impairment loss and represents expenditure
incurred on property, plant and equipment during the construction and installation. All expenditure connected with specific assets incurred during installation and construction period are carried under capital work-in-progress. Cost also includes applicable borrowing costs. Transfers are made to relevant property, plant and equipment category as and when the assets are available for use.

29
4.9 Intangible assets Expenditure incurred to acquire custom-made Enterprise Resource Planning (ERP) system has been
capitalised as intangible assets and stated at cost less accumulated amortisation and any identified impairment loss. Intangible assets are amortised using the diminishing balance method at the rate of 10%.
Amortisation on additions to intangible assets is charged from the month in which an asset is acquired or capitalised while no amortization is charged for the month in which the asset is disposed off.
The Company assesses at each balance sheet date whether there is any indication that the intangible asset may be impaired. If such indication exists, the carrying amount of such assets is reviewed to assess whether they are recorded in excess of their recoverable amounts. Where carrying values exceed the respective recoverable amount, assets are written down to their recoverable amounts and the resulting impairment loss is recognised in profit and loss account for the year. The recoverable amount is the higher of an asset’s fair value less costs to sell and value in use. Where an impairment loss is recognised, the amortisation charge is adjusted in the future periods to allocate the asset’s revised carrying amount over its estimated useful life.
4.10 Borrowing costs Borrowing costs are recognised as an expense in the period in which they are incurred except where such
costs are directly attributable to the acquisition, construction or production of a qualifying asset in which case such costs are capitalised as part of the cost of the asset until such time as the asset is substantially ready for its intended use or sale.
4.11 Stores, spares and loose tools Usable stores and spares are valued principally at weighted average cost, while items considered obsolete
are carried at nil value. Items in transit are valued at cost comprising invoice value plus other charges paid thereon.
Provision is made in the financial statements for obsolete and slow moving stores and spares based on
management estimate.
4.12 Stock-in-trade Raw materials, packing material and components, except for those in transit, are valued at the lower of
weighted average cost and net realizable value. Work-in-process and finished goods are valued at the lower of average cost and net realizable value. Work-in-process and finished goods comprise cost of direct materials, labour and appropriate manufacturing overheads. Cost of goods purchased for resale comprises invoice value plus charges paid thereon.
Materials in transit are stated at cost comprising invoice value plus other charges paid thereon.
Net realizable value signifies the estimated selling price in the ordinary course of business less costs
necessary to be incurred in order to make a sale. If the net realisable value is lower than the carrying amount, a write-down is recognised for the amount by which the carrying amount exceeds its net realisable value. Provision is made in the financial statements for obsolete and slow moving stock in trade based on management estimate.

30
4.13 Financial instruments Financial assets The Company classifies its financial assets in the following categories: at fair value through profit or loss,
loans and receivables, available for sale and held to maturity. The classification depends on the purpose for which the financial assets were acquired. The management determines the classification of its financial assets at the time of initial recognition.
Financial assets at fair value through profit and loss Financial assets at fair value through profit or loss are financial assets held for trading and financial assets
designated upon initial recognition as at fair value through profit or loss. A financial asset is classified as held for trading if acquired principally for the purpose of selling in the short term. Assets in this category are classified as current assets.
Loans and receivables Loans and receivables are non-derivative financial assets with fixed or determinable payments that are
not quoted in an active market. They are included in current assets, except for those having maturities greater than twelve months after the balance sheet date, which are classified as non-current assets. Loans and receivables comprise advances, deposits and other receivables and cash and cash equivalents in the balance sheet.
Available-for-sale financial assets Available-for-sale financial assets are non-derivatives that are either designated in this category or not
classified in any of the other categories. They are included in non-current assets unless the management intends to dispose of the investments within twelve months from the balance sheet date.
Held to maturity Financial assets with fixed or determinable payments and fixed maturity, where the management has the
intention and ability to hold till maturity, are classified as held to maturity and are stated at amortized cost.
All financial assets are recognized at the time when the Company becomes a party to the contractual
provisions of the instrument. Regular purchases and sales of investments are recognized on trade-date that is the date on which the Company commits to purchase or sell the asset.
Financial assets are initially recognized at fair value plus transaction costs for all financial assets not carried at fair value through profit or loss. Financial assets carried at fair value through profit or loss are initially recognized at fair value and transaction costs are expensed in the profit and loss account. Dividend income from financial assets at fair value through profit or loss is recognized in the profit and loss account when the Company’s right to receive payments is established.
Available-for-sale financial assets and financial assets at fair value through profit and loss are subsequently
carried at fair value. ‘Loans and receivables’ and ‘held to maturity’ instruments are carried at amortised cost using effective interest rate method.

31
Financial assets are derecognized when the rights to receive cash flows from the assets have expired or have been transferred and the Company has transferred substantially all the risks and rewards of ownership.
Financial liabilities All financial liabilities are recognized at the time when the Company becomes a party to the contractual
provisions of the instrument. A financial liability is derecognized when the obligation under the liability is discharged or cancelled or
expired. Where an existing financial liability is replaced by another from the same lender on substantially different terms, or the terms of an existing liability are substantially modified, such an exchange or modification is treated as a derecognition of the original liability and the recognition of a new liability, and the difference in respective carrying amounts is recognized in the profit and loss account.
4.14 Offsetting of financial assets and liabilities Financial assets and liabilities are offset and net amount is reported in the financial statements only when
there is a legally enforceable right to set off the recognised amount and the Company intends either to settle on a net basis or to realize the assets and settle the liabilities simultaneously.
4.15 Trade debts Trade debts are recognised initially at original invoice amount less provision for doubtful debts.
A provision for doubtful debts is established when there is objective evidence that the Company will not
be able to collect all the amount due according to the original terms of the receivable. Significant financial difficulties of the debtors, probability that the debtor will enter bankruptcy or financial reorganisation and default or delinquency in payments are considered indicators that the trade debt is impaired. The provision is recognised in the profit and loss account. When a trade debt is uncollectible, it is written off against the provision. Subsequent recoveries of amounts previously written off are credited to the profit and loss account.
4.16 Cash and cash equivalents Cash and cash equivalents include cash in hand, deposits held at call with banks, other short-term highly
liquid investments with original maturities of three months or less, bank overdrafts and finances under mark-up arrangements. Bank overdrafts are shown within finances under mark-up arrangements in current liabilities on the balance sheet.
4.17 Foreign currency transactions and translation All monetary assets and liabilities in foreign currencies are translated into rupees at exchange rates
prevailing at the balance sheet date. Transactions in foreign currencies are translated into rupees at exchange rates prevailing at the date of transaction. Non-monetary assets and liabilities that are measured in terms of historical cost in a foreign currency are translated into rupees at exchange rates prevailing at the date of transaction. Non-monetary assets and liabilities denominated in foreign currency that are stated at fair value are translated into rupees at exchange rates prevailing at the date when fair values are determined. Exchange gains and losses are included in income and expense.

32
4.18 Revenue recognition Revenue represents the fair value of the consideration received or receivable for goods sold, net of
discounts and sales tax. Revenue is recognised when it is probable that the economic benefits associated with the transaction will flow to the Company and the amount of revenue, and the associated cost incurred, or to be incurred, can be measured reliably.
Revenue from sale of goods is recognised when the significant risk and rewards of ownership of the goods
are transferred to the buyer i.e. on the dispatch of goods to the customers.
4.19 Business segments Operating segments are reported in a manner consistent with the internal reporting provided to the chief
operating decision-maker. The chief operating decision-maker, who is responsible for allocating resources and assessing performance of the operating segments, has been identified as the Director Operations.
The Company is divided into two business segments: - Insulator division - manufacture of high and low tension electrical porcelain insulators and switchgear; and
- Tile division - manufacture of ceramic wall and floor tiles. All these business segments are located in the same geographical area.
Segment assets and liabilities The assets of a segment include all operating assets used by a segment and consist principally of operating
cash, receivables, inventories and property, plant and equipment, net of allowances and provisions.
Segment liabilities include all operating liabilities consisting principally of deferred liabilities, other payables and accrued liabilities. The carrying amounts of identifiable assets and liabilities are directly attributed to respective segments. The carrying amounts of jointly used assets and liabilities are allocated to the segments on the following basis:
Insulator 47% Tile 53% Allocation of segment expenses All identifiable expenses are directly attributed to the respective segments.
4.20 Contingent liabilities Contingent liability is disclosed when there is a possible obligation that arises from past events and whose
existence will be confirmed only by the occurrence or non occurrence of one or more uncertain future events not wholly within the control of the Company.
A contingent liability is also disclosed when there is present obligation that arises from past events but it
is not probable that an outflow of resources embodying economic benefits will be required to settle the obligation or the amount of the obligation cannot be measured with sufficient reliability.
4.21 Dividend distribution Dividends are recognised as a liability in the period in which these are declared.

33
5. Issued, Subscribed and Paid up Capital 2014 2013 2014 2013 No. of Shares Rupees Rupees 18,570,460 18,570,460 Ordinary shares of Rs. 10 each fully paid in cash 185,704,600 185,704,600 2,800,000 2,800,000 Ordinary shares of Rs. 10 each issued as fully paid bonus shares 28,000,000 28,000,000 13,629,540 13,629,540 Ordinary shares of Rs. 10 each issued for for consideration other than cash 136,295,400 136,295,400 35,000,000 35,000,000 350,000,000 350,000,000
5.1 Ordinary shares of the Company held by associated companies as at the year end are as follows:
2014 2013 Note Rupees Rupees Associated Engineers (Private) Limited 2,011,325 2,011,325 ICC (Private) Limited 2,943,411 2,943,411 4,954,736 4,954,736 5.2 In accordance with the terms of agreement between the Company and certain lenders of long term
financing, there are certain restrictions on distribution of dividends by the Company. 5.3 Reconciliation of the number of shares outstanding as at the beginning and at the end of the year is
as under: Opening balance 35,000,000 35,000,000 Issued / cancelled during the year - - Closing balance 35,000,000 35,000,000 6. RESERVES Composition of reserves is as follows: Capital - share premium 6.1 39,898,526 39,898,526 Revenue - general reserve 90,000,000 90,000,000
129,898,526 129,898,526 6.1 This reserve can be utilized by the Company only for the purposes specified in Section 83(2) of the
Companies Ordinance, 1984.

34
2014 2013 Rupees Rupees
7. SURPLUS ON REVALUATION OF PROPERTY, PLANT AND EqUIPMENT
Land - Freehold Opening balance 154,159,464 131,383,464 Revaluation during the year - 22,776,000 154,159,464 154,159,464 Buildings on freehold land Opening balance 174,487,607 132,164,439 Revaluation during the year - 64,449,572 174,487,607 196,614,011 Plant and machinery Opening balance 275,975,969 151,281,791 Revaluation during the year - 217,428,913 275,975,969 368,710,704 Related deferred tax - (95,650,860) 604,623,040 623,833,319 Effect of change in tax rates 9,051,551 - Incremental depreciation charged on revalued property, plant and equipment in current year net of deferred tax transferred to retained earnings (19,437,410) (19,210,279)
594,237,181 604,623,040 This represents surplus over book value resulting from the revaluation of freehold land, buildings
on freehold land and plant and machinery, adjusted by incremental depreciation arising on revaluation of abovementioned assets except freehold land. The latest revaluation was carried out by independent valuers, on March 13, 2013 under current market price / replacement cost methods wherever applicable which resulted in revaluation surplus of Rs. 304,465,854.

35
2014 2013 Rupees Rupees
8. LONg TERm FINANCINg
Banking companies - secured NIB Bank Limited 8.1 25,946,433 27,446,433 The Bank of Punjab 8.2 82,181,112 86,981,112 Standard Chartered Bank (Pakistan) Limited 8.3 140,477,246 150,207,560 Faysal bank Limited 8.4 - 4,444,449 248,604,791 269,079,554 Related parties - unsecured Associated Engineers (Private) Limited 8.5 12,335,447 12,335,447 EMCO Industries Limited Provident fund 8.6 135,274,793 140,870,793 Imperial Electric Company (Private) Limited 8.7 2,615,692 2,615,692 Others - unsecured 150,225,932 155,821,932 Pakistan Tribal Minerals 8.8 - 8,000,000 398,830,723 432,901,486 Less: current portion Related parties - unsecured (4,400,000) (81,454,000) Banking companies - secured (127,326,081) (94,179,232)
13 (131,726,081) (175,633,232)
267,104,642 257,268,254 8.1 The loan was rescheduled in the year ending June 30, 2012 carrying markup @ 3 months KIBOR + 1%
per annum payable on quarterly basis. Under the revised agreement with NIB Bank Limited, outstanding balance of Rs. 57.864 million was repayable in 22 equal monthly installments of Rs 2.5 million and 23rd installment of Rs 2.864 million commencing January 01, 2012. As at June 30, 2014 principal installments amounting to Rs. 25.946 million are due but remained unpaid and are shown under the current liabilities. This loan is secured by first pari passu charge for Rs. 399.325 million on property, plant and equipment of the Company, post dated cheques and personal guarantees of certain directors of the Company.
8.2 The loan was rescheduled during the year ending June 30, 2013 carrying markup @ 3 months KIBOR (if markup is paid within 7 days otherwise 3 months KIBOR + 3%) per annum payable on quarterly basis. Under the rescheduled agreement effective November 1, 2012, the outstanding balance is repayable in 48 monthly installments of amounts between Rs. 0.50 million to Rs. 2.45 million commencing from November 1, 2012. Mark-up is payable monthly from November 1, 2012. As at June 30, 2014 principal installments amounting to Rs. 23.499 million are due but remained unpaid and are shown under the current liabilities. This loan is secured by first pari passu charge of Rs. 227 million over present and future property, plant and equipment of the Company with 25% margin registered with the SECP, post dated cheques and personal guarantees of certain directors of the Company.

36
8.3 The loan was restructured during the year ended June 30, 2013 carrying markup @ 3 months KIBOR per annum payable on quarterly basis. Under the restructured agreement effective April 1, 2013, the outstanding liability of the Company against the running finance facility, which included principal and mark up portions of Rs 139.279 million and Rs 17.197 million respectively, was restructured as a long term finance under which the outstanding principal was payable in 14 quarterly installments and the outstanding mark up was payable in 16 quarterly installments in commencing April 1, 2013. 25% of the mark up on outstanding liability is payable quarterly whereas rest of the mark up is to be deferred and paid with 15th and 16th quarterly installment. As at June 30, 2014 installments amounting to Rs 15.330 million are due but remained unpaid and shown under the current liabilities. This loan is secured by a first pari passu charge of Rs. 140 million in favour of the Bank over the property, plant and equipment of the Company.
8.4 The loan was rescheduled in the year ended June 30, 2012 carrying markup @ 6 months KIBOR + 1% per annum payable on quarterly basis. During the year, the entire outstanding amount of loan was repaid by the Company.
8.5 These are composed of the following loans:
Rate of interest 2014 2013Loan per annum Repayment period Rupees Rupees 1 Nil After improvement in the financial position of the Company. 3,173,867 3,173,867 2 7.55% After improvement in the financial position of the Company. 4,500,000 4,500,000 3 7.55% Mark-up on the loan is payable annually @ 7.55% (2013: 7.55%) per annum on the outstanding principal of loan, amounting to Rs. 2.896 million. The repayment schedule was revised effective January 1, 2009. Under the revised schedule, the loan was repayable in 18 equal monthly installments of Rs. 0.250 million each and the 19th installment of Rs. 0.161 million commencing January 1, 2009. However, no installment has been paid up to June 30, 2014. 4,661,580 4,661,580 12,335,447 12,335,447 8.5.1 As on June 30, 2014 Associated Engineers (Private) Limited has agreed not to demand the outstanding
amount before June 30, 2015. The current and overdue portion of this loan amounts to Rs. 4,661,580.
8.6 This represents loan obtained from EMCO Industries Limited Provident Fund on July 01, 2000. Owing to non-payment on account of liquidity issues, this loan had been rescheduled a number of times. Latest rescheduling of the loan was carried out on October 01, 2013 by Trustees of the fund whereby the loan shall be repaid in 48 unequal quarterly installments commencing from October 01, 2013 and would carry mark up @ WACC + 1 % on outstanding principal.
8.7 This represents outstanding loan obtained from M/s Imperial Electric Company (Private) Limited. Of this
amount Rs. 1.986 million carries mark-up @ 7.55% (2013: 7.55%) per annum and remaining is interest free. As at the balance sheet date, M/s Imperial Electric Company (Private) Limited has agreed not to demand this balance upto June 30, 2015.
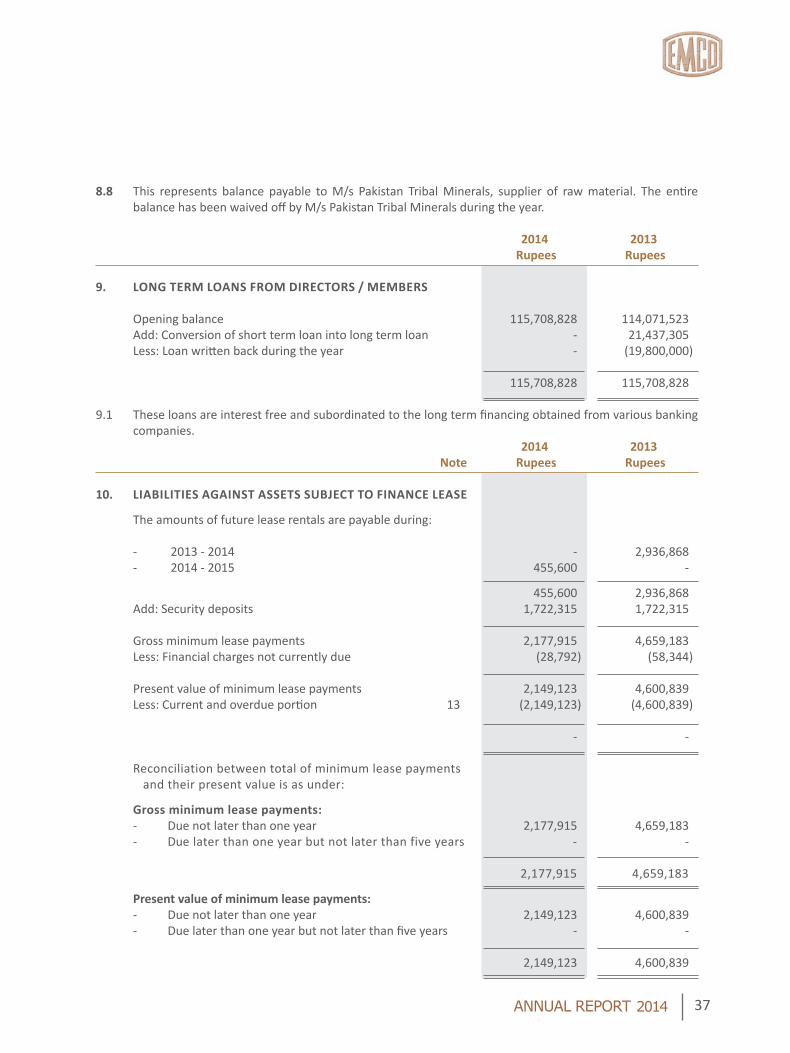
37
8.8 This represents balance payable to M/s Pakistan Tribal Minerals, supplier of raw material. The entire balance has been waived off by M/s Pakistan Tribal Minerals during the year.
2014 2013 Rupees Rupees
9. LONG TERM LOANS FROM DIRECTORS / MEMBERS
Opening balance 115,708,828 114,071,523 Add: Conversion of short term loan into long term loan - 21,437,305 Less: Loan written back during the year - (19,800,000)
115,708,828 115,708,828 9.1 These loans are interest free and subordinated to the long term financing obtained from various banking
companies. 2014 2013 Note Rupees Rupees
10. LIABILITIES AGAINST ASSETS SUBJECT TO FINANCE LEASE
The amounts of future lease rentals are payable during: - 2013 - 2014 - 2,936,868 - 2014 - 2015 455,600 -
455,600 2,936,868 Add: Security deposits 1,722,315 1,722,315
Gross minimum lease payments 2,177,915 4,659,183 Less: Financial charges not currently due (28,792) (58,344)
Present value of minimum lease payments 2,149,123 4,600,839 Less: Current and overdue portion 13 (2,149,123) (4,600,839)
- - Reconciliation between total of minimum lease payments and their present value is as under:
Gross minimum lease payments: - Due not later than one year 2,177,915 4,659,183 - Due later than one year but not later than five years - -
2,177,915 4,659,183
Present value of minimum lease payments: - Due not later than one year 2,149,123 4,600,839 - Due later than one year but not later than five years - - 2,149,123 4,600,839

38
The present value of minimum lease payments have been discounted at implicit interest rates ranging from 13.63% to 14.47% per annum (2013: 13.63% to 19.00% per annum) to arrive at their present values. Taxes, repairs, replacements and insurance costs are borne by the lessee. Purchase option is exercisable by the Company and the Company intends to exercise its option. In case of late payment, charges vary from Rs. 100 per day to Rs. 0.05 per Rs. 1,000 per day and 3% per month on outstanding principal balance.
2014 2013 Note Rupees Rupees
11. DEFERRED LIABILITIES
Payable to employees against discontinued provident fund 11.1 8,126,709 12,248,634 Non-workmen staff gratuity - unfunded 11.2 29,331,764 34,149,905
37,458,473 46,398,539 11.1 Payable to employees against discontinued provident fund
Opening balance 12,248,634 15,299,507 Add: amount transferred from Gratuity fund - 2,255,472 Mark-up accrued thereon 725,043 572,016
12,973,677 18,126,995 Less: Payments made during the year (4,846,968) (5,878,361)
Closing balance 8,126,709 12,248,634 This represents outstanding balance of employer contribution payable to non-workmen employees for
termination of provident fund scheme with effect from December 31, 2002. The outstanding balance of employer contribution payable includes both, principal and interest portions. Interest is being charged on the principal portion at a rate of 10% (2013: 10%) per annum. The balance, along with the profit, is being paid as and when requested by the employees.
As per the Company’s provident fund policy, if an employee joined the Company as a worker but was later
promoted to staff category, he remained a member of the provident fund instead of being eligible for the gratuity scheme available to “staff” category employees. Pursuant to an agreement with the members of the provident fund dated November 16, 2011, the balances of the staff category employees, who were members of the provident fund, were transferred to the discontinued provident fund as at January 1, 2012. This balance was transferred net of loan and interest thereon taken by the members against their provident fund balances. Furthermore, these employees were then entitled to the gratuity scheme with effect from January 1, 2012. In the current year, the amount transferred from provident fund represents the interest portion on provident fund contribution of such employees. As per the agreement, no interest will be accrued on the employees’ contribution to date transferred to the fund, whereas mark-up will be accrued at 5% on the contribution by the Company.
11.2 Non-workmen staff gratuity - unfunded The latest valuation of defined benefit gratuity scheme was conducted as on June 30, 2014. Results of
actuarial valuation are as under:

39
2014 2013 Rupees Rupees
11.2.1 Movement in net liability for staff gratuity
Opening balance 34,149,905 27,127,510 Charge for the year - Profit and loss account 7,903,771 7,703,815 Charge for the year - Other comprehensive income (1,960,472) 2,329,216 Payments made during the year (10,761,440) (3,010,636)
Closing balance 29,331,764 34,149,905 11.2.2 Charge for the year The amounts recognised in the profit and loss account against defined benefit scheme are as follows:
Current service cost 4,936,954 4,634,164 Interest cost 2,966,817 3,069,651
7,903,771 7,703,815 11.2.3 Staff gratuity
Present value of defined benefit obligation 20,334,448 29,668,170 Benefits due but not paid 8,997,316 4,481,735 Liability as at June 30 29,331,764 34,149,905 11.2.4 Movement in present value of defined benefit obligation Opening balance 29,668,170 25,580,428 Benefits due but not paid as at June 30 4,481,735 1,547,082 Interest cost 2,966,817 3,069,651 Current service cost 4,936,954 4,634,164 Benefits paid (10,761,440) (3,010,636) Benefits due but not paid (8,997,316) (4,481,735) Actuarial (gain) / loss recognized in other comprehensive income (1,960,472) 2,329,216
Closing balance 20,334,448 29,668,170

40
11.2.5 Amounts for current period and previous four annual periods of the present value of defined benefit obligation are as follows:
2014 2013 2012 2011 2010 Rupees Rupees Rupees Rupees Rupees Present value of defined benefit obligation 20,334,448 29,668,170 25,915,893 24,645,668 21,816,987 Experience adjustment’s arising on obligation (1,960,472) 2,329,216 70,034 (2,072,293) 1,145,468
Rupees
11.2.6 Estimated Charge for the year 2014-2015
Current service cost 2,643,118 Interest cost 2,468,013 5,111,131 11.2.7 Year end sensitivity analysis on defined benefit obligation Reasonably possible changes at the balance sheet date to one of the relevant actuarial assumptions,
holding other assumptions constant, would have resulted in present value of defined benefit obligation as stated below:
Rupees Discount rate + 100 bps 19,110,341 Discount rate - 100 bps 22,220,140 Salary increase + 100 bps 22,220,140 Salary increase - 100 bps 19,086,198
2014 2013 Rupees Rupees
12. DEFERRED TAxATION
Accelerated tax depreciation 86,507,326 102,886,437 Revaluation of property, plant and equipment 193,860,206 211,755,304 Provision for doubtful debts (3,963,372) (4,644,366) Provision for obsolete stores and spares (696,170) (727,263) Provision for obsolete stock (4,923,769) (5,428,205) Unused tax losses (180,440,582) (193,564,555)
90,343,639 110,277,352

41
2014 2013 Note Rupees Rupees
13. TRADE AND OTHER PAYABLES
Trade creditors 13.1 152,677,451 177,018,677 Accrued liabilities 51,067,622 78,142,987 Sales tax and special excise duty payable 19,500,171 31,079,953 Advances from customers 43,714,238 16,334,068 Unclaimed dividends 208,552 208,551 Employees’ welfare fund 167,832 115,948 Provident fund payable 553,315 920,229 Claims payable 138,403 - Income tax payable 4,047,097 15,345,554 Others 4,514,578 5,442,054 276,589,259 324,608,021 13.1 Trade creditors include amount due to related parties amounting to Rs. 255,465 (2013: Rs 19,879). 14. ACCRUED FINANCE COST
Long term financing: - From related parties 91,716,049 79,278,648 - From banking companies 19,467,824 7,419,589 Liabilities against assets subject to finance lease 28,779 - Short term borrowings from related parties 4,506,255 1,013,316 Finances under mark-up arrangements 28,640,791 16,876,835
144,359,698 104,588,388 15. FINANCES UNDER MARk-UP ARRANGEMENTS - SECURED
Running finances 15.1 181,475,469 201,488,104 Export and import finances 15.2 157,771,270 165,088,007
339,246,739 366,576,111 15.1 Short-term running finances available from various commercial banks under mark-up arrangements
amount to Rs 212.5 million (2013: Rs 225.5 million). The rates of mark-up range from 1 month KIBOR + 1% to 3 months KIBOR + 3.25% per annum on the balance outstanding. Aggregate short term finances are secured by hypothecation of stores, stock-in trade, receivables, charge on present and future property, plant and equipment of the Company, personal guarrantees of the directors, charge on entire assets of the Company, mortgage over commercial properties owned by Associated Engineering (Private) Limited and properties owned by directors and their close relatives.

42
15.2 Export and import finances available from various commercial banks under mark-up arrangements amount to Rs. 30 million (2013: Rs. 50 million) and Rs. 223.25 million (2013: Rs. 375 million) respectively. The rates of mark-up range from 1 month KIBOR plus 1% to 3 month KIBOR plus 2.5%. In the event the Company fails to pay the balances till due date, liquidated charges of 2% over and above the mark-up rate or a flat rate of 16% shall be charged on the principal amount . The aggregate export and import finances are secured by hypothecation of stores, spares and loose tools, stock-in-trade, trade debts, second charge on the property, plant and equipment of the Company and property owned by directors. As at June 30, 2014, principal installments against import finances amounting to Rs. 115.017 million (2013: Rs. 7.77 million) were due but not paid.
2014 2013 Note Rupees Rupees
16. ShORT TERm BORROwINgS FROm RELATED PARTIES - UNSECURED
Directors and close relatives thereof: - Interest free loans 16.1 136,452,269 63,538,486 - Loans chargeable to interest 16.2 50,000,000 62,000,000 186,452,269 125,538,486 16.1 This represents interest free loans obtained from directors, close relatives of directors and other related
parties. Repayment terms of loans have yet not been agreed.
16.2 This represents loans from close relatives of directors and other related parties. Rates of mark-up range
from 3 month KIBOR + 3% to 3 months KIBOR + 4% per annum on the balance outstanding. These loans are repayable by June 30, 2015.
2014 2013 Note Rupees Rupees
17. CURRENT PORTION OF NON-CURRENT LIABILITIES
Long term financing 8 131,726,081 175,633,232 Liabilities against assets subject to finance lease 10 2,149,123 4,600,839 133,875,204 180,234,071 18. CONTINgENCIES AND COmmITmENTS
18.1 Contingencies 18.1.1 The Collector of Sales Tax raised demands in previous years of Rs. 0.11 million being sales tax and penalties
under section 47 of the Sales Tax Act, 1990 on sale of fixed asset and vehicles. The demand was set aside by the Appellate Tribunal. The Department filed an appeal before the Lahore High Court which is pending hearing. No provision has been made in financial statements for this as the management is confident that the case will be decided in its favour.

43
18.1.2 In the year ended June 30, 2005, Sales Tax Department conducted post exportation audit under the Duty and Tax Remission for Exports (DTRE) Scheme, 2001 and imposed a penalty of Rs. 8.624 million due to non compliance of certain provisions of the Scheme by the Company. On application by the Company, the Federal Board of Revenue (FBR) appointed an Alternate Dispute Resolution Committee (ADRC) for the resolution of the dispute between the Company and the Department. ADRC has given its recommendations to FBR in favour of the Company and as such no provision is made in these financial statements in this regard. The final order of the FBR in this regard is awaited.
18.1.3 The Company has indemnified the Trustees of EMCO Industries Limited Provident Fund and the
beneficiaries thereof, from any and all events wherein they or anyone suffers any loss and / or damage for allowing the Company rescheduled time frame to repatriate the borrowed sum amounting to Rs. 140.871 million (2013: Rs. 140.871 million) as at June 30, 2014 into the fund.
18.2 Commitments 18.2.1 Letters of credit other than for capital expenditure amount to Rs. 51.21 million (2013: Rs. 57.67 million).
18.2.2 Bank guarantees amount to Rs. 102.39 million (2013: Rs. 125.49 million). The Company has issued
guarantees in favour of the following companies: 2014 2013 Rupees Rupees WAPDA 50,511,000 49,621,080 Sui Northern Gas Pipeline Limited 51,880,846 75,867,289
102,391,846 125,488,369 18.2.3 The amount of future payments under operating leases and the period in which these payments will
become due are as follows: 2014 2013 Note Rupees Rupees Not later than one year - 9,554,792 Later than one year but not later than five years - 40,048,501 Later than five years - -
- 49,603,293
19. PROPERTY, PLANT AND EqUIPMENT
Operating fixed assets 19.1 1,227,666,782 1,305,834,295 Capital work in progress - civil works 19.2 5,150,000 - 1,232,816,782 1,305,834,295

44
19.1 Operating fixed assets
Year Ended June 30, 2014 Description Freehold Buildings on Plant and Tools and Furniture Office Vehicles Total Land Freehold Land Machinery Equipment and Fittings Equipment Rupees Rupees Rupees Rupees Rupees Rupees Rupees Rupees Cost Balance as at July 01, 2013 182,250,000 515,956,392 1,803,784,175 9,231,723 8,394,412 28,425,904 16,829,145 2,564,871,751 Additions - - 7,265,506 - - 130,324 - 7,395,830 Disposal during the year - - - - (78,900) (78,100) (849,000) (1,006,000)
Balance as at June 30, 2014 182,250,000 515,956,392 1,811,049,681 9,231,723 8,315,512 28,478,128 15,980,145 2,571,261,581 Accumulated depreciation Balance as at July 01, 2013 - 194,857,813 1,012,991,206 9,089,701 7,572,318 23,800,791 10,725,627 1,259,037,456 Charge for the year - 19,763,632 63,066,675 30,532 164,419 944,371 1,220,703 85,190,332 Disposals - - - - (70,000) (65,000) (497,989) (632,989)
Balance as at June 30, 2014 - 214,621,445 1,076,057,881 9,120,233 7,666,737 24,680,162 11,448,341 1,343,594,799 Total as at June 30, 2014 182,250,000 301,334,947 734,991,800 111,490 648,775 3,797,966 4,531,804 1,227,666,782 Depreciation rates - 5% 4%-35% 20%-40% 20% 20% 20% Year Ended June 30, 2013 Cost Balance as at July 01, 2012 159,474,000 451,506,820 1,565,872,969 9,231,723 8,388,212 27,624,974 18,925,103 2,241,023,801 Additions - - 20,482,293 - 6,200 800,930 2,038,000 23,327,423 Revaluation 22,776,000 64,449,572 217,428,913 - - - - 304,654,485 Disposals - - - - - - (4,133,958) (4,133,958) Balance as at June 30, 2013 182,250,000 515,956,392 1,803,784,175 9,231,723 8,394,412 28,425,904 16,829,145 2,564,871,751 Accumulated depreciation Balance as at July 01, 2012 - 177,511,040 924,961,945 9,049,764 7,368,028 22,782,568 12,146,892 1,153,820,237 Charge for the year - 17,346,773 88,029,261 39,937 204,290 1,018,223 1,661,342 108,299,826 Disposals - - - - - - (3,082,607) (3,082,607)
Balance as at June 30, 2013 - 194,857,813 1,012,991,206 9,089,701 7,572,318 23,800,791 10,725,627 1,259,037,456 Total as at June 30, 2013 182,250,000 321,098,579 790,792,969 142,022 822,094 4,625,113 6,103,518 1,305,834,295 Depreciation rates - 5% 7.3%-35% 20%-40% 20% 20% 20%
2014 2013 Note Rupees Rupees 19.1.1 Apportionment of depreciation charge for the year Depreciation charge for the year has been apportioned as follows:
Cost of sales 30 83,365,104 105,923,783 Administrative expenses 31 1,774,184 2,018,542 Selling and distribution expenses 32 51,044 357,501
85,190,332 108,299,826

45
19.2 Disposal of property, plant and equipment
Detail of property, plant and equipment disposed off during the year is as follows: Particulars Cost Accumulated Written Sale (Loss) / Gain Buyer Mode of sale depreciation down value proceeds on disposal Name
Rupees Rupees Rupees Rupees Rupees
Assets with book value exceeding Rs. 50,000 Vehicle 849,000 (497,989) 351,011 225,000 (126,011) Fahad Shafiq At market value Assets with book value below Rs. 50,000 157,000 (135,000) 22,000 150,000 128,000 Various parties At market value
Total 2014 1,006,000 (632,989) 373,011 375,000 1,989
Total 2013 4,133,958 (3,082,607) 1,051,352 2,818,701 1,767,350
19.3 Cost, accumulated depreciation and book value of revalued assets, had there been no revaluation
Had there been no revaluation, the carrying amounts of the following classes of assets would have been as follows:
2014 2013 Rupees Rupees
Freehold land 159,474,000 159,474,000 Factory buildings on freehold land 231,058,567 257,454,626 Plant and machinery 512,209,443 577,332,056
902,742,010 994,260,682
19.3 The management revised its estimate for depreciation of certain plant and machinery from 7.3% to 4% during the year. Had there been no change in the estimate, the depreciation charge for the year would have increased by Rs. 33.851 million.
20. ASSETS SUBJECT TO FINANCE LEASE
Year Ended June 30, 2014
Description Plant and Vehicles Total Machinery Rupees Rupees Rupees
Cost
Balance as at July 01, 2013 16,538,177 5,487,000 22,025,177 Disposals / adjustment - (5,487,000) (5,487,000)
Balance as at June 30, 2014 16,538,177 - 16,538,177
Accumulated depreciation
Balance as at July 01, 2013 5,350,413 2,745,699 8,096,112 Charge for the year 816,707 435,966 1,252,673 Disposals - (3,181,665) (3,181,665)
Balance as at June 30, 2014 6,167,120 - 6,167,120 Total as at June 30, 2014 10,371,057 - 10,371,057

46
Description Plant and Vehicles Total Machinery Rupees Rupees Rupees
Year Ended June 30, 2013 Cost Balance as at July 01, 2012 16,538,177 5,487,000 22,025,177 Additions - - - Balance as at June 30, 2013 16,538,177 5,487,000 22,025,177 Accumulated depreciation Balance as at July 01, 2012 4,143,126 2,060,369 6,203,495 Charge for the year 1,207,287 685,330 1,892,617 Balance as at June 30, 2013 5,350,413 2,745,699 8,096,112 Total as at June 30, 2013 11,187,764 2,741,301 13,929,065 Depreciation rates 7.3% 20%
2014 2013 Note Rupees Rupees 20.2 Apportionment of depreciation charge for the year Depreciation charge for the year has been apportioned as follows: Cost of sales 30 816,707 1,160,511 Administrative expenses 31 435,966 449,504 Selling and distribution expenses 32 - 282,598 1,252,673 1,892,613 21. INTANgIBLE ASSETS Net Carrying Value Net carrying value - opening balance 3,839,623 4,266,250 Additions during the year - - 3,839,623 4,266,250 Amortization during the year 21.1 (383,962) (426,627) Net carrying value as at June 30, 2014 3,455,661 3,839,623 Gross Carrying Value Cost 6,195,002 6,195,002 Accumulated amortization (2,739,341) (2,355,379) Net book value 3,455,661 3,839,623 Amortization rate 10% 10%

47
21.1 Apportionment of amortization charge for the year has been allocated to administrative expenses.
2014 2013 Note Rupees Rupees 22. LONg TERm LOANS
Loans to employees - (secured - considered good) - Executives 22.1 506,252 41,540 - Other employees 4,171,983 3,256,108
4,678,235 3,297,648 Less: current portion (1,472,126) (2,183,353)
3,206,109 1,114,295 These represent loans for purchase of motorcycles, bicycles and for the construction of residential houses
etc. These loans are secured against gratuity and are interest free. The loans are repayable in two to eight years.
22.1 Reconciliation of carrying amount of loans to executives Opening balance on July 1 41,540 620,000 Add: Disbursements 600,000 41,540 Less: Repayments (135,288) (620,000)
506,252 41,540 23. LONG TERM DEPOSITS These represent amounts deposited by the Company as security given to various parties against services
provided by them. 2014 2013 Note Rupees Rupees
24. STORES, SPARES AND LOOSE TOOLS
Stores 19,788,473 22,546,186 Spare parts 85,418,100 88,147,457 Spare parts in transit 284,279 7,185,000 Loose tools 2,669,927 2,717,333
108,160,779 120,595,976 Less: Provision for obsolescence of stock 24.1 (2,189,069) (2,189,069)
105,971,710 118,406,907

48
2014 2013 Note Rupees Rupees
24.1 Provision for obsolescence of stock Opening balance 2,189,069 2,189,069 Provision for the year - - 2,189,069 2,189,069 Less: Obsolete stocks written off - - 2,189,069 2,189,069 24.2 Stores and spare parts include items which may result in fixed capital expenditure but are not
distinguishable.
25. STOCk-IN-TRADE
Raw materials 25.1 105,090,727 114,239,617 Materials in transit 10,973,440 35,691,342 Work-in-process 26,957,435 35,462,946 Finished goods 25.2 185,234,655 189,564,881 Goods purchased for resale 4,503,226 4,230,206 332,759,483 379,188,992 Less: Provision for obsolescence of stock 25.3 (15,482,527) (15,482,527)
317,276,956 363,706,465 25.1 Raw materials amounting to Rs. Nil (2013: Rs 1.547) are in the possession of various vendors for further
processing. 25.2 Finished goods amounting to Rs. Nil (2013: Rs 1.412 million) are valued at net realizable value.
2014 2013 Rupees Rupees 25.3 Provision for obsolescence of stock Opening balance 15,482,527 16,338,958 Provision for the year - - 15,482,527 16,338,958 Less: Obsolete stocks written off - (115,199) Less: Provision reversed during the year - (741,232)
15,482,527 15,482,527

49
2014 2013 Note Rupees Rupees 26. TRADE DEBTS
Local - (Unsecured - considered good) 26.1 320,403,955 248,975,871 Local - (Unsecured - considered doubtful) 12,462,611 13,979,597 Related parties - (Unsecured - considered good) 423,010 1,465,719 Foreign - (secured - considered good) 2,104,750 7,638,938
335,394,326 272,060,125 Less: Provision for doubtful debts 26.2 (12,462,611) (13,979,597)
322,931,715 258,080,528 26.1 Due from related parties
These relate to normal business of the Company and are interest free. Fatima Memorial Hospital Trust 31,788 189,116 ICC (Private) Limited 63,059 63,059 Nur Enterprises 305,866 1,213,544
400,713 1,465,719 26.2 Provision for doubtful debts
Opening balance 13,979,597 9,940,974 Provision for the year - 4,504,803
13,979,597 14,445,777 Less: Bad debts written off (1,516,986) (466,180)
12,462,611 13,979,597
27. LOANS, ADVANCES, DEPOSITS, PREPAYMENTS AND OTHER RECEIVABLES
Current portion of loans to employees - considered good 1,472,126 2,183,353 Advances - considered good - to employees 27.1 6,503,067 5,921,557 - to suppliers 16,335,853 13,402,829
22,838,920 19,324,386 Due from related parties - considered good 27.2 26,150 255,465 Security deposits 26,416,571 19,127,772 Margins against letters of credit - 190,091 Claims receivable - 2,946,367 Claims recoverable from government - Excise Duty 2,173 2,173 Prepayments 105,664 510,985 Recoverable from employees 27.3 19,916,733 15,342,325 Margins held by bank 13,168,890 14,899,302
83,947,227 74,782,219 Less: Provision for doubtful advances 27.4 (575,686) (575,686)
83,371,541 74,206,533

50
27.1 This includes an amount of Rs. 5.952 million (2013: Rs. 5.252 million) due from an executive (Senior Manager Commercial). This amount is paid as advance for maintenance of plant and machinery. This also includes an amount of Rs. 0.010 million (2013: Rs 0.053 million) due from directors. The amount is paid to directors as advance for expenditure to be reimbursed by the Company.
2014 2013 Rupees Rupees
27.2 Balances due from related parties: ICC (Private) Limited 6,467 - Imperial Soft (Private) Limited 19,683 255,465 26,150 255,465 27.3 This represents recoveries imposed on employees on account of faulty finished goods and shortages of
inventory. 27.4 Provision for doubtful advances Opening balance 575,686 - Add: Provision for the year - 575,686
575,686 575,686 Less: Advances written off against provision - - 575,686 575,686 28. CASh AND BANk BALANCES
Cash in hand 379,246 11,438,029 At banks - current accounts 1,474,809 35,663,067 1,854,055 47,101,096

51
29. SALES Insulator Tile 2014 2013 Rupees Rupees Rupees Rupees Gross sales - Local 441,000,280 602,253,695 1,043,253,975 1,830,094,162 - Export 50,733,724 - 50,733,724 46,192,501
491,734,004 602,253,695 1,093,987,699 1,876,286,663
Less: Trade discounts - (6,314,593) (6,314,593) (37,661,270) Less: Sales tax (67,805,255) (87,519,480) (155,324,735) (242,837,223)
Net sales 423,928,749 508,419,622 932,348,371 1,595,788,170 29.1 There are no inter segment sales. 30. COST OF SALES Insulator Tile 2014 2013 Note Rupees Rupees Rupees Rupees
Raw and packing material consumed 129,186,436 105,290,159 234,476,595 461,373,152 Stores and spares consumed 19,328,087 16,593,230 35,921,317 59,438,208 Salaries, wages and benefits 30.1 95,448,660 69,255,715 164,704,375 253,370,608 Power and gas 57,864,889 167,623,310 225,488,199 388,401,757 Vehicle maintenance 155,338 208,875 364,213 474,334 Repairs and maintenance 732,093 2,243,592 2,975,685 6,886,691 Insurance 2,022,867 933,930 2,956,797 3,456,276 Communication and stationery 709,608 560,185 1,269,793 2,055,113 Rent, rates and taxes 648,823 14,470,993 15,119,816 20,242,364 Travelling and conveyance 2,138,061 1,250,518 3,388,579 4,759,040 Others 4,740,111 130,253 4,870,364 10,419,726 Depreciation on property, plant and equipment 19.1 24,857,114 58,507,990 83,365,104 105,923,783 Depreciation on assets subject to finance lease 20.1 - 816,707 816,707 1,160,511
337,832,087 437,885,457 775,717,544 1,317,961,563 Work in process - Opening work in process 21,914,066 13,548,880 35,462,946 37,114,281 - Closing work in process (26,957,435) - (26,957,435) (35,462,946)
(5,043,369) 13,548,880 8,505,511 1,651,335
Cost of goods manufactured 332,788,718 451,434,337 784,223,055 1,319,612,898
Finished goods - Opening finished goods 138,232,933 51,331,948 189,564,881 220,880,533 - Closing finished goods (185,234,655) - (185,234,655) (189,564,881)
(47,001,722) 51,331,948 4,330,226 31,315,652 285,786,996 502,766,285 788,553,281 1,350,928,550 30.2 This includes Rs. 6,698,581 (2013: Rs. 5,388,289) in respect of employee benefits.

52
31. ADMINISTRATIVE ExPENSES Insulator Tile 2014 2013 Note Rupees Rupees Rupees Rupees Salaries, wages and benefits 16,792,292 18,931,818 35,724,110 39,725,841 Communication and stationery 926,572 1,044,857 1,971,429 2,207,192 Travelling 436,574 492,307 928,881 1,184,676 Vehicle maintenance 1,787,230 2,015,000 3,802,230 4,572,438 Rent, rates and taxes 31.2 1,504,508 1,656,234 3,160,742 7,125,000 Electricity and gas 514,236 579,883 1,094,119 845,313 Insurance 58,285 65,725 124,010 303,517 Legal and professional charges 1,991,321 1,860,532 3,851,853 203,150 Repairs and maintenance 320,078 360,939 681,017 472,507 Computer charges 131,765 148,585 280,350 453,418 Security charges 299,695 337,953 637,648 1,137,973 Fees and taxes 740,125 834,608 1,574,733 1,551,673 Others 609,378 691,808 1,301,186 2,252,754 Depreciation on property, plant and equipment 19.1 827,626 946,558 1,774,184 2,018,542 Depreciation on assets subject to finance lease 20.1 - 435,966 435,966 449,504 Amortization of intangible assets 21.1 99,830 284,132 383,962 426,627
27,039,515 30,686,905 57,726,420 64,930,125 31.1 This includes Rs. 2,958,449 (2013: Rs. 1,557,339) in respect of employee benefits.
31.2 Rent, rates and taxes include operating lease rentals amounting to Rs. 3.160 million (2013: Rs. 7.125 million) due to related parties.
32. SELLING AND DISTRIBUTION ExPENSES
Insulator Tile 2014 2013 Note Rupees Rupees Rupees Rupees Salaries, wages and benefits 32.1 1,907,689 10,929,776 12,837,465 19,217,596 Travelling 1,380,940 4,492,515 5,873,455 8,997,646 Insurance 36,163 28,643 64,806 249,966 Handling, freight and transportation 7,549,151 23,349,842 30,898,993 63,276,894 Electricity and gas 41,435 753,293 794,728 1,529,171 Vehicle maintenance 18,910 678,834 697,744 885,747 Rent, rates and taxes 32.2 758,030 2,826,777 3,584,807 5,837,746 Communication 233,565 589,076 822,641 1,514,228 Repair and maintenance 1,850 63,939 65,789 613,646 Security charges 15,593 192,035 207,628 319,116 Advertisement and sales promotion 117,570 209,027 326,597 1,021,118 Depreciation on property, plant and equipment 19.1 - 51,044 51,044 357,501 Depreciation on assets subject to finance lease 20.1 - - 282,598 Compensation for defects 64,060 31,047,147 31,111,207 39,980,474 Late delivery charges 13,134,016 - 13,134,016 9,380,281 Others 116,509 658,679 775,188 1,973,328 25,375,481 75,870,627 101,246,108 155,437,056
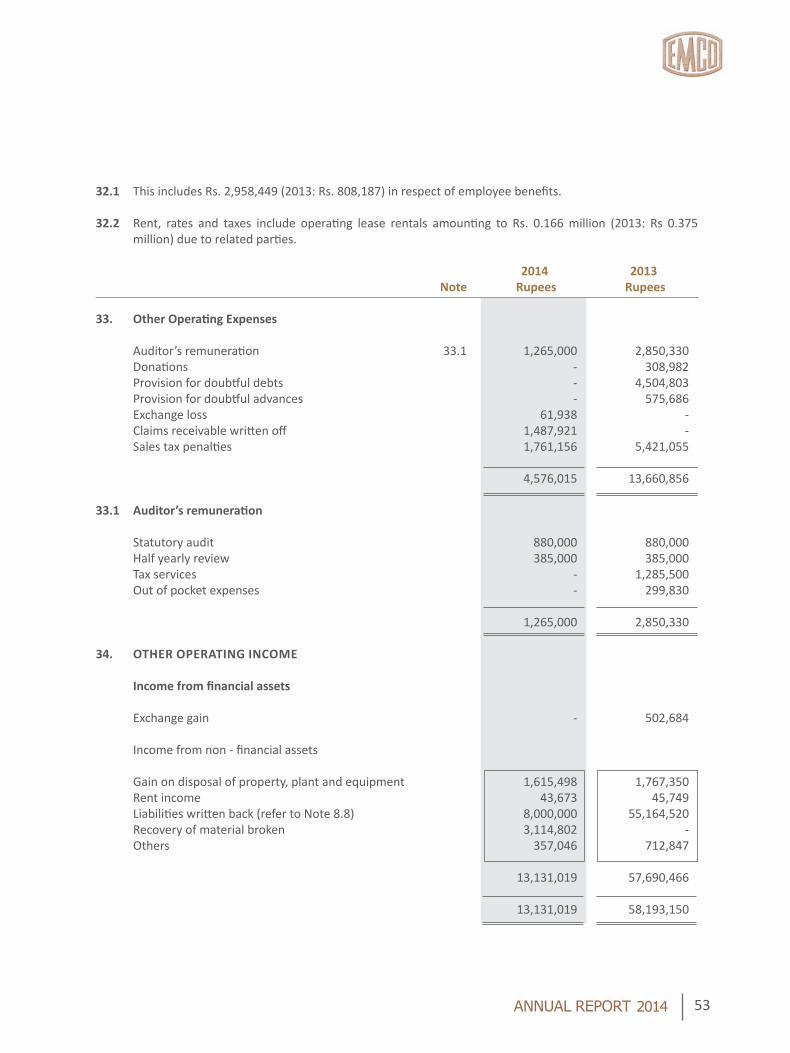
53
32.1 This includes Rs. 2,958,449 (2013: Rs. 808,187) in respect of employee benefits.
32.2 Rent, rates and taxes include operating lease rentals amounting to Rs. 0.166 million (2013: Rs 0.375 million) due to related parties.
2014 2013 Note Rupees Rupees
33. Other Operating Expenses
Auditor’s remuneration 33.1 1,265,000 2,850,330 Donations - 308,982 Provision for doubtful debts - 4,504,803 Provision for doubtful advances - 575,686 Exchange loss 61,938 - Claims receivable written off 1,487,921 - Sales tax penalties 1,761,156 5,421,055 4,576,015 13,660,856 33.1 Auditor’s remuneration Statutory audit 880,000 880,000 Half yearly review 385,000 385,000 Tax services - 1,285,500 Out of pocket expenses - 299,830 1,265,000 2,850,330 34. OTHER OPERATING INCOME
Income from financial assets Exchange gain - 502,684 Income from non - financial assets Gain on disposal of property, plant and equipment 1,615,498 1,767,350 Rent income 43,673 45,749 Liabilities written back (refer to Note 8.8) 8,000,000 55,164,520 Recovery of material broken 3,114,802 - Others 357,046 712,847 13,131,019 57,690,466
13,131,019 58,193,150

54
2014 2013 Note Rupees Rupees
35. FINANCE COST
Long term finances: - Banking companies 25,448,336 17,476,891 - EMCO Industries Limited Provident Fund 17,347,744 18,051,989 - Related parties 558,405 756,885 Short term finances from related parties 5,894,719 2,491,232 Discontinued provident fund 11.1 425,150 572,016 Short term finances under mark-up arrangements 45,262,334 64,530,220 Finance lease 161,619 763,866 Commission on bank guarantees 1,256,929 1,203,255 Bank charges 2,900,855 2,314,410 99,256,091 108,160,764 36. TAxATION
Current 36.1 9,386,629 8,010,001 Deferred (11,505,592) (12,436,902)
(2,118,963) (4,426,901) 36.1 In view of the available income tax losses, the provision for current taxation represents tax under ‘Final Tax
Regime’ and tax on minimum turnover under section 113 of the Income Tax Ordinance, 2001. Minimum tax under section 113 is available for set off for 3 years against normal tax liability arising in future years whereas tax under ‘Final Tax Regime’ is not available for set off against normal tax liabilities arising in future years.
For the purpose of current taxation, tax losses available for carry forward as at June 30, 2013 are estimated approximately at Rs. 546.790 million (2013: Rs 553.321 million).
36.2 Numerical reconciliation between the average effective tax rate and the applicable tax rate.
2014 2013 % age % age
Applicable tax rate 34.00 35.00 Tax effects of amounts that are not deductible for tax purpose (31.29) (4.80) Effect of change in prior years’ tax (0.45) (1.87) Tax credits for which no deferred tax asset has been recognized - (19.29) Tax effect of deferred tax recognition (9.20) - Tax effect under presumptive tax regime and others 8.87 4.25
(32.08) (21.71)
Average effective tax rate charged to profit and loss account 1.92 13.29

55
2014 2013
37. LOSS PER SHARE
Loss for the year attributable to ordinary shareholders Rupees (103,759,562) (34,709,130) Weighted average number of ordinary shares outstanding during the year Numbers 35,000,000 35,000,000 Loss per share - Basic Rupees (2.96) (0.99) 37.1 Diluted earnings per share There is no dilution effect on the basic earnings per share of the Company as the Company has no such
commitments that would result in dilution of earnings of the Company.
2014 2013 Rupees Rupees
38. CASH GENERATED FROM OPERATIONS
CASH FLOWS FROM OPERATING ACTIVITIES Loss before taxation (105,878,525) (39,136,031) Adjustment for non-cash charges and other items: - Depreciation on property, plant and equipment 85,190,332 108,299,826 - Depreciation on assets subject to finance lease 1,252,673 1,892,617 - Amortization of intangible assets 383,962 426,627 - Provision for gratuity 8,628,814 8,275,831 - Provision for doubtful debts - trade - 4,504,803 - Gain on disposal of property, plant and equipment (1,615,498) (1,767,350) - Liabilities written back (8,000,000) (55,164,520) - Claims receivable written off 1,487,921 - - Provision for doubtful advances - 575,686 - Finance cost 99,256,091 108,160,764 186,584,295 175,204,284 Operating profit before working capital changes 80,705,770 136,068,253 Decrease / (increase) in current assets - Stores and spares 12,435,197 (6,927,130) - Stock in trade 46,429,509 77,222,124 - Trade debts (64,851,187) 79,786,413 - Loans and advances, deposits, prepayments and other receivable (11,364,156) (30,499,912) (Decrease) / increase in current liabilities - Trade and other payables (48,018,762) (2,767,272) (65,369,399) 116,814,223 Cash generated from operations 15,336,371 252,882,476

56
39. REMUNERATION OF CHIEF ExECUTIVE, DIRECTORS AND ExECUTIVES
The aggregate amounts charged in the financial statements for the year as remuneration and benefits to the chief executive, full time working directors and other executives of the company are as follows:
Chief Executive Executive Director Executives 2014 2013 2014 2013 2014 2013 Rupees Rupees Rupees Managerial remuneration 2,700,575 2,643,792 9,241,925 8,695,584 2,907,432 10,880,637 Production incentives - - - - - 1,318,314 House rent allowance 654,337 1,189,706 3,187,874 3,934,013 1,308,348 2,498,754 Utilities 529,528 433,940 1,468,510 1,285,944 290,748 564,250 Medical expenses 241,934 1,202,977 275,770 1,266,652 - 883,912 Reimbursable expenses 191,065 1,826,414 3,958,332 6,203,775 - 2,198,687
4,317,439 7,296,829 18,132,411 21,385,968 4,506,528 18,344,554 Number of persons 1 1 4 4 1 8
39.1 An executive is defined as an employee, other than the chief executive and directors, whose basic salary
exceeds Rs. 500,000 in a financial year.
39.2 The Company provides the Chief Executive and some of the directors and executives with company maintained vehicles, residential telephone expenses, reimbursable club expenses, and servant salaries. The Company does not provide any remuneration and benefits to non-executive directors of the Company.
39.3 No meeting fee has been paid to any director of the Company.
40. TRANSACTION WITH RELATED PARTIES Related parties comprise associated undertakings, other related group companies, directors of the
Company and their close relatives, key management personnel and post employment benefit plans. The Company in the normal course of business carries out transactions with various related parties. Amounts due from and due to related parties are shown under trade debts and trade and other payables in Note 26 and 13, accrued finance cost in respect of loans from related parties is disclosed in Note 14, long term loans from related parties are disclosed in Note 9, short term borrowings from related parties are disclosed in Note 16, and remuneration of directors and key management personnel is disclosed in Note 40. Other significant transactions with related parties are given below:

57
Relationship with the company Nature of transaction 2014 2013 Rupees Rupees i. Associated undertakings Markup on long term finances 708,322 557,636 Markup on short term finances 5,547,438 2,339,470 Purchase of goods and services 652,918 346,000 Sale of goods 465,002 474,691,128 ii. Directors and close relatives Short term borrowing obtained 139,634,741 149,013,814 thereof Short term borrowing repaid 79,496,442 121,083,905 Short term loan converted into long term - 21,437,305 iii. Employee benefit plan - EMCO Industries Limited Provident Fund Markup on long term finance 17,347,744 18,051,989 iv. Undertaking in which close family members of a director are holding directorship Sale of goods - 355,347
243,852,607 787,876,594
41. SEGMENT REPORTING
41.1 A business segment is a group of assets and operations engaged in providing products that are subject to risks and returns that are different from those of other business segments. The management has determined the operating segments based on the information that is presented to the Chief Executive Officer for allocation of resources and assessments of performance. Based on internal management reporting structure and products produced and sold, the Company is organized into following two operating segments:
Types of segments Nature of business - Insulator Manufacture and sale of high/low tension electrical porcelain insulators and switchgears - Tile Manufacture and sale of ceramic tiles The management monitors the operating results of its business units separately for the purpose of making
decision about resource allocation and performance assessment. Segment performance is generally evaluated based on certain key performance indicators including business volume, gross profit, profit from operations, reduction in operating cost and free cash flows.
Segment assets include all operating assets used by a segment and consist principally of receivables,
inventories and property, plant and equipment, net of impairment and provisions but do not include deferred taxes. Segment liabilities include all operating liabilities and consist principally of trade and bills payable.

58
41.2 Segment analysis The segment information for the reportable segments for the year ended June 30, 2014 is as follows.
Insulator Tiles Total Rupees in thousands Segment Results for the Year ended June 30, 2014
Revenue 423,928,749 508,419,622 932,348,371 Segment result from operations 85,726,757 (100,904,195) (15,177,438) Other operating expenses (4,576,015) Finance costs (99,256,091) Other income 13,131,019
Loss before taxation (105,878,525) Segment Results for the year ended June 30, 2013
Revenue 494,580,275 1,101,207,895 1,595,788,170 Segment results from operations 84,299,581 (59,807,142) 24,492,439 Other operating expenses (13,660,856) Finance costs (108,160,764) Other income 58,193,150 Loss before taxation (39,136,031) Segment asset as at June 30, 2014
Segment assets 885,106,929 1,087,272,147 1,972,379,076 Segment asset as at June 30, 2013
Segment assets 773,542,978 1,286,414,282 2,059,957,260

59
Reportable segments’ assets are reconciled to total assets as follows:
2014 2013 Rupees in thousands
Segment assets for reportable segments 1,972,379,076 2,059,957,260 Corporate assets unallocated 144,711,006 145,316,049 Cash and bank balances 1,854,055 47,101,096 Total assets as per the balance sheet 2,118,944,137 2,252,374,405 Reportable segments’ liabilities are reconciled to total liabilities as follows: Corporate liabilities unallocated 1,591,138,751 1,631,198,050 41.3 Entity-wide disclosures regarding reportable segment are as follows:
- Information about major customers One customer of the Company accounts for 28.88% (2012: 39.13%) of total sales for the year.
- Information about geographical area - All non-current assets of the Company are located in Pakistan as at the reporting date.
- Revenue from external customers attributed to foreign countries are as follows:
2014 2013 Rupees in thousands
-Pakistan 881,614,647 1,549,763,492 -Turkey 14,434,210 15,903,459 -Middle East 36,236,137 22,801,395 -Others 63,377 7,319,824
932,348,371 1,595,788,170 42. FINANCIAL RISk mANAgEmENT 42.1 Financial risk factors The Company’s activities expose it to a variety of financial risks: market risk (including currency risk, cash
flow interest rate risk), credit risk and liquidity risk. The Company’s overall risk management programme focuses on the unpredictability of financial markets and seeks to minimize potential adverse effects on the Company’s financial performance.
Risk management is carried out by the Board of Directors (the Board). The Board provides principles for
overall risk management as well as policies covering specific areas such as currency risk, other price risk, interest rate risk, credit risk and liquidity risk.

60
The Company’s overall risk management procedures to minimise the potential adverse effects of financial market on the Company’s performance are as follows:
(a) Market risk Market risk is the risk that the fair value of future cash flows of a financial instrument will fluctuate
because of changes in foreign currency, interest rate, commodity price and equity price that will affect the Company’s income or the value of its holdings of financial instruments.
(i) Currency risk Currency risk is the risk that the fair value or future cash flows of a financial instrument will fluctuate
because of changes in foreign exchange rates. Currency risk arises mainly from future commercial transactions or receivables and payables that exist due to transactions in foreign currencies.
The Company is exposed to currency risk arising from various currency exposures, primarily with respect to United States Dollar (USD). Currently, the Company’s foreign exchange risk exposure is restricted to the amounts receivable from / payable to foreign entities.
At June 30, 2013, if the Rupee had weakend / strengthen by 10% against the US dollar with all other variables held constant, post-tax profit for the year would have been Rs. 5.331 million (2013: Rs. 0.552 million) lower / higher, mainly as a result of foreign exchange losses / gains on translation of US dollar-denominated financial assets and liabilities.
(iii) Interest rate risk This represents the risk that the fair value or future cash flows of a financial instrument will fluctuate
because of changes in market interest rates.
As the Company has no significant floating interest rate assets, the Company’s income is substantially independent of changes in market interest rates. The Company’s interest rate risk arises from short term and long term borrowings. These borrowings, issued at variable rates, expose the Company to cash flow interest rate risk. The Company analyses its interest rate exposure on a dynamic basis. Various scenarios are simulated taking into consideration refinancing, renewal of existing positions, alternative financing and hedging. Based on these scenarios, the Company calculates the impact on profit and loss of a defined interest rate shift. The scenarios are run only for liabilities that represent the major interest-bearing positions.
Cash flow sensitivity analysis for variable rate instruments If interest rates at the balance sheet date fluctuate by 1% higher / lower with all other variables held
constant, loss before taxation for the year would have been Rs. 6.063 million (2013: Rs. 5.298 million) higher / lower, mainly as a result of higher / lower interest expense on floating rate borrowings. This analysis is prepared assuming the amounts of liabilities outstanding at the balance sheet date are outstanding for the entire year.
(b) Credit risk Credit risk represents the risk that one party to a financial instrument will cause a financial loss for the
other party by failing to discharge an obligation. Carrying amounts of financial assets represent the maximum credit exposure.
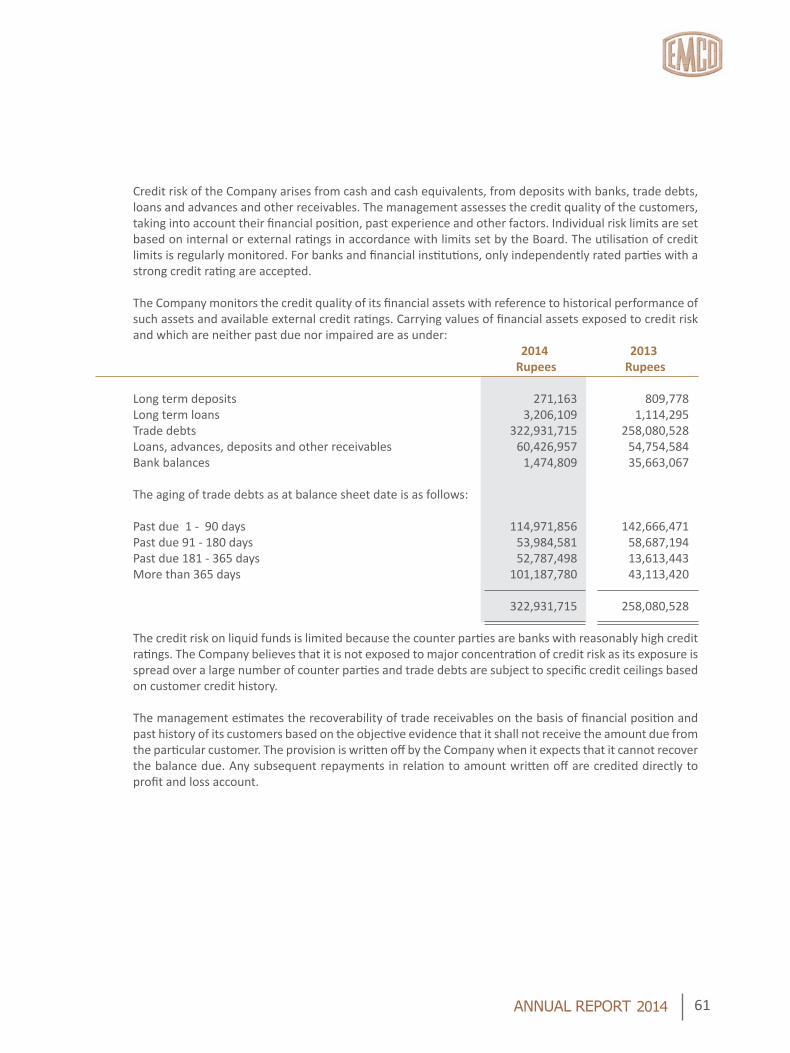
61
Credit risk of the Company arises from cash and cash equivalents, from deposits with banks, trade debts, loans and advances and other receivables. The management assesses the credit quality of the customers, taking into account their financial position, past experience and other factors. Individual risk limits are set based on internal or external ratings in accordance with limits set by the Board. The utilisation of credit limits is regularly monitored. For banks and financial institutions, only independently rated parties with a strong credit rating are accepted.
The Company monitors the credit quality of its financial assets with reference to historical performance of
such assets and available external credit ratings. Carrying values of financial assets exposed to credit risk and which are neither past due nor impaired are as under:
2014 2013 Rupees Rupees
Long term deposits 271,163 809,778 Long term loans 3,206,109 1,114,295 Trade debts 322,931,715 258,080,528 Loans, advances, deposits and other receivables 60,426,957 54,754,584 Bank balances 1,474,809 35,663,067 The aging of trade debts as at balance sheet date is as follows:
Past due 1 - 90 days 114,971,856 142,666,471 Past due 91 - 180 days 53,984,581 58,687,194 Past due 181 - 365 days 52,787,498 13,613,443 More than 365 days 101,187,780 43,113,420 322,931,715 258,080,528 The credit risk on liquid funds is limited because the counter parties are banks with reasonably high credit
ratings. The Company believes that it is not exposed to major concentration of credit risk as its exposure is spread over a large number of counter parties and trade debts are subject to specific credit ceilings based on customer credit history.
The management estimates the recoverability of trade receivables on the basis of financial position and past history of its customers based on the objective evidence that it shall not receive the amount due from the particular customer. The provision is written off by the Company when it expects that it cannot recover the balance due. Any subsequent repayments in relation to amount written off are credited directly to profit and loss account.

62
The credit quality of bank balances that are neither past due nor impaired can be assessed by reference to external credit ratings (if available) or to historical information about counterparty default rate:
Rating Rating Short term Long term Agency 2014 2013 Rupees Rupees Allied Bank Limited A1+ AA+ PACRA 12,605 5,434,006 Askari Bank Limited A1+ AA PACRA 1,184 360,161 Bank Alfalah Limited A1+ AA PACRA 11,595 5,585,460 Bank of Punjab A1+ AA- PACRA 979,235 523,141 Faysal Bank A1+ AA PACRA 6,966 15,962,857 Habib Bank Limited A-1+ AAA JCR-VIS 149,654 466,871 MCB Bank Limited A1+ AAA PACRA 3,015 1,712,257 National Bank of Pakistan A-1+ AAA JCR-VIS 13,075 107,029 Silk Bank Limited A-2 A- JCR-VIS 284,692 1,562,219 Standard Chartered Bank (Pakistan) Limited A1+ AAA PACRA 5,846 136,846 United Bank Limited A-1+ AA+ JCR-VIS 6,942 3,812,221 1,474,809 35,663,068 (c) Liquidity risk
Liquidity risk represents the risk that the Company shall encounter difficulties in meeting obligations associated with financial liabilities. Prudent liquidity risk management implies maintaining sufficient cash and marketable securities, the availability of funding through an adequate amount of committed credit facilities. The management monitors the forecasts of the Company’s cash and cash equivalents (note 39) on the basis of expected cash flow. This is generally carried out in accordance with the practice and limits set by the Company. These limits vary by location to take into account the liquidity of the market in which the Company operates. In addition, the Company’s liquidity management policy involves projecting cash flows in each quarter and considering the level of liquid assets necessary to meet its liabilities, monitoring balance sheet liquidity ratios against internal and external regulatory requirements and maintaining debt financing plans.The table below analyses the Company’s financial liabilities into relevant maturity groupings based on the remaining period as at the balance sheet date to the contractual maturity date. The amounts disclosed in the table are the contractual undiscounted cash flows as the impact of discounting is not significant.
Description
Carrying Contractual Within 1-2 2-5 Above Amount cash flows 1 year Years Years 5 Years Rupees Rupees Rupees Rupees Rupees Rupees Contractual maturities of financial liabilities as at June 30, 2014:
Long term loans from directors 115,708,828 115,708,828 115,708,828 - - 115,708,828 Long term finances 398,830,723 398,830,723 131,726,081 84,353,728 84,594,914 98,156,000 Liabilities subject to finance lease 2,149,123 2,149,123 2,149,123 - - - Short term borrowings- from related parties - unsecured 186,452,269 186,452,269 186,452,269 - - - Finances under markup arrangements - secured 339,246,739 339,246,739 339,246,739 - - - Trade and other payable 232,875,021 232,875,021 232,875,021 - - - Accrued finance cost 144,359,698 144,359,698 144,359,698 - - -
1,419,622,401 1,419,622,401 1,152,517,759 84,353,728 84,594,914 213,864,828

63
Description
Carrying Contractual Within 1-2 2-5 Above Amount cash flows 1 year Years Years 5 Years Rupees Rupees Rupees Rupees Rupees Rupees
Contractual maturities of financial liabilities as at June 30, 2013: Long term loans from directors 115,708,828 115,708,828 - - - 115,708,828 Long term finances 432,901,486 432,901,486 175,633,232 133,091,254 124,177,000 - Liabilities subject to finance lease 4,600,839 4,600,839 4,600,839 - - - Short term borrowings- from related parties - unsecured 125,538,486 125,538,486 125,538,486 - - - Finances under markup arrangements - secured 366,576,111 366,576,111 366,576,111 - - - Trade and other payable 324,608,021 324,608,021 324,608,021 - - - Accrued finance cost 104,588,388 104,588,388 104,588,388 - - -
1,474,522,159 1,474,522,159 1,101,545,077 133,091,254 124,177,000 115,708,828
The contractual cash flows relating to the above financial liabilities have been determined on the basis of interest rates / mark up rates effective as at the balance sheet date. The rates of interest / mark up have been disclosed in relevant notes to these financial statements.
(d) Fair value of financial instruments
Fair value is an amount for which an asset could be exchanged, or a liability settled, between knowledgeable willing parties in an arm’s length transaction. Consequently, differences may arise between the carrying value and the fair value estimates.
As at June 30, 2014 the net fair value of all financial assets and financial liabilities are estimated to approximate their carrying values.
Financial assets which are tradable in an open market are revalued at the market prices prevailing on the balance sheet date. The fair values of all other financial assets and liabilities are not considered to be significantly different from their carrying values.
42.2 Financial instruments by categories
Financial assets as at June 30, 2014
Cash and Cash Loans and Available-for- Total Equivalents advances sale
Rupees in thousands Long term deposits and advances - 271 - 271 Long term loans - 3,206 - 3,206 Trade debts - 322,932 - 322,932 Other receivables - 60,427 - 60,427 Bank balances 1,854 - - 1,854 1,854 386,836 - 388,690

64
Financial assets as at June 30, 2013. Cash and Cash Loans and Available-for- Total Equivalents advances sale
Rupees in thousands Long term deposits and advances - 810 - 810 Long term loans 1,114 1,114 Trade debts - 258,081 - 258,081 Loans, advances and other receivables - 54,755 - 54,755 Bank balances 47,101 - - 47,101
47,101 314,759 - 361,860
Financial liabilities at amortized cost
2014 2013 Rupees Rupees
Long term finances - secured 398,831 432,901 Trade and other payables 232,875 257,765 Accrued finance cost 144,360 104,588 Short term borrowings 525,699 492,115
1,301,765 1,287,369
43. CAPITAL RISk MANAGEMENT
While managing capitals, the objectives of the Company are to ensure that it continues to meet the going concern assumption, enhance shareholders’ wealth and meets stakeholders’ expectations. The Company ensures its sustainable growth viz. maintaining optimal capital structure, keeping its finance cost low, exercising the option of issuing right shares or repurchase shares, if possible, selling surplus property, plant and equipment without affecting the optimal operating level and regulating its dividend payout thus maintaining smooth capital management.
In line with the industry norm, the Company monitors capital on the basis of the gearing ratio. This ratio is calculated as net debt divided by total capital. Net debt is calculated as total borrowings (including current and non current) less cash and cash equivalents. Total capital is calculated as equity as shown in the balance sheet plus net debt.
As at the balance sheet date, the gearing ratio of the Company was worked out as under:
2014 2013 Rupees Rupees
Borrowings 398,830,723 548,610,314 Total capital employed 332,398,928 565,163,629 Gearing ratio 120% 97%

65
44. Plant Capacity and Production
Capcity Total Production
2014 2013 2014 2013 Insulators - tons 5,000 5,000 1,481 2,441 Wall tile - sq. meters. 4,100,000 4,100,000 701,056 1,973,468 Floor tile - sq. meters. 900,000 900,000 367,508 644,204
The low production was due to poor quality of raw material and power shortage.
45. PROVIDENT FUND RELATED DISCLOSURES The Company operates a recognised provident fund for all its permanent workers.
The following information is based on audited financial statements of the Fund as at December 31 2013
and audited December 31, 2012:
2014 2013 Note Rupees Rupees
Size of the Fund 239,628,602 231,279,190 Cost of investments made 45.1 184,619 247,665 Percentage of the investments made 0.08% 0.11% Fair value of investments 184,619 247,665 Break up of investments Special accounts in a scheduled bank 184,619 247,665 45.1 During the year, the Company has, owing to its working capital needs, utilized funds of its Provident Fund
(Fund) at the rate of weighted average cost of long term capital to the Company + 1% per annum. As at December 31, 2013, the Company owes Rs. 143.601 million (2012: Rs. 143.601 million) as principal and Rs. 79.144 million (2012: Rs. 70.237 million) as mark-up to the Fund. Except for the above, the investments of the provident fund have been made in accordance with the provisions of Section 227 of the Companies Ordinance, 1984 and the rules formulated for this purpose.
2014 2013 Number Number
46. NUMBER OF EMPLOYEES
Employees as at June 30, 546 795 Average employees during the year 671 816

66
47. AUThORIzATION OF FINANCIAL STATEmENTS These financial statements were authorized for issue on October 02, 2014 by the Board of Directors of the
Company.
48. gENERAL Comparative figures are re-arranged / reclassified, wherever necessary, to facilitate comparison.
Following re-arrangements / reclassifications have been made in these financial statements for better presentation:
Nature From To Amount (Rupees) Electricity colony Other (Cost of sales) Power and gas (Cost of sales) 1,096,893 Compensation of Sales (Discounts given) Selling and Distribution expenses 39,980,474 defects (Compensation for defects) Provision for Administrative Expenses Other Operating Expenses 4,504,803 doubtful debts Provision for Administrative Expenses Other Operating Expenses 575,686 doubtful advances Auditor’s Administrative Expenses Other Operating Expenses 2,850,330 remuneration
DIRECTOR DIRECTOR
As the chief executive of the company is out of country for the time being, these financial statements have been signed by two directors of the company pursuant to section 241 of companies ordinance 1984.

67
No of Shareholders Shareholding Total Shares Held From To 100 1 100 3,333 283 101 500 69,110 106 501 1,000 89,997 210 1,001 5,000 571,989 56 5,001 10,000 468,535 24 10,001 15,000 326,043 18 15,001 20,000 331,339 9 20,001 25,000 192,756 8 25,001 30,000 230,000 3 30,001 35,000 100,815 3 35,001 40,000 114,000 4 40,001 45,000 166,956 9 45,001 50,000 445,690 1 50,001 55,000 55,000 1 55,001 60,000 60,000 2 60,001 65,000 125,135 1 65,001 70,000 69,019 2 80,001 85,000 164,691 1 90,001 95,000 94,000 2 95,001 100,000 197,669 2 105,001 110,000 213,811 1 115,001 120,000 115,575 1 125,001 130,000 128,000 1 130,001 135,000 132,500 2 135,001 140,000 279,400 1 140,001 145,000 143,500 1 160,001 165,000 160,458 1 175,001 180,000 177,125 1 195,001 200,000 200,000 1 220,001 225,000 224,970 1 225,001 230,000 228,052 1 245,001 250,000 246,312 1 250,001 255,000 251,126 1 275,001 280,000 276,902 1 280,001 285,000 284,708 2 290,001 295,000 583,554 1 300,001 305,000 301,365 1 310,001 315,000 315,000 1 335,001 340,000 339,093 1 395,001 400,000 399,378 1 435,001 440,000 436,046 1 495,001 500,000 500,000 1 530,001 535,000 532,618 1 555,001 560,000 556,500 1 635,001 640,000 637,654 1 660,001 665,000 660,492 1 755,001 760,000 756,711 1 800,001 805,000 800,087 1 880,001 885,000 881,039 1 945,001 950,000 948,771 1 1,160,001 1,165,000 1,164,915 1 1,285,001 1,290,000 1,288,942 1 1,475,001 1,480,000 1,475,634 1 2,010,001 2,015,000 2,011,325 1 2,105,001 2,110,000 2,109,524 1 2,375,001 2,380,000 2,377,013 1 2,400,001 2,405,000 2,401,301 1 2,690,001 2,695,000 2,692,285 1 3,890,001 3,895,000 3,892,237 885 35,000,000
Categories of Number of Shares % of paid upShareholders Share holders held Capital Individuals 858 27,997,178 79.9919%Insurance Companies 2 128,125 0.3661%Joint Stock Companies 18 6471567 18.4902%Financial Institutions 7 403,130 1.1518% Total 885 35,000,000 100.000%
PATTERN OF SHARE HOLDING AS ON JUNE 30, 2014

68
CATEgORY OF ShAREhOLDER hOLDINg % AgE DIRECTORS, CEO THEIR SPOUSE AND MINOR CHILDREN: 1 MR. TARIQ REHMAN - (CDC) 2,377,013 6.7915 2 MR. SHAFIQUE A. SIDDIQUI (CDC) 177,125 0.5061 3 MR. HARIS NOORANI 224,970 0.6428 4 MR. HARIS NOORANI - (CDC) 1,288,942 3.6827 5 MR. SUHAIL MANNAN 3,892,237 11.1207 6 MR. SUHAIL MANNAN (CDC) 80,691 0.2305 7 MR. JAVAID SHAFIQ 291,777 0.8336 8 MR. JAVAID SHAFIQ SIDDIQUI (CDC) 2,109,524 6.0272 9 MR. USMAN HAQ (CDC) 881,039 2.5173 10 MR. SALEM REHMAN (CDC) 436,046 1.2458 11 MR. AHSAN SUHAIL MANNAN 160,458 0.4585 12 MRS. SHAHIMA REHMAN W/O TARIQ REHMAN 290 0.0008 13 MRS. SHAHIMA REHMAN W/O TARIQ REHMAN - (CDC) 399,378 1.1411 14 MRS. AYESHA NOORANI W/O HARIS NOORANI 339,093 0.9688 15 MRS. AMINA SUHAIL MANNAN W/O SUHAIL MANNAN - (CDC) 246,312 0.7037 16 MRS. NAILA SUHAIL MANNAN W/O SUHAIL MANNAN- (CDC) 228,052 0.6516 17 MRS. AMBREEN HAQ W/O USMAN HAQ (CDC) 1,164,915 3.3283 18 MR. ZULFIQAR SUHAIL MANNAN (MINOR) 139,700 0.3991 19 MR. ABDULLAH SUHAIL MANNAN (MINOR) 139,700 0.3991 14,577,262 41.649 ASSOCIATED COMPANIES: 1 ASSOCIATED ENGINEERS (PVT) LTD. 2,011,325 5.7466 2 ICC (PVT) LIMITED 2,692,285 7.6922 3 ICC (PVT) LIMITED (CDC) 251,126 0.7175 4,954,736 14.156 NIT & ICP 1 IDBP (ICP UNIT) 1,057 0.0030 1,057 0.003
FINANCIAL INSTITUTION 1 PAKISTAN INDUSTRIAL CREDIT & INVESTMENT CORP. LTD. 500 0.0014 2 THE BANK OF PUNJAB, TREASURY DIVISION (CDC) 45,000 0.1286 3 NATIONAL BANK OF PAKISTAN (CDC) 424 0.0012 4 NATIONAL BANK OF PAKISTAN (CDC) 284,708 0.8135 330,632 0.945
INSURANCE COMPANIES 1 GULF INSURANCE COMPANY LIMITED 12,550 0.0359 2 STATE LIFE INSURANCE CORP. OF PAKISTAN - (CDC) 115,575 0.3302 128,125 0.366 mODARABAS & mUTUAL FUNDS PENSION FUNDS 1 TRUSTEE NATIONAL BANK OF PAKISTAN EMPLOYEES PENSION FUND (CDC) 69,019 0.1972 69,019 0.197
PATTERN OF SHARE HOLDING AS ON JUNE 30, 2014

69
CATEgORY OF ShAREhOLDER hOLDINg % AgE JOINT STOCk COMPANIES: 1 MUNIR HOLDING (PVT) LTD. 2,300 0.0066 2 ASIAN SECURITIES LIMITED 49 0.0001 3 NAEEM’S SECURITIES (PVT) LTD. 1,310 0.0037 4 ALI USMAN STOCK BROKERAGE (PVT) LIMITED - (CDC) 150 0.0004 5 AMIN TAI SECURITIES (PVT) LIMITED - (CDC) 800,087 2.2860 6 CLIKTADE LIMITED - (CDC) 82 0.0002 7 DARSON SECURITIES (PVT) LIMITED - (CDC) 4,000 0.0114 8 FAIR EDGE SECURITIES (PRIVATE) LIMITED - (CDC) 2,565 0.0073 9 FIKREE’S (SMC-PVT) LTD. (CDC) 1,815 0.0052 10 M.R.A. SECURITIES (PVT) LIMITED (CDC) 106,000 0.3029 11 MAM SECURITIES (PVT) LIMITED - (CDC) 250 0.0007 12 MSMANIAR FINANCIALS (PVT) LIMITED - (CDC) 400 0.0011 13 NH SECURITIES (PVT) LIMITED - (CDC) 1,000 0.0029 14 STOCK MASTER SECURITIES (PRIVATE) LTD - (CDC) 14,494 0.0414 15 WASI SECURITIES (SMC-PVT) LIMITED - (CDC) 30 0.0001 16 The Imperial Electric Co. (Pvt) Ltd 582,299 1.6637 1,516,831 4.334
OThERS 1 TRUSTEE NATIONAL BANK OF PAKISTAN EMP BENEVOLENT FUND TRUST (CDC) 2,422 0.0069 2,422 0.007
SHARES HELD BY THE GENERAL PUBLIC: 13,419,916 38.3426 TOTAL 35,000,000 100
SHAREHOLDERS HOLDING 10% OR MORE OF TOTAL CAPITAL 1 MR. SUHAIL MANNAN 3,972,928 11.3512 3,972,928 11.351 SHAREHOLDERS HOLDING 5% OR MORE OF TOTAL CAPITAL: 1 MR. SUHAIL MANNAN 3,972,928 11.3512 2 ICC (PVT) LIMITED 2,943,411 8.4097 3 MR. JAVAID SHAFIQ 2,401,301 6.8609 4 MR. PERVAIZ SHAFIQ SIDDIQI (CDC) 2,401,301 6.8609 5 MR. TARIQ REHMAN - (CDC) 2,377,013 6.7915 6 ASSOCIATED ENGINEERS (PVT) LTD. 2,011,325 5.7466 16,107,279 46.021
During the financial year the no trading in the share of the company, carries out by its Directors , CEO, CFO, Company Secretary and their spouses and minor Children.
PATTERN OF SHARE HOLDING AS ON JUNE 30, 2014

70

71
I/We . . . . . . . . . . . . . . . . . . . . . . . . . . . . . . . . . . . . . . . . . . . . . . . . . . . . . . . . . . . . . . . . . . . . . . . . . . . . . . . . . . . . . . .
of . . . . . . . . . . . . . . . . . . . . . . . . . . . . . . . . . . . . . . . . . . . . . . . . . . . . . . . . being member of EMCO Industries Limited
and holder Of . . . . . . . . . . . . . . . . . . . . . . . . . Ordinary shares as per share Register Folio No. . . . . . . . . . . . . and/or CDC
Participant I.D.No. . . . . . . . . . . . . . . . . and Sub Account No. . . . . . . . . . . . . . . . . . . . . .
hereby appoint . . . . . . . . . . . . . . . . . . . . . . . . . . . . . . . . . . . . . . . . . . . . . . . . . . . . . . . . . . . . . . . . . . . . . . . . . . . . . . . .
or failing him /her . . . . . . . . . . . . . . . . . . . . . . . . . . . . . . . . . . . . . . . . . . . . . . . . . . . . . . . . . . . . . . . . . . . . . . . . . . . . . .
of . . . . . . . . . . as my/our proxy to vote for me/us and my/our behalf at the
Annual General Meeting of the Company of the Company to be held at Registered Office 4th Floor, National Tower, 28-Egertion Road, Lahore on 31st October, 2014 at 11.00 A.M. and at any adjournment thereof.
Signed this……………………………day of …………………………………………………………………………………
……………………………………………… Signature on Revenue Stamp (Signature should agree with the specimen Signature Registered with the Company)
1. Signature -------------------------------- 2. Signature --------------------------------
Name ------------------------------------ Name ------------------------------------
Address ---------------------------------- Address ----------------------------------
NIC/Passport #.……..........……...……. NIC/Passport #.……..........……...…….
Note:
Proxies, in order to be effective must be received by the Company not less than 48 hours before the meeting, duly completed in all respects.
CDC Shareholders and their Proxies are requested to attach an attested photocopy of their National Identity Card or Passport with the proxy form submission to the Company.
FORM OF PROXY

72
