elucidation of the components involved in the antioxidant … · · 2017-02-11elucidation of the...
TRANSCRIPT

Elucidation of the components involved in the antioxidant activity of honey
Danielle Miotto, BSc.
Biotechnology
Submitted in partial fulfillment of the requirements for the degree of
MSc in Biotechnology
Faculty of Biological Sciences, Brock University St. Catharines, Ontario
© 2010

Abstract:
Canadian honeys were analyzed for sugar concentration, honey colour, total
phenolic content, the level of brown pigments, and antioxidant activity in order to
elucidate the main components involved in the antioxidant activity of honey. By
employing size-exclusion chromatography in combination with activity-guided
fractionation, it was demonstrated that the antioxidant components are of high molecular
weight (HMW), brown in colour and absorb at both 280nm and 450nm. The presence of
brown HMW antioxidant components prompted an investigation on the influence of heat
treatment on the Maillard reaction and the formation of melanoid ins. Heat-treatment of
honey resulted in an increase in the level of phenolics in the melanoidin fractions which
correlated with an increase in antioxidant activity. The preliminary results of this study
suggest for the first time that honey melanoidins underlie the antioxidant activity of
unheated and heat-treated honey, and that phenolic constituents are involved in the
melanoidin structure and are likely incorporated by covalent or non-covalent interaction.

Table of Content:
1. Introduction .................................................................................. ...................... 1
1.1 Overall goal of study ...................................................................... .. ............... 1
1.2 What is honey? ............................................................................................... 2
1.3 Components identified in honey having antioxidant activity .......................... 3
1.4 Methods used to analyze the antioxidant activity of honey ............................ 5
1.5 Factors that influence the quality of honey .......... .. ......................................... 7
1.6 What is the Maillard reaction? ............................................... : ........................ 8
1. 7 Structure of melanoidins obtained from model and food systems ... .. ........ .... 10
1.8 Antioxidant activity of Maillard reaction products ........................................ 11
1.9 Methods used to detect and isolate Maillard reaction products ..................... 12
2. Materials and Methods ..................................................................................... 14
2.1 Honey Samples .......... .. .... .. ................................. .... .................. ...... .............. . 14
2.2 Heat-treatment of honeys .... .... .............. .. ....... .... ............. .. .............................. 14
2.3 Honey colour........ .. ... .. ....... ..... ............ .. ................................... .. ..... .... .......... 14
2.4 Brown pigment detennination ........................................................................ 15
2.5 BRIX ...... ................ ...... ......... ........................... .................................. ......... ... 16
2.6 Size-exclusion chromatography ........... ............................ ...................... ..... ... 16
2.7 Antioxidant activity ........................... .. ...................................... ..................... 16
2.8 Solid-phase extraction ..... .. ..................... ........................................ .. ........... ... 18
2.9 Total phenolic content. ... ...... ... .... .. .. .. ............. ... .... ....... .. .......... .... ........... .. .... . 19
2.10 Sodium dodecyl sulphate polyacrylamide gel electrophoresis
(SDS-PAGE) ...... .. ......... .... .. .. .. .. ..... ........ ...... ...... ...... .. ...... .. .. .. ... .. ..... .. .. .. ... ... 19
2.11 Liquid Chromatography Electrospray Ionization Mass Spectrometry

(LC-ESI-MS) ................................................................................................ 20
2.12 Statistical analysis ........................................................................................ 21
3. Results .................. , .............................................................................................. 21
Part I:
3.1 Physical-chemical characteristics of honeys used in the study .................. 21
3.1.1 BRIX .......................................................................................................... 22
3.1.2 Honey colour and browning index (MRPs ) ............................................... 23
3.1.3 Total phenolic content ................................................................................. 25
3.1.4 Antioxidant activity of honey ...................................................................... 27
3.1.5 Relationship between the antioxidant activity of honey with honey
colour, total phenolic content and Maillard reaction products .................... 28
Part II:
3.2 Methodological approach towards the isolation and characterization
of components involved in the antioxidant activity of honey; .............. 30
3.2.1 Characterization of the antioxidant components in unheated honey
obtained from SEC as analyzed at 280nm ................................................ 31
3.2.2 Molecular size of the active fractions; ...................................................... 34
3.3 Methodological approach towards the identification of melanoidins
in honey and their contribution to the antioxidant activity ................. 35
3.3.1 The effect of heat-treatment on honey colour and the lever of browning

of honey ................................................... .. ............................................... 36
3.3.2 The effect of heat-treatment on the antioxidant activity of honey ........... 38
3.3.3 SEC of heat-treated honey ........................................................................ 39
3.4 Methodological approach towards the identification of the main
components involved in the melanoidin structure ......................................... 44
3.4.1 The effect of heat-treatment on the overall phenolic content of honey ..... 45
3.4.2 Phenolic content in active fractions of unheated and heat-treated honey. 46
3.4.3 Relationship between the phenolic content, MRLP levels and antioxidant
activity of active fractions of unheated and heat-treated honey ................ 48
3.4.4 Protein in active fractions of unheated and heat-treated honey ................. 50
3.4.5 Sugars, amino sugars and honey specific flavonoids by LC/MS in active 55
4. Discussion ..................... , ............ D ••••••••••••••••••••••••••••••••••••••••••••••••••••••••••••••••••••••••• 59
4.1 Identitication of compounds with antioxidant activity and analysis of
their relationship with each other .............................................................. 60
4.1.2 Melanoidins in heat-treated honey ........................................................... 64
4.1.3 Isolation and characterization of honeymelanoidins ................................ 67
4.1.4 Antioxidant activity and molecular weight of the active components in
unheated and heat-treated honey .............................................................. 68
4.1.5 Degree of browning and colour change in heat-treated honeys ............... 69
4.1 .6 Brownin"g and antioxidant activity ........................................................... 71
4.1.7 Phenolic content in unheated and heat-treated honey fractions ........ ....... 72
4.1.8 Evidence demonstrating the presence of melanoidins in honey ............... 74
4.1.9 Characterization of the structural components in honey melanoidins ..... 75
4.1 .10 Proteins in the melanoidin fractions ......................................................... 75
4.1.11 Carbohydrates in the melanoidin fractions ............................................... 77

5. Conclusion ..................................... ................................................................... 78
6. References Cited ................................................................................................ 81
7. Appendix A: Standard curves ....................................................................... ... 95
Figure A-I: Gallic acid standard curve .... .. ..... .... ... .. ..... ....... ..... ...... ......... ...... ... .... 95
Figure A-2: Trolox standard curve ........ ................................ ........ ...................... 95
Figure A-3 : Standard curve for the determination of molecular size ...... ............. 95
Figure A-4: Protein molecular weight standard curve. Protein standards were
run on 10% acrylamide geL ..................... ... ..... ..... ; ...................... .. 96
List of Tables
Table 1: Honey samples from various floral sources used in study .......................... 15
Table 2: BRIX measurements of honey samples using a refractometer ..... ....... ........ 22
Table 3: Colour characterization (A56o-Anonm) and browning index (A450-Anonm)
of honey samples ... .... ....... .. ............................. ...... ..... ....... ... ... .. .......... .. ... .. 24
Table 4: Total phenolic content of honey as detennined by Folin-Ciocalteu ........... 26
Table 5: Summary of results for honey colour, total phenolic content and
antioxidant activity ..... .......... .............................. ................... ...................... 28
Table 6: Component loading matrix ......................................... .............. ... ..... ........... 29
Table 7: Correlation matrix .......... ..... ......... ........................ .......... ..... .. ............... ...... . 29
Table 8: Level of brown pigments, phenolic content and antioxidant activity of
unheated honey fractions .... ......... ...................... .... ......... ......... ................... 34
Table 9: Molecular weight of components as determined from the SEC standard
curve .......... ............ .. ... .................................................. .... .. .............. ........... 35
Table 10: Honey colour (A56o-Ano) and level of brown pigments (A450-Ano)
before and after heat-treatment of 50% (w/v) honey solutions .. .. ..... ....... . 37
Table 11: Antioxidant activity of honey before and after heat-treatment... .. ... ........ . 38
Table 12: Level of brown pigments in unheated and heat-treated hO!ley fractions
that eluted in the major peak ............ ....... ............ .......... ............... ............. 41

Table 13: Antioxidant activity of unheated and heat-treated honey fractions
obtained froln SEC .................................................................................... 42
Table 14: Total phenolic content of unheated and heat-treated honey ...................... 45
Table 15: Total phenolic content of unheated and heat-treated honey fractions .... 47
Table 16: Summary of the correlation analyses between ORAC, total phenolic
content and MRLP content of unheated and heat-treated honey fractions. 49
List of Figures
Figure 1: Structure of flavonoids ................................................................................ 4
Figure 2: General scheme of the Maillard reaction .................................................... 9
Figure 3: Colour of honey ........................................................ ... ............................... 23
Figure 4: Scheme for the characterization of honey fractions ................................... 31
Figure 5: Elution profiles demonstrating the differences in A280mn of honey
fractions obtained from size-exclusion chromatography .......................... 33
Figure 6: Colour of honey samples (50% w/v) before (top) and after heat-treatment
(bottom) at 121°C for 30 minutes ............................................................. 36
Figure 7: Elution profiles demonstrating the differences in A280mn of honey
fractions obtained from size-exclusion chromatography before and after
heat-treatment ........................................................................................... 39
Figure 8: Level of brown pigments in unheated and heat-treated honey fractions
that eluted in the major peak .................................................................... 40
Figure 9: Antioxidant activity of unheated and heat-treated honey fractions
obtained from SEC .. .................................................................................. 42
Figure 10: Total phenolic content of unheated and heat-treated honey fractions ..... 47
Figure 11: SDS-PAGE protein profile of the dark buckwheat fractions that eluted
from SEC ................................................................................................. 51
Figure 12: Protein profile of the unheated (148) and heat-treated (148 T) medium
manuka fractions that eluted from SEC and anaylzed by SDS-PAGE ..... 52
Figure 13: Protein profile ofthe unheated (08-5) and heat-treated (08-5 T) light
clover fractions that eluted from SEC and anaylzed by SDS-PAGE ........ 53

Figure 14: Protein profile of the unheated (177) and heat-treated (177 T) fractions of
buckwheat honey following phenolic extraction using a mixture of three
alcohols ...................................................................................................... 54
Figure 15: Total ion current chromatogram (VV, 254nm) of active fraction 15
obtained from dark buckwheat honey #177 .............................................. 56
Figure 16: ESI-MS in negative ion mode of the hydrophilic peak (Rt= O.5min) of
active fraction 15 of#177 .......................................................................... 57
Figure 17: ESI -MS in negative ion mode of a hydrophilic/hydrophobic peak obtained
for (Rt = 10.7min) active fraction 15 of#I77 ........................................... 59
List of Abbreviations:
ABTS, AEAC, AGEs, AV, AVC, DP, DPPH, FRAP, GAE, HMF, HMW, kDa, LC-ESI-MS, MRLPs, MRPs, ORAC, PAGE, RCF, RSD, SO, SDS, SEC, SPE, TE, TIC, UV/VIS,
2,2-azinobis(3-ethylbenzthiazoline-6-sulphonic acid Ascorbic acid Equivalent Antioxidant Content Advanced Glycation End-products Absorbance Units Area Under the Curve Degree of Pol ymerization 2,2-diphenyl-l-picrylhydrazyl Ferric Reducing! Antioxidant Potential Gallic Acid Equivalents 5-hydroxmethyl-2-furfural High Molecular Weight Kilodalton Liquid Chromatography Electrospray Ionization Mass Spectrometry Maillard Reaction-Like Products Maillard Reaction Products Oxygen Radical Absorbance Capacity Polyacrylamide Gel Electrophoresis Relative Centrifugal Force Relative Standard Deviation Standard Deviation Sodium Dodecyl Sulfate Size-Exclusion Chromatography Solid Phase Extraction Trolox Equivalents Total Ion Current VI tra vi 0 I etN i si b I e

1. Introduction
1.1 Overall goal of study
The emphasis of this study focuses on elucidating the chemical components that
contribute to the antioxidant activity of Canadian honeys. Current literature indicates that
honey components such as phenolic acids, flavonoids and Maillard reaction products, as
well as compounds that influence honey color, underlie this activity. However, when
flavonoids or polyphenols were tested alone in in vitro systems, they could not account
for the total antioxidant activity of honey (Gheldof et aI., 2002). Thus, the general
consensus is that these compounds are involved in, but are not fully responsible for this
activity. Therefore, the search for other antioxidants in honey is required.
There is a growing public interest in antioxidants in food products and their
corresponding health benefits. Honey has been shown to possess both antioxidant and
antibacterial activities, and these beneficial properties could make it a valuable functional
food. Identification of compounds with antioxidant activity, and the elucidation of their
mechanism of action, would be of substantial significance in establishing the health
promoting functionalities of honey. A comprehensive study on the antioxidant activity
of Canadian honeys is currently lacking. Therefore, the purpose of this study was to 1)
detennine the antioxidant activity using a large representation of Canadian honeys
derived from a diverse set of botanical sources, and 2) to elucidate the chemical
components involved in this activity.
As the current literature indicates that the antioxidant activity of honey is due to
the combined activity of a wide range of compounds (Gheldof et aI., 2002), it was
hypothesized that 1) the main antioxidant activity is due to the synergistic action of
antioxidant functional groups that belong to different compounds, and o~ which interact
1
to fonn bioactive complexes and 2) that the antioxidant complexes resemble the class of
compounds fonned in the Maillard reaction, the melanoidins, which have previously been
described in food products such as coffee (Borrelli et aI., 2002b).
1.2 What is honey?
Honey is a substance that consists of over 300 components, where fructose,
glucose and water constitute the main portion of the honey mass (Jeffrey & Echazarreta,
1996). Other constituents, which are present in much lower amounts, include flavonoids,
polyphenolic acids and their derivatives, proteins and enzymes, oligo- and poly
saccharides, pollen, wax (Anklam, 1998) and minerals (Lachman et aI., 2007). The
diversity and concentration of these components is dependent on the botanical and
geographical origin of honey. Moreover, it is also influenced by the variation in climate
and availability of plant sources for the honeybees to harvest nectar within a specific
region (Anklam, 1998). Therefore, honeys originating from different floral sources differ
in their chemical compositions.
In addition to being a valuable food product, honey has been used since ancient
times as a medicinal substance. The therapeutic effectiveness of honey, particularly for
the treatment of wounds and bums (Molan, 1999), has been demonstrated to be the result
of its antibacterial activity (Molan, 1992). Honey showed bacteriostatic and bactericidal
activities against a broad range of microorganisms, including both Gram-positive and
Gram-negative bacteria (Molan, 1992; Al Somal et aI., 1994; Taonnina etaI., 2001;
Mundo et aI., 2004; French et aI., 2005; Lusby et aI., 2005; Brudzynski, 2006), and two
antibiotic-resistant bacteria that plague hospitals: methicillin-resistant Staphylococcus
aureus (MRS A) and vancomycin-resistant enterococci (VRE) (Natarajan et aI., 2001;
Cooper et aI. , 2002). As a result of honey's ability to inhibit the growth of a broad range
of micro-organisms, a new application of honey was developed; honey as a therapy for
2

infected wounds. Honey -based wound dressings have been tested in several clinical trials
(Efem, 1988; Subrahmanyam, 1996, 1998, 1999), and have recently been approved by the
FDA (U.S. Food and Drug Administration).
In addition to antibacterial activity, honey has also been reported to exhibit
several other biological activities such as antioxidant (Gheldof et aI., 2002; Blasa et aI. ,
2006; Bertoncelj et aI., 2007), antiradical (Baltrusaityte et aI., 2007; Silici et aI., 2010),
antitumor (Swellam et aI., 2003), anti-inflamatory (Tonks et aI., 2003) and antibrowning
properties (Oszmianski & Lee, 1990; Chen et aI., 2000). Although the chemical identity
of compounds responsible for these activities require further investigation, some of these
biological effects may be attributed to the phenolic compounds.
1.3 Components identified in honey having antioxidant activity
In recent decades, much attention has been focused on the beneficial effects of
natural antioxidant components in food products, such as coffee (Del Castillo et aI.,
2002), wine (Alonso et aI., 2002), beer (Vinson et aI., 2003), olive oil (Lavelli, 2002) and
honey (Gheldof & Engeseth, 2002; Vela et aI., 2007). Evidence in the literature
demonstrates that free radicals contribute to the development of disease such as cardio
vascular disease, neurodegenerative disease, and cancer (Halliwell & Gutteridge, 1999).
As a result, the interest in the beneficial effects of antioxidants stems from their ability to
protect against the development of disease by scavenging free radicals in the body.
An important group of phytochemicals that are involved in the antioxidant activity
of honey are the polyphenols (flavonoids and phenolics acids). Numerous polyphenols
have been identified in honey: flavonoids such as apigenin, pinocembrin, pinobanksin,
kaempferol, quercetin, galangin, chrysin, luteolin, hesperitin and myricetin, and phenolic
3
acids such as caffeic, ferrulic, ellagic, vanillic, coumaric, chlorogenic, cinnamic and
benzoic acids (Gheldof & Engeseth, 2002; Gheldof et aI., 2002; Aljadi & Kamaruddin,
2004; Baltrusaityte et aI., 2007).
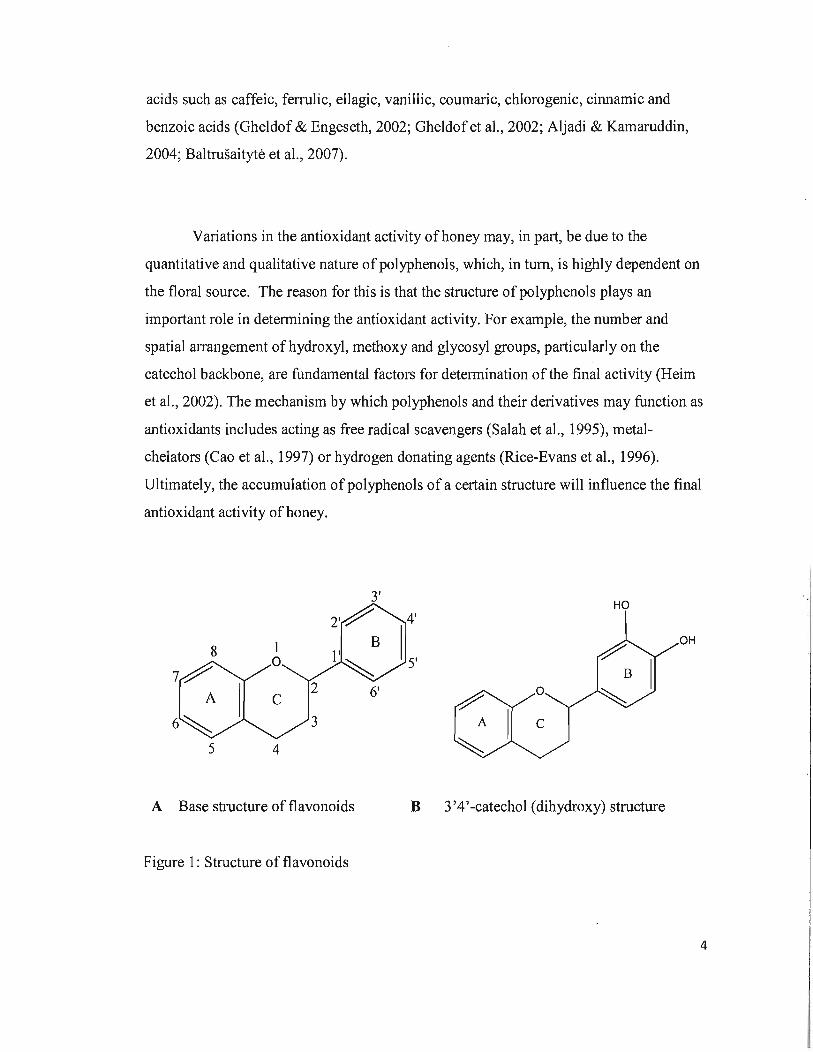
Variations in the antioxidant activity of honey may, in part, be due to the
quantitative and qualitative nature of polyphenols, which, in tum, is highly dependent on
the floral source. The reason for this is that the structure of polyphenols plays an
important role in detennining the antioxidant activity. For example, the number and
spatial arrangement of hydroxyl, methoxy and glycosyl groups, particularly on the
catechol backbone, are fundamental factors for detennination of the final activity (Heim
et aI., 2002). The mechanism by which polyphenols and their derivatives may function as
antioxidants includes acting as free radical scavengers (Salah et aI., 1995), metal
chelators (Cao et aI., 1997) or hydrogen donating agents (Rice-Evans et aI., 1996).
Ultimately, the accumulation of polyphenols of a certain structure will influence the final
antioxidant activity of honey.
3' HO
OH
5 4
A Base structure of flavonoids B 3'4'-catechol (dihydroxy) structure
Figure 1: Structure of flavonoids
4
i 1
. I

In addition to the antioxidant activity, polyphenols also influence honey colour.
The conjugated systems of the double bonds, such as those present in polyphenolics
(flavonoids and long chain phenolics), among other components such as terpenes and
isoprene units found in honey (D'Arcy, 2005; Castro-Vasquez et aI., 2008), give rise to a
wide range of colours as they are chromophores that absorb visible light. Numerous
studies in the literature have indicated that the antioxidant activity of honey varies widely
with the floral source, where darker coloured honeys, which reflect the presence and
concentration of pigments, were demonstrated to exhibit greater antioxidant activities
(Frankel et aI., 1998; Gheldof & Engeseth, 2002; Blasa et aI., 2006; Bertoncelj et aI.,
2007). Thus, a strong correlation between honey colour, phenolic content and antioxidant
activity has been documented.
In addition to polyphenols, other constituents are known to contribute to honeys
antioxidant effect. These include vitamins (C and E), enzymes (catalase,peroxidase and
glucose oxidase), carotenoids and products ofthe Maillard reaction (Gheldof et aI., 2002;
Aljadi & Kamaruddin, 2004). Many honey components, particularly the flavonoids and
phenolic acids, have been shown to contribute significantly to the antioxidant capacity.
However, when separated from honey and tested in in vitro systems, they produce only a
portion of the total antioxidant activity of honey. These results led to the conclusion that
several antioxidants may act synergistically in honey (Gheldof et al., 2002). What these
compounds are and what type of chemical interactions could underlie this "synergistic
action" still remains to be elucidated. Thus, it was my keen interest to elucidate the main
antioxidant components in honey.
1.4 Methods used to analyze the antioxidant activity of honey
Due to the lack of an established analytical method for estimation of the
antioxidant activity of honey, numerous assays have been tried by differ~nt research
5
groups. Commonly used methodologies for determination of the antioxidant activity of
honey include the DPPH (2,2-diphenyl-1-picrylhydrazyl) and ORAC (oxygen radical
absorbance capacity) assays, however, less commonly used methods such as FRAP
(ferric reducing/antioxidant potential), AEAC (ascorbic acid equivalent antioxidant
content), ABTS (2,2-azinobis(3-ethylbenzthiazoline-6-sulphonic acid) and the
phosphomolybdenum method have also been employed (Gheldof & Engeseth 2002;
Beretta et al., 2005; Labrinea & Georgiou, 2005; Blasa et al., 2006; Baltrusaityte et al.,
2007; Bertoncelj et al., 2007; Vela et al., 2007; Lachman et al., 2010; Saxena et al., 2010;
Silici et al., 2010). Some studies cited in the literature used a single antioxidant method
(Gheldof & Engeseth 2002; Labrinea & Georgiou, 2005; Blasa et al., 2006; Vela et al.,
2007), whereas other studies employed multiple methodologies to estimate honeys
antioxidant activity (Beretta et al., 2005; Baltrusaityte et al., 2007; Bertoncelj et al., 2007;
Lachman et al., 2010; Saxena et al., 2010; Silici et al., 2010). The majority of these
assays measured an antioxidant property in the reaction mixture that involved free
radicals, which was followed by a comparison of the observed effects toa known
standard. Regardless of the analytical approach, most of these studies addressed the
antioxidant activity in relation to honey colour and phenolic content. As a result, a strong
correlation between antioxidant activity and these parameters was established.
Use of the ORAC assay in recent years, which tests antilipoperoxidant activity,
has increased due to its high sensitivity and its ability to minimize cross-reactions
between samples and reagents in the reaction mixture (Vela et al., 2007). Using the
ORAC assay, the radical scavenging activity of honey is usually analyzed using the
peroxyl radical generator, 2,2' -azobis (2-amidinopropane) dihydrochloride (AAPH), and
is typically expressed as Trolox equivalent (TE) units (Gheldof & Engeseth, 2002;
Beretta et al., 2005). The reason that this method is superior to others is because (1) it
involves taking a free radical reaction to completion by monitoring the loss in
fluorescence of a fluorescent probe over time, (2) it employs an area-under-the-curve
technique to establish antioxidant activity, and (3) because different free radical
6

generators or oxidants can be used in the reaction mixture to test a different set of
parameters (Cao et al., 1997). In spite of this, the DPPH assay is the more widely used
methodology as it uses a common laboratory instrument, the spectrophotometer, while
the ORAC assay requires a spectrofiuorometer.
1.5 Factors that influence the quality of honey
Beekeepers are well aware of the fact that honey darkens upon storage. The rate
of darkening has been shown to be dependent on the pH and composition of the honey, as
well as the .time and temperature at which the honey is stored (Gupta etal., 1992;
Gonzales et al., 1999). Although controversy over the main cause of darkening still
exists, the darkening of honey has mainly been attributed to the Maillard reaction,
fructose caramelization, and the degradation of polyphenols (Lynn et al., 1936; Gonzales
et al., 1999; Bulut & Kilic, 2009).
Darkening of honey is generally associated with a loss in quality, which directly
impacts the consumer's acceptance of the product. The quality of honey is typically
assessed by measuring the accumulation of 5-hydroxmethyl-2-furfural (HMF), by
detennining the diastase activity or by establishing honey colour (Sancho et al., 1992;
Bulut & Kilic, 2009). Depending on the storage and temperature conditions of honey,
many authors have associated the loss in quality with an increase in HMF content, a
reduction in diastase activity or the darkening of honey colour (Sancho et al., 1992;
Castro-Vazquez et al., 2008).
In addition to darkening during storage, the darkening of honey was also noted to
be an indicator of honey thennal-treatment (Turkmen et al., 2006). The reason that honey
is usually subjected to thennal treatment is to modify its tendency to undergo
crystallisation or to destroy contaminating micro-organisms (Tosi et al., 2002). Typically,
7
honey processing involves heating honey in air-ventilated chambers for 4 to 7 days at 45-
50°C, or immersing honey drums in hot water (Fallico et al., 2004). However, upon
prolonged thennal treatment of honey at temperatures between 50-70°C, an increase in
brown pigment fonnation occurred that resulted in darker coloured honey which
correlated with the increase in antioxidant activity (Turkmen et al., 2006). It was also
reported that the increase in brown pigment fonnation and antioxidant activity was due to
the fonnation of Maillard reaction products, which are known to possess antioxidant
activity (Turkmen et al., 2006). Thus, the Maillard reaction, at least in part, appears to be
involved in the browning of honey.
1.6 What is the Maillard reaction?
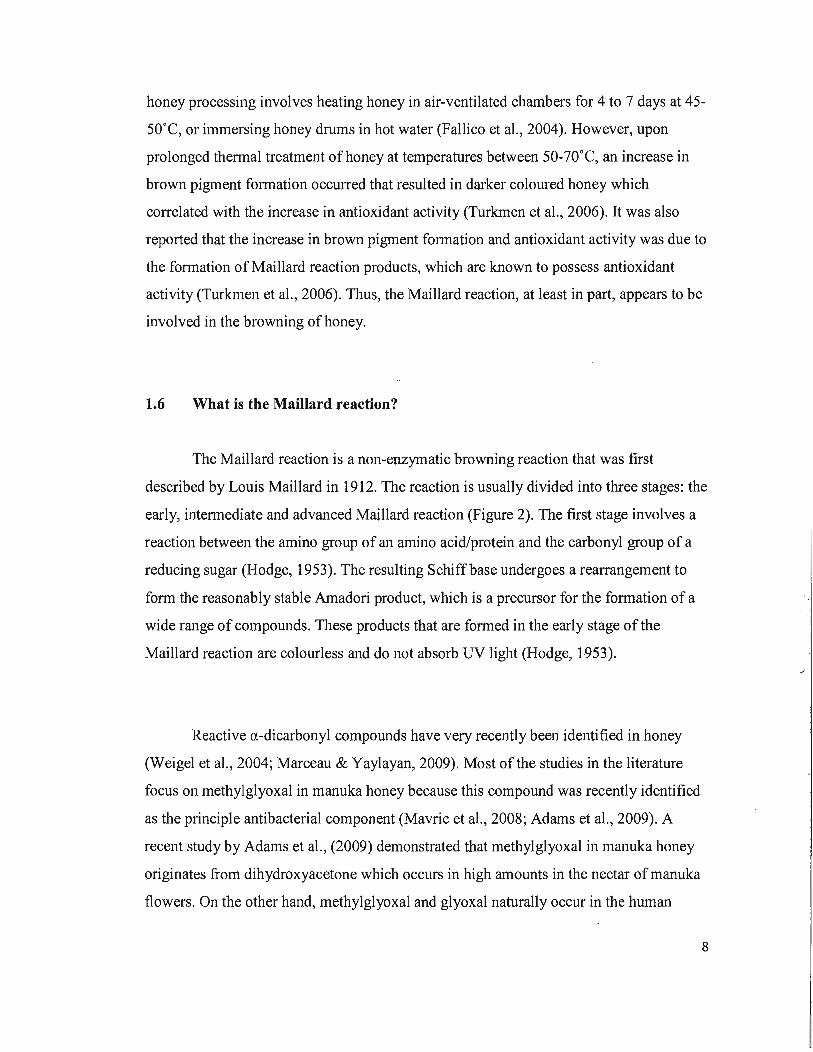
The Maillard reaction is a non-enzymatic browning reaction that was first
described by Louis Maillard in 1912. The reaction is usually divided into three stages: the
early, intennediate and advanced Maillard reaction (Figure 2). The first stage involves a
reaction between the amino group of an amino acid/protein and the carbonyl group of a
reducing sugar (Hodge, 1953). The resulting Schiff base undergoes a rearrangement to
fonn the reasonably stable Amadori product, which is a precursor for the fonnation of a
wide range of compounds. These products that are fonned in the early stage of the
Maillard reaction are colourless and do not absorb UV light (Hodge, 1953).
Reactive a-dicarbonyl compounds have very recently been identified in honey
(Weigel et al., 2004; Marceau & Yaylayan, 2009). Most of the studies in the literature
focus on methylglyoxal in manuka honey because this compound was recently identified
as the principle antibacterial component (Mavric et al., 2008; Adams et al., 2009). A
recent study by Adams et al., (2009) demonstrated that methyl glyoxal in manuka honey
originates from dihydroxyacetone which occurs in high amounts in the nectar of manuka
flowers. On the other hand, methylglyoxal and glyoxal naturally occur in the human
8

body. The increased amount of glyoxal and methylglyoxal, such as in diabetes, leads to
protein crosslinking and the fonnation of very hannful advanced glycation end-products
(AGEs) such as pentosidine and NE-[carboxymethyl]-lysine (Singh et al., 2001).
Sugar + Amino group ... __ • Schiff's base of amino acid or protein 11
Amadori products
1
l Early Stage
Reactive intermediates Intermediate Stage
a-dicarbonyls pyrroles furans
pyrazmes
~ Advanced Stage
Maillard reaction products (melanoidins)
Figure 2: General scheme of the Maillard reaction (Martins et a1., 2000; van Boekel, 2006).
Melanoidins, which are carbohydrate-based, high molecular weight, coloured
macromolecules, are fonned in the advanced stages of the Maillard reaction. These final
brown products have been demonstrated in thennally processed foods such as coffee
(Borrelli et al., 2002b; Bekedam et a1., 2006; Gniechwitz et al., 2008b), bread crust
(Borrelli et al., 2003), beer (Kuntcheva & Obretenov, 1996), sugarcane molasses,
9
(Chandra et aI., 2008) and vinegar (Xu et aI., 2007). More importantly, melanoidins have
been shown to exhibit several biological activities such as antioxidant (Borrelli et aI.,
2002b; Delgado-Andrade et aI., 2005), antibacterial (Rufian-Henares & Morales 2007b;
Rufian-Henares & de la Cueva, 2009), antihypertensive (Rufian-Henares & Morales,
2007a), and prebiotic properties (Borrelli, & Fogliano, 2005). Although the Maillard
reaction is known to contribute to several negative qualities such as changes in aroma and
flavour (Castro-Vasquez, et aI., 2008), the interest in melanoidins is mainly due to their
relevant biological activities. Thus, in recent years, studies have focused on the effects of
melanoidins on the human body, as well as on their nutritional values.
1.7 Structure of melanoidins obtained from model and food systems
The mechanism of formation and the chemical structure of these brown
melanoidins are currently unknown, however many attempts have been made to elucidate
the structure. The majority of the studies on melanoidin formation have involved
simplified model systems, which contain a limited number of substrates. These systems
typically involve a reaction between a reducing sugar (mono- or oligosaccharides) and an
amino acid or protein (Cfunmerer & Kroh, 1995; Brands et aI., 2002; Hofmann, 1998a),
or a system involving intermediates such as a-dicarbonyls (Kroh et aI., 2008). In addition,
the effect of various reaction conditions such as time, pH and temperature on the rate of
melanoidin synthesis was also investigated. Depending on the amount and nature of the
substrates that may take part in the Maillard reaction of these systems, three different
melanoidin structures were discerned (1) polymers involving repeating units of furans or
pyrroles (Tressl et aI., 1998), (2) carbohydrate-based melanoidin skeletons consisting of
polymerized sugar degradation products that are formed by aldol-type condensation
and/or intact carbohydrate structures (Cammerer & Kroh, 1995; Cfunmerer et aI., 2002);
or (3) protein-based melanoidin skeletons which involve protein crosslinks by low
molecular weight coloured compounds (Hofmann, 1998b).
10
In foods, melanoidin fonnation is complicated by the number and type of
reactants that may take part in the Maillard reaction. Numerous attempts have been made
to elucidate the structure of melanoidins found in foods such as coffee (Borrelli et aI.,
2002b; Nunes & Coimbra, 2007; Gniechwitz et aI., 2008b), beer (Kuntcheva &
Obretenov, 1996) and bakery products (Lindenmeier et aI., 2002; Borrelli, et aI., 2003).
Since food products naturally contain a more diverse set of reactants, and thus a greater
number of potential interactions, the melanoidins characterized in foods differed from
those elucidated from simple model systems consisting of limited reactants. Despite the
structural differences, the food melanoidins were demonstrated to exhibit similar
physicochemical properties to those elucidated from model systems, such as being
characterized as partially hydrophobic (Gniechwitz et aI., 2008b), high molecular weight
substances with anionic character (Morales, 2002; Nunes & Coimbra, 2007), that possess
reducing properties (Homma et aI., 1997), and are capable of chelating metal ions
(Borrelli et aI., 2002a; Nunes & Coimbra, 2007).
1.8 Antioxidant activity of Maillard reaction products
The relationship between antioxidant activity and Maillard reaction products
(MRPs) has been extensively studied in model systems and in some thennally processed
foods (Manzocco et aI., 2001; Chen & Kitts, 2008). Although a positive correlation has
been demonstrated between MRPs and antioxidant activity, there is some controversy
over the nature of the compounds involved. Recent research has shown conflicting results
regarding the size of the Maillard reaction compounds responsible for the antioxidant
activity. Some studies have suggested that the antioxidant activity is due to the low and
intennediate molecular weight MRPs (Del Castillo et aI., 2002; Delgado-Andrade et aI.,
2005; Morales & Babbel, 2002), however, other studies have indicated that the high
molecular weight MRPs exhibit greater antioxidant activities than those oflow molecular
weight (ling & Kitts, 2004; Monti et aI., 1999). Moreover, the chemical nature ofthe
melanoidin (Tressl et aI., 1998) as well as the type of linkage (covalent qr non-covalent)
11
they have with other compounds (Delgado-Andrade et aI., 2005; Gniechwitz et aI.,
200Sb), are also controversial.
1.9 Methods used to detect and isolate Maillard reaction products
Due to the heterogenous mixture of chemical compounds that are formed in the
Maillard reaction, specifically in foods, there is no official method to measure MRP
content. The brown colour development in foods and model systems is typically achieved
by measuring the absorbance at an arbitrarily selected wavelength between 420-4S0nm
(Manzocco et aI., 2001). However, these values only reflect the colour and do not
consider the concentration of reactants and products due to the unknown extinction
coefficients. Thus, this indirect measurement is a non-destructive way to quickly evaluate
the brown colour development of a complex food system.
In addition to monitoring changes in colour, the presence of melanoidins can be
speculated by obtaining wavelength spectra. As described by Hofmann (199Sb),
me1anoidins exhibit a characteristic UV NIS profile, which includes featureless end
absorption and an increase in intensity with a decrease in the wavelength. Several studies
have speculated on the presence of melanoidins in foods such as coffee (Bekedam et aI.,
2006) and vinegar (Xu et aI., 2007), based on the characteristic UV/VIS profile by
measuring absorbance in the 200-700nm range. Because melanoidins are heterogenous
in nature, the absorbance spectra are generally observed as a plateau starting from the UV
region and extending towards the visible region due to the presence of many different
chemical species.
Due to the fact that brown colour development in foods can result from the
formation of a wide range of products originating from different pathways, it is extremely
12

difficult to classify these brown products. In theory, the distinction between the different
classes of browning such as (1) enzymatic browning, and (2) nonenzymatic browning
which includes caramelization, or when amino-containing compounds are involved, the
Maillard reaction is clear. However in practice, it is very difficult to differentiate whether
the brown products formed are melanins, which are produced from enzymatic browning,
or melanoidins, which are formed in the final stage of the Maillard reaction (Smaniotto et
aI., 2009). Thus, the final brown products most likely consist of a heterogenous mixture
of compounds derived from various pathways that exhibit similar features. To
differentiate between them, more sophisticated methodologies must be employed.
Despite all efforts, the chemical structure of melanoid ins in food products is still
largely unknown. In recent literature, much attention has been focused on the isolation
and characterization of coffee melanoidins where numerous methodological approaches
have been employed. A common method for the isolation of high molecular weight
coffee melanoidins is to use dialysis (Nunes & Coimbra, 2007; Gniechwitz et aI., 2008a),
diafiltration (Bekedam et aI., 2006), or ultrafiltration (Delgado-Andrade et aI., 2005;
Gniechwitz et aI., 2008b) by using membranes with a molecular weight cut-offlimit
ranging from 2 kDa to over 100 kDa. An alternative approach has been to separate coffee
melanoidins comprised of different polysaccharide compositions based on their solubility
in ethanol (Bekedam et aI., 2006; Nunes & Coimbra, 2007). Further purification of
melanoidins was generally required as homogenous mixtures were not obtained.
Therefore, separation procedures such as anion-exchange chromatography, copper
affinity chromatography, sequential chromatography on Sephadex LH-20, and
hydrophobic interaction chromatography on Octylsepharose were used separately or in
combination for purification (for review, Nunes & Coimbra, 2010). As a result of the
complexity of the melanoidin structure, it is a complex process to isolate and chemically
characterize an individual melanoidin compound.
13

2 Materials and Methods:
Sodium fluorescein and gallic acid monohydrate were purchased from Sigma-Aldrich.
2,2'-Azobis(2-amidinopropane) dihydrochloride (AAPH) and 6-hydroxy-2,5,7,8-
tetramethylchroman-2-carboxylic acid (Trolox) were purchased from Aldrich. Fo1in
ciocalteu phenols reagent was purchased from Sigma. Black-sided, special optics clear
bottom plates (part # 3615) were obtained from Coming.
2.1 Honey Samples
Honey samples were obtained from Canadian beekeepers (Table 1). The honeys
were given numbers prior to the experiment and were stored at room temperature in a
dark, dry, place throughout the study.
2.2 Heat-treatment of honeys
Honeys were heat-treated at ·121 °C for 30 minutes (Steris Autoclave, Amesco
Century, Erie, P A, USA). Following heat-treatment, the honeys were diluted to 50%
(w/v) with sterile, distilled water and centrifuged at 5000 x g (Relative Centrifugal Force)
for 20 minutes (Eppendorf 5804 R, Eppendorf, Canada).
2.3 Honey colour
Honey colour was measured using the net absorbance method (As6o-Anonm) as
described by Vela et aI., (2007). Briefly, honey was diluted to a 50% (w/v) solution with
sterile, distilled water. The net absorbance was determined using a spectrophotometer
14
(Ultrospec 3100 Pro) and distilled water as a reference. The results were expressed as
absorbance units (AU).
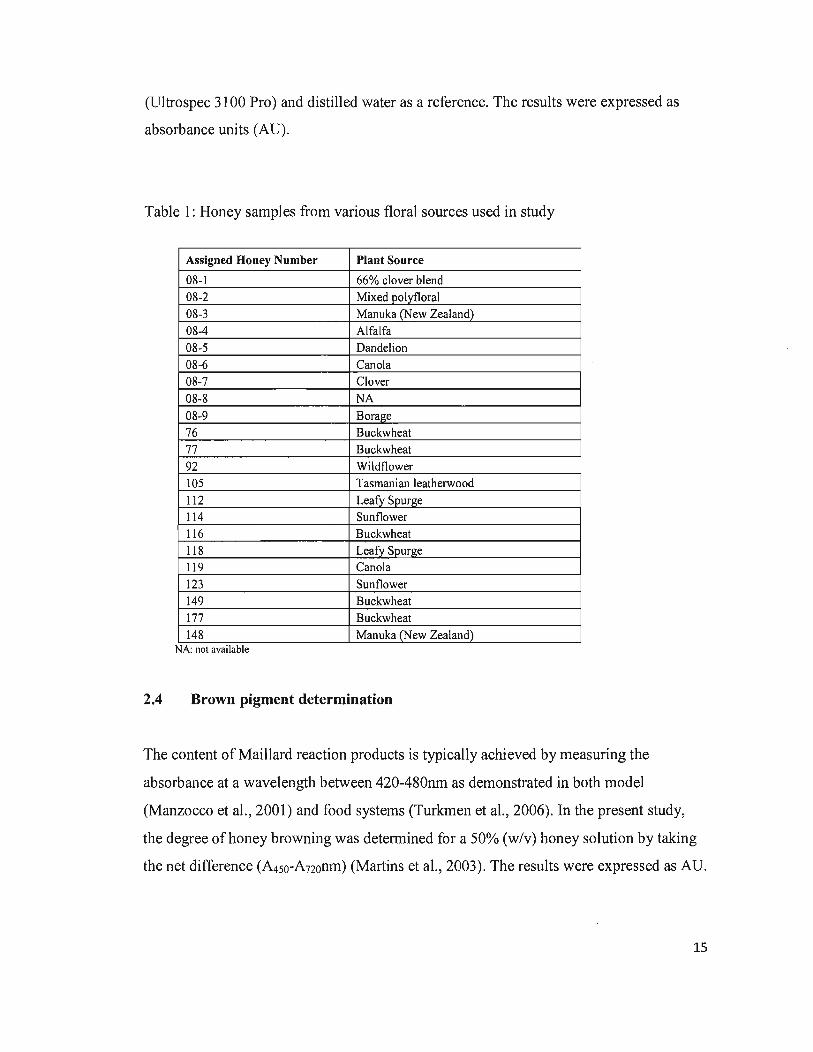
Table 1: Honey samples from various floral sources used in study
Assigned Honey Number Plant Source
08-1 66% clover blend 08-2 Mixed polyfloral 08-3 Manuka (New Zealand) 08-4 Alfalfa 08-5 Dandelion 08-6 Canola 08-7 Clover 08-8 NA 08-9 Borage 76 Buckwheat 77 Buckwheat 92 Wildflower 105 Tasmanian leatherwood 112 Leafy Spurge 114 Sunflower 116 Buckwheat 118 Leafy Spurge 119 Canola 123 Sunflower 149 Buckwheat 177 Buckwheat 148 Manuka (New Zealand)
NA: not aVaIlable
2.4 Brown pigment determination
The content of Maillard reaction products is typically achieved by measuring the
absorbance at a wavelength between 420-480nm as demonstrated in both model
(Manzocco et al., 2001) and food systems (Turkmen et al., 2006). In the present study,
the degree of honey browning was determined for a 50% (w/v) honey solution by taking
the net difference (A4so-A72onm) (Martins et a1., 2003). The results were expressed as AU.
15

2.S Brix
Sugar content was determined using a refractometer with direct reading display
(American optical ABBE 10450 Refractometer, Buffalo, NY, USA) and was expressed as
°Brix and sugar concentration (gIL). Briefly, honey samples were diluted to 50% (w/v)
with distilled water, centrifuged for 5 minutes at 5000 x g and subjected to sugar content
determination. A 7% (w/v) solution of glucose was used as the standard.
2.6 Size~exclusion chromatography
Sepharose 4B (Sigma-Aldrich) was packed into a column (24 x 1.6 cm) and was
equilibrated with distilled water at 1mllminute prior to use. Briefly, 2mls of a 50% (w/v)
honey solution supernatant that was diluted in 0.15M sodium chloride and spun at 13000
x g for 5 minutes was loaded onto the column. The fractions (3ml) were eluted with
distilled water and monitored at 280nm.
A standard curve for molecular weight determination was generated using a
protein kit (Gel Filtration HMW Calibration kit, GE Healthcare) containing ferritin (440
kDa), catalase (240 kDa), aldolase (158 kDa), and albumin (66 kDa).
2.7 Antioxidant activity
The antioxidant activity was measured using the ORAC (oxygen radical
absorbance capacity) assay as described by Huang et al. (2002) and the application note
(Held, 2005) from BioTek (Winooski, VT) with modifications. Immediately prior to use,
the fluorescein stock solution (4x 1O-3mM), which was wrapped in foil and stored at 4°C,
was diluted 1: 1 00 with 75mM phosphate buffer (pH 7.4) to obtain a working fluorescein
solution. A Trolox stock solution was prepared by measuring 0.25g of Trolox and
16

dissolving it in 50ml of 75mM phosphate buffer (pH 7.4) to obtain a 0.02M Trolox stock
solution.Working Trolox solutions (20 - 0.6251lM Trolox concentrations) were prepared
prior to use with the same phosphate buffer.
In terms of plate usage, the exterior wells were filled with 300lli of distilled water
and were not used for experimental detennination to avoid errors due to light scattering at
the plate edges. To the interior wells of the plate, 150111 of the freshly prepared working
fluorescein solution was added using a 12-chalmel micropipette. In addition, 25 III of the
suitably diluted sample and Trolox were added to the sample and standard wells, and 25
III of75mM phosphate buffer (pH 7.4) was added to the blank containing wells. The plate
was then allowed to equilibrate by incubating it for a minimum of 30 minutes in the
Synergy HT Multi-Detection Microplate Reader (BioTek Instruments, Inc, Winooski,
VT) at 37°C. Following incubation, the reaction was initiated by the addition of25 III of
the freshly prepared AAPH solution (0.414g of AAPH dissolved in 10ml of75mM
phosphate buffer, pH 7.4) with a 12-channel micropipette to all experimental wells to
result in a final volume of 200 Ill.
Fluorescence was measured from the bottom of the plate at a sensitivity setting of
60 every 1.5 minutes for 60 minutes with emission and excitation wavelengths of 528 and
485nm, respectively. Prior to each reading, shaking at maximum intensity for 10 seconds
took place.
KC4 Data Reduction Software (BioTek Instruments, Inc, Winooski, VT) was
used to obtain the raw fluorescence values, and Microsoft Excel was used to calculate the
Net area under the curve (AUC) of the samples and standard. ORAC values were
calculated using the following equations.
AUC was calculated as follows:
17

AVC = 0.5 + (R2/Rl) + (R3/Rl) + (R4/RI) + ... + 0.5(Rn/RI)
where RI is the fluorescence measurement taken at the initiation of the reaction and Rn is
the last fluorescence measurement.
The net AVC was calculated as follows:
Net AVC = AVC sample or standard - AVC blank
Final ORAC values were calculated by using the regression equation obtained
from the Trolox standard curve, and were expressed as Ilmol Trolox equivalents (TE) per
gram of honey.
2.8 Solid-phase extraction
Honey samples were subjected to solid-phase extraction prior to total phenolic
content analysis. Briefly, honey samples were prepared (25% v/v) in acidified water (pH
2.3) and spun for 2 minutes at 13000 x g in an Eppendorfmicrocentrigfuge~ Prior to
addition of the supernatant onto the Waters Oasis HLB 3cc Extraction Cartridges (SPE
cartridge, Oasis HLB from Waters, Milford, MA), the cartridges were conditioned and
equilibrated by adding and drawing through 1 ml of pure methanol and 1 ml of distilled
water, respectively. After loading 1ml of the 25% (v/v) honey sample supernatant onto
the cartridge, the cartridge was washed with Iml of 5% methanol in water (v/v) to
remove the sugars and polar constituents in honey. Samples were eluted with 1ml of pure
methanol and were stored at 4°C.
18

2.9 Total phenolic content
Total phenolic content was detennined using the Folin-Ciocalteu method as
described by Singleton and Rossi (1965) with modifications, using gallic acid as the
standard (Singleton et al., 1999).
The working Folin-Ciocalteu reagent was prepared just prior to use by diluting the
concentrated Folin-Ciocalteu reagent 1: 17 with distilled water. A gallic acid standard
curve was run alongside the samples (500-31.25 Ilg/ml). Briefly, 200J..lL of the
corresponding gallic acid solution, the methanol fraction eluted from solid phase
extraction (SPE), or distilled water which was used for the blank was mixed in a 4.5ml
tube with 2.4ml of the freshly prepared working Folin-Ciocalteu reagent. After exactly
one minute, 420J..lL of sodium bicarbonate (20 % (w/v» was added to each test tube. Each
test tube was inverted three times and was incubated in the dark at room temperature for
one hour.
After incubation, 91 OJ..lL of distilled water was added to each test tube, the test
tube was inverted three times and absorbance was measured at A 76Snm using a
spectrophotometer (Ultrospec 31 00 Pro). The quantity of phenolics was estimated in
relation to a gallic acid standard curve and the results were expressed as Ilg gallic acid
equivalents (GAE) per g of honey.
2.10 Sodium dodecyl sulfate polyacrylamide gel electrophoresis (SDS-PAGE)
Prior to electrophoresis, honey fractions obtained from size-exclusion
chromatography were subjected to 80% ethanol precipitation by adding 6.5 volumes of
95% ethanol to 1 volume of sample solution. The ethanol solutions were cooled to -20°C
19
for at least 12 hours and were centrifuged at 13 000 x g for 20 minutes. The ethanol was
removed from the pellet and the samples were dried at 85°C. The pellets were
resuspended in sample buffer (pH 6.8) containing 4% (w/v) SDS, 10% (v/v) glycerol,
10% (v/v) B-mercaptoethanol and 0.01 % (w/v) bromophenol blue in 0.25M Tris-HCI and
heated at 95°C for 5 minutes.
SDS-polyacrlamide gel electrophoresis was carried out according to Laemmli
(1970) using 10% (w/v) polyacrylamide separating and 5% (w/v) stacking gels. These
gels contained 0.1 % (w/v) SDS. Honey samples were loaded onto each well (30J..lI), and
were electrophoresed for 1.5 hours at a constant current of 100 Volts.
Protein bands were visualized by Coomassie Brilliant Blue R-250 (BioRad) and
destained with 7% acetic acid/ 40% methanol. Estimation of the protein molecular mass
was performed using a protein standard kit (PageRuler Prestained Protein Ladder,
Fermentas).
2.11 Liquid Chromatography Electrospray Ionization Mass Spectrometry (LC-ESI-MS)
LC-ESI-MS analyses were carried out with a Bruker HCT Ultra LC/MS
instrument operating in the negative ion mode with a capillary exit voltage of -128.5
Volts and a skimmer voltage of -40.0 Volts. Honey components in the sample were
separated on an Agilent 160 ZORBAX Eclipse XDB- C18, 4.6 x 50 mm column with
2mmoliL formic acid (pH 2.7) (A) and methanol (B) as solvents (HPLC grade, Merck).
LC was performed within a retention time of 20 minutes using the following elution
gradient: 0-3 minutes 22% B, 10 minutes 100% B, 12 minutes 100% B, 13 minutes 22%
B. The separation was done at room temperature with a flow rate of 1mllmin and all
20

chromatograms were recorded at 254mn. MS was acquired with an accumulation time of
558 IlS with a mass ion scan ranging from 100 mlz to 750 mlz.
2.12 Statistical Analysis
A Principal component analysis was performed using SPSS version 17.0. Pearson
r correlation analyses were performed using the statistical program Graph-Pad Instat
version 3.05 (GraphPad Software Inc.). Unless specified, a significance level ofP < 0.05
was employed.
3. Results
Part I:
The specific aim of Part I of the thesis was to investigate the relationship between
antioxidant activity, honey colour, total phenolic content and Maillard reaction products,
so as to elucidate the components involved in the antioxidant activity of honey.
3.1 Physical-chemical characteristics of honeys used in the study
A set of 22 honeys from various floral sources were characterized based on sugar
concentration, honey colour, total phenolic content and browning index which estimates
the content of Maillard reaction products (MRPs). The honeys chosen for characterization
included honeys that varied from white to dark brown in colour (0.038 to 1.16 AU at
AS6o-Ano, respectively). Upon arrival, the honey samples were assigned a number. The
list of honeys is presented in Table 1 (Materials and Methods section). .
21

3.1.1 BRIX
BRIX is a common method in the beekeeping industry that is used to calculate the
concentration of reducing sugars. The sugar concentration of honeys diluted to 50% (w/v)
were measured using a refractometer and expressed in units of °Bx (g sugar! 100 g
solution). The °BX units were then converted to sugar concentration (giL) (Table 2).
Table 2: BRIX measurements of honey samples using a refractometer
Sugar concentration Brix Honey Sample (50% wlv honey) (giL) (100% honey) Artificial sugar (7% w/v) 74.4 14.4
77 443.8 76.8 149 456.9 78.8
76 459.9 79.2 116 453.3 78.2 083 452.6 78.1 112 450.4 77.8 118 446.4 77.2 105 457.1 78.8 114 444.3 76.9 085 447.4 77.3 119 447.9 77.4 086 447.4 77.3 082 435.6 75.5 92 453.4 78.2 088 450.3 77.8 123 446.7 77.2 089 452.9 78.2 08 1 440.8 76.3 084 457.9 78.9
087 456.6 78.7 Samples were measured at 25 .9 - 27.2°C. Brix values were adjusted to temperature usmg the conversion factor: °Brix + CC-20)*O.07
As shown in Table 2, the BRIX values of 100% honey varied from 75.52 to 79.24
°Brix. The data obtained are in agreement with those published in a number of studies
(Silva et al., 2009; Saxena et al., 2010). According to these values, honey contains high
amounts of reducing sugars with a slight variation among the floral sources.
22

3.1.2 Honey colour and browning index (MRPs)
Honey colour as defined by visual assessment varied from white to dark brown.
The almost white honeys originated from clover and alfa alfa, honeys of yellow to light
amber in colour originated from sunflower, canola, wildflower, and borage, the medium
amber coloured honeys were from manuka, leafy spurge and dandelion, and the brown to
dark brown honeys were from buckwheat origin (Figure 3).
a) c) d) e)
Figure 3: Colour of honey. a) white/colourless, b) light yellow, c) dark yellow/light amber, d) medium amber, e) brown to dark brown.
The colour intensity of honey results from the presence and concentration of
pigments, which include phenolics, flavonoids and MRPs. The colour intensity can be
determined spectrophotometrically by evaluating the net absorbance at AS6o-A72onm. The
results obtained for honey colour measurements are shown in Table 3.
In addition to phenolics, MRPs are also known to influence honey colour.
Beekeepers are well aware of the fact that honeys of light colour often became darker
upon storage. Moreover, the change in colour is also notable during honey processing and
pasteurization, which is known to facilitate the Maillard reaction and non-enzymatic
browning (Turkmen et aI., 2006). As ofthe current literature, the relationship between
MRPs and honey colour in raw, unheated honey has not been investigated. There is no
experimental data in the literature supporting the notion and the involvement of MRPs in
the browning of honey upon storage. To determine the potential presence ofMRPs in
23

unheated honey and their influence on honey colour, the MRP content was assessed
based on the browning index and was related to the colour of honey.
Table 3: Colour characterization (As6o-Anonm) and browning index (A4so-Anonm) of honey samples
Honey Sample A56o-Anonm a ~50-Anonm a
-77 1.16 ± 0.04 3.51 ± 0.10 149 0.88 ± 0.02 3.6 ± 0.1
Dark -< 76 0.72 ± 0.05 3.05 ± 0.24 116 0.68 ± 0.03 2.73 ± 0.19 177 0.66 ± 0.02 2.18 ± 0.26
>- 08-3 0040 ± 0.02 1.78 ± 0.09 148 0.39 ± 0.01 1041 ± 0.06
Medium 112 0.24 ± 0.01 0.82 ± 0.02 118 0.191 ± 0.009 0.64 ± 0.02 105 0.14 ± 0.01 0.56 ± 0.02
114 0.13 ± 0.01 0.50 ± 0.03 'r 08-5 0.11 ± 0.01 0043 ± 0.04
119 0.10 ± 0.01 0.32 ± 0.04 08-6 0.10 ± 0.01 0.26 ± 0.03 08-2 0.094 ± 0.005 0.26 ± 0.02 92 0.09 ± 0.01 0.34 ± 0.03
Light 08-8 0.089 ± 0.008 0.29 ± 0.02 123 0.087 ± 0.006 0.325 ± 0.004 08-9 0.046 ± 0.007 0.13 ± 0.01 08-1 0.043 ± 0.007 0.12 ± 0.01 08-4 0.040 ± 0.005 0.12 ± 0.01 08-7 0.038 ± 0.008 0.11 ± 0.02
a. Data shown as means (AU) ± SD of at least five independent determmatlOns (112.:5). Values obtained for AS6o-Anonm and AtSO-A720nm correspond to 50% (w/v) honey solutions. Honeys are arranged from darkest to lightest in colour according to AS6o-Anonm values.
As a result of the heterogenous mixture of chemical compounds formed in the
Maillard reaction, there is no official method to estimate MRP content. The most
commonly used method is a spectrophotometric measurement of absorbance at
wavelengths between A420 to ~80mn, which is the wavelength range where brown
pigments show a broad peak (Manzocco et al., 2001). Therefore, to estimate the content
of brown pigments in honey, the net absorbance at A45o·AnOmn was measured and
expressed as AU (Table 3).
24
As shown in Table 3, the brown pigments absorbing in the wavelengths
characteristic of MRPs were present in all tested honeys. Their content was dependent on
honey colour with the highest levels being observed in the dark honeys and the lowest
levels in the light honeys. In the extreme cases, up to a 30 fold difference in the level of
brown pigments between the lightest (#08-7) and darkest honey (#77) was observed with
values ranging from 0.11 to 3.51 AU (Table 3). This is the first evidence that Maillard
reaction-like products (MRLPs) occur in unheated honey and that their content differs
significantly among honeys of different colour and originating from various floral
sources. The term 'Maillard reaction-like products' was used to describe the brown
pigments as the chemical structure and origin of these pigments are largely unknown.
The darker coloured honeys, which are rich in pigments (flavonoids and phenolic
acids), have been demonstrated to show higher phenolic content as well as higher
antioxidant activities compared to light coloured honeys (Gheldof, & Engeseth, 2002;
Beretta et aI., 2005). In order to further investigate the relationship between MRLPs and
honey colour, it was important to determine the level of phenolics in these honeys.
3.1.3 Total phenolic content
Total phenolic content was determined using the Folin-Ciocalteu method. Honey
solutions diluted to 25% (v/v) were subjected to solid phase extraction (SPE) to remove
reducing sugars that could interfere with Folin-Ciocalteu analysis. The Folin-Ciocalteu
method measures the intensity of blue colour of a solution which results from the
reduction of metal oxides by phenolics (Singleton et aI., 1999). The higher the content of
phenolics and the higher the reducing capacity of honey the darker the colour of the
resultant reaction mixture. A gallic acid standard curve was run alongside the samples
(refer to Appendix A, Figure A-I). Total phenolic content was estimated from the
standard curve and was expressed as Ilg GAEl g of honey (Table 4).
25

Table 4: Total phenolic content of honey as detennined by Folin-Ciocalteu
Honey Sample AS60-AnOnm • Total phenolic content (Ilg GAEl g ofhoney)b
J 77 1.16 ± 0.04 513.25 ±8.03 149 0.88 ± 0.02 408.03 ± 12.39
76 0.72± 0.05 318.74 ±7.04 Dark 116 0.68 ± 0.03 253.88 ±1.72 177 0.66± 0.02 163.14 ± 15.56 08-3 0.40± 0.02 320.41 ± 12.09 148 0.39 ± 0.01 186.68 ± 12.53
Medium 1-< 112 0.24± 0.01 156.39 ± 16.45 118 0.191 ± 0.009 165.10 ±0.92 105 0.14 ± 0.01 144.77 ±3.83 114 0.13 ± 0.01 106.97 ±3.60 08-5 0.11 ± 0.01 144.55 ± 36.71
119 0.10± 0.01 80.82 ± 3.49 08-6 0.10± 0.01 68.03 ± 12.26 08-2 0.094 ± 0.005 84.86 ± 25.40
92 0.09± 0.01 81.90 ±6.58 Light 08-8 0.089 ± 0.008 79.55 ±1.09
123 0.087 ± 0.006 81.22 ±4.66 08-9 0.046 ± 0.007 51.21 ± 18.64 08-1 0.043 ± 0.007 70.10 ± 21.52 08-4 0.040 ± 0.005 80.38 ± 36.40 08-7 0.038 ± 0.008 49.78 ± 13.61
a. Data shown as means (AU) ± SD of at least five mdependent detennmatlOns (ne5). Values obtained correspond to 50% (w/v) honey solutions.
b. Data shown as means (Ilg Gallic Acid Equivalents! g of honey) ± SD of at least three independent determinations tested in duplicate (ne6).
As shown in Table 4, the concentration of phenolics was the highest in the dark
honeys and lowest in the light honeys. In the extreme cases, up to a 10 fold difference in
total phenolic content was observed where the values ranged from 49.78 to 513.25 J.1g
GAE/g, respectively (honey #08-7 and honey #77, respectively). The results observed
here indicate an association between honey colour and the content of phenolic
chromophores in honey. This is significant because honey colour, which reflects the
presence of pigments, is a known predictive marker of honeys antioxidant activity
(Gheldof & Engeseth, 2002; Blasa et al., 2006).
26

3.1.4 Antioxidant activity of honey
Honey colour and phenolic content have been shown to be strongly correlated
with antioxidant activity (Oheldof & Engeseth, 2002; Blasa et al., 2006; Bertoncelj et al.,
2007). On the other hand, in beverages such as coffee, the overall antioxidant power has .
been influenced by Maillard reaction products (Borrelli et aI, 2002b; Delgado-Andrade et
al., 2005). Thus, it was of interest to determine the influence of these parameters on the
antioxidant activity of raw, unheated honey.
The antioxidant activity was established using the high-throughput Oxygen
Radical Absorbance Capacity (ORAC) assay. The honey's radical scavenging activity
was analyzed using the peroxyl radical generator, 2,2'-azobis (2-amidinopropane)
dihydrochloride (AAPH), and was expressed as Trolox equivalent (TE) units. A Trolox
standard curve was run alongside the samples (refer to Appendix A, Figure A-2).
As shown in Table 5, the dark honeys demonstrated the greatest antioxidant
activity and the light honeys demonstrated significantly lower antioxidant levels. The
ORAC values differed 10 fold among the honeys tested and ranged from a value of 1.99
~mol TE/g for a light coloured honey (#08-9) up to 19.77 ~mol TE/g for a dark coloured
honey (#76). The darkest coloured honeys, mainly those of buckwheat origin, were found
to be the most potent against peroxyl radicals, with values ranging from 12.75 to 19.77
~mol TE/g (Table 5).
These results suggest a relationship between honey colour and antioxidant activity
as detennined by ORAC. Moreover,the concentration of phenolics and MRLPs seemed
to correlate with honey colour. In order to demonstrate the involvement of these three
parameters (honey colour, phenolic content and MRLPs) on the antioxidant activity of
honey, a principle component analysis was employed.
27

Table 5: Summary of results for honey colour, total phenolic content and antioxidant activity
Honey AS6o-Anonm a Total phenolic ORAC Sample content c
b (/lmol TE/g of honey) (f.lg GAEl g of honey)
Dark j 77 1.16 ± 0.04 513.25 ± 8.03 19.13 ± 0.96
149 0.88 ± 0.02 408.03 ± 12.39 12.75 ± 0.43 76 0.72 ± 0.05 318.74 ± 7.04 19.77 ± 0.84 116 0.68 ± 0.03 253 .88 ±1.72 17.41 ±1.11 177 0.66 ± 0.02 163.14 ± 15.56 8.26 ± 0.41 08-3 0.40 ± 0.02 320.41 ± 12.09 8.19 ± 0.32 148 0.39 ± 0.Ql 186.68 ± 12.53 7.62 ± 0.55 112 0.24 ± 0.01 156.39 ±16.45 4.59 ± 0.25
1 118 0.191 ± 0.009 165.10 ± 0.92 4.41 ± 0.27 105 0.14 ± 0.01 144.77 ± 3.83 5.31 ± 0.23 114 0.13±0.01 106.97 ± 3.60 5.37 ± 0.33
Medium
08-5 0.11 ± 0.01 144.55 ± 36.71 4.66 ± 0.23 119 0.10 ± 0.01 80.82 ± 3.49 2.75 ± 0.15 08-6 0.10 ± 0.Ql 68.03 ± 12.26 3.73 ± 0.15 08-2 0.094 ± 0.005 84.86 ± 25.40 3.53 ± 0.13 92 0.09 ± 0.01 81.90 ± 6.58 5.85 ± 0.34
Light 08-8 0.089 ± 0.008 79.55 ± 1.09 4.64± 0.19 123 0.087 ± 0.006 81.22 ±4.66 4.62 ± 0.21 08-9 0.046 ± 0.007 51.21 ± 18.64 1.99 ± 0.09 08·1 0.043 ± 0.007 70.10 ± 21.52 2.98 ± 0.11 08-4 0.040 ± 0.005 80.38 ± 36.40 3.04 ± 0.09 08-7 0.038 ± 0.008 49.78 ± 13.61 3.36 ± 0.14
a. Data shown as means (AU) ± SD of at least five mdependent detennmatlOns (n2':5). Values obtained correspond to 50% (w/v) honey solutions.
b. Data shown as means (/lg Gallic Acid Equivalentsl g of honey) ± SD of at least three independent detenninations tested in duplicate (n2':6).
c. Data shown as means (/lmol Trolox Equivalentsl g of honey) ± SEM (n2': 7). Each trial was tested in triplicate. RSD is <15% for the values obtained.
3.1.5 Relationship between the antioxidant activity of honey with honey colour,
total phenolic content and Maillard reaction products
As the antioxidant activity appears to be influenced by honey colour, which in
tum is indicative of the content of phenolics and MRPs, it was of interest to test
statistically the relationship between these parameters by employing a principle
component analysis. As shown in Table 6, the correlation matrix revealed that all four
variables showed a strong correlation with one another. The first principal component
was found to be extremely large, accounting for 95% of the variance.
28

Table 6: Component loading matrix
Variable Loading on First Principal Component
Honey colour 0.992
MRPs 0.991
Total phenolics 0.967
ORAC 0.955
According to the correlation matrix (Table 7), the highest correlation has been
observed between honey colour and MRLPs (0.980), followed by total phenolic content
and honey colour (0.963), MRLPs and total phenolics (0.950), and ORAC and MRLPs
(0.938) (Table 7). Regarding antioxidant activity, ORAC demonstrated the highest
correlation with MRLP content and honey colour with values of 0.938 and 0.931,
respectively.
Table 7: Correlation matrix
Honey colour MRPs Total phenolics ORAC
Honey colour 1.000 0.980 0.963 0.931
MRPs 0.980 1.000 0.950 0.938
Total Phenolics 0.963 0.950 1.000 0.860
ORAC 0.931 0.938 0.860 1.000
The strong correlation of these parameters with the antioxidant activity supports
the idea that honey colour is a predictive marker of antioxidant activity. As ORAC
demonstrated a highly significant correlation with MRLPs, this is the first evidence of a
significant contribution ofMRLPs to the overall antioxidant capacity ofraw, unheated
honey. This novel observation suggests that non-enzymatic browning may be chiefly
responsible for the colour of unheated honey, and as a result, appears to be a major
contributor to the antioxidant activity of honey.
A version of this chapter has been published . Brudzynski & Miotto (2011). Food Chemistry. 124: 869-874. 29
Part II:
The observation of a strong correlation between the antioxidant activity of honey
and the content of MRLPs, total phenolics and honey colour prompted further
investigations on the chemical composition ofMRLPs in honey and their role in the
antioxidant activity.
The specific aims of Part II of the thesis were as follows:
A. Isolation of components involved in the antioxidant activity of honey
B. Demonstration of the formation ofMRPs/ me1anoidins in honey and their
contribution to antioxidant activity
C. Chemical characterization ofMRPs/melanoidins
3.2 Methodological approa.ch towards the isolation and characterization of
components involved in the antioxidant activity of honey
In order to isolate a honey's antioxidants, size-exclusion chromatography (SEC)
on Sepharose 4B was employed and the fractions obtained were analyzed for antioxidant
activity using the ORAC assay. Based on the results obtained so far, it was hypothesized
that MRLPs will be present among the antioxidant compounds. From the literature,
MRPs are aggregates and polymers formed via crosslinking between low molecular
weight chromophores and HMW non-coloured biopolymers (protein), and
polycondensation of repeating units offurans and pyrroles (Tressl et aI., 1998; Hofinann,
1998b; Adam et aI., 2005). In this context, SEC appeared to be the method of choice
because (1) it allows for the separation of high molecular weight aggregates/complexes,
which we assumed we are dealing with and (2) SEC allows the continuous determination
of the molecular size of compounds exhibiting antioxidant activity, unlike methods such
as dialysis and dia-/ultrafiltration, which rely on the cut-off limits of the filtration
30

membrane to estimate the molecular size. Thus, SEC and activity-guided fractionation
was the method employed in this study.
The scheme that was used for the fractionation of honey components is shown in
Figure 4. Briefly, 2mls of honey diluted to 50% (w/v) with 0.15M NaCI was loaded onto
the column. The fractions (3ml) were eluted with distilled water and monitored at 280nm.
The identified active fractions of known molecular size were further analyzed for (a)
phenolic content using F olin-Ciocalteu, (b) Maillard reaction products using the
browning index (net absorbance at ~50-A720nm), (c) protein content using SDS-PAGE
and (d) the presence of sugar, amino sugars and honey specific flavonoids by LC-ESI-MS
(Figure 4).
1 Phenolics
Honey (50% w/v)
1 Size-Exclusion Chromatography
1 A280nm
Elution Profile (3ml fractions collected)
1 Identify Fractions with Antioxidant Activity
1 I MRPs Protein
Figure 4: Scheme for the characterization of honey fractions
1 Sugars
3.2.1 Characterization of the antioxidant components in unheated honey obtained
from SEC as analyzed at 280nm
Size-exclusion chromatography (SEC) was conducted using a Sepharose 4B resin.
The fractions that eluted from the column were monitored at 280nm, which is the
31
\..

absorbance maximum that is characteristic of proteins, phenolics, flavonoids and their
derivatives. SEC appeared to be the method of choice because it allows the separation of
chemical components on a molecular weight basis. Using this technique, the low
molecular weight compounds were retained on the column and were eluted after the
molecules of high molecular weight.
By monitoring the fractions that eluted from the SEC column at 280nm,
differences in the chemical composition of the honeys were demonstrated. As shown in
Figure 5, the chromatographic profiles of the three unheated honeys that differed in their
colour were in general, similar. All honeys demonstrated profiles that consisted of a
minor peak in the void volume (FS) and a major peak appearing in fractions FI3 to F17
(Figure 5a-c). The main difference between the elution profiles obtained for the different
honeys was the amount ofUV absorbing components. The unheated darker honeys (#148
and #177) indicated higher levels ofUV absorbing components, particularly in the major
peak (FI3-FI7), compared to the light honey, which gave rise to a major peak that was
half the intensity of that observed for the darker honeys. In addition, the dark buckwheat
honey also demonstrated the highest level ofUV absorbing components in the minor
peak (F5), in turn indicating the presence of a significant amount of very high molecular
weight components.
All fractions that eluted from the column were tested for their antioxidant activity
using the 96-well fonnat ORAC assay. The results indicated that the activity was only
observed in fractions that eluted in the major peak (F 13 to F 15 and F 13 to F 16 for the
light and darker honeys (#148 and #177), respectively) (Table 8). The ORAC values were
shown to differ up to 7 fold between the light and dark coloured honeys (#08-5 and #177)
with values ranging from 437 to 2979 umol TEl L and 404 to 2742 umol TEl L, for
fraction F14 and FIS, respectively.
32
3 T I V
2.5 ,-- .---
~ 2 I ~ 1.5 ! ~ I J ___ - _ ._--
0.5 1= _ I o " , I - I ,1,J,.a.....,...,...,. I.
1 3 5 7 9 11 13 15 17 19 21
Fractions
a) Honey #08-5 (light)
3 ,--------------~~--------V
2.5 +------;---
E 2 +----1--- - - --1 ......... 1----c ~ 1.5 +--------''-------1 .......... 1--N < 1
0.5 +---I ...... ---...-t ..................
o ~~~~~~~~~~~~~ 3 5 7 9 11 13 15 17 19
Fractions
c) Honey #177 (dark)
3 v
2.5 - t----------.--
E 2 c ~1.5
~ 1
0.5 '1,1,11,., ,_-.---.-.-11 • •••• 1 o .
1 3 5 7 9 I I 13 15 17 19 21
Fractions
b) Honey #148 (medium)
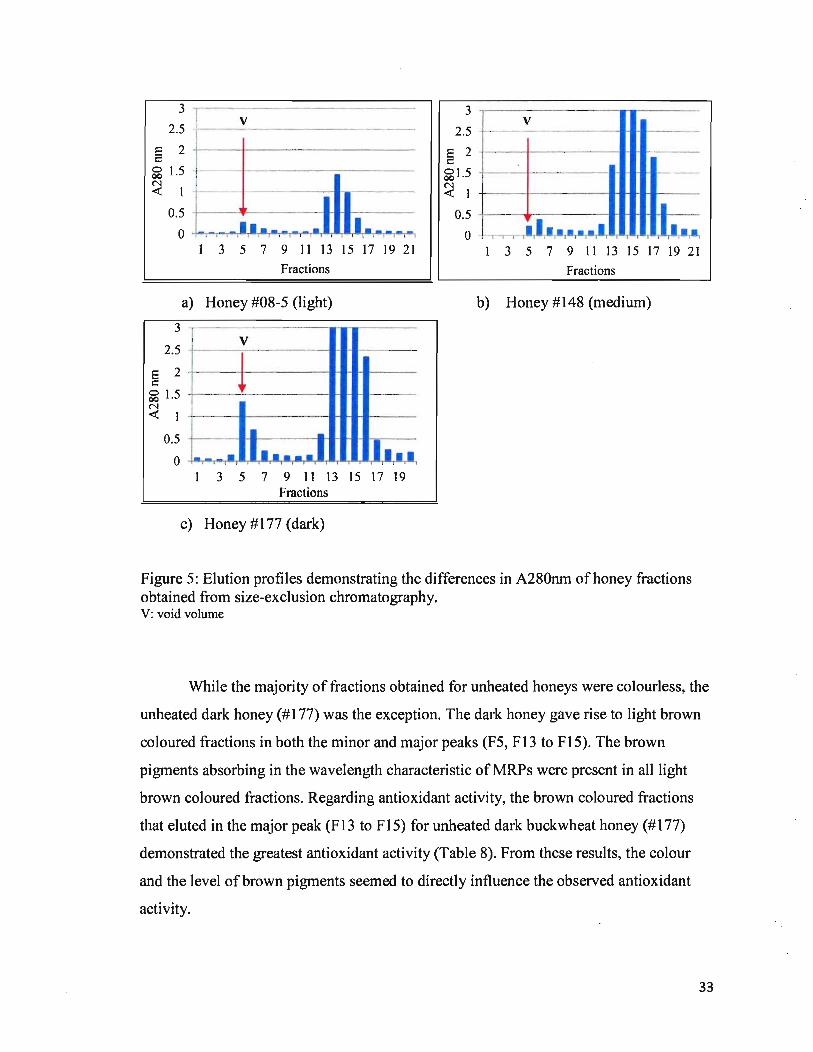
Figure 5: Elution profiles demonstrating the differences in A280nm of honey fractions obtained from size-exclusion chromatography. V: void volume
While the majority of fractions obtained for unheated honeys were colourless, the
unheated dark honey (#177) was the exception. The dark honey gave rise to light brown
coloured fractions in both the minor and major peaks (F5, F13 to FI5). The brown
pigments absorbing in the wavelength characteristic of MRPs were present in all light
brown coloured fractions. Regarding antioxidant activity, the brown coloured fractions
that eluted in the major peak (F13 to F1S) for unheated dark buckwheat honey (#177)
demonstrated the greatest antioxidant activity (Table 8). From these results, the colour
and the level of brown pigments seemed to directly influence the observed antioxidant
activity.
33

Table 8: Level of brown pigments, phenolic content and antioxidant activity of unheated honey fractions
Honey Brown pigments (AU) Total phenolic content ORAC Fraction (~50-A72onm)a (flg GAEl ml)b (gmol TEl L)C
Honey #177
13 0.14 ± 0.05 118.60 ± 5.04 1547 ± 220 14 0.23 ± 0.06 135.00 ± 4.77 2979 ± 202 15 0.19±0.03 108.06 ± 2.79 2742 ± 308 16 0.14 ± 0.04 63.49 ± 5.60 1125 ± 67
Honey #148
13 0.05 ± 0.01 48.14 ± 2.56 1175 ± 165 14 0.092 ± 0.009 62.64 ± 5.93 1479 ± 48 15 0.11 ± 0.01 65.27 ± 6.64 1287 ± 147 16 0.08 ± 0.03 55.43 ± 3.92 967 ± 19
Honey #08-5
13 0.Q15 ± 0.005 39.53 ± 3.23 363 ± 11 14 0.Q17 ±0.006 45.97 ± 3.26 437 ± 46 15 0.017±0.005 39.84 3.96 404±54
a. Data shown as means (AU) ± SD of two mdependently collected samples from the column tested m duplicate (n=4).
b. Data shown as means (flg GAEl ml) ± SD offour independent trials tested in duplicate (n=8). c. Data represented as means (flmol TElL of 100% fraction) ± SD of at least three independent trials
tested in triplicate (~9). RSD is <15% for the values obtained.
3.2.2 Molecular size of the active fractions
To obtain information regarding the size of the active components in honey, and
to suggest that they belong to MRPs/melanoidins, a standard curve for molecular weight
determination was generated under the same chromatographic conditions using the
following standards: ferritin (440 kDa), catalase (240 kDa), aldolase (158 kDa) and
bovine serum albumin (66 kDa) (refer to Appendix A, Figure A-3). From the standard
curve, approximate molecular weights of the components in the fractions of interest were
determined.
From the molecular weight standard curve, the size of the antiox~dant components
were estimated to be of much higher molecular weight than anticipated, ranging from
34

approximately 66 to 232 kDa (F13 to F17) (Table 9). In addition, brown components
from unheated dark buckwheat honey eluted in the same volume that blue dextran (2 000
kDa) eluted (FS). This result in turn suggested that brown MRLPs of very HMW, which
exhibited high UV absorbance at 280nm, were present in unheated dark honey.
Table 9: Molecular weight of components as determined from the SEC standard curve
Honey Fraction Approximate molecular weight of components (kDa)
13 180 - 232
14 140 - 180 15 109 - 140 16 85- 109 17 ~6-85
These results suggest that the active fractions of dark buckwheat honey (#177)
contain high molecular weight MRLPs. It was demonstrated that the components in these
fractions absorb at A280nm, contain brown pigments (~50-A720nm), exhibit antioxidant
activity (ORAC), and are of high molecular weight (as estimated from the standard
curve). As the Maillard reaction is known to occur in heat-treated foods and is associated
with the formation of MRPs/melanoidins, these honeys were subjected to heat-treatment
for the purpose of generating melanoidins. The MRLPs generated in heat-treated honey
were then compared to those present in unheated honey, particularly dark buckwheat
honey.
3.3 Methodological approach towards the identification of melanoidins in honey and
their contribution to the antioxidant activity
The Maillard reaction is known to occur in heat-treated foods and is associated
with the fonnation of brown pigments-melanoidins. Melanoidins can be characterized by
their absorbance maximum (A420 -A4S0nm), high molecular weight, darkening of the
initial colour, increased content ofUV absorbing compounds, and antioxidant activity. As
35

heat-treatment is the critical element to generate melanoidins, the above characteristic
parameters were compared between heat-treated and unheated honeys.
3.3.1 The effect of heat-treatment on honey colour and the level of browning of
honey
The effect of heat-treatment on the colour and brown pigment formation was
analyzed first using whole honey. The same three honeys (light-coloured dandelion, #08-
5, medium-coloured manuka, #148, and dark-coloured buckwheat, #177) that differed in
their initial colour and demonstrated different characteristics based on the chosen criteria
were subjected to heat-treatment at 121·C for 30 minutes.
By visual observation, heat-treatment ofthe 50% (w/v) honey solutions resulted
in the darkening of colour of honey in comparison to the unheated control group (Figure
6). The changes in honey colour were supported by the observed increase in net
absorbance (AS60-A720nrn). The spectrophotometric measurements showed about a two
fold increase in colour values compared to the control (Table 10).
#08-5 #148 #177
Figure 6: Colour of honey samples (50% w/v) before (top) and after heat-treatment (bottom) at 121·C for 30 minutes.
36
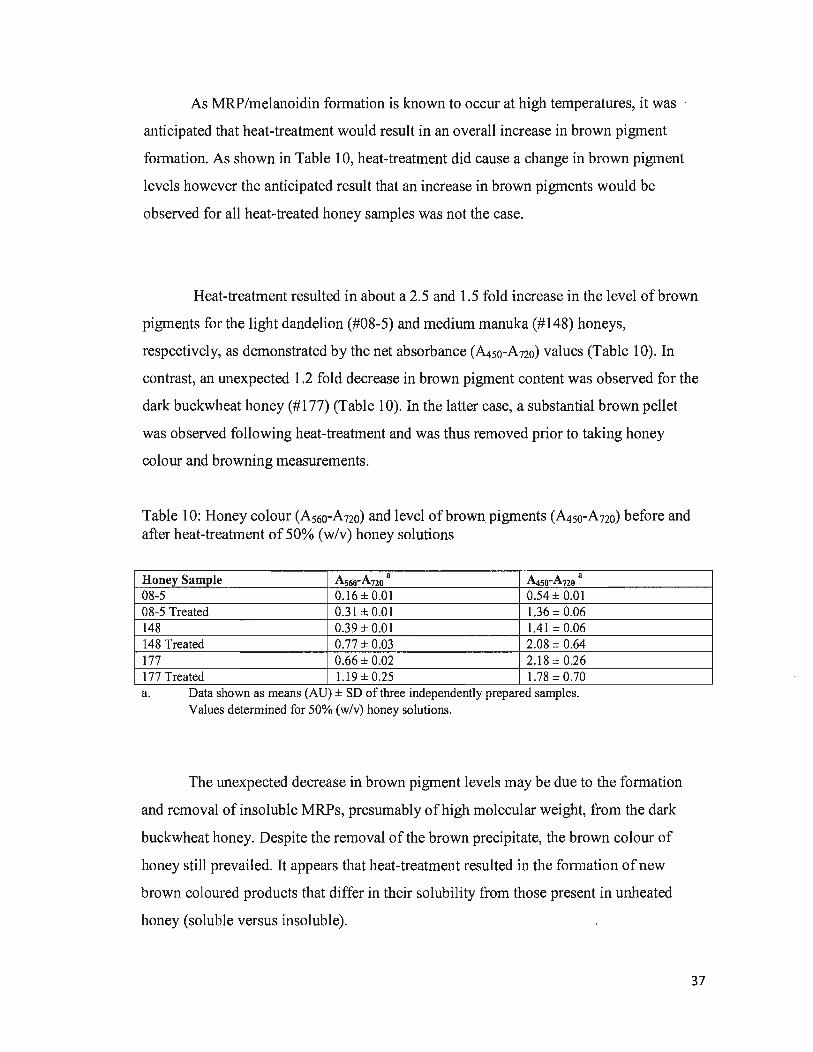
As MRP/melanoidin formation is known to occur at high temperatures, it was
anticipated that heat-treatment would result in an overall increase in brown pigment
formation. As shown in Table 10, heat-treatment did cause a change in brown pigment
levels however the anticipated result that an increase in brown pigments would be
observed for all heat-treated honey samples was not the case.
Heat-treatment resulted in about a 2.5 and 1.5 fold increase in the level of brown
pigments for the light dandelion (#08-5) and medium manuka (#148) honeys,
respectively, as demonstrated by the net absorbance (A4so-Ano) values (Table 10). In
contrast, an unexpected 1.2 fold decrease in brown pigment content was observed for the
dark buckwheat honey (#177) (Table 10). In the latter case, a substantial brown pellet
was observed following heat-treatment and was thus removed prior to taking honey
colour and browning measurements.
Table 10: Honey colour (As6o-Ano) and level of brown pigments (A450-Ano) before and after heat-treatment of 50% (w/v) honey solutions
Honey Sam~le AS60-Ano a Atso-Ano a
08-5 0.16±0.01 0.54 ± 0.01 08-5 Treated 0.31 ± 0.Q1 1.36 ± 0.06 148 0.39 ± 0.Q1 1.41 ± 0.06 148 Treated 0.77 ± 0.03 2.08 ± 0.64 177 0.66 ± 0.02 2.18 ± 0.26 177 Treated 1.19 ± 0.25 1.78 ± 0.70 a. Data shown as means (AU) ± SD of three independently prepared samples.
Values determined for 50% (w/v) honey solutions.
The unexpected decrease in brown pigment levels may be due to the formation
and removal of insoluble MRPs, presumably of high molecular weight, from the dark
buckwheat honey. Despite the removal of the brown precipitate, the brown colour of
honey still prevailed. It appears that heat-treatment resulted in the formation of new
brown coloured products that differ in their solubility from those present in unheated
honey (soluble versus insoluble).
37

3.3.2 The effect of heat-treatment on the antioxidant activity of honey
Heat-treatment of honey at mild temperatures (SO-70°C) was demonstrated to
result in an increase in brown pigment fonnation which coi~cided with an increase in
antioxidant activity (Turkmen et aI., 2006). In the present study, heating honeys at a
much higher temperature (121°C) also resulted in the fonnation of new brown pigments,
however, an overall increase was only observed for the light and medium coloured
honeys. From this result, it appears that the level of soluble brown pigments fonned is
dependent on the initial colour of honey as well as the time and temperature of heating.
As honey colour and the level of brown pigments showed a strong relationship
with the overall antioxidant activity of unheated honeys, it was anticipated that heat
treated honeys, which darkened following heating, would show greater antioxidant
activities compared to the unheated control. As expected, the ORAC values that were
obtained for the heat-treated honeys demonstrated about a I.S fold overall increase in
value compared to the control (Table 11). Despite the removal of an insoluble brown
pellet from the dark buckwheat honey (#177), an increase in antioxidant activity still
prevailed.
Table 11: Antioxidant activity of honey before and after heat-treatment
Honey Sample ORAC· (Jlmol TEl L of honey)
085 3143 ± 457
085 Treated 5568 ± 760
148 11113±1614
148Treated 16391 ± 2338
177 16054 ± 1593
177Treated 24266 ± 917
a. Data shown as means (jJ.mol TEl L) ± SD of at least three independent trials tested in triplicate (n2:9). RSD is <15% for the values obtained.
These results demonstrated that heat -treatment of honey resulted.in the generation
of new brown pigments that exhibit antioxidant activity. In order to detennine whether
38

these newly formed compounds are melanoidins, the heat-treated honeys were subjected
to SEC fractionation to establish the size of the heat produced antioxidant components.
3.3.3 SEC of heat-treated honey
The heat-treated honey fractions were analyzed for changes in colour, level of
brown pigments, changes in the UV profile and antioxidant activity. The above
characteristics were compared between unheated and heat-treated honey fractions.
3
2.5 . 08- 5
- --;- --- ----------_ .. _----_._.]
§ 2
a61.5 N <t 1
0.5
o
. 08-5 Treated
,--._- --I T
L,~~~,LJL ''''_'~ .... - ., 3 5 7 9 II 13 15 17 19 21
Fractions
a) Honey #08-5 (light)
3
2.5
E 2 c ~ 1.5
~
0.5
o
-. 177
. 177 Treated
V
• ~- .. .LLL •. .1 j ,k ,
3 5 7 9 11 13 15 17 19 Fractions
c) Honey #177 (dark)
2.5
E 2 c ~1.5 N <t
0.5
o
. 148
. 148 Treated
..
v • • LLL.L LI ~ .... -,-. ,
1 3 5 7 9 11 13 15 17 19 21 Fractions
b) Honey #148 (medium)
Figure 7: Elution profiles demonstrating the differences in A280nm of honey fractions obtained from size-exclusion chromatography before and after heat-treatment. v: void volume .
39
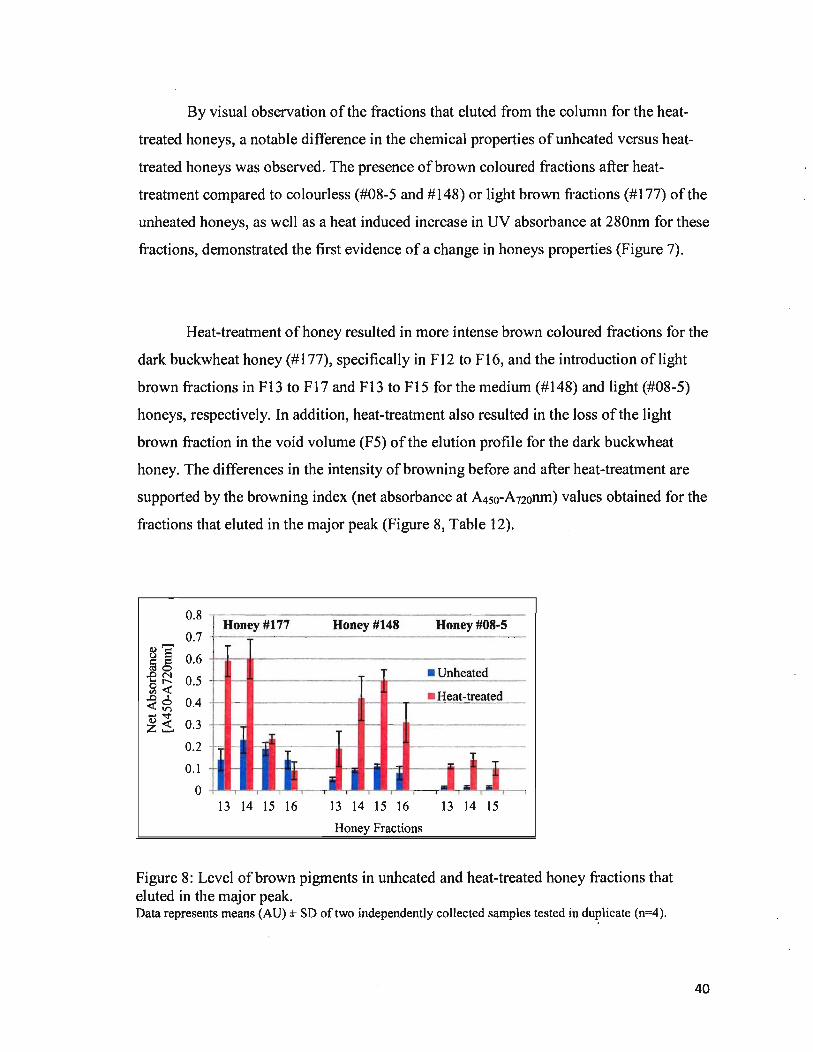
By visual observation of the fractions that eluted from the column for the heat
treated honeys, a notable difference in the chemical properties of unheated versus heat
treated honeys was observed. The presence of brown coloured fractions after heat
treatment compared to colourless (#08-5 and #148) or light brown fractions (#177) ofthe
unheated honeys, as well as a heat induced increase in UV absorbance at 280nm for these
fractions, demonstrated the first evidence of a change in honeys properties (Figure 7).
Heat-treatment of honey resulted in more intense brown coloured fractions for the
dark buckwheat honey (#177), specifically in F12 to F16, and the introduction of light
brown fractions in F13 to F17 and F13 to FI5 for the medium (#148) and light (#08-5)
honeys, respectively. In addition, heat-treatment also resulted in the loss of the light
brown fraction in the void volume (F5) of the elution profile for the dark buckwheat
honey. The differences in the intensity of browning before and after heat-treatment are
supported by the browning index (net absorbance at ~50-A720nm) values obtained for the
fractions that eluted in the major peak (Figure 8, Table 12).
0.8 ~ Honey #177 0.7
Honey #148 Honey #08-5
(I)"""" Co) § 0.6 §o -eN 0.5 0" "'< .D ' 0.4 <~
r-• Unheated
• Heat-treated
-..:t (1)< 0.3 z'-' 0.2 l-
0.1
0
f- Hi j ] ~j :c. • T
JJJ 13 14 15 16 13 14 15 16 13 14 15
Honey Fractions
Figure 8: Level of brown pigments in unheated and heat-treated honey fractions that eluted in the major peak. Data represents means (AU) ± SD of two independently collected samples tested in duplicate (n=4).
40
!

Table 12: Level of brown pigments in unheated and heat-treated honey fractions that eluted in the major peak
MRPs (~50-A720nm)
Honey Fraction Unheated Heat-treated
Honey #177
13 0.14 ± 0.05 0.59 ± 0.07 14 0.23 ± 0.06 0.60 ± 0.09 15 0.19 ± 0.03 0.235 ± 0.02 16 0.14 ± 0.04 0.09 ± 0.04
Honey #148
13 0.05 ± O.oI 0.19±0.08 14 0.092 ± 0.009 0.42 ± 0.10 15 0.11 ± O.oI 0.50± 0.05 16 0.08 ± 0.03 0.31 ± 0.09
Honey #08-5
13 0.015 ± 0.005 0.11 ± 0.01 14 0.017 ± 0.006 0.14 ± 0.03 15 0.017 ± 0.005 0.10 ± 0.03 a. Data shown as means (AU) ± SD of two mdependently collected samples tested in duplicate (n=4).
The influence of colour on the antioxidant activity of fractions became even more
complex following heat-treatment of honey. Heat-treatment resulted in the darkening of
honey fractions andlor the introduction of new brown coloured fractions, particularly in
the major peak. For unheated honey, the dark honey (#177) demonstrated the highest
ORAC value in fractions F14 and F15. On the other hand, heat-treatment of the medium
coloured honey (#148) demonstrated the highest ORAC value (4710 umol TEl L) as well
as the greatest increase in ORAC in fraction F14 (Figure 9, Table 13). Heat-treatment
seemed to influence the antioxidant activity of the light and medium coloured honeys to a
greater extent, as ORAC values were demonstrated to differ 7 fold in F14 between these
two honeys (683 to 4710 umol TEl L for the light and medium honey F14, respectively).
41

6000 .,----------------Honey #177 Honey #148 Honey #08-5
5000 +----------------r ------------
g 4000 +------,,,---------.f-------=.:=-1U ....... r-e-at-:-ed
] 3000 +---It- • Heat-treated :1. '-' u 2000 +---It-
i
1000 t o .
~ o
13 14 15 16 13 14 15 16 13 14 15 Honey Fractions
Figure 9: Antioxidant activity of unheated and heat-treated honey fractions obtained from SEC. Data represented as means (~mol TElL of 100% fraction) ± SO of at least three independent trials tested in triplicate (n2:9). RSD is <15% for the values obtained.
Table 13: Antioxidant activity of unheated and heat-treated honey fractions obtained from SEC
ORAC (J.1mol TEl L)R
Fraction Unheated Honey Heat-treated Honey
Honey #177
12 ns 1258 ± 187 13 1547 ± 220 3730 ± 155 14 2979 ± 202 3017 ± 147 15 2742 ± 308 1073 ± 132 16 1125±67 102 ± 8
Honey #148
13 1175 ± 165 674 ± 56 14 1479 ± 48 4710 ± 645 15 1287 ± 147 2345 ± 339 16 967 ± 19 921 ± 139
Honey #08-5
13 363 ± II 814 ± 122 14 437 ± 46 683 ± 34 15 404 ± 54 409 ± 102
a. Data shown as means (Ilmol TEl L of 100% fraction) ± SO of at least three independent trials tested in triplicate (n 2: 9). RSD is < 15% for the values obtained.
42

The colour of the honey fraction did not appear to significantly correlate with the
observed antioxidant activity of heat-treated honey. Heat-treatment of honey from
different floral origins appears to give rise to different results. For example, heat
treatment ofthe light dandelion honey (#08-5) and the medium manuka honey (#148)
resulted in light brown coloured fractions (F 13 to F 15 and F 13 to F 17) that either showed
an increase or a slight decrease in antioxidant activity (Figure 9, Table 13). For the light
honey, heat-treatment resulted in moderately higher ORAC values in F13 and F14, and
no change in F15. Similarly, heat-treatment ofthe medium honey resulted in a significant
increase in ORAC in F14 and F15, and a slight decrease in F13. Thus, in tum heat
treatment of the light and medium honeys appears to have accelerated the formation of
brown pigments in the major peak fractions, which resulted in an increase, for the most
part, in antioxidant activity.
On the other hand, dark buckwheat honey was the exception and gave rise to a
different outcome. Among the major peak fractions that demonstrated antioxidant activity
in unheated dark buckwheat honey (F13 to FI6), only F13 demonstrated a significant
increase in ORAC following heat-treatment (paired t-test, p<O.OOl). Moreover, heat
treatment ofthis honey caused a significant decrease in the antioxidant activity in F15
and F16 (Tukey-Kramer multiple comparison test, p<O.OOI) and virtually no change in
ORAC in F14 (Figure 9, Table 13). To possibly support the generation of new brown
antioxidant pigments of a different molecular size in this honey, a fraction of higher
molecular weight, F12, which did not show sufficient antioxidant activity in unheated
dark buckwheat honey, demonstrated a change in colour (from colourless to brown) and
the introduction of a measurable level of antioxidant activity following heat-treatment
These results in tum may suggest tllat heat-treatment resulted in the generation of
new brown pigments of higher molecular weight that exhibited antioxidant activity, as
well as a loss in brown antioxidant pigments originally present in unheated honey,
A version of this chapter has been published. Brudzynski & Miotto (2010). Food Chemistry. Doi:l0.l016/j.foodchem.2010.09.049 43

specifically in FI5 and FI6, that caused a significant decrease in ORAC in these
fractions. From these results it appears that the dark buckwheat honey behaves in a
different manner compared to the other two honeys and that the initial composition of
honey is a major influencing factor.
Heat-treatment appears to have resulted in the formation of brown MRLPs of
HMW that exhibit antioxidant activity. Based on the characteristic change in colour,
increase in UV absorbance, increase in brown pigment formation and the overall increase
in antioxidant activity following heat-treatment, it has been suggested that melanoidins
were formed in heat-treated honey and possibly in unheated dark buckwheat honey. In
order to gain information on the main components involved in the honey melanoidin
structure, the unheated and heat-treated honeys were analyzed for proteins, carbohydrates
and phenolics.
3.4 Methodological approach towards the identification of the main components
involved in the melanoidin structure
Data in the literature define melanoidins as carbohydrate-based nitrogen
containing high molecular weight polymers that are formed in the final stage of the
Maillard reaction (Chandra et aI., 2008). In addition, polyphenols are an important part of
certain types of melanoid ins, such as those found in coffee (Nunes & Coimbra, 2007;
Gniechwitz et aI., 2008b). In order to characterize the main components involved in the
melanoidin structure in honey, the Folin-Ciocalteu method was used to determine the
presence and concentration of polyp he no Is, SDS-PAGE was employed to determine the
presence and level of proteins and the presence of carbohydrates was determined using
LC-ESI-MS.
44

3.4.1 The effect of heat-treatment on the overall phenolic content of honey
There are a number of studies demonstrating that phenolic acids are the main
factors responsible for the antioxidant activity of honey (Gheldof & Engeseth, 2002;
Beretta et aI., 2005; Vela et aI., 2007). As heating of food systems is known to change the
chemical properties of the components in the system, such as the solubility of phenolics,
it was of interest to determine the influence of heat-treatment on the overall level of
phenolics in honey.
The concentration of phenolics in the heat-treated honeys varied between honeys
of different floral origin with the highest level being observed in the medium and dark
honeys (#148 and #177) (Table 14). Heat-treatment resulted in about a two·fold increase
in phenolic content for all honeys compared to the control. Despite the formation and
removal of an insoluble brown pellet following heat-treatment of the dark buckwheat
honey (#177), an increase in phenolic content, comparable to that observed for the
medium honey, was still demonstrated.
Table 14: Total phenolic content of unheated and heat-treated honey
Honey Sample Phenolic Conteut8
(J1g GAElml of honey) 085 131.40 ± 2.30 085 Treated 239.23 ± 7.52 148 272.25 ± 18.27 148Treated 483.88 ± 24.88 177 317.21 ± 30.26 177Treated 644.03 ± 21.42
a. Data shown as means (J1g GAEl ml) ± SD of three independent trials tested in duplicate (n=6).
Since honey contains a certain amount and type of components, the observed
overall higher amount of phenolics after heat-treatment could be explain~d, at least in
45

part, by the formation of MRLPs with a phenolic type structure. It is possible that
phenolic condensation plays a role in the browning of honey and the formation of
melanoidins during heat-treatment. The observed overall increase in antioxidant activity
following heat-treatment also supports the notion that formation of melanoidins occurred
in heat-treated honey.
3.4.2 Phenolic content in active fractions of unheated and heat-treated honey
As phenolics have been demonstrated to be involved in the melanoidin structure
in coffee, and since heat-treatment demonstrated an overall increase in the level of
phenolics, it was of interest to determine if the active honey fractions contain phenolic
compounds. The influence of phenolics on the antioxidant activity was compared
between the active fractions of unheated and heat-treated honey.
After subjecting honey to SEC, which removed the small components that may
interfere with Folin-Ciocalteu analysis, the active fractions were subjected to total
phenolic testing. The total phenolic content was expressed as J.1g GAE/ml and the results
obtained are shown in Table 15.
The concentration of phenolics in the major peak for all unheated honeys varied
greatly depending on the floral source, where the dark buckwheat honey demonstrated the
greatest level of phenolics in F14 (135 Ilg GAE/ml) (Figure 10, Table 15). For unheated
honey, lower amounts of phenolics were present in fractions belonging to the light honey
(#08-5) as compared to the darker coloured honeys (#148 and #177), where up to a 3 fold
difference in the phenolic content was demonstrated between the lightest and darkest
honey in these fractions. The difference in phenolic content observed in the unheated
honey fractions appeared to be directly influenced by colour, as the brown coloured
fractions of the dark honey (#177) demonstrated the greatest level of phenolics
46

Table 15: Total phenolic content of unheated and heat-treated honey fractions
Phenolic contenta
Honey Fraction Unheated Heat-treated
Honey #177
12 36.74± 1.76 106.12 ± 2.51
13 118.60 ± 5.04 251.71 ± 5.51
14 135.00 ± 4.77 200.70 ± 12.50
15 108.06 ± 2.79 88.53 ± 4.93
16 63.49± 5.60 44.65 ± 5.59
Honey #148
13 48.14± 2.56 59.30 ± 1.16 14 62.64± 5.93 108.84 ± 2.68 15 65.27± 6.64 106.90 ± 7.21 16 55.43 ± 3.92 81.71 2.94
Honey #08-5
13 39.53 ± 3.23 93.02 ± 13.19 14 45.97± 3.26 80.85 ± 1.4 15 39.84 ± 3.96 58.45 2.01 a. Data shown as means (J.1g GAEl ml offractton) ± SD of three mdependent tnals.
300 Honey #177 Honey #148 Honey #08-5
i:! 250 r«-«-<-<-««- ~"-'-"'-"""''''''-'''''-''''--'''''---'-'-'''''- "'-"'--'-"--"--'--"-'---'~--
~ • Unheated 0:;:' 200 uS 1
-~.--....... --.
~~ • Heat-treated
5'-' 150 -I __ ,,~~_~ .. ,~~~,_~~. __ •• ,,~._._ .. _ ....... > __ ...... _ ... w .... p~ •• ¥ .......... _ .... _M~
fgf 100 -j-
tltt ]-50 III
i1H ~ I I 0 12 13 14 15 16 13 14 15 16 13 14 15
Honey Fractions
Figure 10: Total phenolic content of unheated and heat-treated honey fractions Data represents means (J.1g GAE/ml of fraction) ± SD of three independent trials.
--
47

After heat-treatment, the phenolic levels increased in the major peak fractions of
the light dandelion and medium manuka honeys, and in fractions of higher molecular
weight (F 12-F 14) for dark buckwheat honey (Figure 10, Table 15). In the latter case, a
slight decrease in phenolic content was observed in several fractions, particularly in F 15
and F16 of heat-treated dark buckwheat honey. Despite the reduction in phenolic levels in
F 15 and F 16 of dark buckwheat honey, an overall increase in phenolic content in the
major peak fractions (F13-FI5, light; F13-FI6; medium and FI2-FI6, dark honey) for
heat-treated honey was observed (paired t-test, p<O.OI). From these results, phenolics
appear to influence the colour of both unheated and heat-treated honey fractions, as well
as the observed antioxidant activity. In order to demonstrate the relationship between
these parameters, a Pearson r correlation was employed.
3.4.3 Relationship between the phenolic content, MRLP levels and antioxidant
activity of active fractions of unheated and heat-treated honey
To test statistically the relationship between phenolic content, the level of
browning and antioxidant activity of the active fractions of unheated and heat-treated
honey, the Pearson r correlation was used (Table 16). Overall, a strong correlation
between phenolics and antioxidant activity was observed in unheated and heat-treated
honeys (R2= 0.58, p<O.OOI). In spite of this, a much stronger correlation was observed
between phenolic content and antioxidant activity in unheated fractions than between
phenolic content and antioxidant activity in heat-treated fractions (R2=0.791, p<O.OOl and
R2=0.528, p<0.006, respectively) (Table 16). It appears that heat-treatment of dark
buckwheat honey resulted in the loss of some phenolic antioxidants, as the Pearson r
correlation indicated a weaker relationship between these two parameters following heat
treatment.
Similarly, a comparable trend was observed between the level of browning and
antioxidant activity of unheated and heat-treated honey fractions. As shown in Table 16, a
48
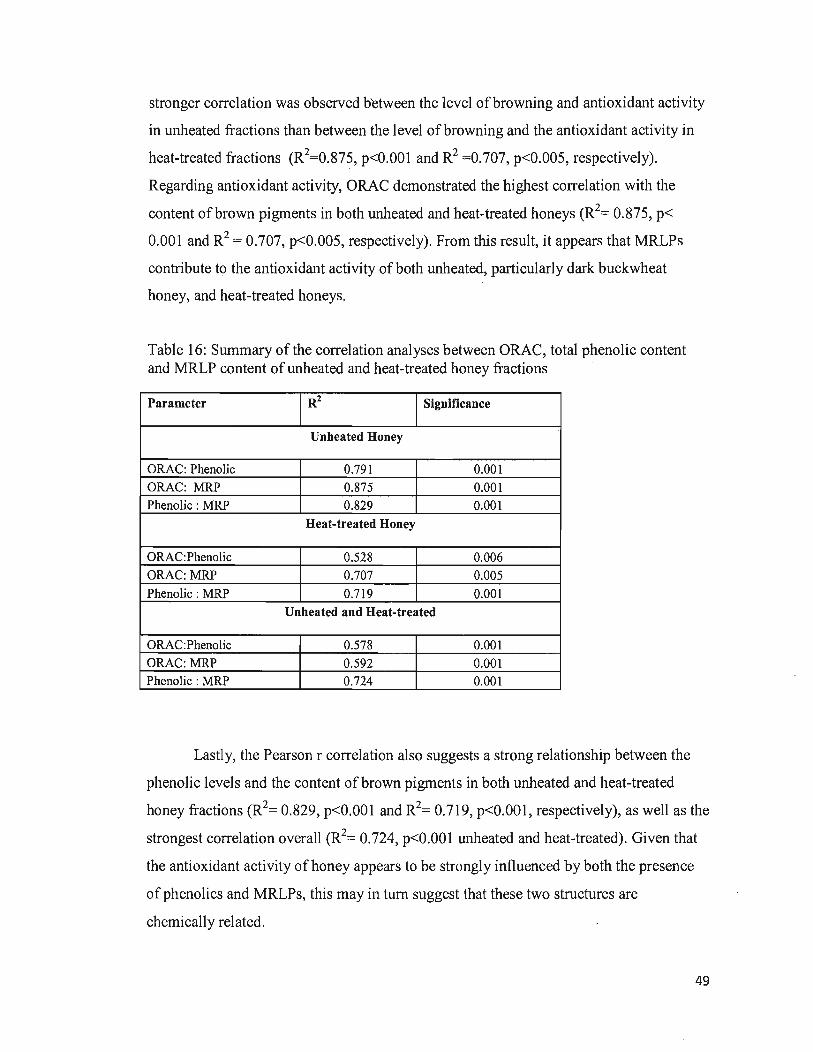
stronger correlation was observed between the level of browning and antioxidant activity
in unheated fractions than between the level of browning and the antioxidant activity in
heat-treated fractions (R2=0.875, p<O.OOl and R2 =0.707, p<0.005, respectively).
Regarding antioxidant activity, ORAC demonstrated the highest correlation with the
content of brown pigments in both unheated and heat-treated honeys (R2= 0.875, p<
0.001 and R2 = 0.707, p<0.005, respectively). From this result, it appears that MRLPs
contribute to the antioxidant activity of both unheated, particularly dark buckwheat
honey, and heat-treated honeys.
Table 16: Summary of the correlation analyses between ORAC, total phenolic content and MRLP content of unheated and heat-treated honey fractions
Parameter R2 Significance
Unheated Honey
ORAC: Phenolic 0.791 0.001
ORAC: MRP 0.875 0.001
Phenolic: MRP 0.829 0.001
Heat-treated Honey
ORAC:Phenolic 0.528 0.006
ORAC:MRP 0.707 0.005
Phenolic: MRP 0.719 0.001
Unheated and Heat-treated
ORAC:Phenolic 0.578 0.001
ORAC:MRP 0.592 0.001
Phenolic: MRP 0.724 0.001
Lastly, the Pearson r correlation also suggests a strong relationship between the
phenolic levels and the content of brown pigments in both unheated and heat-treated
honey fractions (R2= 0.829, p<O.OOI and R2= 0.719, p<O.OOl, respectively), as well as the
strongest correlation overall (R2= 0.724, p<O.OOl unheated and heat-treated). Given that
the antioxidant activity of honey appears to be strongly influenced by both the presence
of phenolics and MRLPs, this may in tum suggest that these two structures are
chemically related.
49

In order to support the fonnation of melanoidins in unheated dark buckwheat
honey and in all thennally treated honeys, the HMW brown coloured fractions, which
were demonstrated to contain phenolics and exhibit antioxidant activity, were tested for
protein content. Given the high molecular weight of these fractions obtained from SEC, it
is possible that they contain protein, as the size of protein in honey is in the range of 13 to
94 kDa (Iglesias et aI., 2006).
3.4.4 Protein in active fractions of unheated and heat-treated honey
Enzymes, protein and amino acids are known to be present in honey. In fact, the
identification of honey proteins is currently being looked into as an authenticity marker
for a physiologically active food (Mohammed, & Babiker, 2009). As the current results
suggest that MRLPs are present in the coloured active fractions of unheated (dark honey)
and heat-treated honeys, and given the high molecular weight of components in these
fractions, to support the presence of melanoidins, it is important to prove that proteins are
present in these fractions as MRP fonnation requires them.
Considering that the size of proteins in honey are in the range of 13 to 94 kDa
(Iglesias et aI., 2006) and therefore can be easily visualized using gel electrophoresis,
one-dimensional 10 % SDS-P AGE was employed in this study. Prior to subjecting the
fractions that eluted in the major peak to SDS-PAGE, the protein in the selected fractions
were precipitated by 80% ethanol precipitation. For estimation of protein molecular
weight, a molecular weight calibration curve was used (refer to Appendix A, Figure A-4).
The protein profiles that were obtained from SDS-PAGE are shown in Figures 11-
13. Differences in the number of protein bands were revealed between the unheated
honeys of different floral origin. Two prominent bands corresponding to apparent
molecular weights of 56-60 kDa and 82 kDa were detected for all three honeys, while
50
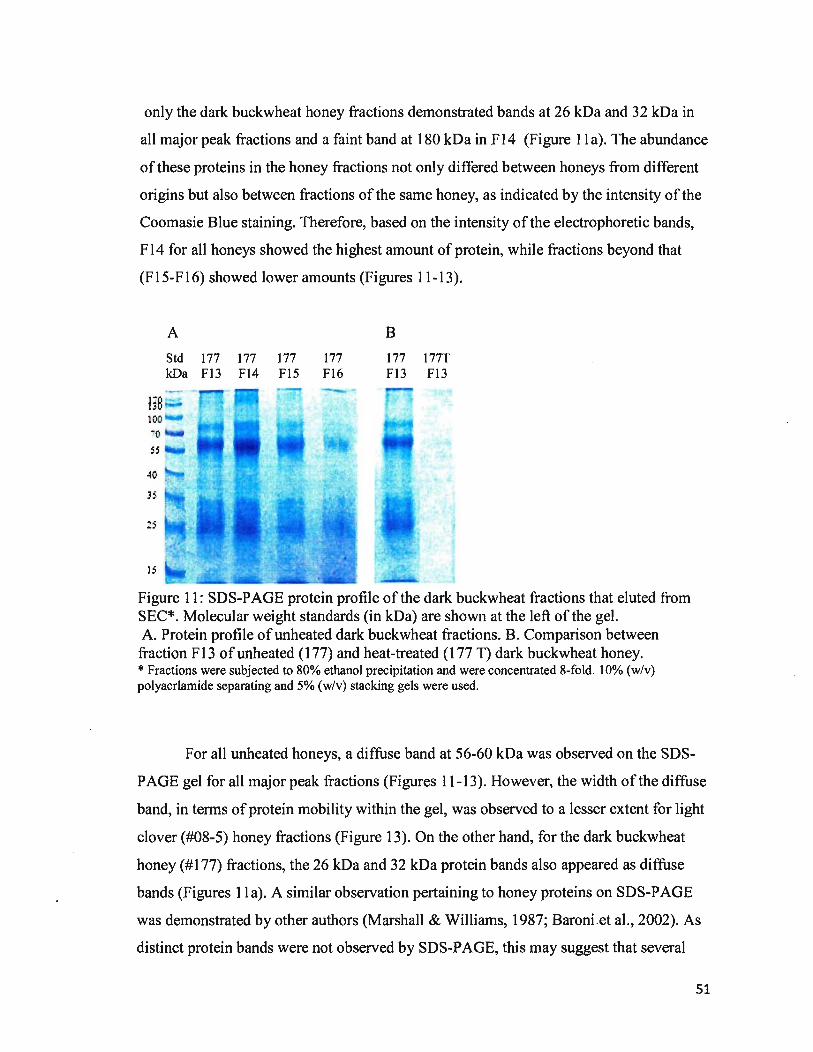
only the dark buckwheat honey fractions demonstrated bands at 26 kDa and 32 kDa in
all major peak fractions and a faint band at 180 kDa in F14 (Figure 11 a). The abundance
of these proteins in the honey fractions not only differed between honeys from different
origins but also between fractions of the same honey, as indicated by the intensity of the
Coomasie Blue staining. Therefore, based on the intensity of the electrophoretic bands,
F14 for all honeys showed the highest amount of protein, while fractions beyond that
(FI5-FI6) showed lower amounts (Figures 11-13).
100 ~O
55
40
3~
25
15
A
Std 177 177 177 177 kDa Fl3 F14 FI5 F16
B
177 177T Fl3 F13
j
Figure 11: SDS-PAGE protein profile of the dark buckwheat fractions that eluted from SEC*. Molecular weight standards (in kDa) are shown at the left of the gel. A. Protein profile of unheated dark buckwheat fractions. B. Comparison between
fraction F13 of unheated (177) and heat-treated (177 T) dark buckwheat honey. * Fractions were subjected to 80% ethanol precipitation and were concentrated 8-fold. 10% (w/v) polyacrJamide separating and 5% (w/v) stacking gels were used.
For all unheated honeys, a diffuse band at 56-60 kDa was observed on the SDS
PAGE gel for all major peak fractions (Figures 11-13). However, the width of the diffuse
band, in terms of protein mobility within the gel, was observed to a lesser extent for light
clover (#08-5) honey fractions (Figure 13). On the other hand, for the dark buckwheat
honey (#177) fractions, the 26 kDa and 32 kDa protein bands also appeared as diffuse
bands (Figures 11 a). A similar observation pertaining to honey proteins on SDS-P AGE
was demonstrated by other authors (Marshall & Williams, 1987; Baroni .et aI., 2002). As
distinct protein bands were not observed by SDS-P AGE, this may suggest that several
51
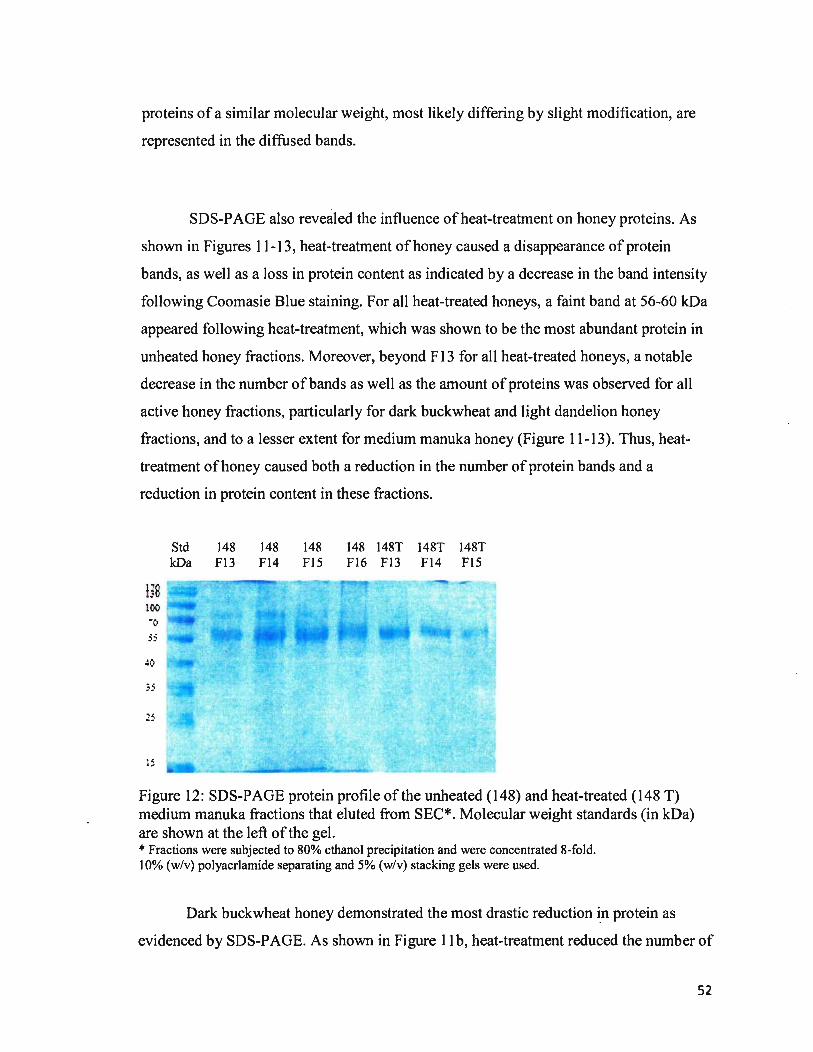
proteins of a similar molecular weight, most likely differing by slight modification, are
represented in the diffused bands.
SDS-PAGE also revealed the influence of heat-treatment on honey proteins. As
shown in Figures 11-13, heat-treatment of honey caused a disappearance of protein
bands, as well as a loss in protein content as indicated by a decrease in the band intensity
following Coomasie Blue staining. For all heat-treated honeys, a faint band at 56-60 kDa
appeared following heat-treatment, which was shown to be the most abundant protein in
unheated honey fractions. Moreover, beyond F13 for all heat-treated honeys, a notable
decrease in the number of bands as well as the amount of proteins was observed for all
active honey fractions, particularly for dark buckwheat and light dandelion honey
fractions, and to a lesser extent for medium manuka honey (Figure 11-13). Thus, heat
treatment of honey caused both a reduction in the number of protein bands and a
reduction in protein content in these fractions.
HB 100
70 S5
40
35
2S
IS
Std 148 148 148 148 148T 148T 148T kDa F13 F14 F15 F16 F13 F14 F15
Figure 12: SDS-PAGE protein profile of the unheated (148) and heat-treated (148 T) medium manuka fractions that eluted from SEC*. Molecular weight standards (in kDa) are shown at the left ofthe gel. * Fractions were subjected to 80% ethanol precipitation and were concentrated 8-fold. 10% (w/v) polyacrlamide separating and 5% (w/v) stacking gels were used.
Dark buckwheat honey demonstrated the most drastic reduction ~n protein as
evidenced by SDS-P AGE. As shown in Figure 11 b, heat-treatment reduced the number of
52
I
i

protein bands from four to one in FI3 and resulted in the complete disappearance of
protein bands in fractions F14-FI6. Thus, honey proteins, specifically those in dark
buckwheat honey, appear to be vulnerable to heat-treatment, as heat-treatment resulted in
the reduction in protein content as well as the disappearance of protein bands.
Std 08-5 08-5 08-5 08-5T 08-5T 08-5T kDa FI3 F14 F15 FI3 F14 F15
H8 100 70 SS
40
" ~ ~
25
IS
Figure 13: SDS-PAGE protein profile ofthe unheated (08-5) and heat-treated (08-5 T) light clover fractions that eluted from SEC*. Molecular weight standards (in kDa) are shown at the left of the gel. * Fractions were subjected to 80% ethanol precipitation and were concentrated 8-fold. 10% (w/v) polyacrlamide separating and 5% (w/v) stacking gels were used.
The disappearance of protein bands from the SDS-PAGE gel following heat
treatment, particularly for dark buckwheat honey fractions, was an interesting observation
that was made. Given that our hypothesis is correct, that heat-treatment caused an
increase in polymerization to give rise to higher molecular weight complexes/polymers,
such as melanoidins, the loss of protein in these fractions after heat-treatment may
support this phenomenon.
As phenolic acids were.also detected in these HMW coloured fractions, it is
possible that these compounds may interact with proteins to fonn phenolic-protein
complexes, which may be able to explain the diffused bands observed on the gel for
unheated honey fractions. Due to this observation, it was of interest to irivestigate
whether phenolic acids are able to fonn complexes with proteins in unheated honey, and
53

whether their involvement is responsible for the formation of high molecular weight
complexes after heat-treatment.
In an attempt to resolve the diffused bands observed by SOS-PAGE for unheated
honey and to explain the disappearance of bands observed for heat-treated honey
fractions, a mixture of three alcohols (24% ethanol: 21 % isopropanol: 24% methanol)
was employed as the solvent extraction method to remove phenolic compounds from the
fractions of dark buckwheat honey before (F13) and after heat-treatment (F12-FI4).
Following solvent extraction, electrophoresis on a 10% (w/v) polyacrlamide separating
and 5% (w/v) stacking gel was run for one hour at a constant current of 110 Volts.
Std 177 177T 177T 177T kDa F13 F12 F13 F14
HB 100
70
5S
40
25
Figure 14: Protein profile of the unheated (177) and heat-treated (177 T) fractions of buckwheat honey following phenolic extraction using a mixture of three alcohols (24% ethanol: 21 % isopropanol: 24%methanol). Molecular weight standards (in kOa) are shown at the left of the gel. *Fractions were concentrated 8-fold. 10% (w/v) polyacrlamide separating and 5% (w/v) stacking gels were used.
The SOS-P AGE results that were obtained following the solvent extraction using
a mixture of three alcohols (ethanol, isopropanol and methanol) are shown in Figure 14.
For unheated dark buckwheat honey, the results demonstrated an intense coloured protein
54

band at 56-60 kDa, and three distinct, but faint bands at 26 kDa, 32 kDa and 82 kDa in
fraction F13 (Figure 14). In contrast, heat-treatment of dark buckwheat honey showed the
complete absence of protein bands in fractions F12-F14 on the separating gel, however,
the presence of a clearly visible band between the stacking and resolving gel was
observed.
From these results, it appears that the removal of some phenolics using a three
alcohol extraction lessened the extent of band diffusion in unheated honey F13. On the
other hand, despite the removal of some phenolics, this method does not appear to be able
to separate the proteins from the HMW protein polymer stuck between the stacking and
resolving gel. It appears that protein-phenolic complexation occurred in unheated honeys
resulting in the formation of soluble complexes which appeared as diffused bands on the
SDS-PAGE gel. In addition, following heat-treatment, the formation of a protein polymer
that stuck between the stacking and resolving gel suggests a potentially less soluble
complex of HMW.
3.4.5 Sugars, amino sugars and honey specific flavonoids by LC/MS in active
fraction 15 of dark buckwheat honey (#177)
To suggest that melanoidins are one of the main factors that contribute to the
antioxidant activity of honey, it is important to demonstrate that all of the components
that are required for MRP formation are present in the active honey fractions. Fraction 15
of the unheated dark honey was selected for LC-ESI-MS as it showed high antioxidant
activity, high amounts of phenolic content and the presence of protein.
The total ion current (TIC) chromatogram for active fraction 15 was obtained
using an elution gradient involving formic acid and methanol, and was measured at
55

254mn, as many phenolics and flavonoids show their UV absorption maxima at this
wavelength. The chromatogram that was obtained is shown in Figure 15.
"tens . ,-----~--------~------~""""K8::7"1 1=04=09a--:-.d :-=TIC::-.A=U MS=-::". Smoo----::-th....,.ed7.""(1.::'731 .'7-:1.GA:-:-;,) x108
0.8 A B C
0.6
Figure 15: Total ion current chromatogram (UV, 254mn) of active fraction 15 obtained from dark buckwheat honey #177.
The TIC chromatogram shown in Figure 15 indicates the presence of several
groups of components a) the hydrophilic compounds that eluted under the two minute
interval as represented by an intense peak, b) the hydrophilic/hydrophobic compounds
that eluted between 8-12 minutes, and c) the hydrophobic compounds which eluted from
12-20 minutes and are represented by a cluster of peaks. The presence of both highly
hydrophilic and hydrophobic compounds in this active fraction indicates a diverse set of
compounds that may take part in the formation of high molecular weight complexes.
56

ntens , .,-------------------------:-::Ms:-:, 0"-:-,5m-:-'n7.":'#40::-:, B:-ac~kgr-ou--:-nd-=-Su:-:-btra--:-cte--:1d xl06
T -162
-162
-162 +---------'~--I 38;
179 503
549
705
100 200 300 400 500 600 700 rrlz
Figure 16: ESI-MS in negative ion mode of the hydrophilic peak (Rt= 0.5min) of active fraction 15 of # 177.
Figure 16 shows a mass spectrum obtained by electrospray ionization in negative
mode of the hydrophilic peak that eluted at 0.5 minutes as indicated in the chromatogram
(Figure 15). The ESI-MS obtained for the hydrophilic peak showed ion peaks that
indicated three consecutive losses of 162 amu from the ion at m1z 665 [M-162-l62-162].
The loss of 162 amu is typically observed for anhydrous hexose moieties. As three
consecutive losses of 162 amu were observed, this demonstrates the degree of
polymerization (DP) ofhexoses starting from DP2 (m1z 341) up to DP4 (m1z 665)
(Figure 16). Further DP were not observed due to the MS scan range of 100 to 750 m/z
used in this study. Therefore, these results suggest the presence of oligomers of hexose
moieties in this active honey fraction, which is significant because oligomers may act as
substrates, either directly or through their degradation, in the formation of Maillard
reaction products.
In addition to the indication that oligomers are present in this active fraction, a
number of fragment ions, specifically m/z 89, 113, 143 and 161 that are characteristic of
the fragmentation pattern of hexoses, have been observed in this mass spectrum (Figure
16). This is an important observation because another important contributor to the
fOlmation of MRPs is the degradation of sugars, specifically glucose. It-is known that the
57

degradation products of glucose can result in the fonnation of highly reactive
dicarbonyls, such as methylglyoxal and glyoxal that are able to further react with both
each other and other components to create MRPs. These reactive dicarbonyls,
methyl glyoxal and glyoxal have been previously identified in Manuka honey as the
principle antibacterial components (Mavric et al., 2008; Adams et al., 2009). As the
degradation products of hexose moieties fonn highly reactive dicarbonyls, the indication
of hexose moieties in this active fraction provides further support of the appropriate
conditions for the Maillard reaction to take place.
Moreover, numerous fragment ions that are characteristic of trisaccharides have
also been observed in this mass spectrum (Figure 16). It is known that honey contains
mostly monosaccharides, specifically glucose and fructose, however, a number of
oligo saccharides including maltotriose and melezitose have previously been identified in
honey (Arias et al., 2003). As a result, the presence of the fragmentation pattern typical of
trisaccharides as demonstrated by Verardo et al., (2009), adds additional support to the
required conditions for Maillard reaction. It is possible that the degradation products of
the trisaccharides may provide additional means for the Maillard reaction to take place.
In addition to sugars, honey contains a very diverse set of components including
numerous flavonoids and phenolic acids and their glycosides. Figure 17 shows a mass
spectrum obtained by electrospray ionization in negative mode of a hydrophilic/
hydrophobic peak that eluted at 10.7 minutes as indicated in the TIC chromatogram
(Figure 15). The ESI-MS obtained for the peak at 10.7 minutes showed a fragmentation
pattern involving the ions at mlz 387 and mlz 255 (M-132). The loss of 132 amu
indicates the loss of a pentose moiety. Based on the retention time of a commonly found
t1avonoid in honey, pinocembrin, it appears that pinocembrin glycosides are present in
this fraction. As components other than sugars are also present in this active fraction, this
adds to the variety of components that may take part in the fonnation of polymers.
A version of this chapter has been submitted for publication. Brudzynski & Miotto (2010). Food Chemistry. (Under review). 58

·MS, 1 O.7min #905, Background Subtracted Intens xl05
255 2.5
2.0
1.5 .- -132
387
1.0
311
0.5
0.0 ,.l~r.3
514 173 2f.7 l,:,f~ 315 421 445 4r,8 1.
100 200 300 400 500 600 700 mlz
Figure 17: ESI-MS in negative ion mode of a hydrophiliclhydrophobic peak obtained for (Rt = 10.7min) active fraction 15 of#I77.
LC-ESI-MS analysis provided information about a number of components that
potentially have the ability to take part in the Maillard reaction. The results demonstrated
the presence of oligosaccharides as well as their degradation products, and the presence
of flavonoid glycosides. Ultimately, these components may contribute to the formation of
HMW polymers that exhibit antioxidant activity.
Discussion:
There is a growing public interest on the effects of natural antioxidant
components in food products. Honey has the potential to serve as a dietary antioxidant
because it has demonstrated antioxidant activities comparable to that of many fruits and
vegetables, in terms of its ORAC value (Gheldof & Engeseth, 2002). Numerous
antioxidants have been identified in honey, mainly the polyphenols (flavonoids and
phenolic acids), but also other minor constituents, such as vitamins C and E, enzymes
(peroxidase, glucose oxidase, catalase), carotenoids and products of the Maillard reaction
(Gheldof et aI., 2002; Aljadi & Kamaruddin, 2004). Despite the identification of these
antioxidant components, the individual components could not account for the total
antioxidant activity of honey. It has been suggested that several antioxidants in honey
may act synergistically to account for the observed activity (Gheldof et aI., 2002).
59

The purpose of the present study was to elucidate the main chemical components
involved in the antioxidant activity of honey and to establish their relationship with each
other. In order to gain an understanding of the factors that influence the antioxidant
activity of honey, a large study involving 22 honey samples from various floral sources
were chosen and characterized based on sugar concentration, honey colour, phenolic
content, browning index and antioxidant activity.
4.1 Identification of compounds with antioxidant activity and analysis of
their relationship with each other
A set of 22 honeys were first characterized based on their total sugar
concentration and colour. In the beekeeping industry, these two parameters are generally
used to distinguish between honeys of floral versus honeydew origin, and to categorize
honeys into groups based on colour for marketing purposes. The honey samples were
subjected to testing for sugar concentration by using the Brix method, which is based on a
refractometric measurement. By detennining the Brix values, it was demonstrated that the
honeys selected for this study contained between 75.52 and 79.24°Brix. These values
were in agreement with those published in several recent reports that showed values
ranging between 76.2 and 82.2°Brix (Silva et aI., 2009; Saxena et aI., 2010).
According to the National Honey Board and the Canadian Honey Council, honeys
are typically classified into five colour categories: white/colourless, light yellow, dark
yellow/light amber, medium amber, and brown to dark brown based on their visually
perceived colour measured using the Pfund scale. However, as the Pfund scale gives
imprecise and approximate colour values, in the present study, the colour of honey was
established spectrophotometrically by determining the net absorbance (As6o-A72onm)
according to the method originally described by Huidobro and Simal (Perezet aI., 2007).
60

The honey samples that were used in this study showed a broad variety of colours
established by measuring the net absorbance (A56o-Anonm) and ranging from a net
absorbance value of 0.038 AU for the lightest coloured honey (#08-7) up to 1.16 AU for
the darkest coloured honey (#77). The relationship between the spectrophotometric
measurements and the visually perceived honey colour is illustrated in Table 3. Based on
these measurements, the honeys were divided into three groups: light coloured honeys
with net absorbance values ranging from 0.038 to 0.12 AU, medium coloured honeys
with net absorbance values ranging from 0.12 to 0.5 AU, and dark coloured honeys with
net absorbance values ranging from 0.5 to 1.16 AU.
The colour of honey emerged as an important factor that influences the functional
properties of honey, specifically the antioxidant activity (Gheldof & Engeseth, 2002;
Blasa et aI., 2006). Previous studies have demonstrated that honeys from different floral
sources display similar phenolic profiles, however, differ in their richness of individual
phenolic compounds (Gheldof, et aI., 2002; Baltrusaityte et aI., 2007). Darker coloured
honeys, in general, contained higher concentrations of phenolics and exhibited higher
antioxidant activities (Frankel et aI., 1998; Gheldof & Engeseth, 2002).
To analyze the complex relationship between floral origin, content of individual
phenolic acids and antioxidant activity, it was necessary to determine the total level of
phenolics in the set involving 22 honeys. This was done by using the Folin-Ciocalteu
method. As the Folin-Ciocalteu method is commonly used to estimate the level of
phenolics, this method was employed in the present study so that the results could be
easily related to the data obtained by other authors. The total phenolic content ranged
from 49.78 to 5l3.25 llg GAE/g between the lightest (#08-7) and darkest honeys (#77).
The darker coloured honeys, mainly those of buckwheat origin, consistently contained the
highest level of phenolic content. Similar levels of phenolics were demonstrated in
honeys differing in colour and floral source by several authors with values ranging from
61

46 to 796 mg GAElkg between the lightest and darkest honeys, with buckwheat honeys
belonging to the group containing the higher level of phenolics (from 456 to 796 mg
GAElkg) (Gheldof & Engeseth, 2002; Beretta et aI., 2005).
In addition to phenolics, Maillard reaction products also contribute to the colour
and antioxidant activity of many food products such as coffee (Gniechwitz et aI., 2008b).
Maillard reaction products, specifically melanoidins, result from non-enzymatic
browning and contribute to the darkening of colour in food products. The appearance of
these brown pigments has been demonstrated to coincide with an increase in the
antioxidant activity, thus indicating a relationship between these two parameters
(Manzocco et aI., 2001). The role of Maillard reaction products on the antioxidant
activity of honey has not yet been investigated. Honey appeared to be an ideal natural
system to study the formation of Maillard reaction products, specifically melanoidins, due
to the high concentration of reducing sugars, glucose and fructose, and the presence of
lower amounts of free amino acids and proteins, conditions that are generally agreed
upon to promote the rate of Maillard browning (O'Brien and Morrissey, 1989). Given
that the required substrates for Maillard reaction to occur are present, it appeared that
MRPs may in turn contribute to both the colour and antioxidant activity of honey.
Determination of the Maillard reaction product levels is typically based on the
degree of browning by measuring the net absorbance at (~50-A720nm) (Martins et aI.,
2003). Due to the fact that the chemical structure and origin of these brown pigments are
largely unknown, in this study the term 'Maillard reaction-like products' (MRLP) was
used to describe compounds that absorbed at A450- A720 nm. The level of brown pigments
varied greatly among the 22 honeys ranging from 0.11 AU for the lightest honey (#08-7)
up to 3.51 AU for the darkest honey (#77). This result provided thefir~t evidence that
MRLPs are present in unheated honey and thus responsible, at least in part, for honey
colour.
62

From these results, it appeared that the level of brown pigments correlated with
the colour of honey and the level of phenolics, where the darker coloured honeys showed
higher levels of brown pigments as well as higher levels of phenolics. Therefore, as the
next step in this study, the relationship between the antioxidant activity and MRLPs, in
the context of honey colour and phenolic content, was investigated.
The 22 honey samples were screened for their antioxidant activity using the
ORAC assay. The ORAC assay was employed in this study because it is a highly
sensitive fluorescence based method that can analyze a large number of samples in a
short period of time, and because it requires small testing volumes, it has the ability to
minimize cross-reactions between samples and reagents. Moreover, the ORAC assay
demonstrated superiority to other methods because it takes a free radical reaction to
completion and can utilize different free radical generators or oxidants in the reaction
mixture to test a different set of parameters (Cao et aI., 1997).
All honeys tested in the present study were demonstrated to possess antioxidant
activity. As indicated by the ORAC values, the dark honeys demonstrated the greatest
antioxidant activities and the light honeys demonstrated significantly lower antioxidant
levels (from 1.99 /lmol TE/g up to 19.77 /lmol TE/g for the lightest and darkest coloured
honeys, respectively). The ORAC values were consistently higher for honeys of
buckwheat origin (12.75,17.41, 19.13 and 19.77 /lmol TE/g). These results are in
agreement with those of other authors who obtained ORAC values ranging from 2.00 to
21.07 /lmol TE/g between the lightest and darkest coloured honeys, and from 7.47 to
16.95 /lmol TE/g for honeys of buckwheat origin (Gheldof & Engeseth, 2002; Beretta et
aI., 2005).
63
I ' !
I

In order to detennine the influence of each parameter (honey colour, phenolics,
MRLPs) on the antioxidant activity of honey, a principle component analysis was
employed. The principle component analysis revealed that all four variables showed a
strong correlation with one another. The correlation values between honey colour and
MRLPs, total phenolic content and honey colour, MRLPs and total phenolics, and ORAC
and MRLPs were 0.980, 0.963, 0.950 and 0.938, respectively. These results represent the
first evidence of a significant contribution ofMRLPs to the colour and overall antioxidant
activity of unheated honey.
The overall extremely significant correlation between the four parameters (honey
colour, phenolic content, MRLPs and ORAC) supported our view that compounds which
represent specific groups/parameters may be chemically related and/or represent a
chemical entity that involves the incorporation of components into a higher molecular
weight complex. Such an example would be the integration of polyphenols into the
melanoidin/MRP complex. However, at this point in our study, no such suggestion could
be made as the molecular size and chemical properties of the so-called MRLPs was not
known.
4.1.2 Melanoidins in heat-treated honey
It is generally assumed that the Maillard reaction requires heat in order to occur.
The effects of thennal treatment on the fonnation of melanoidins in a number of foods
have been extensively studied; such an example is coffee (Bekedam et a1., 2006;
Gniechwitz et al., 2008b). As the current results suggest the presence ofMRLPs in
unheated honey, it was important to show that the Maillard reaction can be accelerated
during heat-treatment to provide evidence for the origin of melanoid in fonnation in
unheated honey. To the best of our knowledge, no infonnation on the presence of
melanoidins in heat-treated honey exists. Recently, Turkmen et al. (2006) showed that
heating honey at 50-70'C resulted in the formation of brown MRP pigments which
64

correlated with an increase in antioxidant activity. Despite this observation, no
infonnation regarding the structure of the brown antioxidant pigments in heated honeys
were described.
The initial observation made following heat-treatment of honey at 121°C for 30
minutes was the change in colour. It was demonstrated that heat-treatment resulted in
visually darker coloured honeys. The darkening of honey was anticipated to be due, at
least in part to, nonenzymatic browning, as was previously demonstrated by Turkmen et
aI., (2006). To provide evidence that the darkening of honey was related to the Maillard
reaction, the level of brown pigments was detennined by measuring the net absorbance at
~50-A720nm. The results obtained for the heat-treated light and medium honeys revealed
an overall increase in the level of brown pigments following heat-treatment (from 0.54 to
1.36 AU and 1.41 to 2.08 AU for the light and medium honeys, respectively). Unlike the
results obtained for the light and medium honeys, heat-treatment of the dark honey
resulted in an unexpected overall decrease in the level of browning (from 2.18 to 1.78
AU) which coincided with the fonnation of an insoluble brown precipitate. It is possible
that thennal treatment in the case of the dark honey, which was enriched in MRLPs, may
have promoted the fonnation of high molecular weight polymers which ultimately
became insoluble and precipitated out of solution, thus reducing the overall content of
brown pigments.
As phenolics can undergo chemical changes upon thennal treatment, and since
they contribute to both the colour and antioxidant activity of honey, it was of interest to
detennine the influence of heat-treatment on the level of phenolics. It was demonstrated
that heat-treatment resulted in an overall increase in phenolic content for all honeys (from
131 to 239 ~g GAE/ml, 272 to 484 ~g GAE/ml, and 317 to 644 ~g GAE/ml, for the light,
medium and dark honeys, respectively). Despite the overall decrease in the level of
brown pigments for the dark honey, heat-treatment resulted in an increase in the level of
65

phenolics. As honey contains a certain amount and type of components, the observed
overall higher level of phenolics after treat-treatment suggests that heat-treatment altered
the chemical properties of honey.
To further investigate whether heat-treatment accelerated the formation of
melanoidins in honey, the antioxidant activity of the honeys was determined. As heat
treatment is known to promote the Maillard reaction, and since melanoidins typically
exhibit antioxidant activity, it was anticipated that the heat-treated honeys would
demonstrate higher antioxidant activities than the control. From the ORAC values, it was
revealed that heat-treatment resulted in an overall increase in antioxidant activity for all
honeys. Again, despite the decrease in brown pigment levels for the heat-treated dark
honey, an increase in antioxidant activity was still observed. The results obtained for the
light and medium honeys in this study are in agreement with those observed by Turkmen
et aI., (2006) who demonstrated a correlation between the antioxidant activity and the
increase in brown pigment formation following heat-treatment. For the dark honey, it is
possible that in addition to the formation of new brown coloured products that exhibited
antioxidant activity, heat-treatment may have also resulted in the formation of insoluble
complexes that precipitated out of the honey solution and caused a decrease in the overall
level of brown pigments.
These results demonstrated that heat-treatment of honey resulted in an overall
increase in the level of phenolics and antioxidant activity for all heat-treated honeys
tested, as well as an overall increase in the degree of browning for the light and medium
honeys. The exception was the dark honey which showed an overall decrease in the
degree of browning and the formation of insoluble complexes. Thus far, the
characteristics that were demonstrated following the heat-treatment of honey satisfy the
description of melanoidins.
66

To further investigate the properties of honey melanoidins, and to determine
whether the MRLPs in unheated dark honey belong to the melanoidin class of
compounds, it was necessary to estimate the approximate molecular size of the
components responsible for the antioxidant activity in heat-treated honey and relate their
chemical properties to the antioxidant components in unheated honey.
4.1.3 Isolation and characterization of honey melanoidins
Melanoidins are defined as carbohydrate-based, high molecular weight brown
macromolecules that are formed in the advanced stages of the Maillard reaction (Borrelli
et aI., 2002a). Melanoidins are usually characterized based on the following criteria:
molecular size, degree of browning and antioxidant activity. Based on this description,
the identification of high molecular weight brown coloured polymers would provide the
first piece of evidence suggesting the presence of melanoidins in unheated honey.
However, in order to suggest that the MRLPs that are formed in unheated honey are
melanoidins and thus contribute to the antioxidant activity, it would be required to
demonstrate that the MRLPs in unheated honey are similar in their chemical nature to the
melanoidins formed in heat-treated honey.
To isolate the melanoidins in honey, size-exclusion chromatography using a
Sepharose 4B column was employed in combination with activity-guided fractionation.
Three honeys that differed in their initial colour as well as floral source were selected for
this experiment: light honey (dandelion), medium honey (manuka), and dark honey
(buckwheat). The honeys were heat-treated and the components from both unheated and
heat-treated honeys were fractionated separately by using SEC, and all fractions obtained
from SEC were analyzed for antioxidant activity using the ORAC assay. The properties
of the components in the identified active fractions obtained for both unheated and heat
treated honeys were compared by analyzing the molecular size of the active components
67
, ., , ,
and the level of browning. In addition, as an overall increase in phenolic content was
observed for whole honey following heat-treatment, the total phenolic content was also
detennined for the active fractions.
4.1.4 Antioxidant activity and molecular weight of the active components in
unheated and heat-treated honey
The use of SEC in combination with activity-guided fractionation allowed the
initial characterization of honeys antioxidant components. By subjecting the honeys to
SEC, several fractions possessing antioxidant activity were identified. For all honeys, the
antioxidant activity was observed in fractions that eluted between F13 and F15. The
active fractions of the dark honey exhibited the highest ORAC values (1125 to 2979
Ilmol TElL), while the lighter coloured honeys demonstrated much lower ORAC values
(363 to 437 Ilmol TElL and 967 to 14791lmol TElL for the light and medium honeys,
respectively).
Heat-treatment resulted in a significant increase in the antioxidant activity in
several of these fractions. It was demonstrated that heat-treatment resulted in moderately
higher ORAC values in F13 (363 to 814 umol TEl L) and F14 (437 to 683 umol TEl L)
for the light coloured honey, and significantly higher ORAC values in F14 (1479 to 4710
umol TEl L) and F15 (1287 to 2345 umol TEl L) for the medium coloured honey. The
change in ORAC values of the active fractions belonging to the unheated and heat-treated
medium and light honeys was demonstrated to be highly significant (ANOVA, F [7, 20]
= 81.14, p<O.OOOl and F [5, 13] = 19.72, p<O.OOOI, for the medium and light coloured
honeys, respectively).
68
In contrast, heat-treated dark honey was the exception. For the dark honey,
fractions F12 and F13 demonstrated a significant increase in ORAC value following heat
treatment (from no observed activity to 1258 Ilmol TEl Land 1547 to 3730 umol TEl L
for fractions F12 and F13, respectively) (Tukey-Kramer multiple comparison test,
p<O.OOI). On the other hand, FI5 and F16 demonstrated a significant decrease in
antioxidant activity following heat-treatment (from 2742 to 1073 umol TEl Land 1125 to
102 umol TEl L for fractions F15 and F16, respectively). Thus, heat-treatment altered the
chemical properties of the antioxidant components.
Determination of the molecular weight distribution revealed that the antioxidant
components were of much higher molecular weight than anticipated, ranging from
approximately 66 to 232 kDa. Even more surprising was the observation that the active
components following heat-treatment of honey were of similar molecular weight (66 to
298 kDa). As a result, SEC provided the first indication that the heat produced
antioxidants are of a similar molecular weight to the antioxidant compounds in unheated
honey, thus suggesting that the MRLPs in unheated dark honey may belong to the
melanoidin group of compounds.
4.1.5 Degree of browning and colour change in heat-treated honeys
By comparison of the heat-treated fractions to the unheated control, the first
evidence of a change in honeys properties to account for the observed change in
antioxidant activity of the fractions was demonstrated. It was revealed that heat-treatment
resulted in a change in the colour of the active fractions towards darker hues as well as an
increase in the level of brown pigments (~50-A720nm), presumably due to non-enzymatic
browning.
69

Fractionation of the heat-treated light and medium coloured honeys revealed
brown coloured fractions in the major peak that eluted between F 13 and F 16 which were
colorless in unheated honey. The darkening of colour of the active fractions appeared to
correlate with the increase in the level of brown pigments as measured at A 450-720 nm. As
a result, this observation implied that heat-treatment of these honeys led to the
accelerated generation of brown HMW melanoidins.
On the other hand, heat-treatment of the dark honey, which already showed brown
coloured fractions, resulted in more intense brown coloured fractions in the major peak as
well as a loss of the very high molecular weight brown pigments that eluted in the void
volume of the column. Despite the darkening of colour of the active fractions for the dark
honey, the level of brown pigments (A 450-A720 nm) did not appear to follow the trend.
An increase in the level of brown pigments was only observed in the brown coloured
fractions of higher molecular weight (F13-F14) and virtually no change in the level of
brown pigments in the coloured fractions oflower molecular weight (F15-F16). In the
latter, a change in the level of browning was not observed despite the darkening of colour
of these fractions.
As a result of this observation, it is possible to conclude that brown pigments are
not only chromophores that contribute to the colour of honey. Heat-treatment stimulated
the generation of new chromophores of HMW which was associated with an increase in
absorbance in the UV range at 280 run. Moreover, these new chromophores, specifically
in the light and medium heat-treated honeys, were demonstrated to exhibit antioxidant
properties. Thus, it appeared that heat-treatment accelerated the formation ofHMW
melanoidin antioxidants in the light and medium honeys.
Heat-treatment of the dark honey resulted in the loss of the very HMW brown
polymers that eluted in the void volume for the unheated dark honey. It is possible that 70

thennal treatment resulted in the degradation of these very HMW coloured polymers to
yield new HMW brown polymers, which may explain the increase in the level of brown
pigments in F13 and F14. Alternatively, heat-treatment may have also accelerated the
polymerization of the very HMW polymers or the lower molecular components, such as
those eluting in F15 and F16, to result in the formation of very HMW insoluble
components and HMW antioxidant components, respectively. The latter may be able to
provide reasoning for the simultaneous loss of brown pigments in F15 and F16 and the
marked increase in the level of brown pigments in F13 and F14 after heat-treatment.
From this observation, it appeared that the initial composition of honey played a major
role in determining the fate of melanoidins in heat-treated honey. It was suggested that
the dark honey already contained melanoidins, and thus heat-treatment resulted in the
simultaneous formation and degradation of melanoidin compounds.
4.1.6 Browning and antioxidant activity
As melanoidins are known to exhibit antioxidant activity, it was of interest to
evaluate the relationship between these two parameters. Heat-treatment of the light and
medium honeys resulted in an increase in the degree of browning (A450-Anonm) in all
fractions that eluted between F13 to F16 as well as an increase or no change in the
antioxidantlevel. On the other hand, the dark honey showed a significant increase in both
the degree of browning and ORAC in fractions F12 and F13 of high molecular weight,
and a significant decrease in the degree of browning and antioxidant activity in fractions
oflower molecular weight (F15 and F16). For the dark honey, which contained marked
amounts of brown pigment in unheated honey, heat-treatment appeared to have led to the
formation of very high molecular weight insoluble polymers that were excluded (by
centrifugation) prior to SEC chromatography. Ultimately, lower amounts of brown
pigments were observed after heat-treatment for this honey, specifically in F 15 and F 16.
Similarly, the ORAC values were the highest in F12 and F13, but significantly lower in
F15 and F16.
71

The Pearson r correlation revealed a strong relationship between the level of
browning and antioxidant activity in both the unheated and heat-treated fractions of
HMW (R2=0.875, p<O.OOl and R2 =0.707, p<0.005, respectively). These results support
the notion that heat-treatment resulted in the generation of melanoid ins of higher
molecular weight that exhibited antioxidant activity. Therefore, depending on the initial
content of brown pigments in unheated honeys, heat-treatment either generated more
brown pigment antioxidants or led to their loss.
4.1.7 Phenolic content in unheated and heat-treated honey fractions
Data in the literature suggests that polyphenols are an integral part of the
melanoidin complex in foods such as coffee (Bekedam et ai., 2008; Gniechwitz et ai.,
2008b). In the present study, a strong correlation between MRLPs, phenolic content and
antioxidant of whole unheated honeys was established. As such a strong correlation was
demonstrated between these parameters, it was of interest to investigate whether
phenolics are involved in the melanoidin complex in honey.
The antioxidant components in unheated and heat-treated honeys were separated
using SEC and were analyzed for the presence of phenolics. As SEC separates
components on a molecular weight basis, the presence of phenolics in the active fractions
of HMW might suggest their incorporation, either by covalent or non-covalent
interactions, into the melanoidin structure.
For the active fractions of unheated honey, the concentration of phenolics varied
greatly depending on the floral source, where the dark buckwheat honey demonstrated the
greatest level of phenolics in F 14 (135 ~g GAE/ml). While the active major peak
tractions of unheated dark honey contained the highest level of phenolics, the light and
72
.j
medium honeys contained 29% and 54% of the total phenolics present in the major peak
for the dark honey. Indeed, the darker honeys contained much higher levels of phenolics.
Heat-treatment caused a significant increase in the phenolic content in the active
fractions of the light and medium honeys, and in fractions of higher molecular weight
(FI2-F14) for the dark honey. On the other hand, a slight decrease in phenolic content
was demonstrated in fractions F15 and F16 of heat-treated dark honey. From these
results, the level of phenolics appeared to correlate with the antioxidant activity.
Losses of the natural antioxidants from the dark honey during heat-treatment
could be compensated for, at least in part, by the formation ofMRPs that exhibit
antioxidant activity (Manzocco et aI., 2001; Turkmen et aI., 2006). In this case, the
phenolic antioxidants in some fractions may have taken part in the formation of
melanoidins, as a significant increase in the level of browning, phenolic content and
ORAC was observed in Fl3 of heat-treated dark honey. The presence of phenolics in the
HMW melanoidin fractions isolated from roasted coffee has been demonstrated by
several authors to be due to the incorporation of phenolics, particularly chlorogenic acid,
into the melanoidin structure (Bekedam et aI., 2008; Gniechwitz et aI., 2008b).
Moreover, the thermal processing conditions, such as the time and temperature,
greatly influence the degradation of compounds, such as the reduction! degradation of
ascorbic acid in tomato puree (Anese et aI., 1999) or chlorogenic acid in dark roasted
coffee beans (del Castillo et aI., 2002). Although these studies demonstrated the loss of
some naturally occurring antioxidants, they suggested that the antioxidant activity can be
maintained by the simultaneous formation of Maillard reaction products. Even though the
results are not conclusive, it might be speculated that heat-treatment of honey led to the
increased incorporation of phenolics into the melanoidin structure.
73

Despite the reduction in phenolics for the dark honey in F15 and F16, the Pearson
r correlation revealed a strong correlation between phenolic content and antioxidant
activity in both unheated and heat-treated fractions (R2=0.791, p<O.OOl and R2=0.528,
p<0.006, respectively). However, the stronger relationship between these parameters was
demonstrated for unheated honey fractions. As the Pearson r correlation indicated a loss
of a strong relationship between phenolic content and antioxidant activity after heat
treatment of honey, this suggests that the dark honey lost some phenolic antioxidants due
to heat-treatment.
The Folin-Ciocaleu method that was used in the present study detects all water
soluble phenolic groups in the sample, including structures that consist of a phenolic type
structure, such as MRPs (Sahin et aI., 2009). Therefore, the increase in phenolic content
which correlated with the darkening of honey and antioxidant activity could be explained,
at least partially, by the fonnation of melanoid ins with a phenolic type structure. The
incorporation of phenolic acids, such as chlorogenic acid, into the melanoidin structure
has been previously suggested for roasted coffee (Bekedam et aI., 2008; Gniechwitz et
aI., 2008b) or lipid peroxidation products in tomato melanoidins (Adams et aI., 2005).
Based on the results obtained from SEC, it could be concluded that the phenolic
components are associated with the melanoidin structure and eluted in the same fractions
that possess antioxidant activity. Since honey phenolics exhibit antioxidant properties on
their own, this observation supports their ability to contribute to the observed antioxidant
activity.
4.1.8 Evidence demonstrating the presence of melanoidins in honey
Based on the characteristic change in colour, UV absorbance, brown pigment
fonnation and antioxidant activity following heat-treatment, it was suggested that the heat
produced antioxidants, as well as the antioxidant brown pigments in unheated dark
74

honey, were in fact melanoidins. This study has provided the first evidence suggesting
that melanoidins are present in unheated and heat-treated honey and contribute to the
antioxidant activity. These results were demonstrated to be in agreement with those
demonstrated by other authors who indicated a positive relationship between melanoidin
formation, the degree of browning and antioxidant activity (Borrelli et aI., 2002b;
Manzocco et aI., 2001).
4.1.9 Characterization of the structural components in honey melanoidins
Currently, three theories regarding the melanoidin structure were suggested (1)
polymers made up of repeating units offurans or pyrroles (Tressl et aI., 1998), (2)
carbohydrate-based melanoidin skeletons (Cammerer & Kroh, 1995; Cammerer et aI.,
2002) and (3) protein-based melanoidin skeletons (Hofinann, 1998a).
In order to gain information regarding the main components involved in the honey
melanoidin structure, the SEC fractions from the unheated and heat-treated honeys were
analyzed for the presence of proteins, carbohydrates and phenolics.
4.1.10 Proteins in the melanoidin fractions
To further characterize the components involved in the honey melanoidin
structure, the protein profile of unheated and heat-treated honey fractions were analyzed
by SDS-PAGE. Given the high molecular weight of the active fractions, it was
anticipated that these fractions did contain protein. From the SDS-P AGE gels, it was
demonstrated that all active fractions contained protein, however, differences in the
number of protein bands was revealed between the honeys of different floral origin.
75

An important observation was that the protein bands appeared as fuzzy, diffused
bands on the SDS-PAGE gel. This observation has been demonstrated previously in
honey by other authors (Marshall & Williams, 1987; Baroni et aI., 2002). As a result of
the observation that the protein pellet remained brown in colour following 80% ethanol
precipitation, specifically for the dark honey, and because phenolics were detected in
these fractions by the Folin-Ciocalteu method, it was assumed that phenolic compounds
were, at least in part, responsible for the band diffusion observed by SDS-PAGE. It is
known that some polyphenols are able to form water-soluble complexes with proteins
which appear as fuzzy, diffused bands on both native and SDS-PAGE gels (Kusuda et aI.,
2006).
In comparison to unheated honey fractions, where SDS-P AGE detected proteins
in all major peak fractions, heat-treatment of honey demonstrated a loss in the protein
content for all active honey fractions. The most drastic reduction in protein content was
revealed for the dark honey, which showed that heat-treatment caused the reduction in the
number of protein bands from four to one in fraction F13, and the complete
disappearance of bands in fractions F14 - F16. Similar observations were reported for
roasted coffee, where protein content decreased as a result of roasting and was suggested
to be due to protein breakdown or protein polymerization (Borrelli et aI., 2002b;
Montavan et aI., 2003).
The disappearance of protein bands from the SDS-PAGE gel after heat-treatment
of honey, specifically dark honey, is an interesting phenomenon. It is possible that the
loss in protein content after heat-treatment supports the notion that polymerization to
form high molecular weight polymers/complexes occurred. In addition, as the protein
bands on SDS-PAGE appeared as diffuse bands in both unheated and heat-treated active
honey fractions, this provides additional support for the involvement of phenolics in the
melanoidin structure. With this in mind, and in an attempt to resolve the diffused bands
76

on the SDS-PAGE gels, the fractions from unheated and heat-treated dark honey were
subjected to a solvent extraction involving a mixture of three alcohols to remove
phenolics from the protein pellet.
SDS-P AGE following the solvent extraction revealed two separate scenarios. On
one hand, the mixture of three alcohols was able to remove some of the contaminating
phenolic compounds from the unheated dark honey fraction (F13), as evidenced by the
lessened extent of band diffusion. On the other hand, the solvent extraction method
resulted in the complete absence of bands on the resolving gel for the heat-treated dark
honey fractions (F12-F14), however, it revealed the presence of a well defined high
molecular weight polymer stuck at the top of the resolving gel. From this result, it
appears that the mixture of three alcohols was able to remove some phenolics from the
unheated honey fractions however, protein-phenolic complexation still occurred as
evidenced by the diffused band. For the heat-treated honey fractions, it appears that this
method was unable to sufficiently separate the protein from the high molecular weight
polymer which suggested the presence of a less soluble complex of high molecular
weight.
Therefore, the present results suggest that protein-phenolic complexation occurred
in unheated honey which resulted in the formation of soluble complexes. Moreover, heat
treatment appeared to have resulted in the increased binding of phenolics to proteins as a
HMW polymer was observed by SDS-P AGE and was unable to be disrupted by the
solvent extraction method employed.
4.1.11 Carbohydrates in the melanoidin fractions
As carbohydrates are the most important substrate involved in the formation of
melanoidins, it was of great interest to detect the presence of carbohydrates in the
77

unheated active fractions, specifically for the dark honey, to support the origin of
melanoidins in honey. Carbohydrates can be incorporated into the backbone structure of
melanoidins as an intact sugar or as a sugar degradation product (Tressl et ai. 1998;
Ciimmerer & Kroh, 1995; Cammerer et aI., 2002). To detect the presence of
carbohydrates in the active fractions of unheated dark honey, LC-ESI-MS was employed.
The LC total ion chromatogram belonging to the unheated dark honey fraction
(F15) indicated the presence of three groups of components: hydrophilic,
hydrophilic/hydrophobic and hydrophobic. Upon further analysis of the hydrophilic and
hydrophiliclhydrophobic group of components, LC-ESI-MS revealed that this fraction
contained oligosaccharides and their degradation products, as well as flavonoid
glycosides.
The presence of fragment ions that are characteristic of the fragmentation pattern
ofhexoses and trisaccharides in the mass spectrum was of great significance. The
fragmentation pattern of monosaccharides, disaccharides, trisaccharides and
oligosaccharides have been extensively studied by Verardo et aI., (2009) using LC/ESI
tandem mass spectrometry in negative ion mode where they demonstrated a list of
fragmentation ions for hexoses (m/z 179, 161, 143, 113,89), sucrose (mlz 341,353 179),
maltose (m/z 341, 161), meleziotose (m/z 323, 179) or maltotriose (mlz 341, 161) that
were identical to those observed in the current study. The presence of fragment ions
characteristic ofhexoses and trisaccharides provides support for the origin of melanoid in
formation in honey.
Conclusion:
The novel finding in this study was the evidence that high molecular weight
melanoidins contribute to the antioxidant activity of both unheated and heat-treated
78

honey. The use of SEC and activity-guided fractionation allowed the antioxidant
components of unheated and heat-treated honey to be characterized as being high
molecular weight brown coloured compounds that strongly absorb at both 280nm and
450nm. The simultaneous presence of phenolics, proteins and sugars in the HMW active
fractions of unheated honey suggests that these components represent a chemical entity
that exerts its antioxidant activity synergistically. Due to SEC separating the components
based on molecular size, these results suggest for the first time the involvement of
phenolics, either by covalent or non-covalent interaction with the melanoidin structure, in
the antioxidant activity of honey.
Heat-treatment resulted in darker coloured fractions that contained phenolic levels
which correlated with the observed change in the antioxidant activity. Polyphenols have
been shown to be involved in protein modification and were observed as diffused bands
on the SDS-P AGE gels. Heat-treatment simultaneously resulted in the loss in protein due
to complexation by phenolics and the formation of a HMW polymer which could not
enter the separating SDS gels. The finding that polyphenols and proteins together with
brown pigments eluted in the same high molecular fractions from SEC provides further
support to the notion that proteins participated in the formation of phenolic-protein
carbohydrate polymers. From these results, it appears that heat-treatment promoted the
Maillard reaction and the fonnation of phenolic-protein complexation to generate
melanoidins that involve phenolic chromophores.
The presence of oligosaccharides of various degrees of polymerization, hexose
fragmentation products, as well as the presence of protein in the active unheated fractions
from SEC supports the initial requirements for melanoidin formation. As higher levels of
phenolics were present in the fractions that demonstrated higher antioxidant activities
after heat-treatment, heat-treatment appears to have accelerated the incorporation of
phenolics into the melanoidin skeleton. The fate of melanoidins appears to be dependent
79

on the initial concentration of melanoid ins in honey. Heat-treatment resulted in the
fonnation of melanoidins which correlated with an increase in antioxidant when very low
or no melanoidins were present (light and medium honeys) while heat-treatment of the
dark honey which originally contained melanoidins resulted in the simultaneous
degradation and fonnation of melanoidins.
In summary, these results have indicated for the first time that the initial
concentration of melanoidins is an important factor that detennines the fate of
melanoidins. The first evidence that phenolic acids may be primarily involved in the
fonnation of honey melanoidins has been suggested. As phenolics, proteins and
carbohydrates were simultaneously detected in the brown coloured fractions ofHMW,
this supports the notion that phenolics may exert their antioxidant action by interacting
with melanoidins, rather than acting independently. Although the linkage of the HMW
polymer is not known, it is possible that through either covalent or non-covalent linkages,
these aggregates or complex structures exhibit their antioxidant activity.
80

References Cited:
Adams, A., Borrelli, R.e., Fogliano, V., & De Kimpe, N. (2005). Thermal degradation
studies of food melanoidins. J. Agric. Food Chern., 53,4136-4142.
Adams, C.J., Manley-Harris, M., & Molan, P.e. (2009). The origin of methyl glyoxal in
New Zealand manuka (Leptosperrnurn scopariurn) honey. Carbohyd. Res., 344,
1050-1053.
Alonso, A M., Guillen, D. A, Barroso, C. G., Puertas, B., & Garcia, A. (2002).
Determination of antioxidant activity of wine bypro ducts and its correlation with
polyphenolic content. J. Agric. Food Chem., 50, 5832-5836.
Aljadi, AM., & Kamaruddin, M.Y. (2004). Evaluation of the phenolic contents and
antioxidant capacities of two Malaysian floral honeys. Food Chern., 85,513-518.
Al Somal, N., Coley, K.E., Molan, P.C., & Hancock, B.M. (1994). Susceptibility of
Helicobacter pylori to the antibacterial activity of man uk a honey. J. R. Soc. Med.,
87,9-12.
Anese, M., Manzocco, L., Nicoli, M.e., Lerici, C.R. (1999). Antioxidant properties of
tomato juice as affected by heating. J. Sci. Food Agric., 79, 750-754.
Anklam, E. (1998). A review ofthe analytical methods to determine the geographical and
botanical origin of honey. Food Chem. , 63, 549-562.
Arias, V.e., Castells, R.C., Malacalza, N., Lupano, C.E., & Castells, C.B. (2003).
Determination of oligosaccharide patterns in honey by solid-phase extraction and
High-Perfonnance Liquid Chromatography. Chrornatographia, 58, 797-801.
81

Baltrusaityte, V., Venskutonis, P.R., & Ceksteryte, V. (2007). Radical scavenging
activity of different floral origin honey and beebread phenolic extracts. Food
Chern., 101,502-514.
Baroni, M. V., Chiabrando, G. A., Costa, C., & Wunderlin, D. A. (2002). Assessment of the floral origin of honey by SDS-PAGE immunoblot techniques. J. Agric. Food Chern., 50, 1362-1367.
Bekedam, E.K., Loots, MJ., Schols, H.A., van Boekel, M.AJ.S., & Smit, G. (2008).
Roasting effects on fonnation mechanisms of coffee brew melanoidins. J. Agric.
Food Chern., 56, 7138-7145.
Bekedam, E.K., Schols, H.A., van Boekel, M.AJ.S., & Smit, G. (2006). High molecular
weight melanoidins from coffee brew. J. Agric. Food Chern., 54, 7658-7666.
Beretta, G., Granata, P., Ferrero, M., Orioli, M., & Facino, R.M. (2005). Standardization
of antioxidant properties of honey by a combination of
spectrophotometric/fluorimetric assays and chemometrics. Anal. Chirn. Acta., 533,
185-191.
Bertoncelj, J., Dobersek, U., Jamnik, M., & Golob, T. (2007). Evaluation of the phenolic
content, antioxidant activity and colour of Slovenian honey. Food Chern., 105,
822-828.
Blasa, M., Candiracci, M., Accorsi, A., Piacentini, M.P., Albertini, M.C., & Piatti, E.
(2006). Raw Millefiori honey is packed full of antioxidants. Food Chern., 97,217-
222.
Bon'elli, R.C & Fogliano, V. (2005). Bread crust melanoidins as potential prebiotic
ingredients. Mol. Nutr. Food Res.49, 673-678.
82
I

Borrelli, R.C., Fogliano, V., Monti, S.M., & Ames, J.M. (2002a). Characterization of
melanoidins from a glucose-glycine model system. Eur. Food Res. Technol., 215,
210-215.
Borrelli, R.C., Mennella, C., Barba, F., Russo, M., Russo, G.L., Krome, K., Erbersdobler,
H.F., Faist, V., & Fogliano, V. (2003). Characterization of coloured compounds
obtained by enzymatic extraction of bakery products. Food Chern. Toxicol., 41,
1367-1374.
Borrelli, R.C., Visconti, A., Melmella, C., Anese, M., & Fogliano, V. (2002b). Chemical
characterization and antioxidant properties of coffee melanoidins. J Agric. Food
Chern., 50,6527-6533.
Brands, C.MJ., Wedzicha, B.L., & van Boekel, M.A.J.S. (2002). Quantification of
melanoidin concentration in sugar-casein systems. J Agric. Food Chern., 50,
1178-1183.
Brudzynski, K. (2006). Effect of hydrogen peroxide on antibacterial activities of
Canadian honeys. Can. J Microbiol., 52, 1228-1237.
Bulut, L., & Kilic, M. (2009). Kinetics ofhydroxymethylfurfural accumulation and color
change in honey during storage in relation to moisture content. J Food Process.
Pres., 33, 22-32.
Cammerer, B., Jalyschkov, V., & Kroh, L.W. (2002). Carbohydrate structures as part of
the melanoidin skeleton. International Congress Series., 1245,269-273.
Cammerer, 8., & Kroh, L.W. (1995). Investigation of the influence of reaction conditions
on the elementary composition of melanoid ins. Food Chern., 53,55-59.
83
I .,

Cao, G., Sofie, E., & Prior, R.L., (1997). Antioxidant and prooxidant behavior of
flavonoids: structure-activity relationships. Free Radical Bio. Med., 22, 749-760.
Castro-Vasquez, L., Diaz-Maroto, M.C., Gonzalez-Vinas, M.A., De La Fuente, E., &
Perez-Coello, M.S. (2008). Influence of storage conditions on chemical
composition and sensory properties of citrus honey. J. Agric. Food Chem., 56,
1999-2006.
Chandra, R., Bharagava, R.N., & Rai, V. (2008). Melanoidins as major colourant in
sugarcane molasses based distillery effluent and its degradation. Bioresource
Techno!., 99,4648-4660.
Chen, X-M., & Kitts, D.D. (2008). Antioxidant activity and chemical properties of crude
and fractionated Maillard reaction products derived from four sugar-amino acid
Maillard reaction model systems. Ann. NY. Acad. Sci., 1126, 220-224.
Chen, L., Mehta, A., Berenbaum, M., Zangerl, A.R., & Engeseth, N.J. (2000). Honeys
from different floral sources as inhibitors of enzymatic browning in fruit and
vegetable homogenates. J. Agric. Food Chem., 48,4997-5000.
Cooper, RA., Molan, P. C., & Harding, K.G. (2002). The sensitivity to honey of Gram
positive cocci of clinical significance isolated from wounds. J. Appl. Microbiol.,
93,857-863.
D'Arcy, B.R. (2005). Antioxidants in Austrailian floral honeys-Identification of health
enhancing nutrient components. Rural Industries Research and Development
Corporation Publication No. 05/040.
Del Castillo, M.D., Ames, 1.M., & Gordon, M.H. (2002). Effect of roasting on the
antioxidant activity of coffee brews. J. Agric. Food Chem., 50,3698-3703.
84

Delgado-Andrade, C., Rufian-Henares, J.A., & Morales, F.J. (2005). Assessing the
antioxidant activity of melanoidins from coffee brews by different antioxidant
methods. J. Agric. Food Chern., 53, 7832-7836.
Efem, S. (1988). Clinical observations on the wound healing properties of honey. Br. J.
Surg., 75,679-681.
Fallico, R, ZappalA, M., Arena, E., & Verzera, A., (2004). Effects of conditioning on
HMF content in unifloral honeys. Food Chern., 85,305-313.
Frankel, S., Robinson, G.E., & Berenbaum, M.R. (1998). Antioxidant content and
correlated characteristics of 14 monofloral honeys. J. Apic. Res., 37,27-31.
French, V.M., Cooper, R.A., & Molan, P.C. (2005). The antibacterial activity of honey
against coagulase-negative staphylococci. J. Antirnicrob. Chernother., 56, 228-
231.
Gheldof, N., & Engeseth, N.J., (2002). Antioxidant capacity of honeys from various
floral sources based on the determination of oxygen radical absorbance capacity
and inhibition of in vitro lipoprotein oxidation in human serum samples. J. Agric.
Food Chern., 50, 3050-3055.
Gheldof, N., Wang, X-H, & Engeseth, N.J. (2002). Identification and quantification of
antioxidant components of honeys from various floral sources. J Agric. Food
Chern., 50,5870-5877.
Gniechwitz, D., Reichardt, N., Meiss, E., Ralph, J., Steinhart, H., Blaut, M., & Bunzel,
M. (2008a). Characterization and fermentability of an ethanol soluble high
molecular weight coffee fraction. J Agric Food Chern 56:5960-5969
85

Gniechwitz, D., Reichardt, N., Ralph, J., Blaut, M., Steinhart, H., & Bunzel, M. (2008b).
Isolation and characterisation of a coffee melanoidin fraction. J Sci. Food Agric.,
88,2153-2160.
Gonzales, A.P., Burin, L., & del Pilar Buera, M. (1999). Color changes during storage of
honeys in relation to their composition and initial color. Food Res. Int., 32, 185-
191.
Gupta, J.K., Kaushik, R., & Joshi, V.K. (1992). Influence of different treatments, storage
temperature end period on some physico-chemical characteristics and sensory
qualities ofIndian honey. J Food Sci. Technol. India, 29, 84-87.
Halliwell, B., & Gutteridge, J.M. (1999). "Free Radicals in Biology and Medicine"
Oxford University Press, Oxford.
Heim, K.E., Tagliaferro, A.R., & Bobilya, DJ. (2002). Flavonoid antioxidants:
chemistry, metabolism and structure-activity relationships. J Nutr. Biochem., 13,
572-584.
Held, P. (2005). Perfonning oxygen radical absorbance capacity (ORAC) assays with
Synergy HT multi-detection microplate reader. Application note from Biotek.
http://www.biotek.comlresources/tech res detail.php(id= 161).
Hodge, lE. (1953). Chemistry of browning reactions in model systems. J Agric. Food
Chem., 1,928-943.
Hofmann, T. (1998a). Studies on the relationship between molecular weight and the color
potency of fractions obtained by thennal treatment of glucose/amino acid and
glucose/protein solutions by using ultracentrifugation and color dilution
techniques. J Agric. Food Chern., 46,3891-3895.
86

Hofinann, T. (1998b). Studies on melanoidin-type colorants generated from the Maillard
reaction of protein-bound lysine and furan-2-carboxaldehyde-chemical
characterisation of a red coloured domaine. Z. Lebensm Unters Forsch A., 206,
251-258.
Homma, S., Terasawa, N., Kubo, T., Yoneyama-Ishii, N., Aida, K., & Fujimaki, M.
(1997). Changes in chemical properties of melanoid ins by oxidation and
reduction. Biosci. Biotechnol. Biochem., 61, 533-535.
Huang, D., Ou, B., Hampsch-Woodill, M., Flanagan, J., and Prior, R. (2002). High
throughput assay of Oxygen Radical Absorbance Capacity (ORAC) using a
multichannel liquid handling system coupled with a microplate fluorescence
reader in 96-well format. J Agric. Food Chem. 50,4437-4444.
Iglesias, M.T., Martin-Alvarez, PJ., Polo, M.C., de Lorenzo, C., & Pueyo, E. (2006).
Protein analysis of honeys by fast protein liquid chromatography: Application to
differentiate floral and honeydew honeys. J Agric. Food Chem, 54,8322-8327.
Jeffrey, A.E., & Echazarreta, C.M. (1996). Medical uses of honey. Rev. Biomed., 7,43-
49.
Jing, H., & Kitts, D. D. (2004). Antioxidant activity of sugar-lysine Maillard reaction
products in cell free and cell culture systems. Arch. Biochem. Biophys., 429, 154-
163.
Kroh, L.W., Fiedler, T., & Wagner, J. (2008). a-dicarbonyl compounds- key
intermediates for the formation of carbohydrate-based melanoidins. Ann. N Y.
Acad. Sci., 1126,210-215.
87
Kuntcheva, M.J., & Obretenov, T. D. (1996). Isolation and characterization of
melanoidins from beer. Z Lebensrn. Unters. F. A., 202, 238-243.
Kusuda, M., Hatano, T., & Yoshida, T. (2006). Water-soluble complexes formed by
natural polyphenols and bovine serum albumin: Evidence from gel
electrophoresis. Biosci. Biotechnol. Biochern., 70, 152-160.
Labrinea, E.P., & Georgiou, c.A. (2005). Rapid, fully automated flow injection
antioxidant capacity assay. J Agric. Food Chern., 53,4341-4346;
Lachman, 1., Kolihova, D., Miholova, D., Kosata, J., Titera, D., & Kult, K. (2007).
Analysis of minority honey components: Possible uses for the evaluation of honey
quality. Food Chern., 101, 973-979.
Lachman,1., Orsak, M., Hejtmankova, A., & Kovill'ova, E. (2010). Evaluation of
antioxidant activity and total phenolics of selected Czech honeys. LWT - Food Sci.
Technol., 43, 52-58.
Laemmli, U.K. (1970). Cleavage of structural proteins during the assembly of the head of
Bacteriophage T4. Nature, 227, 680-685.
Lavelli, V. (2002). Comparison of the antioxidant activities of extra virgin olive oils. J
Agric Food Chern., 50, 7704-7708.
Lindenmeier, M., Faist, V., & Hofmann, T. (2002). Structural and functional
characterization of pronyl-Iysine, a novel protein modification in bread crust
melanoidins showing in vitro anti oxidative and phase 1111 enzyme modulatin
activity. J Agric. Food Chern., 50, 6997-7006.
Lusby, P.E. , Coombes, A., & Wilkinson, 1.M. (2005). Bactericidal activity of different
honeys against pathogenic bacteria. Arch. Med. Res., 36,464-467. 88

Lynn, E.G., Englis, D.T., & Milum, V.G. (1936). Effect of processing and storage on
composition and color of honey. J Food Sci., 1,255-261.
Manzocco, L., Calligaris, S., Mastrocola, D., Nicoli, M.C., & Lerici, C.R. (2001). Review
of non-enzymatic browning and antioxidant capacity in processed foods. Trends
Food Sci. Tech., 11,340-346.
Marceau, E., & Yaylayan, V.A. (2009). Profiling of a-dicarbonyl content of commercial
honeys from different botanical origins: Identification of 3,4-dideoxyglucoson-3-
ene (3,4-DGE) and related compounds. J Agric. Food Chem., 57, 10837-10844.
Marshall, T., & Williams, K.M. (1987). Electrophoresis of honey: Characterization of
trace proteins from a complex biological matrix by silver staining. Anal.
Biochem., 167,301-303.
Martins, S.I.F.S., Jongen, W.M.F., & van Boekel, M.A.J.S. (2000). A review of Maillard
reaction in food and implications to kinetic modelling. Trends Food Sci. Technol.,
11,364-373.
Martins, S.I.F.S,Martinus A.J.S. van Boekel . (2003). Melanoidins extinction coefficient
in the glucose/glycine Maillard reaction. Food Chemistry, 83, 135-142.
Mavric, E., Wittmann, S., Barth, G., & Henle, T. (2008). Identification and quantification
of methyl glyoxal as the dominant antibacterial constituent of Manuka
(Leptospermum scoparium) honeys from New Zealand. Mol. Nutr. Food Res., 52,
483-489.
Mohammed, S.E.A.R., & Babiker, E.E. (2009). Protein structure, physicochemical
properties and mineral composition of Apis Mellifera honey samples of different
floral origin. Aust. J Basic Appl. Sci., 3,2477-2483.
89

Molan, P. (1992). The antibacterial activity of honey. 2. Variation in the potency ofthe
antibacterial activity. Bee World, 73, 59-76.
Molan, P. (1999). The role of honey in the management of wounds. J. Wound Care, 8,
415-418.
Montavan, P., Mauron, A-F., & Duruz, E. (2003). Changes in green coffee protein
profiles during roasting. J. Agric. Food Chem., 51,2335-2343.
Monti, S.M., Ritieni, A., Graziani, G., Randazzo, G., Mannina, L., Segre, A.L., Fogliano,
V., (1999). LC/MS analysis and antioxidative efficiency of Maillard reaction
products from a lactose-lysine model system. J. Agric. Food Chern., 47, 1506-
1513.
Morales, F.J. (2002). Application of capillary zone electrophoresis to the study of food
and food-model melanoidins. Food Chern., 76, 363-369.
Morales, F.J., & Babbel, M-B. (2002). Melanoidins exert a weak antiradical activity in
watery fluids. J. Agric. Food Chem., 50,4657-4661.
Mundo, M.A., Padilla-Zakour, 0.1., & Worobo, R.W. (2004). Growth inhibition of
foodbome pathogens and food spoilage organisms by select raw honeys. Int. J.
Food Microbiol., 97, 1-8.
Natarajan, S., Williamson, D., Grey, l, Harding, K.G., & Cooper, R.A. (2001). Healing
of an MRS A-colonized, hydroxyurea-induced leg ulcer with honey. J. Dermatol.
Treat., 12, 33-36.
Nunes, F.M., & Coimbra, M.A. (2007). Melanoidins from coffee infusions. Fractionation,
chemical characterization, and effect of the degree of roast. J. Agric. Food Chem.,
90

55,3967-3977.
Nunes, F.M., & Coimbra, M.A (2010). Role ofhydroxycinnamates in coffee melanoidin
fonnation . Phytochern. Rev., 9, 171-185.
O'Brien, J. & Morrissey, P.A (1989). Nutritional and toxicological aspects of the
Maillard browning reaction in foods. Crit. Rev. Food Sci. Nutr., 28,211-248.
Oszmianski, J., & Lee, C.Y. (1990). Inhibition of polyphenol oxidase activity and
browning by honey. J Agric. Food Chern., 38, 1892-1895.
Perez, R.A, Iglesias, M.T., Pueyo, E., Gonzalez, M., & de Lorenzo, C. (2007). Amino
acid composition and antioxidant capacity of Spanish honeys. J. Agric. Food
Chern., 55, 360-365.
Rice-Evans, C.A, Miller, N.J., & Paganga, G. (1996). Structure-antioxidant activity
relationships of flavonoids and phenolic acids. Free Radical Bio. Med., 20, 933-
956.
Rufian-Henares, J.A, & de la Cueva, S.P. (2009). Antimicrobial activity of coffee
melanoidins-A study of their metal-chelating properties. J Agric. Food Chern.,
57, 432-438.
Rufian-Henares, l.A, & Morales, F.J. (2007a). Angiotensin-I converting enzyme
inhibitory activity of coffee melanoidins. J Agric. Food Chern., 55, 1480-1485.
Rufian-Henares, J .A, & Morales, F.J. (2007b). Antimicrobial activity of me1anoidins. J
Food Quality, 30, 160-168.
91

Sahin, H., Topuz, A., Pischetsrieder, M., & Ozdemir, F. (2009). Effect of roasting process
on phenolic, antioxidant and browning properties of carob powder. Eur. Food
Res. Technol., 230, 155-161.
Salah, N., Miller, N.J., Paganga, G., Tijburg, L., Bolwell, G.P., & Rice-Evans, C. (1995).
Polyphenolic flavanols as scavengers of aqueous phase radicals and as chain
breaking antioxidants. Arch. Biochem. Biophys., 322, 339-346.
Sancho, M.T., Muniategui, S., Huidobro, l.F., & Lozano, l.S. (1992). Aging of honey. J.
Agric. Food Chern., 40,134-138.
Saxena, S., Gautam, S., & Sharma, A. (2010). Physical, biochemical and antioxidant
properties of some Indian honeys. Food Chern., 118,391-397.
Silici, S., Sagdic, 0., & Ekici, L. (2010). Total phenolic content, antiradical, antioxidant
and antimicrobial activities of Rhododendron honeys. Food Chern., 121,238-243.
Silva, L.R., Videira, R., Monteiro, A.P., Valentao, P., & Andrade, P.B. (2009). Honey
from Luso region (Portugal): Physicochemical characteristics and mineral
contents. Microchern. J., 93, 73-77.
Singh, R., Barden, A., Mori, T., & Beilin, L. (2001). Advanced glycation end-products: a
review. Diabetologia, 44, 129-146.
Singleton, V.L., Orthofer, R., and Lamuela-Raventos, R.M. (1999). Analysis of total
phenols and other oxidation substrates and antioxidants by means of Folin
Ciocalteau reagent. Methods Enzyrnol., 299, 152-178.
Smaniotto, A., Bertazzo, A., Comai, S. , & Traldi, P. (2009). The role of peptides and
proteins in melanoidin fonnation. J. Mass. Spectrorn. , 44, 410-418.
92
Subralunanyam, M. (1996). Honey dressing versus boiled potato peel in the treatment of
bums: A prospective randomised study. Burns, 22, 491-493.
Subralunanyam, M. (1998). A prospective randomised clinical and histological study of
superficial bum wound healing with honey and silver sulfadiazine. Burns, 24,
157-161.
Subralunanyam, M. (1999). Early tangential excision and skin grafting of moderate burns
is superior to honey dressing: A prospective randomized trial. Burns, 25, 729-731.
Swellam, T., Miyanaga, N., Onozawa, M., Hattori, K., Kawai, K., Shimazui, T., &
Akaza, H. (2003). Antineoplastic activity of honey in an experimental bladder
cancer implantation model: In vivo and in vitro studies. Int, J. Urol., 10,213-219.
Taormina, PJ., Niemira, B.A., & Beuchat, L.R. (2001). Inhibitory activity of honey
against foodbome pathogens as influenced by the presence of hydrogen peroxide
and level of antioxidant power. Int. J. Food Microbiol., 69, 217-225.
Tonks, AJ., Cooper, R.A., Jones, K.P., Blair, S., Parton, J., & Tonks, A. (2003). Honey
stimulates inflammatory cytokine production from monocytes. Cytokine, 21, 242-
247.
Tosi, E., Ciappini, M., Re, E., & Lucero, H. (2002). Honey thermal treatment effects on
hydroxymethylfurfural content. Food Chern., 77,71-74.
Tressl, R., Wondrak, G.T., Garbe, L-A, KrUger, R-P, & Rewicki, D. (1998). Pentoses and
hexoses as sources of new melanoidin-like Maillard polymers. J. Agric. Food
Chern., 46, 1765-1776.
93

Turkmen, N., Sari, F., Poyrazoglu, E.S., & Velioglu, Y.S. (2006). Effects of prolonged
heating on antioxidant activity and colour of honey. Food Chern., 95,653-657.
U.S. Food and Drug Administration, Center for Drug Evaluation and Research. 510(k)
Summary for Derma Sciences Medihoney Dressings with Active Manuka Honey,
April 23, 2008. Retrieved October 19, 2010, from http://www.accessdata.fda.gov
/cdrh _ docs/pdf8/K080315.pdf
Van Boekel M.AJ.S. (2006). Formation of flavour compounds in the Maillard reaction.
Biotechnol. Adv., 24,230-233.
Vela, L., de Lorenzo, c., & Perez, R.A. (2007). Antioxidant capacity of Spanish honeys
and its correlation with polyphenol content and other physicochemical properties.
J. Sci. Food Agric., 87, 1069-1075.
Verardo, G., Duse, I., & Callea, A. (2009). Analysis ofunderivatized oligosaccharides by
liquid chromatography/electrospray ionization tandem mass spectrometry with
post-column addition of formic acid. Rapid Cornrnun. Mass Spectrorn., 23, 1607-
1618.
Vinson, lA., Mandarano, M., Hirst, M., Trevithick, lR., & Bose, P. (2003). Phenol
antioxidant quantity and quality in foods: Beers and the effect of two types of beer
on an animal model ofatherosc1erosis. J. Agric. Food Chern., 51,5528-5533.
Weigel, K.U., Opitz, T., & Henle, T. (2004). Studies on the occurrence and formation of
1,2-dicarbonyls in honey. Eur. Food Res. Techno!., 218,147-151.
XU, Q., Tao, W., & Ao, Z. (2007). Antioxidant activity of vinegar melanoidins. Food
Chern., 102,841-849.
94

Appendix A: Standard curves
1 -f----ClJ
~ .-e 0.5
y = 0.0042x - 0.0982 R2 = 0.9998
o rn
~ o ~JL.------T------"'---------'
o 200 400 600
Gallic Acid
Figure A-I: Gallic acid standard curve. Values represent the means ± SD of six independent determinations.
12 ~------.-----------
10 +--------------------~----
8 -l---
6
4
2
o +---,---... -...,-----r
o 5 10 15
_ __ Tolox M
Figure A-2: Trolox standard curve.
20 25
Values represent the means ± SD of 7 independent determinations.
5.8
~ '0 5.6 +-----.. -.::!~.-----.------Y. = -0,2437x + 6 6704 :s: R2 = 0.9934 til 5.4 .. + .......... -... --... -......... ---............... -............ ~
"3 u ~ 5.2 ::E 01) 5 + .. -- .. --.. --...... ---... --..... --.--.----------.. ~~ .. ------.3
4.8 +-----.. -,.......------,..-----,---:L..........,
1.5 2 2.5
VeNo
3 3.5
Figure A-3 : Standard curve for the determination of molecular size. Molecular weight markers eluted in the same fraction for all trials (n=3) .
95

2.3 _ . m" .. • ".... •.
~ 2.1 ----,,--
.~ I !;j 1.9 "r-"---'
"3 (.)
y = -0.9285x + 2.2994 R2 = 0.9908
~ 1.7 .. -.......... - .. ---... ----".-... ---.-.. --.... - -.-.--.--.. -.. - ..
~ OJ) .9 1.5 -1----------------------'''''---
l' 1.3 0 --"--;;:;:---;,:~--;;:;; 0.8 I I
__________ __V_e_lV_o ______ --..J
Figure A-4: Protein molecular weight standard curve. Protein standards were run on 10% acrylamide gel. Data represents the mean ± SD of three independent determinations.
96