elongational properties and crystallization of poly
TRANSCRIPT

INVESTIGACION REVISTA MEXICANA DE FISICA 50 (5) 506–514 OCTUBRE 2004
Elongational properties and crystallization of poly (isobutylene)melts probed by synchrotron radiation
A. Gonzalez-Alvarez* and M. ArellanoDepartamento de Ingenierıa Quımica, CUCEI, Universidad de Guadalajara,Blvd. Marcelino Garcıa Barragan 1451, Guadalajara, Jal. 44430 MEXICO
O. DiatEuropean Synchrotron Radiation Facility BP 220, F-38043, Grenoble FRANCE
J.F. LegrandUMR 585 (CEA-CNRS-Universite Joseph Fourier)
DRFMC/CEA Grenoble 17 rue des Martyrs, 38054, Grenoble FRANCE
J.M. PiauLaboratoire de Rheologie, Universite Joseph Fourier
Grenoble 1, Institut National Polytechnique de Grenoble, etCNRS (UMR) 5520 Domaine Universitaire B. P. 53 F-38041 Grenoble, France Cedex 9
Recibido el 13 de enero de 2004; aceptado el 26 de abril de 2004
In this paper, we describe a phase transition in poly(isobutylene) of various molecular weight under elongational stress. Rheometry andwide angle X-ray diffraction have been performed simultaneously to correlate mechanical and structural properties of the material. The lowmolecular weight samples did not crystallize under the flow in the range of the strain rates applied. On the other hand, as the molecularweight increases the crystallization is always preceded by a strain of the samples under stretching.
Keywords: Elongational viscosity; crystallization; strain hardening; poly(isobutylene).
En este trabajo se describe la transicion de fases de poliisobutileno de varios pesos moleculares sometidos a esfuerzos elongacionales. Ex-perimentos de reometrıa y difraccion de rayos X deangulo amplio se realizan simultaneamente para correlacionar las propiedades mecanicasy la estructura del material. Muestras de polımero de bajo peso molecular no cristalizan en el intervalo de velocidades de deformacionaplicadas. Al incrementar el peso molecular del polımero la cristalizacion obtenida es precedida por un endurecimiento del material debidoa la deformacion.
Descriptores: Viscosidad elongacional; cristalizacion; endurecimiento debido a la deformacion; poliisobutileno.
PACS: 83.20.Hn
1. Introduction
One of the first papers about polymer crystallization underflow was published by van der Vegt and Smit [1]. Theyperformed standard rheometrical measurements using a cap-illary rheometer for polyolefins (polypropylene, polyethy-lene and ethylene propylene copolymers) and natural rubber.Their studies were performed under stationary flow condi-tions at conventional processing temperatures (i.e. far abovethe melting point where the viscosity is lower) and also closeto temperatures for which polymeric materials solidify. Theyobserved that there exists a - temperature dependant- criticalrate of flow at which the rheo-fluidification effect is replacedby a flow thickening effect (i.e. an increase of the apparentviscosity while increasing the rate of flow) and eventually aplugging of the capillary by crystallized polymer. The anal-ysis of the X-ray diffraction pattern revealed a very high de-gree of orientation with a preferentialc -axis parallel to theflow axis. van der Vegt and Smit interpreted this effect as aconsequence of the flow-induced chain extension through thecapillary. More recently Kolnaar and Keller [2] performedX-ray studies during the extrusion of a linear polyethylene.
They found a temperature window, close to the melting point,where anomalous flow has been pointed out. They wereable to relate this unusual behavior with the occurrence ofa hexagonal crystalline phase which usually crystallizes intoan orthorhombic structure.
Then it appears that there is a great interest to correlateprecisely the structural studies of the polymer with its me-chanical properties. Among polyolefins it is also well-knownthat Polyisobutylene (PIB) of high molecular weight maycrystallize at room temperature under stretching. Therefore,PIB appears to be a good candidate for studying crystalliza-tion under elongational flow. The reasons are
i) PIB is a linear polymer (samples of different molecu-lar weights and polydispersity are easy to dissolve incommon solvents),
ii) PIB is not a semi-crystalline polymer at rest and atroom temperature,
iii) it is easy to produce batch samples of different forms(rods, sheets), and
iv) PIB is not a mechanically degradable polymer.

ELONGATIONAL PROPERTIES AND CRYSTALLIZATION OF. . . 507
Previous studies concerning the crystallization of PIBsamples may be separated into two categories:
a Static studies on crystallized elongated samples.
b Real-time studies on the crystallization process.
In the first case, Brill and Halle [3], Fulleret al. [4],and Tanakaet al. [5] have determined the crystalline struc-ture of PIB using stretched polymer samples of high molec-ular weight. They found a threshold deformationL/Lo = 6,whereLo is the initial length of the sample andL is the fi-nal length after stretching) for the onset of crystallization aswell as the optimal stretching ratio (L/Lo = 11) to producethe best diffraction pattern. The structure determination hasshown that crystalline PIB has a hexagonal unit cell and achain conformation consisting of an8/3 helix with a period-icity c = 18.63 A.
In the second case, Slonimskyet al. [6] have studied PIBsamples stretched with a constant force and they identifiedthree characteristic regimes in the strain variation as a func-tion of time: the first one corresponds to the flow of the poly-mer in an amorphous state, the second one to the process ofmolecular ordering and crystallization, and the third one tothe creeping flow regime in the crystalline state. The crys-talline phase of the polymer in the latter regime was studiedusing X-ray diffraction techniques and electron-microscopicinvestigation of extended samples. When the tensile stresswas released, the sample returned to the amorphous with thelength close to its initial value. Later on, using a synchrotronbeam, Kochet al. [7] conducted real time experiments withfibers of PIB. After a step deformation produced by a pneu-matic driven piston, they were able to observe the onset ofcrystallization of the material with a short delay due to somerelaxation process. But here again, the crystalline regionsof the polymer melted immediately when elongational stresswas released.
The aim of our work is to combine rheological measure-ments with an investigation of the possible phase changes un-der the elongational flow. For this purpose we constructed anew traction machine that can be mounted either on labora-tory X-ray generators and on Synchrotron beam lines. Theobjectives were to study in real time the crystallization pro-cess of PIB samples, the structure and the orientation of thecrystals as a function of the molecular weight, and the de-formation rate. Indeed for low molecular weight samples thereptation time becomes smaller than the time scale of the ex-periment and then no crystallization is expected. In the nextparts, we present and explain the rheological measurements,the X-ray diffraction experiments and finally the relationshipsbetween them.
2. Experimental
2.1. Materials
A series of PIB samples of different molecular weights andpolydispersities were provided by BASF and Exxon. The
TABLE I. Characteristics of PIB Oppanol samples (BASF 1989)
Polymer Mw 103 Mn 103 Mw/Mn
(Oppanol) (gr/mol) (gr/mol)
B10 36.5 – 45.0 22.0 – 25.0 1.66 – 1.80
B15 85.8 – 101.0 39.0 – 43.5 2.20 – 2.32
B100 1084 – 1491 218 – 271 4.97 – 5.50
B200 3960 – 5300 527 – 642 7.51 – 8.55
TABLE II. Characteristics of PIB L-140 sample.
Polymer Mw 103 Mn 103Mw
Mn
(PIB L-140) Exxon (gr/mol) (gr/mol)
Hudson and Ferguson [10] 1 176 228 588 097 2
Willenbacher and Hingmann [11] 2 670 000 530 000 5
FIGURE 1. Sketch of the traction machine and of the initial scat-tering pattern recorded on a 2-D gas-filled detector at the ESRF.Before elongation the scattering of the polymer sample is isotropicand only a sector of the amorphous ring is recorded by the detector(2θ is the scattering angle andΦ is the azimuthal angle).
values ofMw andMw/Mn for the samples from BASF arelisted in Table I. For the polymer L-140 from Exxon, themethod of gel permeation chromatography was used to de-termineMw/Mn and the results obtained by two differentgroups are given in the Table II.
2.2. Sample preparation
For the low molecular weight PIB-polymers (B10 and B15),we prepared rod-like samples with10 mm of diameter forB10 and5 mm in diameter for B15. For high molecularweight PIB samples (B100, B200 and L-140), the polymerwas dissolved in trichloroethylene and cast onto aluminiumfoils. After a total evaporation of the solvent, the polymerfilms were cut into rectangular sheets of80× 28× 0.5 mm3
and glued on both ends on the rollers of the traction machine.
2.3. Traction machine
The components of the traction machine (see Fig. 1) are
i) two rollers with rough surfaces which can rotate with aconstant speed,
Rev. Mex. Fıs. 50 (5) (2004) 506–514

508 A. GONZALEZ-ALVAREZ, M. ARELLANO, O. DIAT, J.F. LEGRAND, AND J.M. PIAU
ii) a stepping motor with a reduction gear, and
iii) a force transducer limited to 5N.
The general principles of the machine [8] are similar to themost basic rotary clamps rheometers developed by Meissneret al. [9]. Both rollers have the same linear velocityV . Thelength of the sampleLo being constant (Lo, defined as thedistance between roller axis), the elongational strain rate isconstant:
εo = 2V/Lo (1)
At the beginning of an experiment, the initial sectionSo
of the polymer sample is measured accurately for the calcu-lation of the initial stress. Then, according to homogeneousstrain assumption [8] we consider that the section sample de-creases exponentially as a function of time,
S = So exp(−2V t/Lo) (2)
wheret is the elapsed time after start. This assumption isvalid as long as the sample flows, but certainly inappropri-ate to describe the creeping of the crystalline sample. Nev-ertheless, to calculate transient stress we will use the abovedefinition keeping in mind that the absolute values are differ-ent after the onset of the crystallization. Thus, the transientstressσ(t) and the elongational viscosityη+
E can be writtenas follow:
σ(t) = F (t) exp(2V t/Lo)/So (3)
η+E = σ(t)/εo (4)
where F (t) is the transient elongational force and it isrecorded through the transducer during the experiment. Inthe following sections we will use the Hencky deformationε = ln (L/Lo) which in these experiments is given by:
ε = εot (5)
In general, for polymer melts under elongational flow,there exist two regimes. At low elongation rate, which corre-sponds to a Newtonian flow, it has been demonstrated thatthe elongational viscosity is equal to three times the tran-sient shear viscosity (η+
E = 3η+ , the Trouton relation-ship). At high elongation rate, the flow behavior deviatesfrom the Newtonian regime and an abrupt increase in theelongational viscosity called strain hardening has been fre-quently observed.
2.4. X-Ray diffraction set-up
The first X-ray diffraction experiments were performed usingCuKα radiation from a classical generator. The measure-ments were performed using a Siemens powder diffractome-ter in transmission geometry. In order to follow the evolu-tion of the diffracted intensity, a point detector mounted on a2θ-arm was positioned at a fixed angle in the equatorial plane
corresponding to the first Bragg reflection of the stretchedsample.
In a second stage, real-time wide angle X-ray diffraction(WAXD) experiments were performed on the D24 beamlineat LURE (the French Synchrotron facility in Orsay). The ra-diation was monochromatized to a wavelengthλ = 1.54 A,with an energy resolution (∆λ/λ of 0.1 %). A one-dimensional position sensitive detector was placed horizon-tally at 180 mm from the specimen in order to detect theequatorial Bragg reflections between2θ = 10◦ and2θ = 28◦
(where2θ is the scattering angle). Minimum time frame wasreduced to0.5 s.
In order to get more quantitative information on theline-shape of the Bragg peak, a series of experiments wereperformed at the European Synchrotron Radiation Facil-ity (ESRF) in Grenoble on the high brilliance beamline(ID2). The ondulator gap as well as the Si 111 channel-cut monochromator were set in order to select a wavelengthλ = 0.75 Awith ∆λ/λ = 0.03%. A two-dimensional gas-filled detector with a spatial resolution of600 µm was usedand time frames were reduced to0.1 s. It was positioned at70 cm from the sample to cover Bragg angles from3 to 11◦
(see Fig. 1). In order to get a fine correlation between thecrystallization process and the rheological measurements thetraction machine and the image acquisition were synchro-nized. All the experiments were performed at room tempera-ture (22◦C).
3. Results and discussion
3.1. Rheological measurements
The first evidence for a possible change of the polymer chainconformation is given by the evolution of the elongational
FIGURE 2. Real-time studies on the crystallization process forB10: ◦, εo = 0.11s−1; N, εo = 0.19s−1; +, εo = 0.38s−1;H, εo = 0.47s−1. The solid line corresponding to the transientshear viscosityη+ is displayed in order to be compared with theelongational viscosity (Trouton relation).
Rev. Mex. Fıs. 50 (5) (2004) 506–514

ELONGATIONAL PROPERTIES AND CRYSTALLIZATION OF. . . 509
FIGURE 3. Real-time studies on the crystallization process forB15: ¤, εo = 0.029s−1; ¥, εo = 0.047s−1; ◦, εo = 0.095s−1;•, εo = 0.11s−1. The solid curve is still a guide line for the cor-responding transient viscosity and allows the reader to see a cleardeviation of the elongational viscosity from the Newtonian behav-ior.
FIGURE 4. Real-time studies on the crystallization process forB100: ¤, εo = 0.029s−1; 4, εo = 0.059s−1; H, εo = 0.47s−1;O, εo = 0.95s−1.
force as a function of time. Using the Eqs. (1)-(4), we candeduce and plot the variation the elongational viscosityη+
E asa function of time. In Figs. 2 – 6 we compare five samples ofdifferent molecular weights under different elongation rates.From these curves we observe a clear distinction between twogroups of samples: the low molecular weight samples, B10and B15 (Figs. 2, 3 respectively), for which no crystallizationwas observed for the elongation rates used and higher molec-ular weight samples B100, B200 and L-140 (Figs. 4, 5 and 6respectively), which crystallize under elongational stress.
For the sample B10 these experiments were performed atstrain rates from0.11 to 0.47s−1. We essentially observe aNewtonian behavior and the transient elongational viscosityis approximately three times the transient shear viscosity [10]
FIGURE 5. Real-time studies on the crystallization process forB200: ¤, εo = 0.029s−1; 4, εo = 0.059s−1; •, εo = 0.095s−1;◦, εo = 0.11s−1.
FIGURE 6. Real-time studies on the crystallization process for L-140: ¤, εo = 0.029s−1; ¥, εo = 0.047s−1; •, εo = 0.38s−1;◦, εo = 0.47s−1. The arrows in the graphs 4, 5 and 6 indicatethe onset of crystallization determined from X-ray scattering ex-periments discussed in the next sections. The attached numberscorrespond totc in seconds.
(Trouton relation). In contrast for the B15 sample we foundthe onset the strain hardening after10 s (Fig. 3) when thetransient elongational viscosity starts to deviate from theNewtonian behavior.
On the other hand, for the higher molecular weight PIBsamples (second group) B100, B200 and L-140, one can no-tice two non-Newtonian regimes. In a first stage, these threesamples exhibit a similar evolution - a strain hardening - andafter a few seconds one observes an anomalous increase ofthe elongational viscosity corresponding to a divergence ofthe recorded elongational force. Such a behavior can also beseen in the results reported by Meissner [9] for polyethyleneabove its melting temperature. At short times, for the highmolecular weight samples, the elongational viscosity has the
Rev. Mex. Fıs. 50 (5) (2004) 506–514

510 A. GONZALEZ-ALVAREZ, M. ARELLANO, O. DIAT, J.F. LEGRAND, AND J.M. PIAU
same magnitude whatever the strain rates; the strain harden-ing is observed until a stronger and an anomalous harden-ing occurs at timet∗, which depends on the strain rate. Thistime t∗ corresponds to a change of slope in theLog − Logplots and thus a change in the power law behavior of the vis-cosity. The two straight lines in Fig. 6 show how the valueof t∗ can be estimated. These values are listed in Table III.They suggest a renormalization of the curves with the strainrate εo. Thus, using the Eqs. (3) and (5), the elongationalstress at constant strain rate is plotted as a function of strain(see Figs. 7-9). It appears that almost all the curves show aunique behavior with these two regimes. Accordingly, it isfound that the elongational stress depends on the strain ratherthan on the strain rate. The change of slope appears for thestrain ε∗ = εot
∗ whose estimated values are also given inTable III.
FIGURE 7. Same data are plotted in different coordinates: transientelongational stressσ(t) versus Hencky strainε, only for samplesshowing crystallization under elongational stress B100.
FIGURE 8. Same data are plotted in different coordinates: transientelongational stressσ(t) versus Hencky strainε, only for samplesshowing crystallization under elongational stress B200.
FIGURE 9. Same data are plotted in different coordinates: transientelongational stressσ(t) versus Hencky strainε, only for samplesshowing crystallization under elongational stress L-140.
3.2. X-ray diffraction measurements
Having obtained the mechanical response of the PIB samplesfor different elongational rates as a function of time, the nextstep was to record simultaneously the scattering pattern andthe elongational force in order to explore the possible coinci-dence between strain hardening and crystallization process.The X-ray diffraction and rheological measurements werecarried out only on high molecular weight samples, whichexhibit anomalous hardening (B100, B200 and L-140).
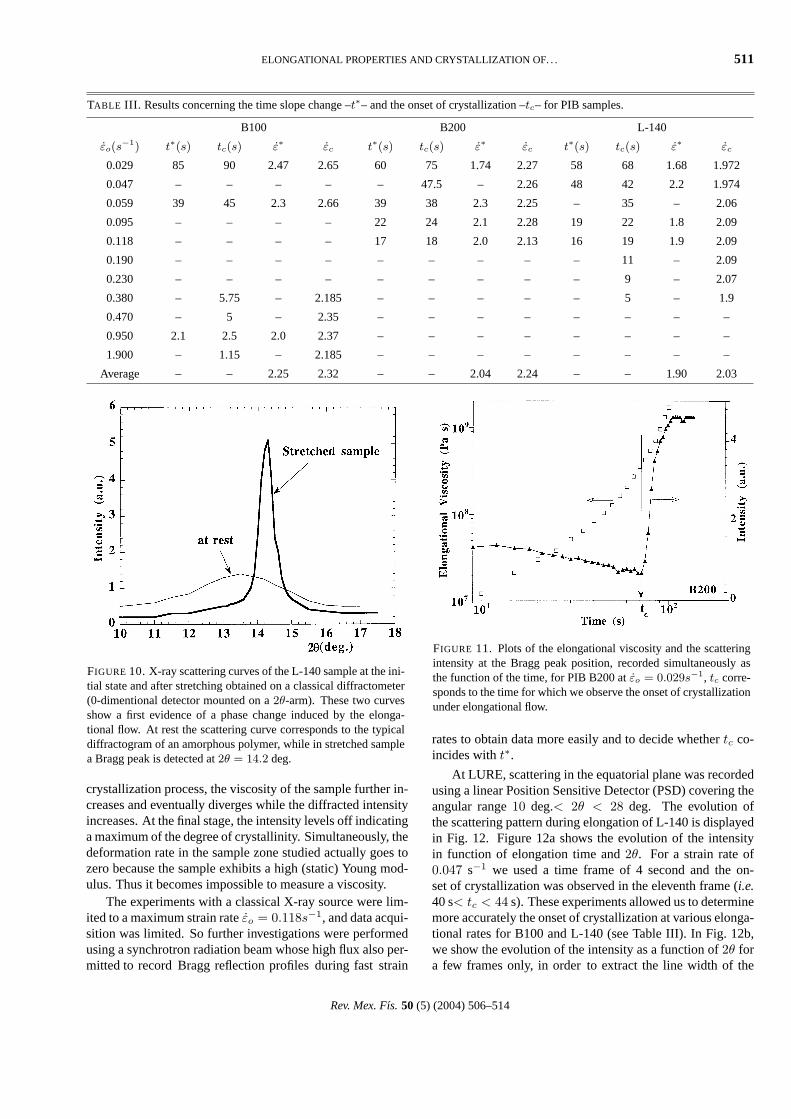
In some preliminary investigations, the traction machinewas installed on a classical X-ray diffractometer, and pow-der diffractograms were recorded before and after elonga-tion. The results obtained with the L-140 sample are dis-played in Fig. 10. The scattering profile from the cast poly-mer film corresponds to the typical scattering pattern of anamorphous polymer; the broad peak is attributed to shortrange chain correlation [13]. In contrast, when the PIB sam-ple is stretched, the diffraction pattern shows a sharp peakwith a maximum intensity at2θ = 14.2 deg. This is thecomposite(020) + (110) Bragg peak in the equatorial planeof the stretched sample [5]. For the simultaneous measure-ments, we investigated samples of B200 with the X-ray de-tector positioned2θ = 14.2 deg. Figure 11 displays the scat-tered intensity and the elongational viscosity as a functionof time during stretching of B200 at a constant strain rateεo = 0.029 s−1. Initially, the scattered intensity decreases(due to the decrease of the sample cross section under elon-gation), and in the latter stage the intensity increases (due toan increase of the Bragg reflection from the crystalline re-gions that we define as “the crystallization process”). Finallyit reaches a plateau. The time at which the intensity abruptlyincreases (t = tc) corresponds to “the onset of crystalliza-tion”. In this case, we emphasize that the variation of thescattered intensity attc is more abrupt than the change ofslope observed att∗ in the elongational viscosity. During the
Rev. Mex. Fıs. 50 (5) (2004) 506–514
ELONGATIONAL PROPERTIES AND CRYSTALLIZATION OF. . . 511
TABLE III. Results concerning the time slope change –t∗– and the onset of crystallization –tc– for PIB samples.
B100 B200 L-140
εo(s−1) t∗(s) tc(s) ε∗ εc t∗(s) tc(s) ε∗ εc t∗(s) tc(s) ε∗ εc
0.029 85 90 2.47 2.65 60 75 1.74 2.27 58 68 1.68 1.972
0.047 – – – – – 47.5 – 2.26 48 42 2.2 1.974
0.059 39 45 2.3 2.66 39 38 2.3 2.25 – 35 – 2.06
0.095 – – – – 22 24 2.1 2.28 19 22 1.8 2.09
0.118 – – – – 17 18 2.0 2.13 16 19 1.9 2.09
0.190 – – – – – – – – – 11 – 2.09
0.230 – – – – – – – – – 9 – 2.07
0.380 – 5.75 – 2.185 – – – – – 5 – 1.9
0.470 – 5 – 2.35 – – – – – – – –
0.950 2.1 2.5 2.0 2.37 – – – – – – – –
1.900 – 1.15 – 2.185 – – – – – – – –
Average – – 2.25 2.32 – – 2.04 2.24 – – 1.90 2.03
FIGURE 10. X-ray scattering curves of the L-140 sample at the ini-tial state and after stretching obtained on a classical diffractometer(0-dimentional detector mounted on a2θ-arm). These two curvesshow a first evidence of a phase change induced by the elonga-tional flow. At rest the scattering curve corresponds to the typicaldiffractogram of an amorphous polymer, while in stretched samplea Bragg peak is detected at2θ = 14.2 deg.
crystallization process, the viscosity of the sample further in-creases and eventually diverges while the diffracted intensityincreases. At the final stage, the intensity levels off indicatinga maximum of the degree of crystallinity. Simultaneously, thedeformation rate in the sample zone studied actually goes tozero because the sample exhibits a high (static) Young mod-ulus. Thus it becomes impossible to measure a viscosity.
The experiments with a classical X-ray source were lim-ited to a maximum strain rateεo = 0.118s−1, and data acqui-sition was limited. So further investigations were performedusing a synchrotron radiation beam whose high flux also per-mitted to record Bragg reflection profiles during fast strain
FIGURE 11. Plots of the elongational viscosity and the scatteringintensity at the Bragg peak position, recorded simultaneously asthe function of the time, for PIB B200 atεo = 0.029s−1, tc corre-sponds to the time for which we observe the onset of crystallizationunder elongational flow.
rates to obtain data more easily and to decide whethertc co-incides witht∗.
At LURE, scattering in the equatorial plane was recordedusing a linear Position Sensitive Detector (PSD) covering theangular range10 deg.< 2θ < 28 deg. The evolution ofthe scattering pattern during elongation of L-140 is displayedin Fig. 12. Figure 12a shows the evolution of the intensityin function of elongation time and2θ. For a strain rate of0.047 s−1 we used a time frame of 4 second and the on-set of crystallization was observed in the eleventh frame (i.e.40 s< tc < 44 s). These experiments allowed us to determinemore accurately the onset of crystallization at various elonga-tional rates for B100 and L-140 (see Table III). In Fig. 12b,we show the evolution of the intensity as a function of2θ fora few frames only, in order to extract the line width of the
Rev. Mex. Fıs. 50 (5) (2004) 506–514

512 A. GONZALEZ-ALVAREZ, M. ARELLANO, O. DIAT, J.F. LEGRAND, AND J.M. PIAU
FIGURE 12. Results obtained using the Synchrotron radiationbeam at LURE. a) The 3D graph shows the scattering intensity fromthe L-140 sample versus the scattering angle and for different timeframes; the elongational rateεo was fixed to0.047s−1. b) Thesame scattering curves are plotted in projection along the time axisin order to get some information on the width of the Bragg peakprofile.
Bragg peak profile during the crystallization. It appears thatthe full width, at half maximum, which is related to the sizeof the crystallites remains constant as the peak grows.
Complementary experiments were performed at theESRF with a better time resolution using the high brilliancebeamline ID2 and a 2-D detector, synchronized with thetraction machine. These experiments allowed us to achievehigher strain rates as shown in Fig. 13. Nine 2-D diffrac-tograms for B100, before and after crystallization was deter-mined with a time resolution of0.2s.
For the three samples, Fig. 14 shows the double plot ofεo
as a function oftc the time of the onset of crystallization. Allthe points are aligned on a straight line of slope =-1 (almost
FIGURE 13. A series of 2-D X-ray scattering pattern recordedat the ESRF for B100 sample under an elongational rateεo = 0.029s−1. 9 Frames (3 second of acquisition time) have beenselected aroundtc, the time of the onset of crystallization (framen◦ 31): the labels correspond to the numbering of the frames.
FIGURE 14. Deformation rate versus onset of crystallization(in seconds) for three samples B100 (◦ LURE, 4 ESRF), B200(¤ Classical X-ray generator) and L-140 (• LURE). The line has aslope equal to -1.
two orders of magnitude), which demonstrates the inverseproportionality betweentc andεo. The productεotc definedas the critical Hencky deformationεc is constant.
All theses results are also summarized in Table III. ForL-140 we findεc = 2.0±0.1 which correspond toL/Lo ' 7,for B200 we find εc = 2.2 ± 0.1 which correspond toL/Lo ' 9, while for B100 we findεc = 2.4 ± 0.2 whichcorrespond toL/Lo ' 10. These averaged values do notreveal a systematic dependence on the molecular weight.
Rev. Mex. Fıs. 50 (5) (2004) 506–514

ELONGATIONAL PROPERTIES AND CRYSTALLIZATION OF. . . 513
FIGURE 15. Averaged azimuthal distribution of the intensity alongthe ring at fixed2θBragg for the B100 at0.029s−1 and for differenttime frames (times are indicated in the legend).
FIGURE 16. These curves show the ratio of the azimuthal intensi-ties distribution for different frames (see legend) by the intensity ofthe initial one.
Figures 4 – 6 show the elongational viscosities whichwere recorded during the X-ray diffraction measurements.The arrows in the figures indicate the onset of crystalliza-tion tc. It is clearly observed there exists a time delay be-tween the anomalous strain hardening att∗ andtc, which can-not be attributed to the poor accuracy in the time frame mea-surement. The values given in Table III indicate that the ratiot∗/tc(= ε∗/εc) is almost a constant independent of the strainrate εo and the molecular weight (0.91 < ε∗/εc < 0.95).This means that the strain hardening occurs when the elonga-tion ratioL/Lo is around80% of the value corresponding tothe onset of crystallization.
From the time resolved diffraction measurements usingeither linear or area detectors, we can also analyze the line-shape of the diffraction peaks and its evolution during thecrystallization process (t > tc). As common in polymers, the
full-width of the Bragg reflections∆(2θ) is controlled by thesmall coherent sizeLc of the crystallites. According to theScherrer expression,
∆(2θ) = 0.9λ/Lc cos θ (6)
One obtains forλ = 1.54 A, and ∆(2θ) = 0.4deg., acoherence lengthLc = 145 A (see Fig. 12b). From the evo-lution in the line width during the crystallization process onemay thus analyze the possible growth of the crystallites. Itis clearly visible that only the intensity of the Bragg peak in-creases without any change of its width (∆(2θ) = 0.4deg.).This means that the crystallization scenario consists of con-tinuous nucleation of new crystallites, each of them reachingits equilibrium size in a very short time. This result is con-firmed over the full range of applied strain rates.
The data obtained with the area detector (Fig. 13) alsoshow a high orientation of the crystal with thecaxes along thestretching direction. In a first approximation the azimuthalwidth ∆φ gives an upper limit for the width of the orientationdistribution of thec axes around the stretching direction (seeFig. 15). We always observed∆φ < 5 deg. The experimentalconfiguration did not permit us to analyze accurately the az-imuthal distribution of the diffuse scattering. Nevertheless bydividing the different azimuthal curve by the initial distribu-tion corresponding to the isotropic amorphous state, we cannotice a slight anisotropy of the scattering arising before theonset of crystallization (60 s – 90 s) as indicated in Fig. 16.This seems that the development of a slight anisotropy of theamorphous polymer occurs during the strain hardening be-tweent∗ andtc.
Finally, from the ratio between the integrated intensity ofthe intense Bragg reflection and the integrated intensity ofthe diffuse amorphous scattering, we can estimate an orderof magnitude for the maximum degree of crystallinity whenthe Bragg intensity levels off. It does not exceed5%. Thusthe stretched PIB might be compared to the stretched gel inwhich the crystallites play the role of cross links betweenchains and are responsible for the high (static) Young modu-lus observed after completion of the crystallization.
4. Conclusions
In two low molecular weight PIB samples studied, no crys-tallization and no anomalous strain hardening were observedunder elongational flow conditions used. On the other handhigher molecular weight PIB samples exhibited both anoma-lous strain hardening at a critical Hencky deformationε∗ andcrystallization at a deformationεc > ε∗(2.0 < εc < 2.4). Atconstant strain rate, the delay betweent∗ the time at whichwe observe a abrupt change in the strain hardening andtcthe onset of crystallization time remains difficult to evaluatedue to a smooth change of slope in the elongational viscositycurves; however we were able to find that the ratiot∗/tc isconstant and equal to0.93. The scattering experiments re-veal that the size of the crystallites produced under stretching
Rev. Mex. Fıs. 50 (5) (2004) 506–514

514 A. GONZALEZ-ALVAREZ, M. ARELLANO, O. DIAT, J.F. LEGRAND, AND J.M. PIAU
does not change during the process, only the number of crys-tals increases up to a maximum degree of orientation of thegrowing crystalline phase in the poorly oriented amorphousphase. Nevertheless these results suggest that the strain hard-ening (corresponding to the anomalous flow) is highly cor-related to the orientation of the polymer matrix betweentcand t∗, and further experiments are needed to confirm thisaspect.
Acknowledgments
We wish to thank, Mrs. Helene Galliard and Mr. Didier Ble-ses (Laboratoire de Rheologie) for assisting in the design andmanufacture of the traction machine. We are grateful to Mr.Guy d’Assenza (Laboratoire de Spectrometrie Physique) andalso Mrs. Claudie Bourgaux (LURE) and Mr. Peter Bosecke(ESRF) for assisting in the processing of X-ray experiments.
∗. To whom correspondence should be addressed.
1. A.K. van der Vegt and P.P.A. Smit,Adv. Polym. Sci. Technol.26(1967) 313.
2. J.W.H. Kolnaar and A.J. Keller,Non-Newtonian Fluid Mech.67 (1996) 213.
3. Brill and Halle,Naturwissenschaften26 (1938) 12.
4. C.S. Fuller, C.J. Frosch, and N.R. Pape,J. Chem. Phys.62(1940) 1905.
5. T. Tanaka, Y. Chatani, and H. Tadokoro,J. Polym. Sci. Polym.Phy. Ed12 (1974) 515.
6. G.L. Slonimsky, and A.A. Askadsky,Mehanika Polymerov4(1967) 659.
7. M.J.H. Koch, J. Bordas, E. Schola, H.C. and Broecker,PolymerBull 1 (1979) 709.
8. A. Gonzalez-Alvarez, G. d’Assenza, J.F. Legrand, and J.M.Piau,C. R. Acad. Sci. Paris320(1995) 23.
9. J. Meissner,International Workshop on Extensional Flows, pa-per 4 (Mulhouse-La Bresse, 1983).
10. The transient shear viscosity has been determined indepen-dently using a Carrimed Weissenberg Rheometer.
11. N.E. Hudson, J. and Ferguson,J. non-Newtonian Fluid Mech52 (1994) 105.
12. N. Willenbacher and R. Hingmann,J. non-Newtonian FluidMech52 (1994) 163.
13. G.R. Mitchell, ”Comprehensive Polymer Science, vol IO Eds.G. Allen, J.C. Bevington, C. Booth, and C. Pride (PergamonPress, London, 1989) p. 687.
Rev. Mex. Fıs. 50 (5) (2004) 506–514