elon university poll april 5-9, 2013 state public opinion survey
TRANSCRIPT

http://www.elon.edu/elonpoll• facebook.com/elonpoll • @elonpoll
Page 1 April 5-9, 2013
Elon University Poll April 5-9, 2013 State Public Opinion Survey
Kenneth E. Fernandez, Ph.D.
Director of the Elon University Poll
Assistant Professor of Political Science
(336) 278-6438
Jason A. Husser, Ph.D.
Assistant Director of the Elon University Poll
Assistant Professor of Political Science
(985) 516-7830
John L. Robinson
Director of Communications for the Elon University Poll
Daniel J. Anderson Vice President for University Communications
Eric Townsend
Director of Elon University News Bureau

http://www.elon.edu/elonpoll• facebook.com/elonpoll • @elonpoll
Page 2 April 5-9, 2013
Table of Contents EXECUTIVE SUMMARY ............................................................................................................................................ 3
TOPLINE ....................................................................................................................................................................... 9
CROSS-TABS ............................................................................................................................................................. 22
Approval Ratings ............................................................................................................................................... 22
Education ............................................................................................................................................................. 31
Gay Marriage ....................................................................................................................................................... 37
Boy Scouts of America (BSA) ......................................................................................................................... 42
Gun Control ......................................................................................................................................................... 44
Immigration ........................................................................................................................................................ 46
Motorcycle Helmets ......................................................................................................................................... 48
Speed Limit .......................................................................................................................................................... 50
Divorce .................................................................................................................................................................. 51
Early Voting ......................................................................................................................................................... 53
Federal Tax ........................................................................................................................................................... 56
NC Tax .................................................................................................................................................................... 57
Sequestration ..................................................................................................................................................... 58
Abortion ................................................................................................................................................................ 61
Death Penalty ..................................................................................................................................................... 64
Crime ...................................................................................................................................................................... 67
Basic Methodological Information .................................................................................................................. 71
The Elon University Poll Team ........................................................................................................................... 75

http://www.elon.edu/elonpoll• facebook.com/elonpoll • @elonpoll
Page 3 April 5-9, 2013
EXECUTIVE SUMMARY
The Elon University Poll conducted a landline and cell phone survey between April 5th and
April 9th. The survey consisted of a random sample of 770 residents of North Carolina. The
survey asked respondents about their opinions on a range of issues appearing before the
North Carolina General Assembly. Topics included teacher tenure and salaries, early voting,
divorce, motorcycle helmets, interstate speed limits, school performance and the death
penalty. In addition, respondents were asked about several broad issues which are currently
on the national agenda, including gun control, gay marriage, and abortion.
North Carolina State Legislative Proposals
Early Voting
One of the more controversial proposals on the General Assembly’s agenda is the proposal to
reduce early voting from two and a half weeks to one and a half weeks. North Carolina has
had early voting since 2000 and in 2008 and 2012 more people voted during the early voting
period than on election day. Fifty-nine percent of respondents opposed this reduction in the
time allowed for early voting. Opposition to reducing early voting was mostly bipartisan. A
majority of Republicans (50 percent) and Independents (58 percent) said they were against
this change, with the greatest amount of opposition coming from Democrats (72 percent).
Seventy-five percent of African Americans opposed early voting restrictions.
Speed Limit
Several proposals on the legislative agenda have much wider appeal. Increasing the speed
limit from 70 to 75 miles per hour on certain interstates in North Carolina has the strongest
support of all the policy proposals presented to respondents. Fifty-eight percent said they
support the increase. Speed limit attitudes have a clear generational gap. Seventy percent of
18-30 year olds support the increased speed limits compared to only 35 percent of people 65
and older.

http://www.elon.edu/elonpoll• facebook.com/elonpoll • @elonpoll
Page 4 April 5-9, 2013
Motorcycle Helmet Law
The least popular legislative item presented to survey participants was the proposal to
change state law to allow motorcyclists to ride without a helmet. Seventy-four percent of
those surveyed opposed such a change. Even respondents who said they ride a motorcycle
opposed the proposal in large numbers (68 percent).
Waiting Period for Divorce
The state legislative proposal to extend the waiting period for a divorce from one year to two
years was also met with skepticism. Almost 69 percent of those sampled said they were
against this change. Women and older respondents tended to be even more strongly
opposed to this policy proposal.
Teacher Tenure, Salaries and School Performance
The North Carolina Senate is deliberating on a bill that would end tenure as it is currently
applied to public school teachers K-12). When asked, most respondents in the survey said
they were opposed to giving teachers tenure after a four-year trial period. A majority of
respondents who identified as Democrats (58 percent) supported tenure for teachers, but
Independents (64 percent) and Republicans (66 percent) generally opposed tenure. This may
not be good news for teachers, but educators in North Carolina can take some solace in
knowing that residents have a good idea as to how much teacher salaries are and believe
teachers are not paid enough. Respondents were first asked if they felt public school teachers
were paid too much, too little or about right. Seventy-four percent said teachers were paid
too little. Respondents were then asked to guess what the starting annual salary of a public
(K-12) school teacher is in North Carolina. Most respondents gave an estimate near the state
average of approximately $30,800. This suggests that respondents are aware of what a public
school teacher actually makes and believe such compensation is inadequate. Even those who
wildly overestimated teacher pay thought teachers in North Carolina were paid too
little. Respondents were also asked to evaluate their local public schools by giving them a
letter grade (A through F). Over 50% gave their community schools a letter grade of B or
betterand approximately 5% gave their local schools a failing grade of F.

http://www.elon.edu/elonpoll• facebook.com/elonpoll • @elonpoll
Page 5 April 5-9, 2013
Death Penalty
The North Carolina Senate voted to repeal the Racial Justice Act on April 3, 2013. The Racial
Justice Act became law in 2009 and allows defendants sentenced to death to appeal their
sentence and have it commuted to life without parole if they are able to prove race was factor
in the sentencing process. The current survey did not ask respondents about their attitudes
toward the Racial Justice Act and proposal to repeal the act. Instead, respondents were first
asked if they supported the death penalty for people who commit murder and then they
were asked if they believed the death penalty was applied fairly or unfairly in the country (not
the state). Over 60 percent of those surveyed said they are in favor of the death penalty and
over 48 percent said it was applied fairly in the country. Opinions on the death penalty are
closely associated with race and partisan ties. Democrats are somewhat divided, but self-
identified Democrats are less supportive of the death penalty (44 percent), while 86 percent
of Republicans and 62 percent of independents favor the death penalty. Sixty-nine percent of
whites support the death penalty, compared to 41 percent of African Americans. Over half of
Democrats believe the death penalty is unfairly applied in the country, but over half of
independents (54 percent) and 63 percent of Republicans believe it is applied fairly in the
country. Fifty-nine percent of African Americans feel the death penalty is applied unfairly,
compared to only 33 percent of whites who feel the same way. Those who perceived crime as
increasing in their local area were 15 points more supportive of the death penalty than those
who thought local crime was decreasing.
State and National Issues: Gun Control, Gay Marriage, and Abortion
In addition to asking North Carolinians about proposals being debated in the state legislature,
we asked about more general topics of state and national interest. These include gun control,
gay marriage, abortion, immigration, taxes and spending cuts.
Gun Control

http://www.elon.edu/elonpoll• facebook.com/elonpoll • @elonpoll
Page 6 April 5-9, 2013
In a February survey the Elon University Poll found wide support for gun control policies such
as background checks and waiting periods. In this survey respondents were asked about their
general feelings toward restrictions on handguns. Those sampled were asked if they agreed
or disagreed with the following statement: “There should be more legal restrictions on
handguns in our society.” Almost 57 percent said they agreed with the statement and 40
percent disagreed. Eighty percent of Democrats agreed that there should be more
restrictions on handguns, compared to 53 percent of Independents and 37 percent of
Republicans.
Gay Marriage
Overall respondents were divided on the issue of gay marriage with 46 percent of those
surveyed saying they oppose gay marriage, 43 percent saying they support it, and almost 11
percent saying they didn’t know or had no opinion. Only 21 percent of Republicans support
same-sex marriage, while almost half (49 percent) of Independents and 57 percent of
Democrats support gay marriage. Women and younger individuals tended to be more
supportive of gay marriage, but African Americans were less supportive (with 53 percent
opposing same-sex marriage). A follow-up question was asked to each respondent as to
whether they had always supported or opposed gay marriage or had changed their mind.
Thirteen percent of respondents stated they had changed their minds. Of those 13 percent
almost all had changed their mind in favor of gay marriage. Respondents were also asked if
they had a close friend or relative who is gay or lesbian. Only 30 percent of those without a
gay or lesbian friend or relative supported gay marriage compared to 49 percent support
among those with a gay or lesbian friend or relative. Respondents were also asked about
whether the Boy Scouts of America should continue its ban on openly gay members or end its
ban. Although a plurality of those surveyed opposed gay marriage, most respondents felt the
Boy Scouts of America should end its ban on gay members (49%).
Abortion
Respondents were asked if they thought North Carolina should make access to an abortion
more difficult or less difficult. Forty-two percent said the state should make access more

http://www.elon.edu/elonpoll• facebook.com/elonpoll • @elonpoll
Page 7 April 5-9, 2013
difficult, 38 percent believed access should be less difficult. Over half of Democrats (52
percent) think access should be made less difficult, compared to 36 percent of Independents
and 19 percent of Republicans. Women were divided, with 39 percent saying access to
abortion should be more difficult and 41 percent saying less difficult. Seventy-three percent
of white born-again Christians who go to church regularly supported more restrictions on
abortions.
Immigration
In February the Elon University Poll found that a majority (51 percent) of North Carolina
Residents considered immigrants a benefit to the state. In contrast, 38percent of respondents
felt immigrants were a burden. This recent survey found attitudes toward immigrants
improved slightly with 53 percent of those surveyed saying immigrants are a benefit to North
Carolina and 36 percent stating they are a burden. Support for immigration reform that
includes a pathway to citizenship remains high. Eighty percent of respondents in both the
February and April poll said they support a program which provides undocumented
immigrants a pathway to become U.S. citizens.
Taxing and Spending
Taxing and spending is always a major concern among taxpayers, voters, and elected officials.
Tax day and the sequestration that began on March 1st have made the issue even more
salient. Respondents were asked to consider what they get from the federal government, and
then answer whether they felt they paid more than their fair share of taxes, less than their fair
share, or about the right amount. It may not come as a surprise to some that most survey
participants said they paid more than their fair share of taxes (49 percent), but almost 46
percent said they paid about the right amount, while less than 3 percent said they paid less
than their fair share. In terms of spending cuts, respondents were divided in their assessment
of sequestration. Twenty-two percent said the automatic cuts were good for the country,
almost 36 percent said it was bad for the country, and 39 percent were not sure or didn’t
know. When asked if sequestration was good or bad for them personally 13 percent said it
was a good thing for them personally, 25 percent said it was bad for them, and over 44
http://www.elon.edu/elonpoll• facebook.com/elonpoll • @elonpoll
Page 8 April 5-9, 2013
percent said they didn’t know. Republicans were more likely to say sequestration was good
for the country (30 percent) compared to only 14 percent of Democrats.
Approval Rating of Elected Officials
The survey asked residents if they approved or disapproved of the job performance of the
president, governor, Congress, the North Carolina General Assembly and North Carolina’s two
U.S. Senators (Richard Burr and Kay Hagan). Results of those survey items along with results
for all of the issues discussed above can be found in the report below. A separate executive
summary of the approval ratings can be found in a separate report released April 12, 2013, at:
http://www.elon.edu/e-web/elonpoll/041213.xhtml. An elaboration of the methodology
used by the Elon University Poll can be found at the end of this report.
Dr. Kenneth E. Fernandez and Dr. Jason A. Husser

http://www.elon.edu/elonpoll• facebook.com/elonpoll • @elonpoll
Page 9 April 5-9, 2013
TOPLINE President Approval Do you [approve or disapprove] of the way Barack Obama is handling his job as president? Approve ................................................................. 349 ...................................................................... 45.3% Disapprove ........................................................... 356 ...................................................................... 46.2% Don't know ............................................................ 59 .......................................................................... 7.6% Refused .................................................................... 6 ........................................................................... 0.8% N= ............................................................................ 770 .................................................................... 100.0% Congress Approval Do you [approve or disapprove] of the way Congress is doing its job? Approve .................................................................. 95 ....................................................................... 12.4% Disapprove ........................................................... 600 ...................................................................... 77.9% Don't know ............................................................ 71 .......................................................................... 9.2% Refused .................................................................... 4 ........................................................................... 0.5% N= ............................................................................ 770 .................................................................... 100.0% Governor Approval Do you [approve or disapprove] of the way Pat McCrory is handling his job as governor? Approve ................................................................. 355 ...................................................................... 46.1% Disapprove ........................................................... 193 ...................................................................... 25.0% Don't know ........................................................... 213 ...................................................................... 27.6% Refused .................................................................... 9 ........................................................................... 1.2% N= ............................................................................ 770 .................................................................... 100.0% General Assembly Approval What about the state legislature in Raleigh? Do you [approve or disapprove] of the way the North Carolina General Assembly is doing its job? Approve ................................................................. 283 ...................................................................... 36.7% Disapprove ........................................................... 299 ...................................................................... 38.8% Don't know ........................................................... 186 ...................................................................... 24.1% Refused .................................................................... 3 ........................................................................... 0.4% N= ............................................................................ 770 .................................................................... 100.0%

http://www.elon.edu/elonpoll• facebook.com/elonpoll • @elonpoll
Page 10 April 5-9, 2013
Hagan Approval Do you [approve or disapprove] of the way Kay Hagan is handling her job as US Senator? Approve ................................................................. 308 ...................................................................... 40.0% Disapprove ........................................................... 252 ...................................................................... 32.7% Don't know ........................................................... 207 ...................................................................... 26.9% Refused .................................................................... 3 ........................................................................... 0.4% N= ............................................................................ 770 .................................................................... 100.0% Burr Approval Do you [approve or disapprove] of the way Richard Burr is handling her job as US Senator? Approve ................................................................. 302 ...................................................................... 39.2% Disapprove ........................................................... 202 ...................................................................... 26.2% Don't know ........................................................... 264 ...................................................................... 34.3% Refused .................................................................... 2 ........................................................................... 0.2% N= ............................................................................ 770 .................................................................... 100.0%
Tenure North Carolina has a teacher 'tenure' law which means that a teacher, after a 4 year trial period, cannot be fired except by some kind of legal procedure. Are you for giving teachers tenure or are you against tenure? Support .................................................................. 306 ...................................................................... 39.7% Oppose ................................................................... 412 ...................................................................... 53.5% Don’t know / No Opinion ................................. 52 .......................................................................... 6.8% N= ............................................................................ 770 .................................................................... 100.0% Teacher Pay In general, do you think teachers in North Carolina K through 12 public schools are paid too much, too little, or about right. Too much ............................................................... 15 .......................................................................... 2.0% About right ........................................................... 130 ...................................................................... 16.9% Too little ................................................................. 567 ...................................................................... 73.7% Don't know ............................................................ 57 .......................................................................... 7.5% N= ............................................................................ 770 .................................................................... 100.0%

http://www.elon.edu/elonpoll• facebook.com/elonpoll • @elonpoll
Page 11 April 5-9, 2013
Average Salary What is your best guess as to the starting salary of a public school teacher in North Carolina? Less than $15,000 ................................................. 9 ........................................................................... 1.1% $15,000 - $19,999 ................................................ 10 .......................................................................... 1.4% $20,000 - $24,999 ................................................ 61 .......................................................................... 7.9% $25,000 - $29,999 ............................................... 171 ...................................................................... 22.3% $30,000 - $34,999 ............................................... 173 ...................................................................... 22.5% $35,000 - $39,999 ............................................... 129 ...................................................................... 16.8% $40,000 - $44,999 ................................................ 48 .......................................................................... 6.3% $45,000 - $49,999 ................................................ 18 .......................................................................... 2.4% $50,000 - $54,999 ................................................ 14 .......................................................................... 1.8% $55,000 - $59,999 ................................................. 2 ........................................................................... 0.3% $60,000 - $64,999 ................................................. 3 ........................................................................... 0.4% $75, 000 or more .................................................. 3 ........................................................................... 0.3% Don't Know ........................................................... 128 ...................................................................... 16.6% N= ............................................................................ 770 .................................................................... 100.0% School Grade Students are often given the grades A, B, C, D, or F to denote the quality of their work. Suppose the public schools themselves, in your community, were graded in the same way. What grade would you give your community’s public schools —A, B, C, D, or F? A ................................................................................ 88 ....................................................................... 11.4% B ................................................................................ 300 ...................................................................... 38.9% C ................................................................................ 204 ...................................................................... 26.5% D ................................................................................ 68 .......................................................................... 8.8% F ................................................................................. 36 .......................................................................... 4.7% Don't Know ............................................................ 72 .......................................................................... 9.4% Refused .................................................................... 3 ........................................................................... 0.3% N= ............................................................................ 770 .................................................................... 100.0% Gay Marriage Do you support or oppose gay [same-sex] marriage? Support .................................................................. 332 ...................................................................... 43.2% Oppose ................................................................... 353 ...................................................................... 45.9% Don’t know / No Opinion ................................. 81 ....................................................................... 10.5% Refused .................................................................... 4 ........................................................................... 0.5% N= ............................................................................ 770 .................................................................... 100.0%
http://www.elon.edu/elonpoll• facebook.com/elonpoll • @elonpoll
Page 12 April 5-9, 2013
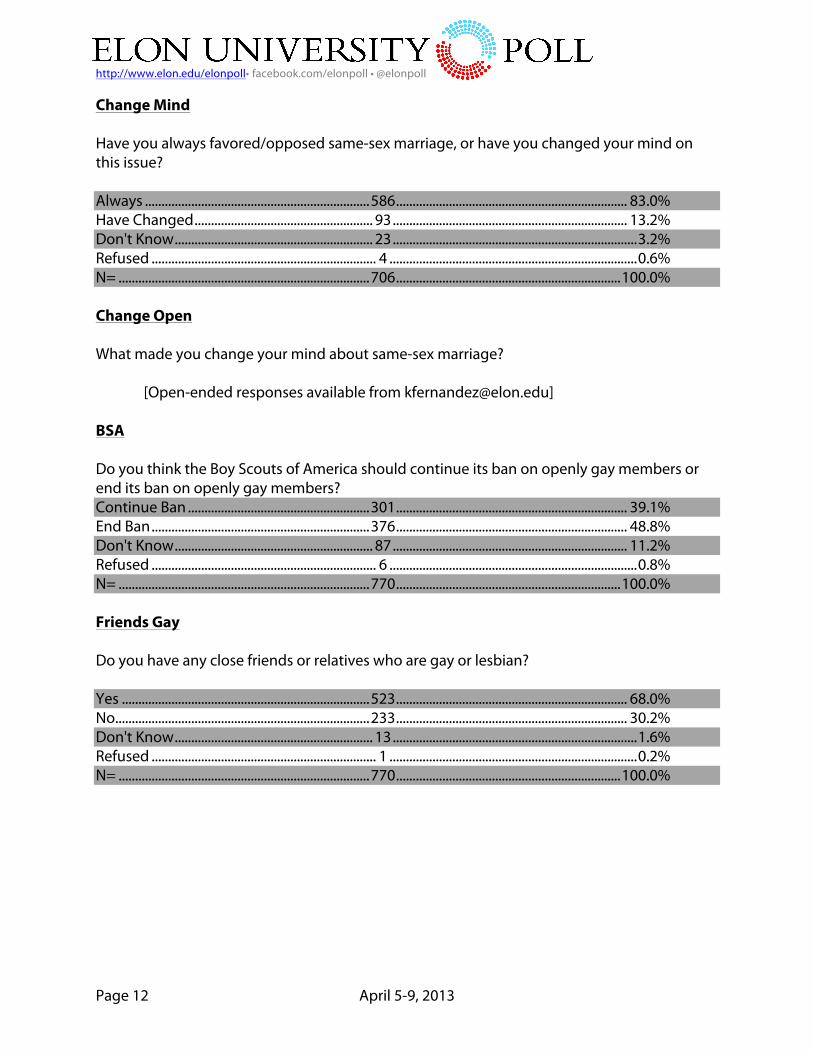
Change Mind Have you always favored/opposed same-sex marriage, or have you changed your mind on this issue? Always .................................................................... 586 ...................................................................... 83.0% Have Changed ...................................................... 93 ....................................................................... 13.2% Don't Know ............................................................ 23 .......................................................................... 3.2% Refused .................................................................... 4 ........................................................................... 0.6% N= ............................................................................ 706 .................................................................... 100.0% Change Open What made you change your mind about same-sex marriage?
[Open-ended responses available from [email protected]] BSA Do you think the Boy Scouts of America should continue its ban on openly gay members or end its ban on openly gay members? Continue Ban ....................................................... 301 ...................................................................... 39.1% End Ban .................................................................. 376 ...................................................................... 48.8% Don't Know ............................................................ 87 ....................................................................... 11.2% Refused .................................................................... 6 ........................................................................... 0.8% N= ............................................................................ 770 .................................................................... 100.0% Friends Gay Do you have any close friends or relatives who are gay or lesbian? Yes ........................................................................... 523 ...................................................................... 68.0% No ............................................................................. 233 ...................................................................... 30.2% Don't Know ............................................................ 13 .......................................................................... 1.6% Refused .................................................................... 1 ........................................................................... 0.2% N= ............................................................................ 770 .................................................................... 100.0%

http://www.elon.edu/elonpoll• facebook.com/elonpoll • @elonpoll
Page 13 April 5-9, 2013
Gun Control Please tell me whether you agree or disagree with the following statement: “There should be more legal restrictions on handguns in our society.” Agree ...................................................................... 438 ...................................................................... 56.8% Disagree ................................................................. 304 ...................................................................... 39.5% Neither agree or disagree (volunteered) .... 15 .......................................................................... 2.0% Don't Know ............................................................ 13 .......................................................................... 1.6% N= ............................................................................ 770 .................................................................... 100.0% Immigrants: Burden or Benefit Now moving to the issue of immigration…..Please indicate which statement comes closest to your own view, even if neither is exactly right. 1) Immigrants today are a benefit to North Carolina because of their hard work and job skills or 2) Immigrants today are a burden to North Carolina because they use public services. [1 & 2 are rotated] Benefit .................................................................... 405 ...................................................................... 53.1% Burden .................................................................... 276 ...................................................................... 36.2% Don't Know ............................................................ 81 ....................................................................... 10.7% N= ............................................................................ 763 .................................................................... 100.0% Pathway to Citizenship Would you support or oppose a program that provided [undocumented/illegal] immigrants living in the United States a pathway to become citizens if they meet certain requirements such as a background check and paying any fines and taxes? Support .................................................................. 615 ...................................................................... 79.8% Oppose ................................................................... 120 ...................................................................... 15.6% Don’t know / No Opinion ................................. 31 .......................................................................... 4.1% Refused .................................................................... 4 ........................................................................... 0.5% N= ............................................................................ 770 .................................................................... 100.0% Friends Immigrant Do you have any friends or relatives who are recent immigrants? Yes ........................................................................... 200 ...................................................................... 26.0% No ............................................................................. 564 ...................................................................... 73.3% Don't Know ............................................................. 4 ........................................................................... 0.5% Refused .................................................................... 2 ........................................................................... 0.2% N= ............................................................................ 770 .................................................................... 100.0%

http://www.elon.edu/elonpoll• facebook.com/elonpoll • @elonpoll
Page 14 April 5-9, 2013
Motorcycle Do you support or oppose changing the state law to allow motorcyclists to ride without a helmet? Support .................................................................. 164 ...................................................................... 21.2% Oppose ................................................................... 569 ...................................................................... 73.9% Don’t know / No Opinion ................................. 36 .......................................................................... 4.7% Refused .................................................................... 1 ........................................................................... 0.1% N= ............................................................................ 770 .................................................................... 100.0% Ride Motorcycle Do you ride a motorcycle? Yes ........................................................................... 148 ...................................................................... 19.2% No ............................................................................. 621 ...................................................................... 80.7% Don't Know ............................................................. 1 ........................................................................... 0.1% N= ............................................................................ 770 .................................................................... 100.0% Speed Limit Do you support or oppose increasing the speed limit to 75 miles per hour on certain interstates in North Carolina? Support .................................................................. 444 ...................................................................... 57.7% Oppose ................................................................... 307 ...................................................................... 39.9% Don’t know / No Opinion ................................. 17 .......................................................................... 2.2% Refused .................................................................... 1 ........................................................................... 0.2% N= ............................................................................ 770 .................................................................... 100.0% Divorce A state legislative proposal would increase the time a couple must wait to get a divorce from one year to two years. Do you support or oppose this change? Support .................................................................. 180 ...................................................................... 23.4% Oppose ................................................................... 531 ...................................................................... 68.9% Don’t know / No Opinion ................................. 60 .......................................................................... 7.7% N= ............................................................................ 770 .................................................................... 100.0%

http://www.elon.edu/elonpoll• facebook.com/elonpoll • @elonpoll
Page 15 April 5-9, 2013
Early Voting A state legislative proposal would reduce early voting in North Carolina from two and a half weeks to one and a half weeks. Do you support or oppose this proposal? Support .................................................................. 245 ...................................................................... 31.8% Oppose ................................................................... 453 ...................................................................... 58.8% Don’t know / No Opinion ................................. 72 .......................................................................... 9.4% N= ............................................................................ 770 .................................................................... 100.0% Tax Fair Considering what you get from the federal government, do you think you pay more than your fair share of taxes, less than your fair share, or about the right amount? I pay MORE than my fair share ....................... 375 ...................................................................... 48.8% I pay LESS than my fair share .......................... 26 .......................................................................... 3.4% I pay about the right amount ........................ 351 ...................................................................... 45.6% Don't know ............................................................ 18 .......................................................................... 2.3% N= ............................................................................ 770 .................................................................... 100.0% NC Tax Compared to other states, do you think taxes in North Carolina are higher, lower, or about the same? Higher ..................................................................... 356 ...................................................................... 46.3% Lower ...................................................................... 100 ...................................................................... 13.0% About the Same .................................................. 228 ...................................................................... 29.7% Don't know ............................................................ 86 ....................................................................... 11.1% N= ............................................................................ 770 .................................................................... 100.0% Sequester Country As you may know, automatic cuts in the federal budget –known as sequestration—went into effect on March First. All in all, do you think the sequestration is a good thing or a bad thing for the country, or don’t you know enough to say? Good thing ........................................................... 171 ...................................................................... 22.2% Bad thing ............................................................... 266 ...................................................................... 34.5% Neither/No Effect ................................................ 30 .......................................................................... 3.9% Don't know ........................................................... 300 ...................................................................... 39.0% Refused .................................................................... 3 ........................................................................... 0.3% N= ............................................................................ 770 .................................................................... 100.0%

http://www.elon.edu/elonpoll• facebook.com/elonpoll • @elonpoll
Page 16 April 5-9, 2013
Sequester Personal All in all, do you think the sequestration is a good thing or a bad thing for you personally, or don’t you know enough to say? Good thing ............................................................ 98 ....................................................................... 12.7% Bad thing ............................................................... 194 ...................................................................... 25.2% Neither/No Effect ............................................... 135 ...................................................................... 17.5% Don't know ........................................................... 341 ...................................................................... 44.3% Refused .................................................................... 2 ........................................................................... 0.3% N= ............................................................................ 770 .................................................................... 100.0% Abortion Now, thinking more generally, do you think state laws in North Carolina should make access to an abortion more difficult or less difficult? More ........................................................................ 326 ...................................................................... 42.4% Less .......................................................................... 286 ...................................................................... 37.1% About the same ................................................... 72 .......................................................................... 9.3% Don't Know ............................................................ 80 ....................................................................... 10.4% Refused .................................................................... 6 ........................................................................... 0.8% N= ............................................................................ 770 .................................................................... 100.0% Death Penalty Favor Are you in favor of the death penalty for a person convicted of murder? Yes ........................................................................... 471 ...................................................................... 61.2% No ............................................................................. 232 ...................................................................... 30.1% Don't Know ............................................................ 65 .......................................................................... 8.5% Refused .................................................................... 2 ........................................................................... 0.2% N= ............................................................................ 770 .................................................................... 100.0% Death Penalty Fairness Generally speaking, do you believe the death penalty is applied [fairly or unfairly] in this country? Fairly ........................................................................ 372 ...................................................................... 48.4% Unfairly ................................................................... 297 ...................................................................... 38.6% Don't Know ............................................................ 99 ....................................................................... 12.8% Refused .................................................................... 1 ........................................................................... 0.2% N= ............................................................................ 770 .................................................................... 100.0%

http://www.elon.edu/elonpoll• facebook.com/elonpoll • @elonpoll
Page 17 April 5-9, 2013
National Crime Perception Is there more crime in the U.S. than there was a year ago, or less? More ........................................................................ 453 ...................................................................... 58.9% Less .......................................................................... 133 ...................................................................... 17.3% About the same ................................................... 65 .......................................................................... 8.4% Don't Know ........................................................... 116 ...................................................................... 15.1% Refused .................................................................... 3 ........................................................................... 0.3% N= ............................................................................ 770 .................................................................... 100.0% Local Crime Perception Is there more crime in your area than there was a year ago, or less? More ........................................................................ 302 ...................................................................... 39.2% Less .......................................................................... 239 ...................................................................... 31.0% About the same .................................................. 164 ...................................................................... 21.3% Don't Know ............................................................ 63 .......................................................................... 8.2% Refused .................................................................... 2 ........................................................................... 0.3% N= ............................................................................ 770 .................................................................... 100.0% Party ID Generally speaking, do you usually think of yourself as a Democrat, Republican, Independent, or something else?
(If Party ID=1) Would you call yourself a strong Democrat or not a strong Democrat? (If Party ID = 2) Would you call yourself a strong Republican or not a strong Republican? (If Party ID = 3, 4, or 8) Do you think of yourself as closer to the Republican Party or Democratic Party?
Strong Democrat ................................................ 162 ...................................................................... 21.4% Democrat ............................................................... 81 ....................................................................... 10.7% Independent - Leaning Democrat ................ 74 .......................................................................... 9.8% Independent ......................................................... 53 .......................................................................... 7.0% Independent - Leaning Republican .............. 93 ....................................................................... 12.3% Republican ............................................................. 84 ....................................................................... 11.1% Strong Republican ............................................. 102 ...................................................................... 13.5% Don't Know ............................................................ 91 ....................................................................... 12.1% Refused ................................................................... 15 .......................................................................... 2.0% N= ............................................................................ 756 .................................................................... 100.0%

http://www.elon.edu/elonpoll• facebook.com/elonpoll • @elonpoll
Page 18 April 5-9, 2013
Party Change If you could change the policy position of your party in one area, what would that area be? Would it be government spending, abortion, gay marriage, health care, taxes, guns, immigration, or climate change? Government spending ..................................... 129 ...................................................................... 28.5% Abortion ................................................................. 34 .......................................................................... 7.5% Gay Marriage ......................................................... 42 .......................................................................... 9.2% Health Care ............................................................ 43 .......................................................................... 9.5% Taxes ........................................................................ 32 .......................................................................... 7.2% Guns ......................................................................... 24 .......................................................................... 5.4% Immigration .......................................................... 35 .......................................................................... 7.7% Climate change .................................................... 26 .......................................................................... 5.7% Other ........................................................................ 28 .......................................................................... 6.2% None/Nothing ...................................................... 25 .......................................................................... 5.6% Don’t Know ............................................................ 34 .......................................................................... 7.4% Refused .................................................................... 1 ........................................................................... 0.1% N= ............................................................................ 452 .................................................................... 100.0% Ideology When it comes to politics, do you usually think of yourself as liberal, moderate, conservative, or haven't you thought much about this?
[Branch] Would you call yourself extremely conservative or not extremely conservative? [Branch] Would you call yourself extremely liberal or not extremely liberal? [Branch] Would you call yourself slightly conservative or slightly liberal? [Branch] If you had to choose, would you consider yourself a liberal, a conservative, or a moderate?
Extremely Liberal ................................................. 42 .......................................................................... 5.5% Liberal ..................................................................... 112 ...................................................................... 14.6% Slightly Liberal ...................................................... 94 ....................................................................... 12.2% Moderate ............................................................... 101 ...................................................................... 13.2% Slightly Conservative ........................................ 124 ...................................................................... 16.2% Conservative ........................................................ 155 ...................................................................... 20.2% Extremely Conservative .................................... 80 ....................................................................... 10.4% Don't Know ............................................................ 54 .......................................................................... 7.1% Refused .................................................................... 6 ........................................................................... 0.7% N= ............................................................................ 766 .................................................................... 100.0%

http://www.elon.edu/elonpoll• facebook.com/elonpoll • @elonpoll
Page 19 April 5-9, 2013
Married Are you single, married, divorced, separated, or widowed? Single ...................................................................... 217 ...................................................................... 28.2% Married ................................................................... 394 ...................................................................... 51.2% Divorced ................................................................. 68 .......................................................................... 8.9% Separated ............................................................... 20 .......................................................................... 2.5% Widowed ................................................................ 63 .......................................................................... 8.2% Life Partner / Civil Union (volunteered) ....... 2 ........................................................................... 0.3% Don't Know ............................................................. 3 ........................................................................... 0.3% Refused .................................................................... 3 ........................................................................... 0.3% N= ............................................................................ 770 .................................................................... 100.0% Education How much school have you completed? Less than HS .......................................................... 48 .......................................................................... 6.2% High School / GED .............................................. 148 ...................................................................... 19.3% Some College/ AA / Technical ....................... 220 ...................................................................... 28.6% College Graduate ............................................... 233 ...................................................................... 30.3% Graduate School ................................................. 115 ...................................................................... 14.9% Don't Know ............................................................. 1 ........................................................................... 0.1% Refused .................................................................... 4 ........................................................................... 0.6% N= ............................................................................ 770 .................................................................... 100.0% Church Attendance Lots of things come up that keep people from attending religious services even if they want to. Thinking about your life these days, do you ever attend religious services, apart from occasional weddings, baptisms or funerals? [BRANCH] Do you go to religious services every week, almost every week, once or twice a month, a few times a year, or never? Never ...................................................................... 255 ...................................................................... 33.1% A few times a year ............................................... 93 ....................................................................... 12.0% Once or twice a month ..................................... 106 ...................................................................... 13.7% Almost every week ............................................. 87 ....................................................................... 11.3% Every week ............................................................ 224 ...................................................................... 29.1% Don't Know ............................................................. 4 ........................................................................... 0.5% Refused .................................................................... 2 ........................................................................... 0.2% N= ............................................................................ 770 .................................................................... 100.0%

http://www.elon.edu/elonpoll• facebook.com/elonpoll • @elonpoll
Page 20 April 5-9, 2013
Religion Do you consider yourself Christian, Jewish, Muslim, something else, or not religious? [BRANCH] Do you consider yourself Protestant, Catholic, Mormon, or something else? [BRANCH] Would you call yourself a born-again Christian, that is, have you personally had a conversion experience related to Jesus Christ? Born-Again Christian ......................................... 318 ...................................................................... 41.3% Other Christian .................................................... 207 ...................................................................... 26.8% Catholic ................................................................... 62 .......................................................................... 8.0% Not Religious ......................................................... 90 ....................................................................... 11.7% Other ........................................................................ 73 .......................................................................... 9.5% Don't Know ............................................................ 20 .......................................................................... 2.6% Refused .................................................................... 1 ........................................................................... 0.1% N= ............................................................................ 770 .................................................................... 100.0% Income Is your annual household income more or less than $50,000? (If = Under $50,000) Is it more or less than $25,000? (If = Over $50,000) Is it more or less than $75,000? Less than $25,000 ............................................... 125 ...................................................................... 16.2% $25,000 to $50,000 ............................................ 176 ...................................................................... 22.9% $50,000 to $75,000 ............................................ 122 ...................................................................... 15.8% More than $75,000 ............................................. 282 ...................................................................... 36.6% Don't Know ............................................................ 44 .......................................................................... 5.7% Refused ................................................................... 22 .......................................................................... 2.8% N= ............................................................................ 770 .................................................................... 100.0% Southerner Are you originally from North Carolina? [BRANCH] Are you originally from the South? Non-Southern Native ........................................ 243 ...................................................................... 31.6% NC Native .............................................................. 428 ...................................................................... 55.6% Southern Native ................................................... 98 ....................................................................... 12.8% N= ............................................................................ 770 .................................................................... 100.0%
http://www.elon.edu/elonpoll• facebook.com/elonpoll • @elonpoll
Page 21 April 5-9, 2013
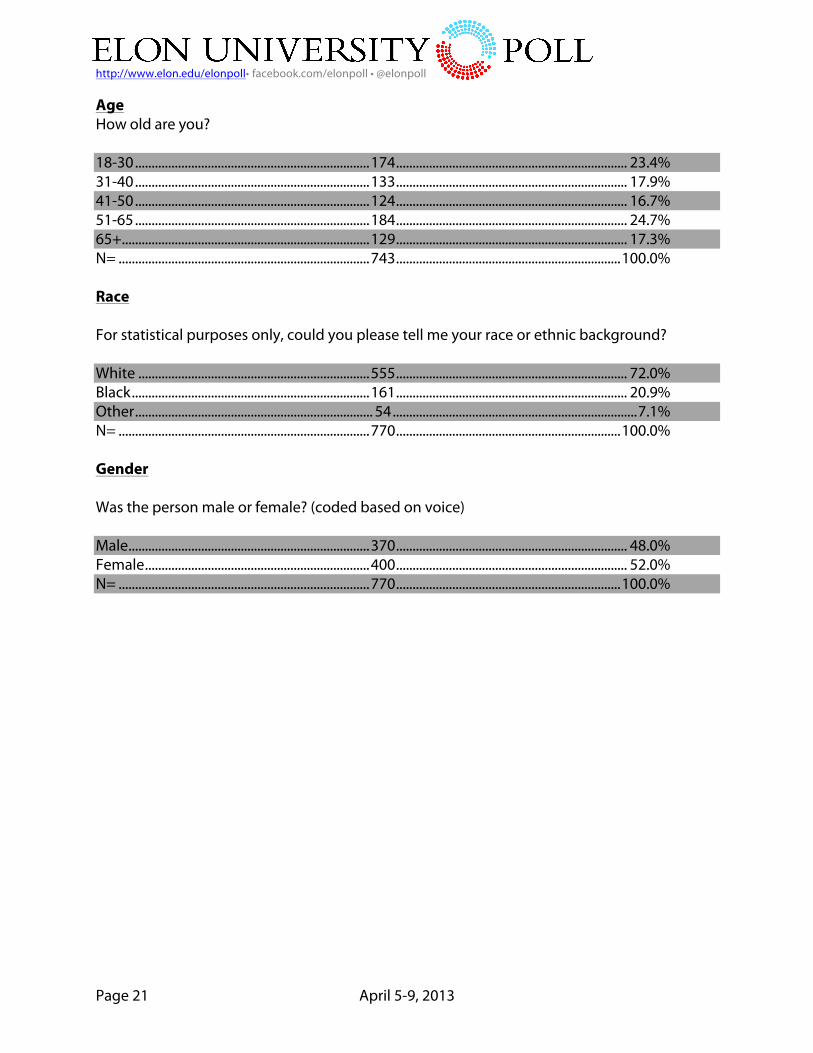
Age How old are you? 18-30 ....................................................................... 174 ...................................................................... 23.4% 31-40 ....................................................................... 133 ...................................................................... 17.9% 41-50 ....................................................................... 124 ...................................................................... 16.7% 51-65 ....................................................................... 184 ...................................................................... 24.7% 65+ ........................................................................... 129 ...................................................................... 17.3% N= ............................................................................ 743 .................................................................... 100.0% Race For statistical purposes only, could you please tell me your race or ethnic background? White ...................................................................... 555 ...................................................................... 72.0% Black ........................................................................ 161 ...................................................................... 20.9% Other ........................................................................ 54 .......................................................................... 7.1% N= ............................................................................ 770 .................................................................... 100.0% Gender Was the person male or female? (coded based on voice) Male ......................................................................... 370 ...................................................................... 48.0% Female .................................................................... 400 ...................................................................... 52.0% N= ............................................................................ 770 .................................................................... 100.0%

http://www.elon.edu/elonpoll• facebook.com/elonpoll • @elonpoll
Page 22 April 5-9, 2013
CROSS-‐TABS
Approval Ratings President Approval and Party Identification Approve Disapprove Don't know Refused Total % % % % % Democrats 87 8 5 0 100 Independents 38 52 9 1 100 Republicans 7 89 4 0 100 Don't Know / Refused 37 45 17 1 100 Total 46 46 8 1 100 President Approval and Income Approve Disapprove Don't know Refused Total % % % % % Less than $25,000 57 33 8 2 100 $25,000 to $50,000 52 39 9 0 100 $50,000 to $75,000 39 53 8 0 100 More than $75,000 40 55 5 0 100 Don't Know 46 42 13 0 100 Refused 37 40 11 13 100 Total 45 46 8 1 100 President Approval and Age Approve Disapprove Don't know Refused Total % % % % % 18-30 57 33 9 0 100 31-40 45 49 6 0 100 41-50 42 52 5 1 100 51-65 41 49 10 1 100 65+ 40 52 7 1 100 Total 45 46 8 1 100

http://www.elon.edu/elonpoll• facebook.com/elonpoll • @elonpoll
Page 23 April 5-9, 2013
President Approval and Race Approve Disapprove Don't know Refused Total % % % % % White 33 59 7 1 100 Black 84 10 5 1 100 Other 54 26 18 2 100 Total 45 46 8 1 100 President Approval and Gender Approve Disapprove Don't know Refused Total % % % % % Male 41 50 8 0 100 Female 49 42 7 1 100 Total 45 46 8 1 100

http://www.elon.edu/elonpoll• facebook.com/elonpoll • @elonpoll
Page 24 April 5-9, 2013
Do you [approve or disapprove] of the way Congress is doing its job? Congress Approval and Party Identification Approve Disapprove Don't know Refused Total % % % % % Democrats 14 77 8 1 100 Independents 12 80 8 0 100 Republicans 10 81 8 0 100 Don't Know / Refused 17 69 14 0 100 Total 13 78 9 1 100 Congress Approval and Income Approve Disapprove Don't know Refused Total % % % % % Less than $25,000 20 63 17 1 100 $25,000 to $50,000 15 74 10 1 100 $50,000 to $75,000 7 87 6 0 100 More than $75,000 7 87 5 0 100 Don't Know 23 54 24 0 100 Refused 21 76 4 0 100 Total 12 78 9 1 100 Congress Approval and Age Approve Disapprove Don't know Refused Total % % % % % 18-30 26 63 11 0 100 31-40 7 83 11 0 100 41-50 9 84 5 2 100 51-65 8 83 8 1 100 65+ 7 82 12 0 100 Total 12 78 9 1 100

http://www.elon.edu/elonpoll• facebook.com/elonpoll • @elonpoll
Page 25 April 5-9, 2013
Congress Approval and Race Approve Disapprove Don't know Refused Total % % % % % White 9 81 9 0 100 Black 19 73 7 1 100 Other 25 57 18 0 100 Total 12 78 9 1 100 Congress Approval and Gender Approve Disapprove Don't know Refused Total % % % % % Male 10 81 8 0 100 Female 14 75 10 1 100 Total 12 78 9 1 100
Do you [approve or disapprove] of the way Pat McCrory is handling his job as governor?
McCrory Approval and Party Identification Approve Disapprove Don't know Refused Total % % % % % Democrats 31 44 23 1 100 Independents 49 17 33 1 100 Republicans 66 11 22 1 100 Don't Know / Refused 40 24 35 1 100 Total 46 25 27 1 100 McCrory Approval and Income Approve Disapprove Don't know Refused Total % % % % % Less than $25,000 32 29 38 1 100 $25,000 to $50,000 43 31 26 0 100 $50,000 to $75,000 54 27 18 1 100 More than $75,000 52 21 27 0 100 Don't Know 41 17 35 7 100 Refused 43 13 35 9 100 Total 46 25 28 1 100

http://www.elon.edu/elonpoll• facebook.com/elonpoll • @elonpoll
Page 26 April 5-9, 2013
McCrory Approval and Age Approve Disapprove Don't know Refused Total % % % % % 18-30 48 24 27 1 100 31-40 46 27 27 0 100 41-50 48 27 25 0 100 51-65 44 27 28 2 100 65+ 44 23 32 1 100 Total 46 26 28 1 100 McCrory Approval and Race Approve Disapprove Don't know Refused Total % % % % % White 49 21 29 1 100 Black 40 34 25 1 100 Other 31 43 26 0 100 Total 46 25 28 1 100 McCrory Approval and Gender Approve Disapprove Don't know Refused Total % % % % % Male 50 21 29 0 100 Female 42 29 27 2 100 Total 46 25 28 1 100

http://www.elon.edu/elonpoll• facebook.com/elonpoll • @elonpoll
Page 27 April 5-9, 2013
What about the state legislature in Raleigh? Do you [approve or disapprove] of the way the North Carolina General Assembly is doing its job? General Assembly Approval and Party Identification Approve Disapprove Don't know Refused Total % % % % % Democrats 30 50 20 0 100 Independents 38 40 22 0 100 Republicans 46 25 29 0 100 Don't Know / Refused 35 36 30 0 100 Total 37 39 24 0 100 General Assembly Approval and Income Approve Disapprove Don't know Refused Total % % % % % Less than $25,000 35 30 34 1 100 $25,000 to $50,000 35 43 22 0 100 $50,000 to $75,000 42 36 22 0 100 More than $75,000 36 45 19 0 100 Don't Know 45 21 34 0 100 Refused 23 30 47 0 100 Total 37 39 24 0 100 General Assembly Approval and Age Approve Disapprove Don't know Refused Total % % % % % 18-30 49 27 24 0 100 31-40 27 50 23 0 100 41-50 39 46 15 0 100 51-65 31 42 25 2 100 65+ 33 35 32 0 100 Total 37 39 24 0 100

http://www.elon.edu/elonpoll• facebook.com/elonpoll • @elonpoll
Page 28 April 5-9, 2013
General Assembly Approval and Race Approve Disapprove Don't know Refused Total % % % % % White 37 37 26 0 100 Black 35 48 16 1 100 Other 43 27 30 0 100 Total 37 39 24 0 100 General Assembly Approval and Gender Approve Disapprove Don't know Refused Total % % % % % Male 42 39 19 0 100 Female 32 38 29 0 100 Total 37 39 24 0 100
Do you [approve or disapprove] of the way Kay Hagan is handling her job as US Senator?
Hagan Approval and Party Identification Approve Disapprove Don't know Refused Total % % % % % Democrats 59 19 22 0 100 Independents 38 36 25 0 100 Republicans 24 49 26 1 100 Don't Know / Refused 31 29 40 0 100 Total 40 33 26 0 100 Hagan Approval and Income Approve Disapprove Don't know Refused Total % % % % % Less than $25,000 44 25 30 1 100 $25,000 to $50,000 42 28 31 0 100 $50,000 to $75,000 35 38 27 0 100 More than $75,000 37 40 23 0 100 Don't Know 61 14 22 4 100 Refused 23 34 43 0 100 Total 40 33 27 0 100

http://www.elon.edu/elonpoll• facebook.com/elonpoll • @elonpoll
Page 29 April 5-9, 2013
Hagan Approval and Age Approve Disapprove Don't know Refused Total % % % % % 18-30 39 25 36 0 100 31-40 40 37 23 0 100 41-50 39 34 27 0 100 51-65 40 35 25 1 100 65+ 44 34 22 0 100 Total 40 33 27 0 100 Hagan Approval and Race Approve Disapprove Don't know Refused Total % % % % % White 34 37 29 0 100 Black 57 24 18 1 100 Other 51 14 35 0 100 Total 40 33 27 0 100 Hagan Approval and Gender Approve Disapprove Don't know Refused Total % % % % % Male 37 37 26 0 100 Female 42 29 28 1 100 Total 40 33 27 0 100
Do you [approve or disapprove] of the way Richard Burr is handling her job as US Senator? Burr Approval and Party Identification Approve Disapprove Don't know Refused Total % % % % % Democrats 28 37 35 0 100 Independents 42 24 34 0 100 Republicans 54 17 29 0 100 Don't Know / Refused 34 23 42 0 100 Total 39 26 34 0 100

http://www.elon.edu/elonpoll• facebook.com/elonpoll • @elonpoll
Page 30 April 5-9, 2013
Burr Approval and Income Approve Disapprove Don't know Refused Total % % % % % Less than $25,000 31 28 40 1 100 $25,000 to $50,000 39 27 33 0 100 $50,000 to $75,000 42 27 31 0 100 More than $75,000 42 28 30 0 100 Don't Know 39 11 50 0 100 Refused 35 15 50 0 100 Total 39 26 34 0 100
Burr Approval and Age Approve Disapprove Don't know Refused Total % % % % % 18-30 43 25 32 0 100 31-40 37 22 41 0 100 41-50 39 31 30 0 100 51-65 37 31 31 1 100 65+ 39 23 38 0 100 Total 39 27 34 0 100 Burr Approval and Race Approve Disapprove Don't know Refused Total % % % % % White 41 23 36 0 100 Black 37 35 27 1 100 Other 30 32 38 0 100 Total 39 26 34 0 100 Burr Approval and Gender Approve Disapprove Don't know Refused Total % % % % % Male 43 25 31 0 100 Female 35 27 37 0 100 Total 39 26 34 0 100

http://www.elon.edu/elonpoll• facebook.com/elonpoll • @elonpoll
Page 31 April 5-9, 2013
Education North Carolina has a teacher 'tenure' law which means that a teacher, after a 4 year trial period, cannot be fired except by some kind of legal procedure. Are you for giving teachers tenure or are you against tenure? Tenure and Party Identification Support Oppose DK Total % % % % Democrats 58 37 5 100 Independents 28 64 7 100 Republicans 31 66 3 100 Don't Know / Refused 39 47 14 100 Total 40 54 6 100 Tenure and Income Support Oppose DK Total % % % % Less than $25,000 51 34 14 100 $25,000 to $50,000 50 44 5 100 $50,000 to $75,000 36 57 6 100 More than $75,000 29 68 3 100 Don't Know 48 41 11 100 Refused 27 51 22 100 Total 40 53 7 100 Tenure and Age Support Oppose DK Total % % % % 18-30 51 42 7 100 31-40 37 61 2 100 41-50 36 61 3 100 51-65 32 60 8 100 65+ 39 47 14 100 Total 39 54 7 100

http://www.elon.edu/elonpoll• facebook.com/elonpoll • @elonpoll
Page 32 April 5-9, 2013
Tenure and Race Support Oppose DK Total % % % % White 34 60 6 100 Black 54 36 10 100 Other 55 35 9 100 Total 40 53 7 100 Tenure and Gender Support Oppose DK Total % % % % Male 38 55 7 100 Female 41 52 7 100 Total 40 53 7 100 Tenure and Education Support Oppose DK Total % % % % Less than HS 42 37 21 100 High School / GED 51 42 7 100 Some College/ AA / Technical 37 57 5 100 College Graduate 41 55 4 100 Graduate School 25 66 9 100 DK 100 0 0 100 Refused 58 18 24 100 Total 40 53 7 100
http://www.elon.edu/elonpoll• facebook.com/elonpoll • @elonpoll
Page 33 April 5-9, 2013
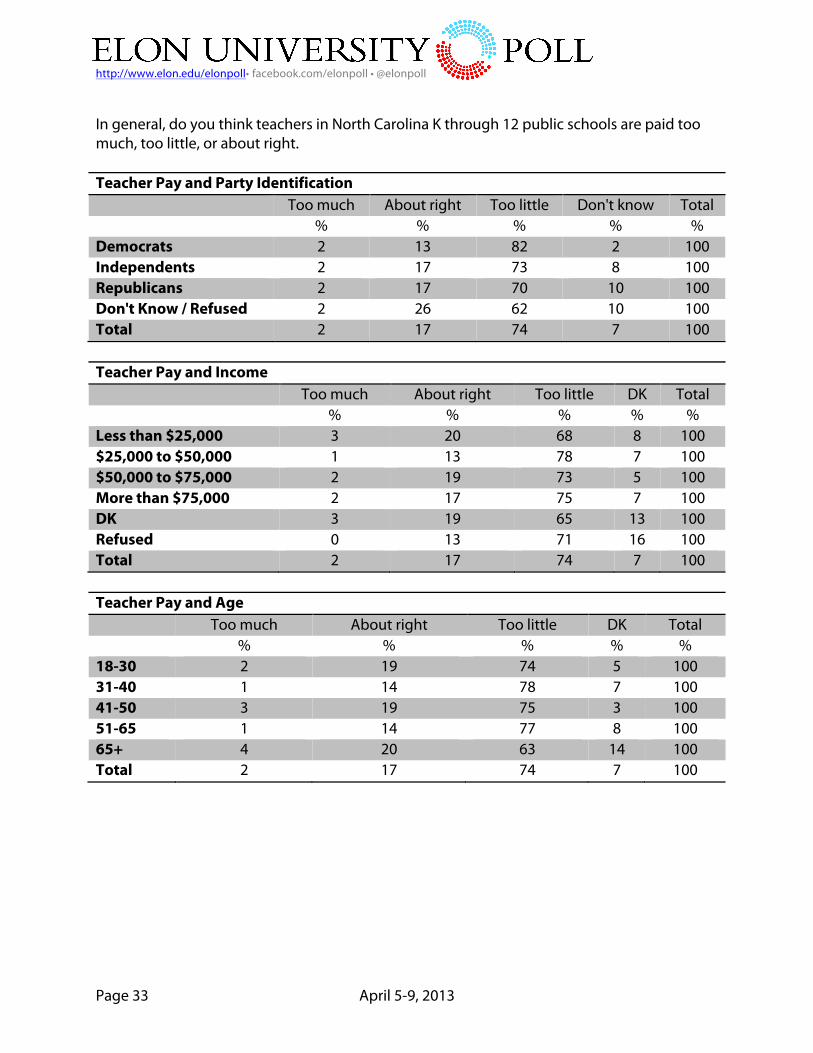
In general, do you think teachers in North Carolina K through 12 public schools are paid too much, too little, or about right. Teacher Pay and Party Identification Too much About right Too little Don't know Total % % % % % Democrats 2 13 82 2 100 Independents 2 17 73 8 100 Republicans 2 17 70 10 100 Don't Know / Refused 2 26 62 10 100 Total 2 17 74 7 100 Teacher Pay and Income Too much About right Too little DK Total % % % % % Less than $25,000 3 20 68 8 100 $25,000 to $50,000 1 13 78 7 100 $50,000 to $75,000 2 19 73 5 100 More than $75,000 2 17 75 7 100 DK 3 19 65 13 100 Refused 0 13 71 16 100 Total 2 17 74 7 100 Teacher Pay and Age Too much About right Too little DK Total % % % % % 18-30 2 19 74 5 100 31-40 1 14 78 7 100 41-50 3 19 75 3 100 51-65 1 14 77 8 100 65+ 4 20 63 14 100 Total 2 17 74 7 100

http://www.elon.edu/elonpoll• facebook.com/elonpoll • @elonpoll
Page 34 April 5-9, 2013
Teacher Pay and Race Too much About right Too little DK Total % % % % % White 2 19 71 8 100 Black 2 12 82 4 100 Other 4 16 70 10 100 Total 2 17 74 7 100 Teacher Pay and Gender Too much About right Too little DK Total % % % % % Male 2 23 66 9 100 Female 2 11 81 6 100 Total 2 17 74 7 100 Teacher Pay and Education Too much About right Too little DK Total % % % % % Less than HS 6 22 62 10 100 High School / GED 3 23 65 9 100 Some College/ AA / Technical 1 15 76 8 100 College Graduate 1 13 79 6 100 Graduate School 2 19 75 4 100 DK 0 0 100 0 100 Refused 0 0 76 24 100 Total 2 17 74 7 100

http://www.elon.edu/elonpoll• facebook.com/elonpoll • @elonpoll
Page 35 April 5-9, 2013
Students are often given the grades A, B, C, D, or F to denote the quality of their work. Suppose the public schools themselves, in your community, were graded in the same way. What grade would you give your community’s public schools —A, B, C, D, or F? School Grade and Party Identification A B C D F DK Refused Total % % % % % % % % Democrats 12 35 29 9 4 10 1 100 Independents 10 42 28 8 4 8 0 100 Republicans 13 40 27 7 7 6 0 100 DK / Refused 13 43 17 12 3 13 0 100 Total 12 39 26 9 5 9 0 100 School Grade and Income A B C D F DK Refused Total % % % % % % % % Less than $25,000 17 29 21 10 5 16 1 100 $25,000 to $50,000 13 45 25 6 5 5 0 100 $50,000 to $75,000 5 37 38 11 4 6 0 100 More than $75,000 10 41 27 8 4 9 0 100 DK 12 38 20 12 8 10 0 100 Refused 15 34 6 16 4 25 0 100 Total 11 39 26 9 5 9 0 100 School Grade and Age A B C D F DK Refused Total % % % % % % % % 18-30 14 43 20 11 5 5 1 100 31-40 10 38 25 9 5 12 0 100 41-50 11 36 29 9 6 8 0 100 51-65 9 41 28 8 5 8 1 100 65+ 11 34 30 6 3 15 0 100 Total 11 39 26 9 5 9 0 100

http://www.elon.edu/elonpoll• facebook.com/elonpoll • @elonpoll
Page 36 April 5-9, 2013
School Grade and Race A B C D F DK Refused Total % % % % % % % % White 12 39 26 8 4 10 0 100 Black 9 42 27 9 5 8 0 100 Other 12 30 26 10 10 11 0 100 Total 11 39 26 9 5 9 0 100 School Grade and Gender A B C D F DK Refused Total % % % % % % % % Male 9 39 26 9 6 12 0 100 Female 14 38 27 8 4 7 1 100 Total 11 39 26 9 5 9 0 100 School Grade and Education A B C D F DK Refused Total % % % % % % % % Less than HS 26 30 17 7 5 15 0 100 High School / GED 10 42 23 7 6 12 0 100 Some College/ AA / Technical 9 41 25 10 6 8 1 100 College Graduate 12 38 32 9 3 6 0 100 Graduate School 9 38 29 9 4 11 0 100 DK 0 100 0 0 0 0 0 100 Refused 44 15 0 0 18 24 0 100 Total 11 39 26 9 5 9 0 100 School Grade and Religion A B C D F DK Refused Total % % % % % % % % Born-Again Christian 8 43 27 9 5 9 0 100 Other Christian 10 41 29 7 4 9 0 100 Catholic 21 33 18 11 1 15 0 100 Not Religious 20 34 21 9 5 10 2 100 Other 8 33 28 14 6 11 0 100 DK 28 20 46 0 3 3 0 100 Refused 0 100 0 0 0 0 0 100 Total 11 39 26 9 5 9 0 100

http://www.elon.edu/elonpoll• facebook.com/elonpoll • @elonpoll
Page 37 April 5-9, 2013
School Grade and Religious Service Attendance a b c d f DK Refused Total % % % % % % % % Never 14 38 24 9 5 10 0 100 A few times a year 12 37 23 13 5 9 1 100 Once or twice a month 10 35 36 8 5 6 0 100 Almost every week 7 44 33 3 4 10 0 100 Every week 9 41 24 10 5 10 1 100 DK 86 0 14 0 0 0 0 100 Refused 0 0 0 0 0 100 0 100 Total 11 39 26 9 5 9 0 100
Gay Marriage Do you support or oppose gay [same-sex] marriage? Gay Marriage and Party Identification Support Oppose DK Refused Total % % % % % Democrats 57 36 7 0 100 Independents 49 39 11 1 100 Republicans 21 69 10 0 100 DK / Refused 41 37 20 2 100 Total 44 45 11 0 100 Gay Marriage and Ideology Support Oppose DK Refused Total % % % % % Extremely Liberal 92 8 0 0 100 Liberal 84 10 7 0 100 Slightly Liberal 61 30 9 0 100 Moderate 48 39 11 2 100 Slightly Conservative 36 49 15 0 100 Conservative 12 73 14 1 100 Extremely Conservative 7 85 8 0 100 DK 47 40 13 0 100 Refused 14 86 0 0 100 Total 43 46 11 0 100

http://www.elon.edu/elonpoll• facebook.com/elonpoll • @elonpoll
Page 38 April 5-9, 2013
Gay Marriage and Income Support Oppose DK Refused Total % % % % % Less than $25,000 42 50 8 0 100 $25,000 to $50,000 49 41 8 1 100 $50,000 to $75,000 44 48 8 0 100 More than $75,000 41 47 12 1 100 DK 42 30 28 0 100 Refused 25 66 10 0 100 Total 43 46 10 0 100 Gay Marriage and Age Support Oppose DK Refused Total % % % % % 18-30 55 36 8 1 100 31-40 50 34 15 1 100 41-50 41 49 10 0 100 51-65 41 52 7 0 100 65+ 30 58 12 0 100 Total 44 45 10 0 100 Gay Marriage and Race Support Oppose DK Refused Total % % % % % White 44 45 10 0 100 Black 36 53 10 1 100 Other 54 34 13 0 100 Total 43 46 10 0 100 Gay Marriage and Gender Support Oppose DK Refused Total % % % % % Male 36 51 13 1 100 Female 50 41 9 0 100 Total 43 46 10 0 100

http://www.elon.edu/elonpoll• facebook.com/elonpoll • @elonpoll
Page 39 April 5-9, 2013
Gay Marriage and Education Support Oppose DK Refused Total % % % % % Less than HS 42 50 9 0 100 High School / GED 34 61 5 0 100 Some College/ AA / Technical 41 43 15 1 100 College Graduate 49 42 9 0 100 Graduate School 48 38 13 2 100 DK 0 0 100 0 100 Refused 62 38 0 0 100 Total 43 46 10 0 100 Gay Marriage and Religion Support Oppose DK Refused Total % % % % % Born-Again Christian 21 71 8 0 100 Other Christian 50 36 12 1 100 Catholic 63 27 10 0 100 Not Religious 80 10 10 0 100 Other 62 20 16 2 100 DK 20 59 21 0 100 Refused 100 0 0 0 100 Total 43 46 10 0 100 Have you always [favored/opposed] same-sex marriage, or have you changed your mind on this issue? Gay Marriage and Changed Mind Support Oppose DK Total % % % % Always 41 57 1 100 Have Changed 87 11 2 100 DK 46 26 28 100 Refused 0 48 52 100 Total 47 50 2 100

http://www.elon.edu/elonpoll• facebook.com/elonpoll • @elonpoll
Page 40 April 5-9, 2013
Change Mind and Party Identification Always Have Changed DK Refused Total % % % % % Democrats 83 13 4 0 100 Independents 79 16 3 1 100 Republicans 87 10 3 0 100 DK / Refused 84 13 3 0 100 Total 83 13 3 1 100 Changed Mind and Ideology Always Have Changed DK Refused Total % % % % % Extremely Liberal 80 20 0 0 100 Liberal 78 18 5 0 100 Slightly Liberal 72 24 4 0 100 Moderate 85 11 1 3 100 Slightly Conservative 82 15 3 0 100 Conservative 86 8 5 1 100 Extremely Conservative 99 1 0 0 100 DK 83 10 7 0 100 Refused 86 14 0 0 100 Total 83 13 3 1 100 Changed Mind and Income Always Have Changed DK Refused Total % % % % % Less than $25,000 86 8 5 1 100 $25,000 to $50,000 86 10 5 0 100 $50,000 to $75,000 79 20 2 0 100 More than $75,000 81 16 2 1 100 DK 84 12 5 0 100 Refused 94 0 6 0 100 Total 83 13 3 1 100

http://www.elon.edu/elonpoll• facebook.com/elonpoll • @elonpoll
Page 41 April 5-9, 2013
Changed Mind and Age
Always Have Changed DK Refused Total % % % % % 18-30 82 12 6 1 100 31-40 82 13 4 1 100 41-50 83 16 1 0 100 51-65 83 14 2 0 100 65+ 83 12 4 1 100 Total 83 13 3 1 100 Changed Mind and Race Always Have Changed DK Refused Total % % % % % White 85 12 3 0 100 Black 81 14 3 1 100 Other 73 22 6 0 100 Total 83 13 3 1 100 Changed Mind and Gender Always Have Changed DK Refused Total % % % % % Male 80 15 3 1 100 Female 85 11 3 0 100 Total 83 13 3 1 100 Changed Mind and Education Always Have Changed DK Refused Total % % % % % Less than HS 91 2 6 0 100 High School / GED 89 7 4 0 100 Some College/ AA / Technical 82 13 4 1 100 College Graduate 82 15 3 0 100 Graduate School 74 24 1 1 100 Refused 100 0 0 0 100 Total 83 13 3 1 100

http://www.elon.edu/elonpoll• facebook.com/elonpoll • @elonpoll
Page 42 April 5-9, 2013
Changed Mind and Religion
Always Have Changed DK Refused Total % % % % % Born-Again Christian 87 10 3 1 100 Other Christian 80 16 4 1 100 Catholic 73 22 5 0 100 Not Religious 85 11 3 1 100 Other 80 20 0 0 100 DK 87 0 13 0 100 Refused 100 0 0 0 100 Total 83 13 3 1 100
Boy Scouts of America (BSA) Do you think the Boy Scouts of America should continue its ban on openly gay members or end its ban on openly gay members? BSA and Party Identification Continue Ban End Ban DK Refused Total % % % % % Democrats 25 63 12 1 100 Independents 38 52 10 0 100 Republicans 60 30 9 1 100 DK / Refused 36 45 18 1 100 Total 39 49 11 1 100 BSA and Income Continue Ban End Ban DK Refused Total % % % % % Less than $25,000 41 41 17 1 100 $25,000 to $50,000 41 50 9 0 100 $50,000 to $75,000 37 50 13 0 100 More than $75,000 40 51 8 1 100 DK 30 43 27 0 100 Refused 38 58 0 4 100 Total 39 49 11 1 100

http://www.elon.edu/elonpoll• facebook.com/elonpoll • @elonpoll
Page 43 April 5-9, 2013
BSA and Age Continue Ban End Ban DK Refused Total % % % % % 18-30 40 51 9 0 100 31-40 34 58 8 0 100 41-50 43 46 10 1 100 51-65 40 47 12 1 100 65+ 40 43 15 1 100 Total 39 49 11 1 100 BSA and Race Continue Ban End Ban DK Refused Total % % % % % White 40 49 10 1 100 Black 39 48 12 1 100 Other 33 47 18 2 100 Total 39 49 11 1 100 BSA and Gender Continue Ban End Ban DK Refused Total % % % % % Male 46 42 11 1 100 Female 33 55 11 1 100 Total 39 49 11 1 100 BSA and Religion Continue Ban End Ban DK Refused Total % % % % % Born-Again Christian 55 32 12 1 100 Other Christian 30 59 11 0 100 Catholic 36 55 7 3 100 Not Religious 19 73 9 0 100 Other 27 60 14 0 100 DK 18 58 25 0 100 Refused 100 0 0 0 100 Total 39 49 11 1 100

http://www.elon.edu/elonpoll• facebook.com/elonpoll • @elonpoll
Page 44 April 5-9, 2013
BSA and Religious Attendance Continue Ban End Ban DK Refused Total % % % % % Never 25 63 12 1 100 A few times a year 33 55 11 2 100 Once or twice a month 34 58 7 1 100 Almost every week 51 35 13 1 100 Every week 54 33 12 0 100 DK 66 0 34 0 100 Refused 100 0 0 0 100 Total 39 49 11 1 100
Gun Control Please tell me whether you agree or disagree with the following statement: “There should be more legal restrictions on handguns in our society.” Gun Control and Party Identification Agree Disagree Neither DK Total % % % % % Democrats 80 16 1 2 100 Independents 53 43 3 0 100 Republicans 37 58 2 3 100 DK / Refused 46 51 2 1 100 Total 57 39 2 2 100 Gun Control and Income Agree Disagree Neither DK Total % % % % % Less than $25,000 65 30 2 3 100 $25,000 to $50,000 59 38 1 1 100 $50,000 to $75,000 47 52 0 1 100 More than $75,000 55 41 3 1 100 DK 73 23 3 0 100 Refused 39 51 3 7 100 Total 57 40 2 2 100

http://www.elon.edu/elonpoll• facebook.com/elonpoll • @elonpoll
Page 45 April 5-9, 2013
Gun Control and Age Agree Disagree Neither DK Total % % % % % 18-30 60 38 1 2 100 31-40 55 44 1 0 100 41-50 53 42 4 1 100 51-65 54 40 2 4 100 65+ 66 31 2 1 100 Total 57 39 2 2 100 Gun Control and Race Agree Disagree Neither DK Total % % % % % White 50 46 2 1 100 Black 77 17 2 4 100 Other 63 37 0 0 100 Total 57 40 2 2 100 Gun Control and Gender Agree Disagree Neither DK Total % % % % % Male 43 53 3 1 100 Female 69 27 1 2 100 Total 57 40 2 2 100 Gun Control and Education Agree Disagree Neither DK Total % % % % % Less than HS 68 28 0 4 100 High School / GED 52 44 1 4 100 Some College/ AA / Technical 52 43 4 1 100 College Graduate 60 36 3 1 100 Graduate School 62 37 0 1 100 DK 0 100 0 0 100 Refused 58 42 0 0 100 Total 57 40 2 2 100

http://www.elon.edu/elonpoll• facebook.com/elonpoll • @elonpoll
Page 46 April 5-9, 2013
Gun Control and Religion Agree Disagree Neither DK Total % % % % % Born-Again Christian 53 44 2 2 100 Other Christian 57 38 3 1 100 Catholic 69 29 1 1 100 Not Religious 59 40 0 2 100 Other 57 39 3 2 100 DK 71 25 0 4 100 Refused 100 0 0 0 100 Total 57 40 2 2 100
Immigration Now moving to the issue of immigration…..Please indicate which statement comes closest to your own view, even if neither is exactly right. 1) Immigrants today are a benefit to North Carolina because of their hard work and job skills or 2) Immigrants today are a burden to North Carolina because they use public services. [1 & 2 are rotated] Immigrants and Party Identification Benefit Burden DK Total % % % % Democrats 66 25 9 100 Independents 53 42 5 100 Republicans 41 47 12 100 DK / Refused 49 30 21 100 Total 54 36 10 100 Immigrants and Income Benefit Burden DK Total % % % % Less than $25,000 48 35 16 100 $25,000 to $50,000 52 39 9 100 $50,000 to $75,000 53 33 14 100 More than $75,000 57 35 8 100 DK 49 40 11 100 Refused 53 43 4 100 Total 53 36 11 100

http://www.elon.edu/elonpoll• facebook.com/elonpoll • @elonpoll
Page 47 April 5-9, 2013
Immigrants and Age Benefit Burden DK Total % % % % 18-30 62 30 9 100 31-40 51 40 9 100 41-50 44 46 10 100 51-65 50 37 13 100 65+ 55 33 12 100 Total 53 37 11 100 Immigrants and Race Benefit Burden DK Total % % % % White 50 41 9 100 Black 59 27 13 100 Other 66 19 16 100 Total 53 36 11 100 Immigrants and Gender Benefit Burden DK Total % % % % Male 52 36 12 100 Female 54 36 10 100 Total 53 36 11 100
Immigrants and Education Benefit Burden DK Total % % % % Less than HS 47 36 16 100 High School / GED 38 46 16 100 Some College/ AA / Technical 51 38 10 100 College Graduate 60 32 8 100 Graduate School 63 29 9 100 DK 100 0 0 100 Refused 62 38 0 100 Total 53 36 11 100

http://www.elon.edu/elonpoll• facebook.com/elonpoll • @elonpoll
Page 48 April 5-9, 2013
Immigrants and Religion Benefit Burden DK Total % % % % Born-Again Christian 45 43 13 100 Other Christian 59 33 9 100 Catholic 55 39 7 100 Not Religious 65 24 11 100 Other 55 35 10 100 DK 68 23 8 100 Refused 0 100 0 100 Total 53 36 11 100
Motorcycle Helmets Do you support or oppose changing the state law to allow motorcyclists to ride without a helmet? Motorcycle and Party Identification Support Oppose DK Refused Total % % % % % Democrats 13 82 5 0 100 Independents 22 75 3 0 100 Republicans 27 69 3 0 100 DK / Refused 29 61 10 0 100 Total 21 74 5 0 100 Motorcycle and Income Support Oppose DK Refused Total % % % % % Less than $25,000 20 72 8 0 100 $25,000 to $50,000 26 71 3 0 100 $50,000 to $75,000 21 77 2 0 100 More than $75,000 20 74 5 0 100 DK 19 79 2 0 100 Refused 12 78 10 0 100 Total 21 74 5 0 100

http://www.elon.edu/elonpoll• facebook.com/elonpoll • @elonpoll
Page 49 April 5-9, 2013
Motorcycle and Age Support Oppose DK Refused Total % % % % % 18-30 24 73 3 0 100 31-40 24 75 1 0 100 41-50 23 69 7 1 100 51-65 19 75 6 0 100 65+ 16 79 5 0 100 Total 21 74 4 0 100 Motorcycle and Race Support Oppose DK Refused Total % % % % % White 24 71 5 0 100 Black 15 81 5 0 100 Other 9 82 7 2 100 Total 21 74 5 0 100 Motorcycle and Gender Support Oppose DK Refused Total % % % % % Male 29 64 6 0 100 Female 14 83 3 0 100 Total 21 74 5 0 100 Motorcycle and Education Support Oppose DK Refused Total % % % % % Less than HS 30 65 5 0 100 High School / GED 26 69 5 0 100 Some College/ AA / Technical 22 74 5 0 100 College Graduate 15 80 5 0 100 Graduate School 22 75 3 0 100 DK 0 100 0 0 100 Refused 62 15 24 0 100 Total 21 74 5 0 100

http://www.elon.edu/elonpoll• facebook.com/elonpoll • @elonpoll
Page 50 April 5-9, 2013
Motorcycle and Ride a Motorcycle Do you ride a motorcycle? Support Oppose DK Refused Total % % % % % Yes 29 68 4 0 100 No 20 75 5 0 100 DK 0 0 100 0 100 Total 21 74 5 0 100
Speed Limit Do you support or oppose increasing the speed limit to 75 miles per hour on certain interstates in North Carolina? Speed Limit and Party Identification Support Oppose DK Refused Total % % % % % Democrats 52 45 3 0 100 Independents 59 39 2 0 100 Republicans 60 39 1 0 100 DK / Refused 66 29 4 1 100 Total 58 40 2 0 100 Speed Limit and Income Support Oppose DK Refused Total % % % % % Less than $25,000 45 50 4 0 100 $25,000 to $50,000 59 39 1 1 100 $50,000 to $75,000 52 47 1 0 100 More than $75,000 64 34 2 0 100 DK 67 28 5 0 100 Refused 47 53 0 0 100 Total 58 40 2 0 100

http://www.elon.edu/elonpoll• facebook.com/elonpoll • @elonpoll
Page 51 April 5-9, 2013
Speed Limit and Age Support Oppose DK Refused Total % % % % % 18-30 70 26 3 1 100 31-40 71 28 1 0 100 41-50 64 35 1 0 100 51-65 48 49 3 0 100 65+ 35 63 2 0 100 Total 58 40 2 0 100 Speed Limit and Race Support Oppose DK Refused Total % % % % % White 59 38 2 0 100 Black 51 46 2 0 100 Other 60 40 0 0 100 Total 58 40 2 0 100
Speed Limit and Gender Support Oppose DK Refused Total % % % % % Male 67 31 2 0 100 Female 49 49 2 0 100 Total 58 40 2 0 100
Divorce A state legislative proposal would increase the time a couple must wait to get a divorce from one year to two years. Do you support or oppose this change? Divorce and Party Identification Support Oppose DK Total % % % % Democrats 19 75 5 100 Independents 22 69 9 100 Republicans 31 65 5 100 DK / Refused 22 63 15 100 Total 23 69 8 100

http://www.elon.edu/elonpoll• facebook.com/elonpoll • @elonpoll
Page 52 April 5-9, 2013
Divorce and Income Support Oppose DK Total % % % % Less than $25,000 33 56 11 100 $25,000 to $50,000 26 70 5 100 $50,000 to $75,000 18 78 4 100 More than $75,000 19 72 9 100 DK 34 61 5 100 Refused 19 55 26 100 Total 23 69 8 100 Divorce and Age Support Oppose DK Total % % % % 18-30 39 50 11 100 31-40 25 72 3 100 41-50 14 80 7 100 51-65 16 80 5 100 65+ 22 66 12 100 Total 24 69 7 100
Divorce and Race Support Oppose DK Total % % % % White 21 71 8 100 Black 26 68 7 100 Other 40 54 6 100 Total 23 69 8 100 Divorce and Gender Support Oppose DK Total % % % % Male 26 65 9 100 Female 21 73 6 100 Total 23 69 8 100
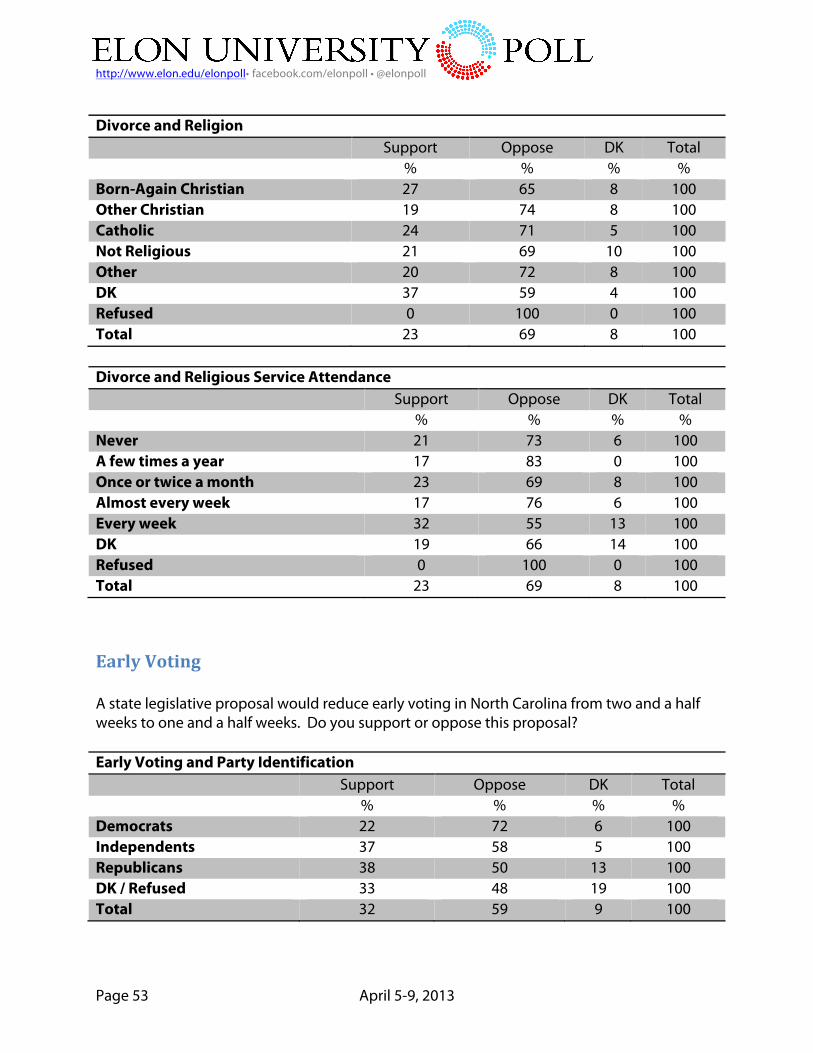
http://www.elon.edu/elonpoll• facebook.com/elonpoll • @elonpoll
Page 53 April 5-9, 2013
Divorce and Religion Support Oppose DK Total % % % % Born-Again Christian 27 65 8 100 Other Christian 19 74 8 100 Catholic 24 71 5 100 Not Religious 21 69 10 100 Other 20 72 8 100 DK 37 59 4 100 Refused 0 100 0 100 Total 23 69 8 100 Divorce and Religious Service Attendance Support Oppose DK Total % % % % Never 21 73 6 100 A few times a year 17 83 0 100 Once or twice a month 23 69 8 100 Almost every week 17 76 6 100 Every week 32 55 13 100 DK 19 66 14 100 Refused 0 100 0 100 Total 23 69 8 100
Early Voting A state legislative proposal would reduce early voting in North Carolina from two and a half weeks to one and a half weeks. Do you support or oppose this proposal? Early Voting and Party Identification Support Oppose DK Total % % % % Democrats 22 72 6 100 Independents 37 58 5 100 Republicans 38 50 13 100 DK / Refused 33 48 19 100 Total 32 59 9 100

http://www.elon.edu/elonpoll• facebook.com/elonpoll • @elonpoll
Page 54 April 5-9, 2013

http://www.elon.edu/elonpoll• facebook.com/elonpoll • @elonpoll
Page 55 April 5-9, 2013
Early Voting and Income Support Oppose DK Total % % % % Less than $25,000 34 53 13 100 $25,000 to $50,000 33 57 10 100 $50,000 to $75,000 37 56 8 100 More than $75,000 28 65 7 100 DK 40 52 8 100 Refused 22 63 15 100 Total 32 59 9 100 Early Voting and Age Support Oppose DK Total % % % % 18-30 29 64 6 100 31-40 31 60 9 100 41-50 30 61 9 100 51-65 31 60 8 100 65+ 36 48 15 100 Total 31 59 9 100 Early Voting and Race Support Oppose DK Total % % % % White 34 56 10 100 Black 18 75 7 100 Other 53 39 8 100 Total 32 59 9 100 Early Voting and Gender Support Oppose DK Total % % % % Male 31 58 11 100 Female 32 59 8 100 Total 32 59 9 100
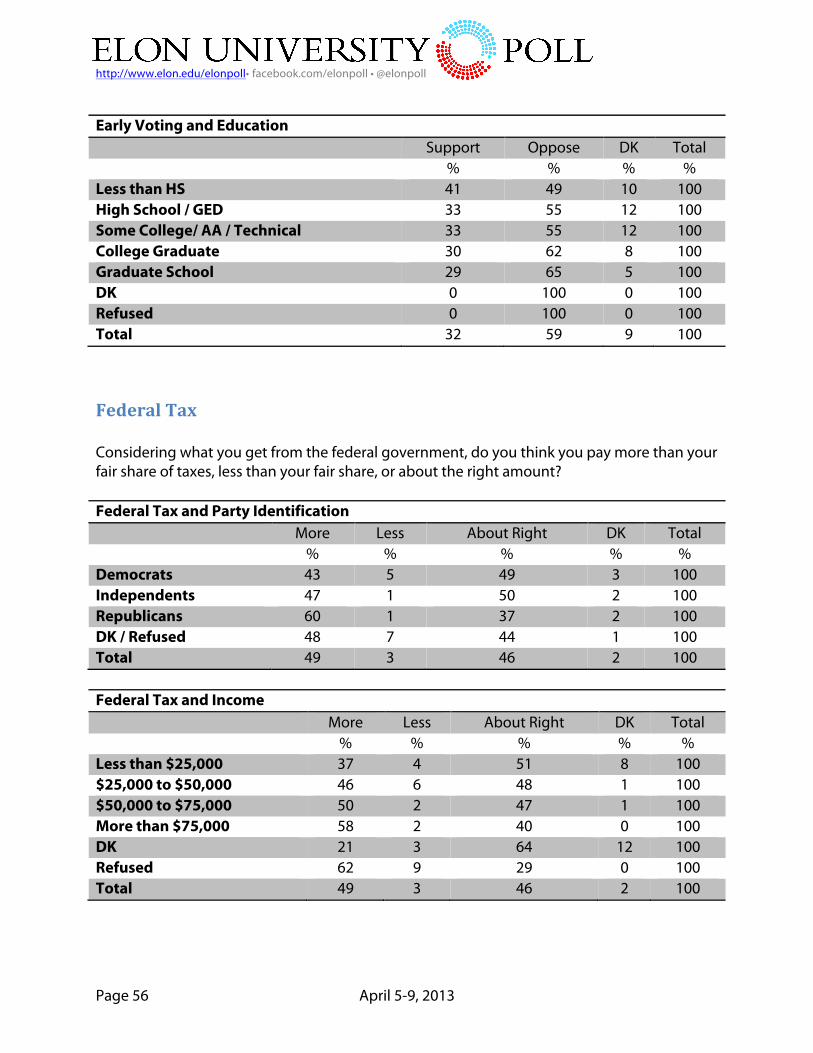
http://www.elon.edu/elonpoll• facebook.com/elonpoll • @elonpoll
Page 56 April 5-9, 2013
Early Voting and Education Support Oppose DK Total % % % % Less than HS 41 49 10 100 High School / GED 33 55 12 100 Some College/ AA / Technical 33 55 12 100 College Graduate 30 62 8 100 Graduate School 29 65 5 100 DK 0 100 0 100 Refused 0 100 0 100 Total 32 59 9 100
Federal Tax Considering what you get from the federal government, do you think you pay more than your fair share of taxes, less than your fair share, or about the right amount? Federal Tax and Party Identification More Less About Right DK Total % % % % % Democrats 43 5 49 3 100 Independents 47 1 50 2 100 Republicans 60 1 37 2 100 DK / Refused 48 7 44 1 100 Total 49 3 46 2 100 Federal Tax and Income More Less About Right DK Total % % % % % Less than $25,000 37 4 51 8 100 $25,000 to $50,000 46 6 48 1 100 $50,000 to $75,000 50 2 47 1 100 More than $75,000 58 2 40 0 100 DK 21 3 64 12 100 Refused 62 9 29 0 100 Total 49 3 46 2 100

http://www.elon.edu/elonpoll• facebook.com/elonpoll • @elonpoll
Page 57 April 5-9, 2013
Federal Tax and Age More Less About Right DK Total % % % % % 18-30 41 5 52 1 100 31-40 55 1 44 0 100 41-50 61 3 36 1 100 51-65 54 3 41 2 100 65+ 31 3 57 9 100 Total 48 3 46 2 100
NC Tax Compared to other states, do you think taxes in North Carolina are higher, lower, or about the same? NC Tax and Party Identification Higher Lower About the Same DK Total % % % % % Democrats 42 15 29 14 100 Independents 46 12 32 10 100 Republicans 53 12 28 7 100 DK / Refused 43 11 31 15 100 Total 46 13 30 11 100 NC Tax and Income Higher Lower About the Same DK Total % % % % % Less than $25,000 35 17 30 18 100 $25,000 to $50,000 53 14 21 11 100 $50,000 to $75,000 47 11 33 10 100 More than $75,000 49 11 31 9 100 DK 33 22 36 10 100 Refused 40 0 47 13 100 Total 46 13 30 11 100

http://www.elon.edu/elonpoll• facebook.com/elonpoll • @elonpoll
Page 58 April 5-9, 2013
NC Tax and Age Higher Lower About the Same DK Total % % % % % 18-30 34 20 32 15 100 31-40 52 17 25 6 100 41-50 54 9 30 7 100 51-65 53 11 26 10 100 65+ 42 9 34 16 100 Total 46 13 29 11 100
Sequestration As you may know, automatic cuts in the federal budget –known as sequestration—went into effect on March First. All in all, do you think the sequestration is a good thing or a bad thing for the country, or don’t you know enough to say? Sequester Country and Party Identification Good thing Bad thing No Effect DK Refused Total % % % % % % Democrats 14 39 4 43 0 100 Independents 29 38 3 30 0 100 Republicans 30 28 5 36 0 100 DK / Refused 14 29 3 54 0 100 Total 22 34 4 39 0 100 Sequester Country and Income Good thing Bad thing No Effect DK Refused Total % % % % % % Less than $25,000 12 28 3 56 0 100 $25,000 to $50,000 12 33 7 48 0 100 $50,000 to $75,000 22 39 2 37 0 100 More than $75,000 33 37 2 27 1 100 DK 24 23 9 45 0 100 Refused 15 45 10 25 4 100 Total 22 35 4 39 0 100

http://www.elon.edu/elonpoll• facebook.com/elonpoll • @elonpoll
Page 59 April 5-9, 2013
Sequester Country and Age Good thing Bad thing No Effect DK Refused Total % % % % % % 18-30 14 28 4 54 0 100 31-40 21 33 4 42 0 100 41-50 33 33 2 33 0 100 51-65 26 40 5 27 1 100 65+ 19 37 5 39 1 100 Total 22 34 4 39 0 100 Sequester Country and Race Good thing Bad thing No Effect DK Refused Total % % % % % % White 26 34 5 35 0 100 Black 11 39 2 48 1 100 Other 15 30 0 55 0 100 Total 22 35 4 39 0 100 Sequester Country and Gender Good thing Bad thing No Effect DK Refused Total % % % % % % Male 29 34 3 33 0 100 Female 16 35 4 44 1 100 Total 22 35 4 39 0 100 Sequester Country and Education Good thing Bad thing No Effect DK Refused Total % % % % % % Less than HS 9 24 2 65 0 100 High School / GED 15 22 3 59 0 100 Some College/ AA / Technical 23 33 5 39 0 100 College Graduate 22 41 4 31 0 100 Graduate School 34 43 4 19 1 100 DK 0 100 0 0 0 100 Refused 42 58 0 0 0 100 Total 22 35 4 39 0 100

http://www.elon.edu/elonpoll• facebook.com/elonpoll • @elonpoll
Page 60 April 5-9, 2013
All in all, do you think the sequestration is a good thing or a bad thing for you personally, or don’t you know enough to say? Sequester Personal and Party Identification Good thing Bad thing No Effect DK Refused Total % % % % % % Democrats 8 30 14 48 0 100 Independents 17 26 21 36 0 100 Republicans 17 22 18 44 0 100 DK / Refused 9 19 17 55 0 100 Total 13 25 17 44 0 100 Sequester Personal and Income Good thing Bad thing No Effect DK Refused Total % % % % % % Less than $25,000 9 22 7 62 0 100 $25,000 to $50,000 9 26 15 50 0 100 $50,000 to $75,000 10 31 16 43 0 100 More than $75,000 19 26 22 33 0 100 DK 10 11 28 51 0 100 Refused 8 22 25 36 9 100 Total 13 25 18 44 0 100
Sequester Personal and Age Good thing Bad thing No Effect DK Refused Total % % % % % % 18-30 9 21 10 60 0 100 31-40 7 22 25 46 0 100 41-50 21 25 14 39 0 100 51-65 18 34 20 29 0 100 65+ 9 24 18 48 1 100 Total 13 26 17 44 0 100 Sequester Personal and Race Good thing Bad thing No Effect DK Refused Total % % % % % % White 14 24 21 40 0 100 Black 8 28 9 54 1 100 Other 8 30 3 58 0 100 Total 13 25 18 44 0 100

http://www.elon.edu/elonpoll• facebook.com/elonpoll • @elonpoll
Page 61 April 5-9, 2013
Sequester Personal and Gender Good thing Bad thing No Effect DK Refused Total % % % % % % Male 16 26 18 40 0 100 Female 10 24 17 48 1 100 Total 13 25 18 44 0 100 Sequester Personal and Education Good thing Bad thing No Effect DK Refused Total % % % % % % Less than HS 7 12 10 71 0 100 High School / GED 8 19 8 64 0 100 Some College/ AA / Technical
13 26 18 43 0 100
College Graduate 13 27 23 37 1 100 Graduate School 22 32 20 26 0 100 DK 0 0 100 0 0 100 Refused 0 76 0 24 0 100 Total 13 25 18 44 0 100
Abortion Now, thinking more generally, do you think state laws in North Carolina should make access to an abortion more difficult or less difficult? Abortion and Party Identification More Less About the same DK Refused Total % % % % % % Democrats 28 52 11 9 0 100 Independents 41 36 12 11 0 100 Republicans 66 19 5 10 1 100 DK / Refused 33 42 8 14 3 100 Total 42 38 9 10 1 100

http://www.elon.edu/elonpoll• facebook.com/elonpoll • @elonpoll
Page 62 April 5-9, 2013
Abortion and Income More Less About the same DK Refused Total % % % % % % Less than $25,000 45 35 7 11 3 100 $25,000 to $50,000 42 41 9 8 0 100 $50,000 to $75,000 47 34 11 7 1 100 More than $75,000 41 38 10 10 1 100 DK 28 36 13 23 0 100 Refused 50 27 3 20 0 100 Total 42 37 9 10 1 100 Abortion and Age More Less About the same DK Refused Total % % % % % % 18-30 46 37 11 5 1 100 31-40 38 40 9 13 0 100 41-50 35 45 8 10 2 100 51-65 42 36 9 12 1 100 65+ 49 29 10 12 0 100 Total 42 37 10 10 1 100 Abortion and Race More Less About the same DK Refused Total % % % % % % White 45 35 10 10 0 100 Black 34 42 10 12 3 100 Other 42 39 5 15 0 100 Total 42 37 9 10 1 100 Abortion and Gender More Less About the same DK Refused Total % % % % % % Male 46 33 10 11 1 100 Female 39 41 9 10 1 100 Total 42 37 9 10 1 100

http://www.elon.edu/elonpoll• facebook.com/elonpoll • @elonpoll
Page 63 April 5-9, 2013
Abortion and Education More Less About the same DK Refused Total % % % % % % Less than HS 51 30 10 10 0 100 High School / GED 49 38 5 8 1 100 Some College/ AA / Technical 43 33 9 13 2 100 College Graduate 37 40 12 10 0 100 Graduate School 39 42 9 11 0 100 DK 0 100 0 0 0 100 Refused 82 18 0 0 0 100 Total 42 37 9 10 1 100 Abortion and Religion More Less About the same DK Refused Total % % % % % % Born-Again Christian 61 24 7 7 1 100 Other Christian 32 41 12 14 2 100 Catholic 47 35 5 14 0 100 Not Religious 16 62 12 10 0 100 Other 24 54 10 11 1 100 DK 37 27 16 21 0 100 Refused 0 100 0 0 0 100 Total 42 37 9 10 1 100 Abortion and Religious Service Attendance More Less About the same DK Refused Total % % % % % % Never 27 50 11 12 1 100 A few times a year 38 42 7 13 1 100 Once or twice a month 33 42 15 9 1 100 Almost every week 51 29 11 8 1 100 Every week 63 22 6 9 0 100 DK 46 19 0 34 0 100 Refused 64 0 0 36 0 100 Total 42 37 9 10 1 100

http://www.elon.edu/elonpoll• facebook.com/elonpoll • @elonpoll
Page 64 April 5-9, 2013
Death Penalty Are you in favor of the death penalty for a person convicted of murder? Death Penalty and Party Identification Yes No DK Refused Total % % % % % Democrats 44 48 8 0 100 Independents 62 27 9 1 100 Republicans 86 10 3 0 100 DK / Refused 55 30 14 0 100 Total 61 30 8 0 100 Death Penalty and Income Yes No DK Refused Total % % % % % Less than $25,000 43 41 15 1 100 $25,000 to $50,000 56 34 10 0 100 $50,000 to $75,000 72 23 4 0 100 More than $75,000 68 25 6 0 100 DK 57 32 10 0 100 Refused 62 29 9 0 100 Total 61 30 8 0 100 Death Penalty and Age Yes No DK Refused Total % % % % % 18-30 54 40 6 0 100 31-40 65 24 11 0 100 41-50 66 28 6 0 100 51-65 62 26 11 1 100 65+ 60 31 9 0 100 Total 61 30 9 0 100

http://www.elon.edu/elonpoll• facebook.com/elonpoll • @elonpoll
Page 65 April 5-9, 2013
Death Penalty and Race Yes No DK Refused Total % % % % % White 69 23 8 0 100 Black 41 49 10 0 100 Other 38 51 11 0 100 Total 61 30 8 0 100 Death Penalty and Gender Yes No DK Refused Total % % % % % Male 66 28 6 0 100 Female 57 32 11 0 100 Total 61 30 8 0 100 Death Penalty and Religion Yes No DK Refused Total % % % % % Born-Again Christian 67 25 8 0 100 Other Christian 66 26 7 1 100 Catholic 51 42 7 0 100 Not Religious 50 41 9 0 100 Other 53 31 16 0 100 DK 34 59 7 0 100 Refused 100 0 0 0 100 Total 61 30 8 0 100 Generally speaking, do you believe the death penalty is applied [fairly or unfairly] in this country? Fairness and Party Identification Fairly Unfairly DK Refused Total % % % % % Democrats 37 51 12 0 100 Independents 54 35 11 0 100 Republicans 63 26 11 0 100 DK / Refused 44 37 19 0 100 Total 49 39 12 0 100

http://www.elon.edu/elonpoll• facebook.com/elonpoll • @elonpoll
Page 66 April 5-9, 2013
Fairness and Income Fairly Unfairly DK Refused Total % % % % % Less than $25,000 34 44 20 1 100 $25,000 to $50,000 46 41 13 0 100 $50,000 to $75,000 60 32 8 0 100 More than $75,000 52 39 9 0 100 DK 43 29 28 0 100 Refused 44 42 14 0 100 Total 48 39 13 0 100 Fairness and Age Fairly Unfairly DK Refused Total % % % % % 18-30 51 42 6 0 100 31-40 57 32 11 0 100 41-50 50 39 10 0 100 51-65 46 42 12 0 100 65+ 40 37 23 0 100 Total 49 39 12 0 100 Fairness and Race Fairly Unfairly DK Refused Total % % % % % White 54 33 12 0 100 Black 30 59 11 0 100 Other 43 34 23 0 100 Total 48 39 13 0 100 Fairness and Gender Fairly Unfairly DK Refused Total % % % % % Male 53 36 10 0 100 Female 44 41 15 0 100 Total 48 39 13 0 100

http://www.elon.edu/elonpoll• facebook.com/elonpoll • @elonpoll
Page 67 April 5-9, 2013
Crime Is there more crime in the U.S. than there was a year ago, or less? National Crime and Party Identification More Less About the same DK Refused Total % % % % % % Democrats 59 19 8 14 0 100 Independents 53 19 12 16 0 100 Republicans 61 15 5 19 0 100 DK / Refused 66 13 10 10 1 100 Total 58 17 9 15 0 100 National Crime and Income More Less About the same DK Refused Total % % % % % % Less than $25,000 67 15 8 10 0 100 $25,000 to $50,000 68 11 7 14 0 100 $50,000 to $75,000 58 20 7 15 0 100 More than $75,000 50 21 11 17 0 100 DK 58 21 6 16 0 100 Refused 56 17 0 23 4 100 Total 59 17 8 15 0 100 National Crime and Age More Less About the same DK Refused Total % % % % % % 18-30 60 20 6 14 0 100 31-40 60 13 16 12 0 100 41-50 59 19 8 13 2 100 51-65 57 19 9 15 0 100 65+ 59 16 4 20 0 100 Total 59 18 8 15 0 100

http://www.elon.edu/elonpoll• facebook.com/elonpoll • @elonpoll
Page 68 April 5-9, 2013
National Crime and Race
More Less About the same DK Refused Total % % % % % % White 54 19 10 17 0 100 Black 75 11 4 9 0 100 Other 61 16 5 17 2 100 Total 59 17 8 15 0 100 National Crime and Gender More Less About the same DK Refused Total % % % % % % Male 53 23 10 15 1 100 Female 65 12 7 16 0 100 Total 59 17 8 15 0 100 National Crime and Education More Less About the same DK Refused Total % % % % % % Less than HS 70 14 6 10 0 100 High School / GED 75 13 1 11 0 100 Some College/ AA / Technical 62 13 12 12 0 100 College Graduate 50 24 9 17 1 100 Graduate School 45 19 12 24 0 100 DK 0 0 0 100 0 100 Refused 100 0 0 0 0 100 Total 59 17 8 15 0 100
National Crime and Religion More Less About the same DK Refused Total % % % % % % Born-Again Christian 68 11 7 13 0 100 Other Christian 56 19 7 17 0 100 Catholic 46 22 9 23 0 100 Not Religious 45 29 12 14 0 100 Other 51 19 14 14 2 100 DK 71 22 0 3 4 100 Refused 100 0 0 0 0 100 Total 59 17 8 15 0 100

http://www.elon.edu/elonpoll• facebook.com/elonpoll • @elonpoll
Page 69 April 5-9, 2013
Is there more crime in your area than there was a year ago, or less? Local Crime and Party Identification More Less About the same DK Refused Total % % % % % % Democrats 36 34 21 9 0 100 Independents 39 29 24 7 1 100 Republicans 45 26 22 8 0 100 DK / Refused 35 39 18 8 0 100 Total 39 31 22 8 0 100 Local Crime and Income More Less About the same DK Refused Total % % % % % % Less than $25,000 47 28 13 11 1 100 $25,000 to $50,000 40 33 20 7 0 100 $50,000 to $75,000 43 27 23 8 0 100 More than $75,000 36 33 23 7 0 100 DK 28 34 31 8 0 100 Refused 29 22 28 18 4 100 Total 39 31 21 8 0 100 Local Crime and Age More Less About the same DK Refused Total % % % % % % 18-30 33 37 19 11 0 100 31-40 34 31 29 5 1 100 41-50 43 32 17 8 1 100 51-65 45 30 20 5 0 100 65+ 41 23 24 12 0 100 Total 39 31 21 8 0 100 Local Crime and Race More Less About the same DK Refused Total % % % % % % White 41 28 22 8 0 100 Black 34 38 21 7 0 100 Other 39 37 14 8 2 100 Total 39 31 21 8 0 100

http://www.elon.edu/elonpoll• facebook.com/elonpoll • @elonpoll
Page 70 April 5-9, 2013
Local Crime and Gender More Less About the same DK Refused Total % % % % % % Male 33 37 22 8 1 100 Female 45 26 21 8 0 100 Total 39 31 21 8 0 100 Local Crime and Education More Less About the same DK Refused Total % % % % % % Less than HS 47 22 11 20 0 100 High School / GED 48 32 13 7 0 100 Some College/ AA / Technical 35 36 24 5 1 100 College Graduate 41 27 23 9 0 100 Graduate School 30 33 28 8 0 100 DK 0 0 100 0 0 100 Refused 58 18 0 24 0 100 Total 39 31 21 8 0 100

http://www.elon.edu/elonpoll• facebook.com/elonpoll • @elonpoll
Page 71 April 5-9, 2013
Basic Methodological Information Mode: Live Interviewer RDD Telephone Interviews
(Dual Frame: Cell Phone and Landlines)
Sample Area: North Carolina
Dates in the field: April 5- April 9, 2013
Sample Size 770
Margin of Error ±3.53
Confidence Level 95%
Weighting Variables Age , Race, Gender, and Phone Ownership
The Elon University Poll uses a stratified random sample of households with telephones and wireless (cell) telephone numbers. Our target margin of error is at a maximum +/- 3 % based on a 95 % confidence interval. Please direct questions about the Elon University Poll’s methodology to the Director of the Elon University Poll, Dr. Kenneth Fernandez at 336-278-6438 or [email protected]. Procedures Used for Conducting the Poll
The Elon University Poll typically conducts surveys over a five-day period. Live interviewers call from 4:30 p.m. to 9:00 p.m. during the week and from 1:00 p.m. to 6:00 p.m. during the weekend. Each survey report specifies dates and times called. The Elon University Poll uses CATI system software (Computer Assisted Telephone Interviewing) for the administration of surveys. We attempt to reach each working telephone number in the sample up to five times. We only interview residents of North Carolina who are over 18. Additional Methodological Decisions
Branching Questions For many questions with multiple response options, we program our surveys to branch into a secondary probing question. “Don’t Know” & “Refused” Response Options All questions include an option for respondents to volunteer “don’t know” or to refuse. In the vast majority of questions, interviewers do not prompt “don’t know” responses. Weighting

http://www.elon.edu/elonpoll• facebook.com/elonpoll • @elonpoll
Page 72 April 5-9, 2013
We typically weight results from the Elon University Poll on multiple demographic characteristics: race, gender, household size, region, education, and age. Weighting rarely leads to substantial changes in results. We use iterative raking, adjusting one dimension at a time. We include detailed information about weighting of survey samples for each poll on both the Elon University Poll website and within released reports. Within Household Randomization For landlines, we use the common “oldest-youngest” technique to ensure within household randomization. We assume cellphones belong to an individual rather than a household. Thus, we do not conduct within-household randomization within our cellphone sample. Completion Criteria An interview is a complete only if a respondent progresses through the entire survey. Respondents who hang up before completing the last question or who refuse to more than 20 % of the questions are incompletes. Support for Transparency The Elon University Poll supports transparency in survey research and is a supporter of the American Association for Public Opinion Research Transparency Initiative, which is a program promoting openness and transparency about survey research methods and operations among survey research professionals and the industry. All information about the Elon University Poll that we released to the public conforms to reporting conventions recommended by the American Association for Public Opinion Research and the National Council on Public Polls. Question Construction and Question Order In releasing survey results, the Elon University Poll provides the questions as worded and the order in which respondents receive these questions. In some cases question ordering rotates to avoid biases. In an effort to provide neutral, non-biased questions, we attempt to observe conventional question wording and question order protocols in all of our polls. In order to avoid recency or primacy effects, we randomize candidate names and directional response options (e.g. support / oppose) within the text of each question. We pretest every questionnaire multiple times before entering the field. Sampling
Survey Sampling International, LLC, provide samples of telephone numbers. To equalize the probability of telephone selection, sample telephone numbers are systematically stratified according to subpopulation strata (e.g., a zip code, a county, etc.), which yields a sample from telephone exchanges in proportion to each exchange's share of telephone households in the population of interest. Estimates of telephone households in the population of interest are generally obtained from several databases. Samples of household telephone numbers are distributed across all eligible blocks of numbers in proportion to the density of listed households assigned in the population of interest according to a specified subpopulation stratum. Upon determining the projected (or preferred) sample size, a sampling interval is
http://www.elon.edu/elonpoll• facebook.com/elonpoll • @elonpoll
Page 73 April 5-9, 2013
calculated by summing the number of listed residential numbers in each eligible block within the population of interest and dividing that sum by the number of sampling points assigned to the population. From a random start between zero and the sampling interval, blocks are selected systematically in proportion to the density of listed household "working blocks." A block (also known as a bank) is a set of contiguous numbers identified by the first two digits of the last four digits of a telephone number. A working block contains three or more working telephone numbers. Exchanges are assigned to a population on the basis of all eligible blocks in proportion to the density of working telephone households. Once each population's proportion of telephone households is determined, then a sampling interval, based on that proportion, is calculated and specific exchanges and numbers are randomly selected. The wireless component of the study sample starts with determining which area code-exchange combinations in North Carolina are included in the wireless or shared Telcordia types. Similar to the process for selecting household telephone numbers, wireless numbers involve a multi-step process in which blocks of numbers are determined for each area code-exchange combination in the Telcordia types. From a random start within the first sampling interval, a systematic nth selection of each block of numbers is performed and a two-digit random number between 00 and 99 is appended to each selected nth block stem. The intent is to provide a stratification that will yield a sample that is representative both geographically and by large and small carrier. From these, a random sample is generated. Because exchanges and numbers are randomly selected, unlisted as well as listed numbers are included in the sample. Thus, the sample of numbers generated for the population of interest constitutes a random sample of telephone households and wireless numbers of the population. Frequently Asked Questions about our Methodology
1. Who pays for the Elon University Poll? Elon University fully funds the Elon University Poll.
2. Does the Elon University Poll favor a certain party? The Elon University Poll is an academic, non-partisan survey. We do not engage or work with any political candidates or parties. We employ best practices to ensure the results are not biased.
3. Where do you get your numbers?
We obtain samples of randomized phone numbers from Survey Sample International.
4. How many times do you call a number before giving up? We attempt to call each working number five times before removing it from the sample.
5. Do you call both cell phones and land lines?

http://www.elon.edu/elonpoll• facebook.com/elonpoll • @elonpoll
Page 74 April 5-9, 2013
Yes. We use a mixed sample of both cell phones and landlines. We weight on phone ownership to adjust for the higher probability of selection of those who own both cell phones and landline phones.
6. Does the Elon University Poll do IVR surveys or automated “robopolls”?
No. Well-trained students at Elon University conduct all our interviewers.
7. Do you report non-response rates? Yes. We report non-response rates based on AAPOR guidelines. The response rate for the April 9, 2013 Poll was 8%, which approximates the national average response rates of high quality survey organizations.
8. Do you weight the data? Yes. We apply weights to the data. An iterative proportional fitting algorithm generates weights based on Census parameters of residents in North Carolina.
9. Do you randomize response options? Yes. We rotate the order of candidate names in all applicable questions. We also rotate order of text for other questions, such as those that include response options such as “more” and “less.” Furthermore, we rotate the order of some questions themselves if we suspect the order of a question could bias results.
10. Do you conduct within-household randomization?
Yes. For landlines, we use the common “oldest-youngest” rotation to ensure within household randomization. We assume cellphones belong to an individual rather than a household. Thus, we do not conduct within-household randomization within our cellphone sample.

http://www.elon.edu/elonpoll• facebook.com/elonpoll • @elonpoll
Page 75 April 5-9, 2013
The Elon University Poll Team
Dr. Kenneth Fernandez is the Director of the Elon University Poll. Dr. Fernandez holds a Ph.D. in Political Science from University of California – Riverside. Dr. Fernandez is Assistant Professor of Political Science at Elon University. He has published numerous articles in peer-reviewed social science journals.
Dr. Jason Husser is the Assistant director. Dr. Husser holds a Ph.D. in Political Science from Vanderbilt University. Dr. Husser is also Assistant Professor of Political Science at Elon University. He recently published an article on public opinion in the American Journal of Political Science. He was previously the Associate Coordinator of the Vanderbilt University Poll.
John Robinson serves as Director of Communications for the Poll. He is a former newspaper editor, veteran journalist, and North Carolina native.
Daniel Anderson is Vice President of Elon University Communications. Eric Townsend is Director of the Elon University News Bureau. Both work very closely with the directors in communicating results of the poll.
Faculty members in the Department of Political Science, chaired by Dr. Sharon Spray, are also involved in advising the directors.
The poll operates under the auspices of the College of Arts and Sciences at Elon University, led by Dean Alison Morrison-Shetlar. The Elon University administration, led by Dr. Leo Lambert, president of the university, fully supports the Elon University Poll as part of its service commitment to state, regional, and national constituents.
Elon University fully funds the Elon University Poll. Because of this generous support, the Elon University poll does not engage in any contract work. This permits the Elon University Poll to operate as a neutral, non-biased, non-partisan resource.
Elon University students administer the survey as part of the University’s commitment to civic engagement and experiential learning where “students learn through doing.” Student interviewers receive extensive training prior to engaging in interviewing. A team of student supervisors (led by Mary Young ‘14) assists the directors with quality control and monitoring.
Fernandez
Husser
Robinson

http://www.elon.edu/elonpoll• facebook.com/elonpoll • @elonpoll
Page 76 April 5-9, 2013

http://www.elon.edu/elonpoll• facebook.com/elonpoll • @elonpoll
Page 77 April 5-9, 2013
For more information on the Elon University Poll, visit www.elon.edu/elonpoll Or contact:
Kenneth E. Fernandez, Ph.D.
Director of the Elon University Poll & Assistant Professor of Political Science
[email protected] (336) 278-6438
Jason A. Husser, Ph.D.
Assistant Director of the Elon University Poll & Assistant Professor of Political Science
[email protected] (336) 278-5239