elon north carolina poll (march 9)
TRANSCRIPT
8/2/2019 Elon North Carolina Poll (March 9)
http://slidepdf.com/reader/full/elon-north-carolina-poll-march-9 1/15
March9,2012
I. Survey Methodology
The Elon University Poll is conducted using a stratified random sample of households with
telephones and wireless telephone numbers in the population of interest – in this case, citizensin North Carolina. The sample of telephone numbers for the survey is obtained from SurveySampling International, LLC. Methodological information is also available at:
http://www.elon.edu/e-web/elonpoll/methodology.xhtml.
Selection of Households
To equalize the probability of telephone selection, sample telephone numbers are systematicallystratified according to subpopulation strata (e.g., a zip code, a county, a state, etc.), which yields
a sample from telephone exchanges in proportion to each exchange's share of telephonehouseholds in the population of interest. Estimates of telephone households in the population of
interest are generally obtained from several databases. Samples of household telephone
numbers are distributed across all eligible blocks of numbers in proportion to the density of listed households assigned in the population of interest according to a specified subpopulationstratum. Upon determining the projected (or preferred) sample size, a sampling interval is
calculated by summing the number of listed residential numbers in each eligible block within the
population of interest and dividing that sum by the number of sampling points assigned to thepopulation. From a random start between zero and the sampling interval, blocks are
systematically selected in proportion to the density of listed household "working blocks." A block (also known as a bank ) is a set of contiguous numbers identified by the first two digits of the lastfour digits of a telephone number. A working block contains three or more working telephone
numbers. Exchanges are assigned to a population on the basis of all eligible blocks in
proportion to the density of working telephone households. Once each population's proportionof telephone households is determined, then a sampling interval, based on that proportion, iscalculated and specific exchanges and numbers are randomly selected. The methodology for
the wireless component of this study starts with the determining which area code-exchangecombinations in North Carolina are included in the wireless or shared Telcordia types. Similar
to the process for selecting household telephone numbers, wireless numbers involve a multi-
step process in which blocks of numbers are determined for each area code-exchangecombination in the Telcordia types. From a random start within the first sampling interval, asystematic nth selection of each block of numbers is performed and a two-digit random number
between 00 and 99 is appended to each selected nth block stem. The intent is to provide a
stratification that will yield a sample that is representative both geographically and by large andsmall carrier. From these, a random sample is generated. Because exchanges and numbersare randomly selected by the computer, unlisted as well as listed household telephone numbers
are included in the sample. Thus, the sample of telephone numbers generated for the
8/2/2019 Elon North Carolina Poll (March 9)
http://slidepdf.com/reader/full/elon-north-carolina-poll-march-9 2/15
population of interest constitutes a random sample of telephone households and wireless
numbers of the population.
Procedures Used for Conducting the Poll
The survey was conducted Sunday, February 26
th
, through Thursday, March 1
st
, of 2012.During this time calls were made from 1:00pm to 6:00pm on Sunday and 5:00 pm to 9:00 pm on
Monday through Thursday. The Elon University Poll uses CATI system software (Computer Assisted Telephone Interviewing) in the administration of surveys. For each working telephonenumber in the sample, several attempts were made to reach each number. Only individuals 18
years or older were interviewed; those reached at business or work numbers were notinterviewed. For each number reached, one adult is generally selected based on whether s/he
is the oldest or youngest adult. Interviews, which are conducted by live interviewers, are
completed with adults from the target population as specified. Interviews for this survey werecompleted with 605 adults from North Carolina. For a sample size of 605, there is a 95 percentprobability that our survey results are within plus or minus 3.98 percentage points (the margin of
sampling error) of the actual population distribution for any given question. For sub-samples (a
subgroup selected from the overall sample), the margin of error is higher depending on the sizeof the subsample. When we use a subsample, we identify these results as being from a
subsample and provide the total number of respondents and margin of error for that subsample.In reporting our results, we note any use of a subsample where applicable. Because our surveys are based on probability sampling, there are a variety of factors that prevent these
results from being perfect, complete depictions of the population; the foremost example is that
of margin of sampling error (as noted above). With all probability samples, there are theoreticaland practical difficulties estimating population characteristics (or parameters). Thus, whileefforts are made to reduce or lessen such threats, sampling error as well as other sources of
error – while not all inclusive, examples of other error effects are non-response rates, question
order effects, question wording effects, etc. – are present in surveys derived from probabilitysamples.
Questions and Question Order
The Elon University Poll provides the questions as worded and the order in which these
questions are administered (to respondents). Conspicuous in reviewing some questions is the
“bracketed” information. Information contained within brackets ( [ ] ) denotes response options
as provided in the question; this bracketed information is rotated randomly to ensure thatrespondents do not receive a set order of response options presented to them, which alsomaintains question construction integrity by avoiding respondent acquiescence based on
question composition. Some questions used a probe maneuver to determine a respondent’sintensity of perspective. Probe techniques used in this questionnaire mainly consist of asking a
respondent if their response is more intense than initially provided. For example, uponindicating whether s/he is satisfied or dissatisfied, we asked the respondent “would you say youare very ‘satisfied’/’dissatisfied’”. This technique is employed in some questions as opposed to
specifying the full range of choices in the question. Though specifying the full range of options
in questions is a commonly accepted practice in survey research, we sometimes prefer that the
respondent determine whether their perspective is stronger or more intense for which the probetechnique used. Another method for acquiring information from respondents is to ask an “open-ended” question. The open-ended question is a question for which no response options are
provided, i.e., it is entirely up to the respondent to provide the response information.
8/2/2019 Elon North Carolina Poll (March 9)
http://slidepdf.com/reader/full/elon-north-carolina-poll-march-9 3/15
The Elon University Poll
The Elon University Poll is conducted under the auspices of the Center for Public OpinionPolling (Dr. Mileah Kromer, Assistant Director), which is housed in the Department of Political
Science and Public Administration at Elon University. These academic units are part of ElonCollege, the College of Arts and Sciences at Elon University. The Elon University
administration, led by Dr. Leo Lambert, President of the university, fully support the ElonUniversity Poll as part of its service commitment to state, regional, and national constituents.Elon University students administer the survey as part of the University’s commitment to
experiential learning where “students learn through doing.”
II. Survey Instrument and Percent Distributions by Question
Interviews were completed with 605 adults from households in the North Carolina. For asample size of 605, there is a 95 percent probability that our survey results are within plus or
minus 3.98 percentage points (the margin of sampling error) of the actual population distributionfor any given question. The questions are presented in the order in which these appear on the
survey instrument. Due to rounding, column totals may not equal 100 percent as indicated.Data are weighted to reflect the adult population in terms of age.
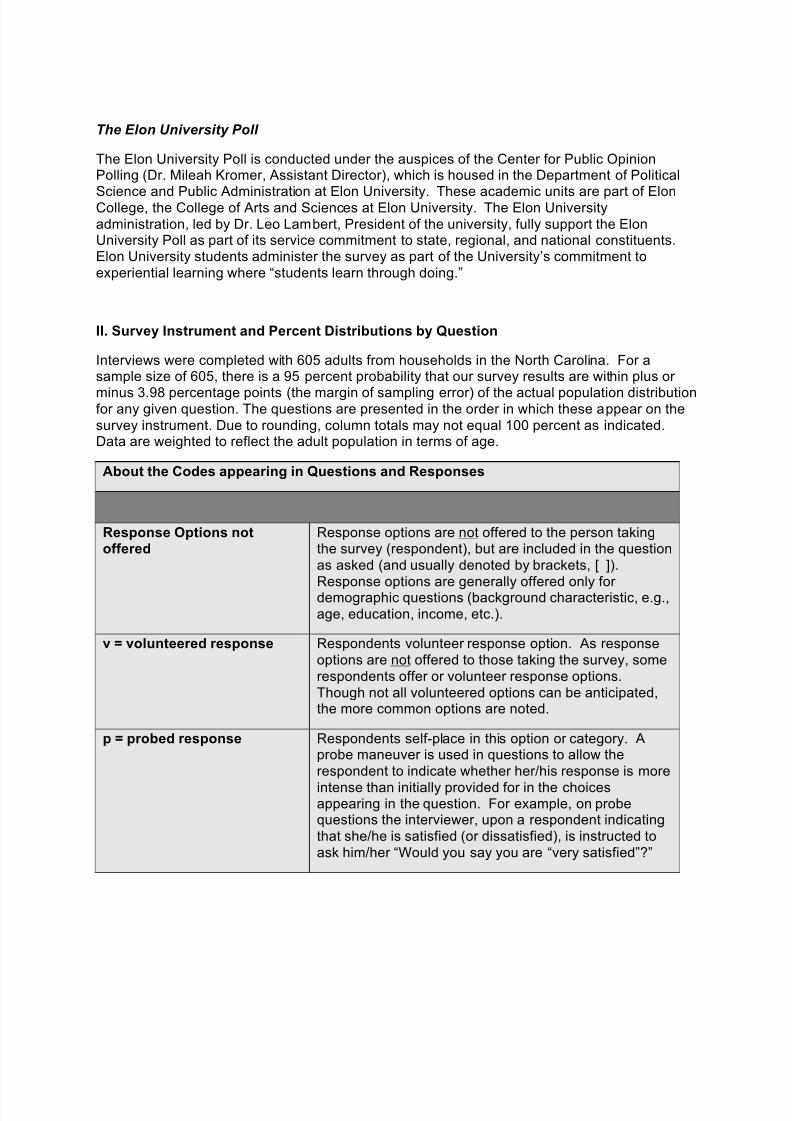
About the Codes appearing in Questions and Responses
Response Options notoffered
Response options are not offered to the person takingthe survey (respondent), but are included in the question
as asked (and usually denoted by brackets, [ ]).
Response options are generally offered only for demographic questions (background characteristic, e.g.,
age, education, income, etc.).
v = volunteered response Respondents volunteer response option. As response
options are not offered to those taking the survey, some
respondents offer or volunteer response options.
Though not all volunteered options can be anticipated,the more common options are noted.
p = probed response Respondents self-place in this option or category. Aprobe maneuver is used in questions to allow the
respondent to indicate whether her/his response is more
intense than initially provided for in the choicesappearing in the question. For example, on probequestions the interviewer, upon a respondent indicating
that she/he is satisfied (or dissatisfied), is instructed to
ask him/her “Would you say you are “very satisfied”?”
8/2/2019 Elon North Carolina Poll (March 9)
http://slidepdf.com/reader/full/elon-north-carolina-poll-march-9 4/15
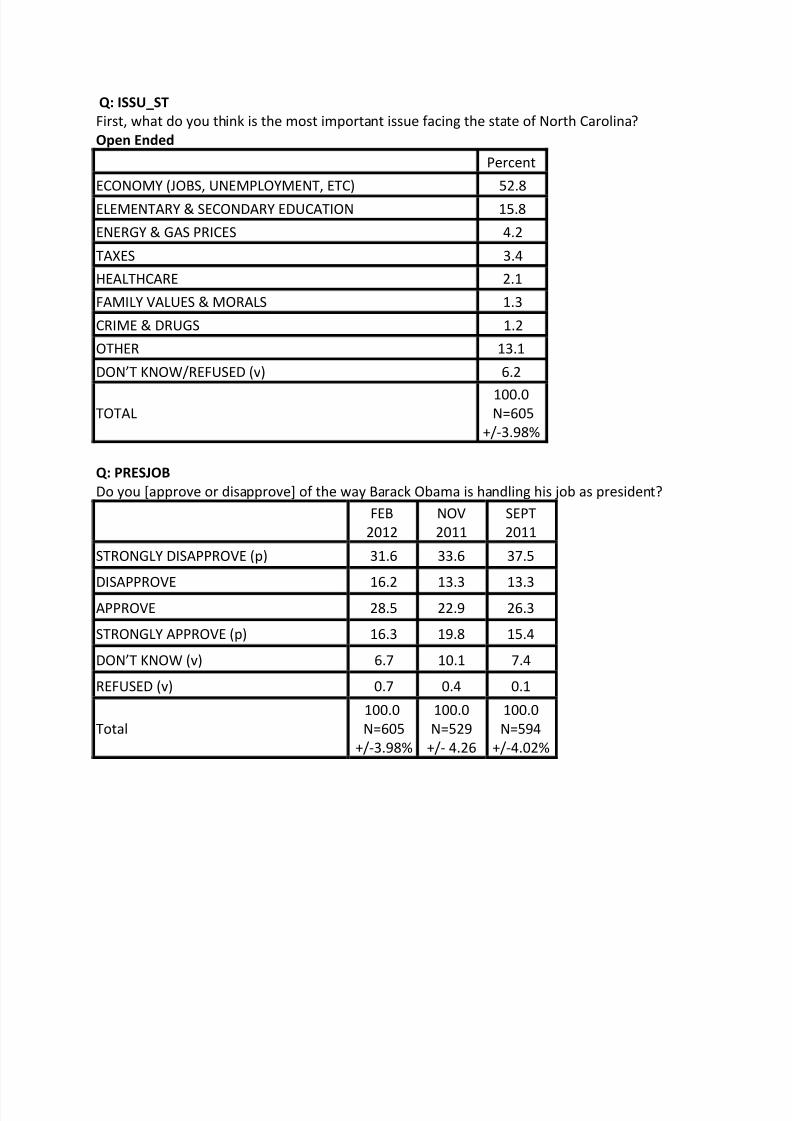
Q:ISSU_ST
First,whatdoyouthinkisthemostimportantissuefacingthestateofNorthCarolina?
OpenEnded
Percent
ECONOMY(JOBS,UNEMPLOYMENT,ETC) 52.8
ELEMENTARY&SECONDARYEDUCATION 15.8
ENERGY&GASPRICES 4.2
TAXES 3.4
HEALTHCARE 2.1
FAMILYVALUES&MORALS 1.3
CRIME&DRUGS 1.2
OTHER 13.1
DON’TKNOW/REFUSED(v) 6.2
TOTAL100.0N=605
+/-3.98%
Q:PRESJOB
Doyou[approveordisapprove]ofthewayBarackObamaishandlinghisjobaspresident?
FEB
2012
NOV
2011
SEPT
2011
STRONGLYDISAPPROVE(p) 31.6 33.6 37.5
DISAPPROVE 16.2 13.3 13.3APPROVE 28.5 22.9 26.3
STRONGLYAPPROVE(p) 16.3 19.8 15.4
DON’TKNOW(v) 6.7 10.1 7.4
REFUSED(v) 0.7 0.4 0.1
Total
100.0
N=605
+/-3.98%
100.0
N=529
+/-4.26
100.0
N=594
+/-4.02%
8/2/2019 Elon North Carolina Poll (March 9)
http://slidepdf.com/reader/full/elon-north-carolina-poll-march-9 5/15
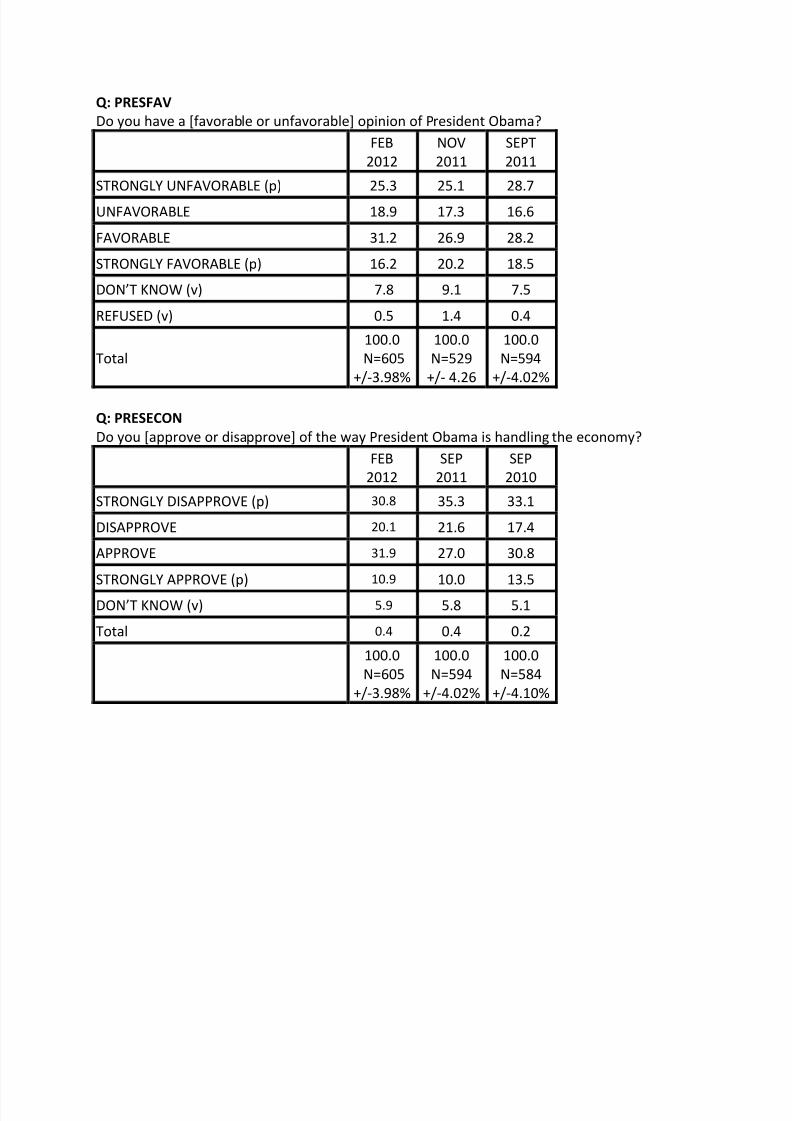
Q:PRESFAV
Doyouhavea[favorableorunfavorable]opinionofPresidentObama?
FEB
2012
NOV
2011
SEPT
2011
STRONGLYUNFAVORABLE(p) 25.3 25.1 28.7
UNFAVORABLE 18.9 17.3 16.6
FAVORABLE 31.2 26.9 28.2
STRONGLYFAVORABLE(p) 16.2 20.2 18.5
DON’TKNOW(v) 7.8 9.1 7.5
REFUSED(v) 0.5 1.4 0.4
Total
100.0
N=605
+/-3.98%
100.0
N=529
+/-4.26
100.0
N=594
+/-4.02%
Q:PRESECON
Doyou[approveordisapprove]ofthewayPresidentObamaishandlingtheeconomy?
FEB
2012
SEP
2011
SEP
2010
STRONGLYDISAPPROVE(p) 30.8 35.3 33.1
DISAPPROVE 20.1 21.6 17.4
APPROVE 31.9 27.0 30.8
STRONGLYAPPROVE(p) 10.9 10.0 13.5
DON’TKNOW(v) 5.9 5.8 5.1
Total 0.4 0.4 0.2
100.0
N=605
+/-3.98%
100.0
N=594
+/-4.02%
100.0
N=584
+/-4.10%
8/2/2019 Elon North Carolina Poll (March 9)
http://slidepdf.com/reader/full/elon-north-carolina-poll-march-9 6/15
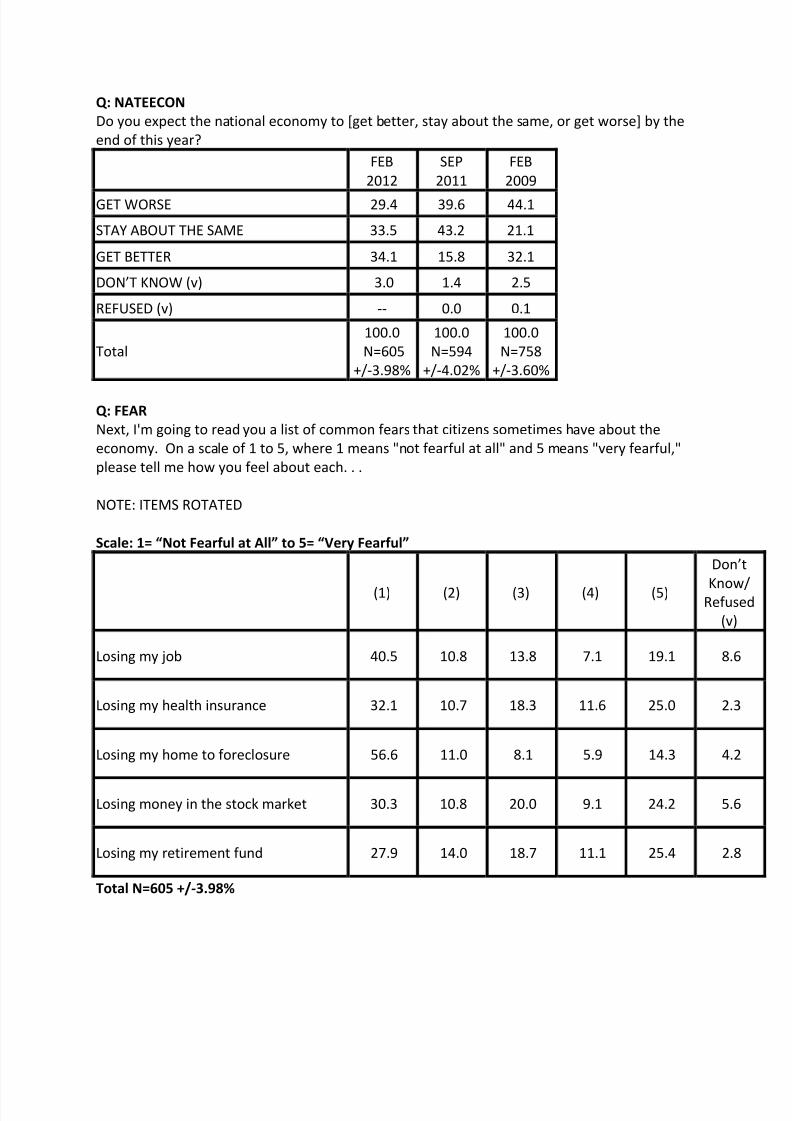
Q:NATEECON
Doyouexpectthenationaleconomyto[getbetter,stayaboutthesame,orgetworse]bythe
endofthisyear?
FEB
2012
SEP
2011
FEB
2009
GETWORSE 29.4 39.6 44.1
STAYABOUTTHESAME 33.5 43.2 21.1
GETBETTER 34.1 15.8 32.1
DON’TKNOW(v) 3.0 1.4 2.5
REFUSED(v) -- 0.0 0.1
Total
100.0
N=605
+/-3.98%
100.0
N=594
+/-4.02%
100.0
N=758
+/-3.60%
Q:FEAR
Next,I'mgoingtoreadyoualistofcommonfearsthatcitizenssometimeshaveaboutthe
economy.Onascaleof1to5,where1means"notfearfulatall"and5means"veryfearful,"
pleasetellmehowyoufeelabouteach...
NOTE:ITEMSROTATED
Scale:1=“NotFearfulatAll”to5=“VeryFearful”
(1) (2) (3) (4) (5)
Don’
KnowRefuse
(v)
Losingmyjob 40.5 10.8 13.8 7.1 19.1 8.6
Losingmyhealthinsurance 32.1 10.7 18.3 11.6 25.0 2.3
Losingmyhometoforeclosure 56.6 11.0 8.1 5.9 14.3 4.2
Losingmoneyinthestockmarket 30.3 10.8 20.0 9.1 24.2 5.6
Losingmyretirementfund 27.9 14.0 18.7 11.1 25.4 2.8
TotalN=605+/-3.98%
8/2/2019 Elon North Carolina Poll (March 9)
http://slidepdf.com/reader/full/elon-north-carolina-poll-march-9 7/15
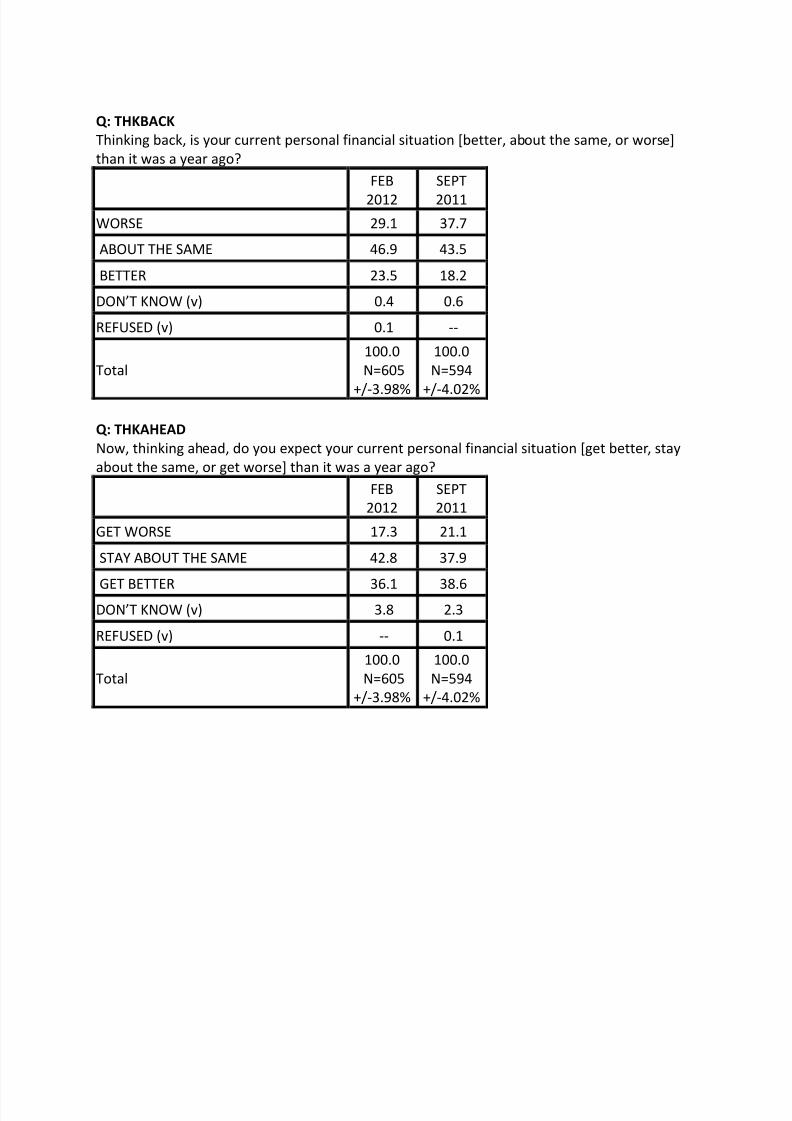
Q:THKBACK
Thinkingback,isyourcurrentpersonalfinancialsituation[better,aboutthesame,orworse]
thanitwasayearago?
FEB
2012
SEPT
2011
WORSE 29.1 37.7
ABOUTTHESAME 46.9 43.5
BETTER 23.5 18.2
DON’TKNOW(v) 0.4 0.6
REFUSED(v) 0.1 --
Total
100.0
N=605
+/-3.98%
100.0
N=594
+/-4.02%
Q:THKAHEAD
Now,thinkingahead,doyouexpectyourcurrentpersonalfinancialsituation[getbetter,stay
aboutthesame,orgetworse]thanitwasayearago?
FEB
2012
SEPT
2011
GETWORSE 17.3 21.1
STAYABOUTTHESAME 42.8 37.9
GETBETTER 36.1 38.6DON’TKNOW(v) 3.8 2.3
REFUSED(v) -- 0.1
Total
100.0
N=605
+/-3.98%
100.0
N=594
+/-4.02%
8/2/2019 Elon North Carolina Poll (March 9)
http://slidepdf.com/reader/full/elon-north-carolina-poll-march-9 8/15
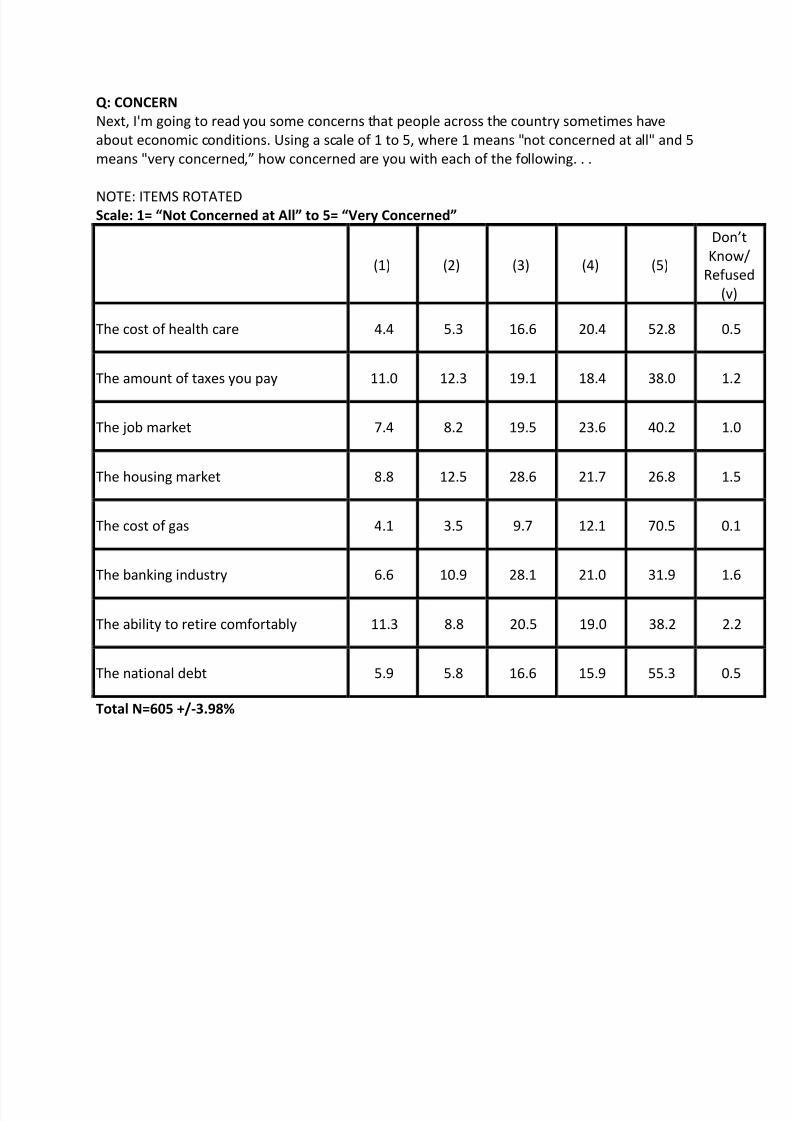
Q:CONCERN
Next,I'mgoingtoreadyousomeconcernsthatpeopleacrossthecountrysometimeshave
abouteconomicconditions.Usingascaleof1to5,where1means"notconcernedatall"and5
means"veryconcerned,”howconcernedareyouwitheachofthefollowing...
NOTE:ITEMSROTATEDScale:1=“NotConcernedatAll”to5=“VeryConcerned”
(1) (2) (3) (4) (5)
Don’
Know
Refuse
(v)
Thecostofhealthcare 4.4 5.3 16.6 20.4 52.8 0.5
Theamountoftaxesyoupay 11.0 12.3 19.1 18.4 38.0 1.2
Thejobmarket 7.4 8.2 19.5 23.6 40.2 1.0
Thehousingmarket 8.8 12.5 28.6 21.7 26.8 1.5
Thecostofgas 4.1 3.5 9.7 12.1 70.5 0.1
Thebankingindustry 6.6 10.9 28.1 21.0 31.9 1.6
Theabilitytoretirecomfortably 11.3 8.8 20.5 19.0 38.2 2.2
Thenationaldebt 5.9 5.8 16.6 15.9 55.3 0.5
TotalN=605+/-3.98%
8/2/2019 Elon North Carolina Poll (March 9)
http://slidepdf.com/reader/full/elon-north-carolina-poll-march-9 9/15
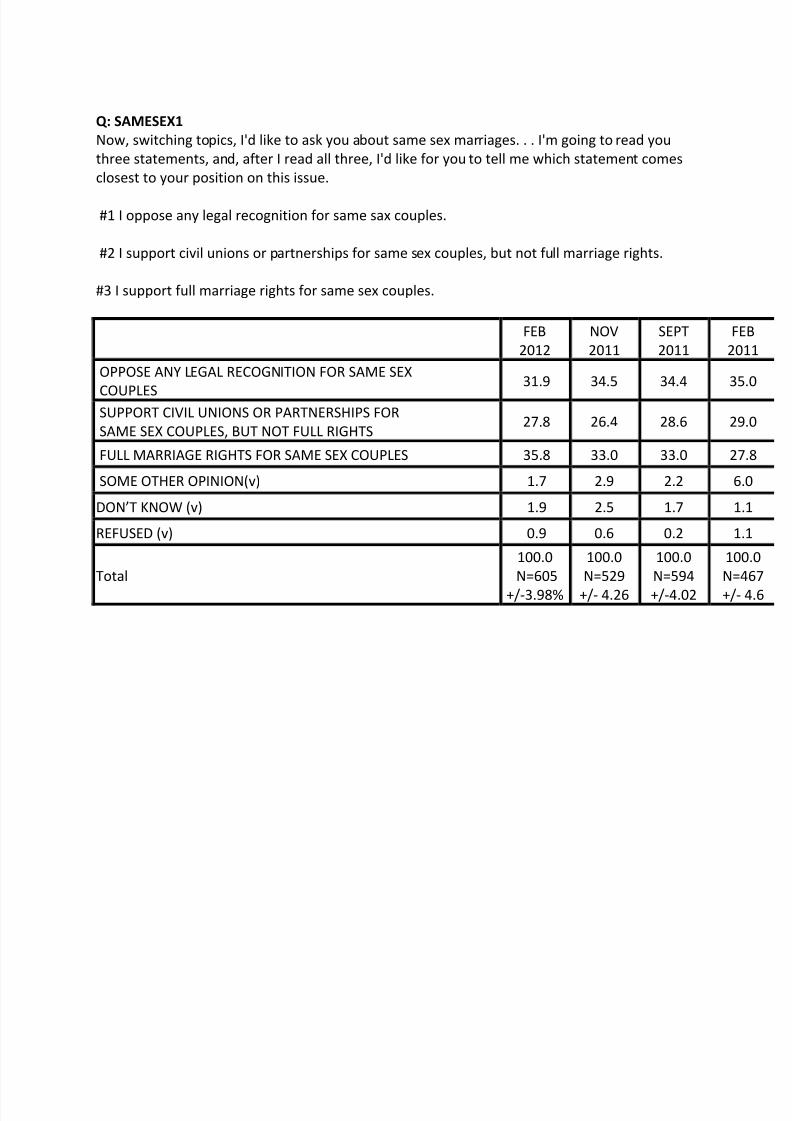
Q:SAMESEX1
Now,switchingtopics,I'dliketoaskyouaboutsamesexmarriages...I'mgoingtoreadyou
threestatements,and,afterIreadallthree,I'dlikeforyoutotellmewhichstatementcomes
closesttoyourpositiononthisissue.
#1Iopposeanylegalrecognitionforsamesaxcouples.
#2Isupportcivilunionsorpartnershipsforsamesexcouples,butnotfullmarriagerights.
#3Isupportfullmarriagerightsforsamesexcouples.
FEB
2012
NOV
2011
SEPT
2011
FE
20
OPPOSEANYLEGALRECOGNITIONFORSAMESEX
COUPLES
31.9 34.5 34.4 35
SUPPORTCIVILUNIONSORPARTNERSHIPSFOR
SAMESEXCOUPLES,BUTNOTFULLRIGHTS27.8 26.4 28.6 29
FULLMARRIAGERIGHTSFORSAMESEXCOUPLES 35.8 33.0 33.0 27
SOMEOTHEROPINION(v) 1.7 2.9 2.2 6
DON’TKNOW(v) 1.9 2.5 1.7 1
REFUSED(v) 0.9 0.6 0.2 1
Total
100.0
N=605
+/-3.98%
100.0
N=529
+/-4.26
100.0
N=594
+/-4.02
10
N=
+/-
8/2/2019 Elon North Carolina Poll (March 9)
http://slidepdf.com/reader/full/elon-north-carolina-poll-march-9 10/15
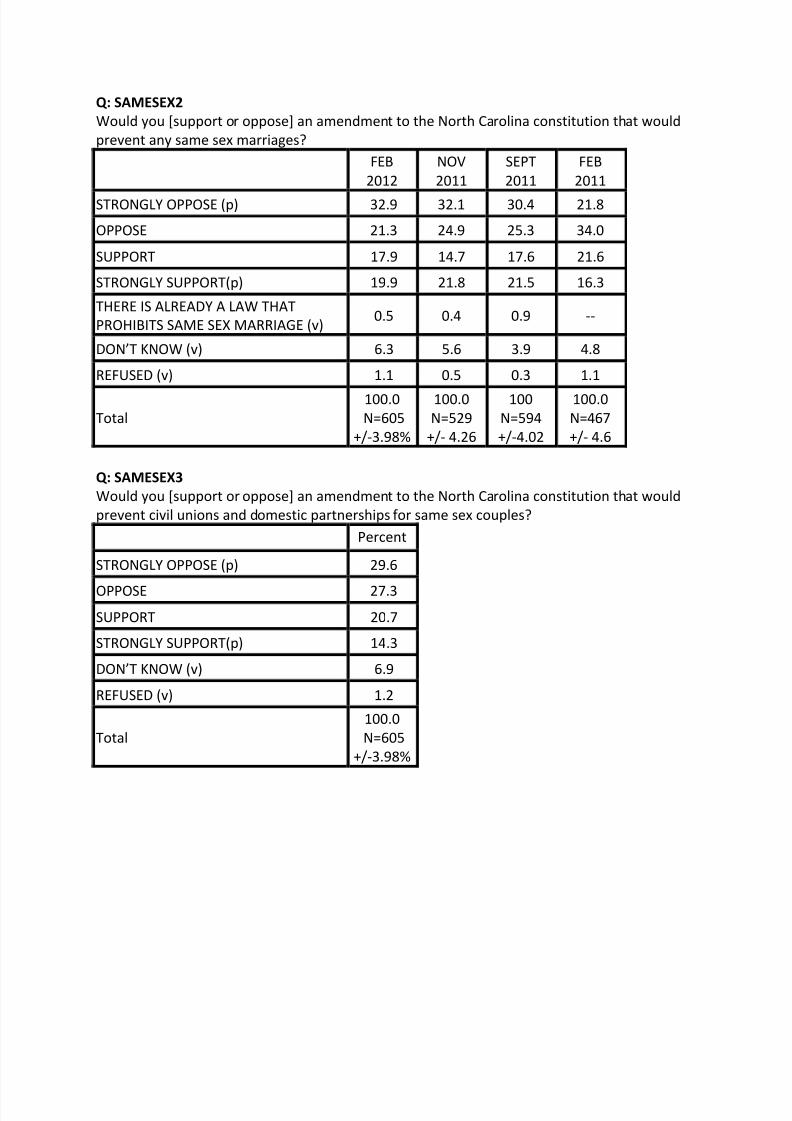
Q:SAMESEX2
Wouldyou[supportoroppose]anamendmenttotheNorthCarolinaconstitutionthatwould
preventanysamesexmarriages?
FEB
2012
NOV
2011
SEPT
2011
FEB
2011
STRONGLYOPPOSE(p) 32.9 32.1 30.4 21.8
OPPOSE 21.3 24.9 25.3 34.0
SUPPORT 17.9 14.7 17.6 21.6
STRONGLYSUPPORT(p) 19.9 21.8 21.5 16.3
THEREISALREADYALAWTHAT
PROHIBITSSAMESEXMARRIAGE(v)0.5 0.4 0.9 --
DON’TKNOW(v) 6.3 5.6 3.9 4.8
REFUSED(v) 1.1 0.5 0.3 1.1
Total
100.0
N=605
+/-3.98%
100.0
N=529
+/-4.26
100
N=594
+/-4.02
100.0
N=467
+/-4.6
Q:SAMESEX3
Wouldyou[supportoroppose]anamendmenttotheNorthCarolinaconstitutionthatwould
preventcivilunionsanddomesticpartnershipsforsamesexcouples?
Percent
STRONGLYOPPOSE(p) 29.6
OPPOSE 27.3
SUPPORT 20.7
STRONGLYSUPPORT(p) 14.3
DON’TKNOW(v) 6.9
REFUSED(v) 1.2
Total
100.0
N=605
+/-3.98%
8/2/2019 Elon North Carolina Poll (March 9)
http://slidepdf.com/reader/full/elon-north-carolina-poll-march-9 11/15
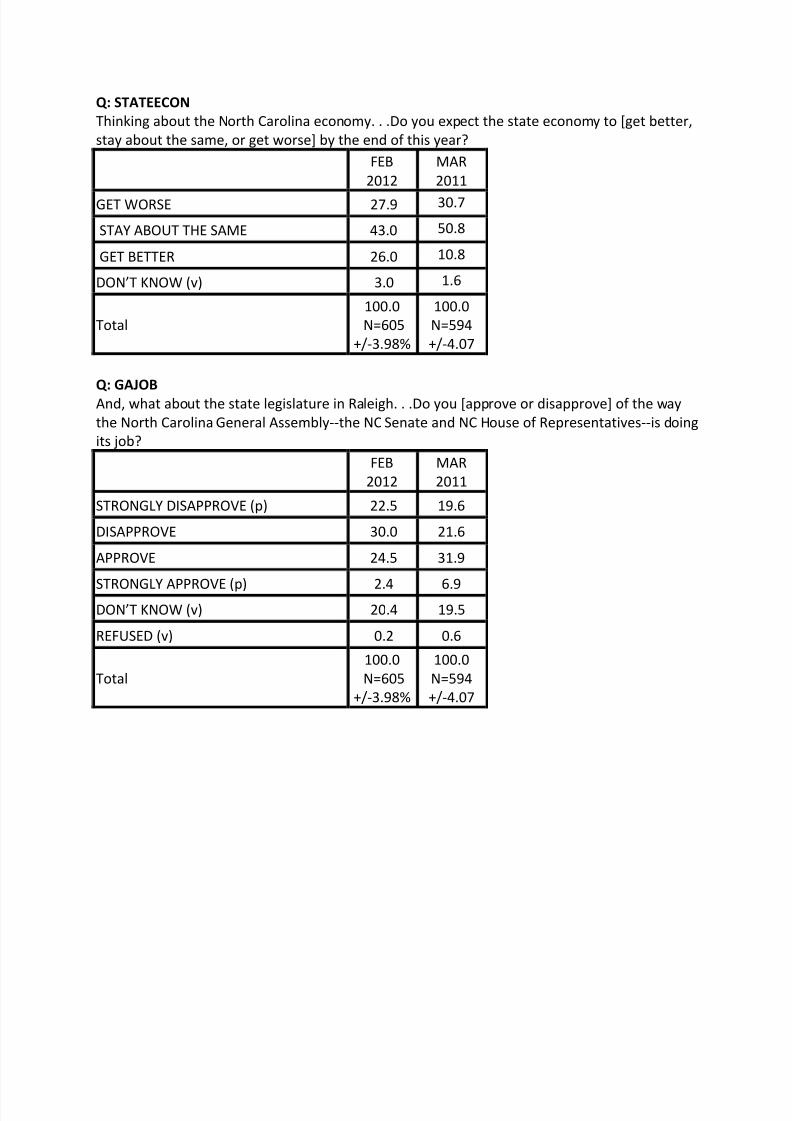
Q:STATEECON
ThinkingabouttheNorthCarolinaeconomy...Doyouexpectthestateeconomyto[getbetter,
stayaboutthesame,orgetworse]bytheendofthisyear?
FEB
2012
MAR
2011
GETWORSE 27.9 30.7
STAYABOUTTHESAME 43.0 50.8
GETBETTER 26.0 10.8
DON’TKNOW(v) 3.0 1.6
Total
100.0
N=605
+/-3.98%
100.0
N=594
+/-4.07
Q:GAJOB
And,whataboutthestatelegislatureinRaleigh...Doyou[approveordisapprove]oftheway
theNorthCarolinaGeneralAssembly--theNCSenateandNCHouseofRepresentatives--isdoing
itsjob?
FEB
2012
MAR
2011
STRONGLYDISAPPROVE(p) 22.5 19.6
DISAPPROVE 30.0 21.6
APPROVE 24.5 31.9
STRONGLYAPPROVE(p) 2.4 6.9DON’TKNOW(v) 20.4 19.5
REFUSED(v) 0.2 0.6
Total
100.0
N=605
+/-3.98%
100.0
N=594
+/-4.07
8/2/2019 Elon North Carolina Poll (March 9)
http://slidepdf.com/reader/full/elon-north-carolina-poll-march-9 12/15
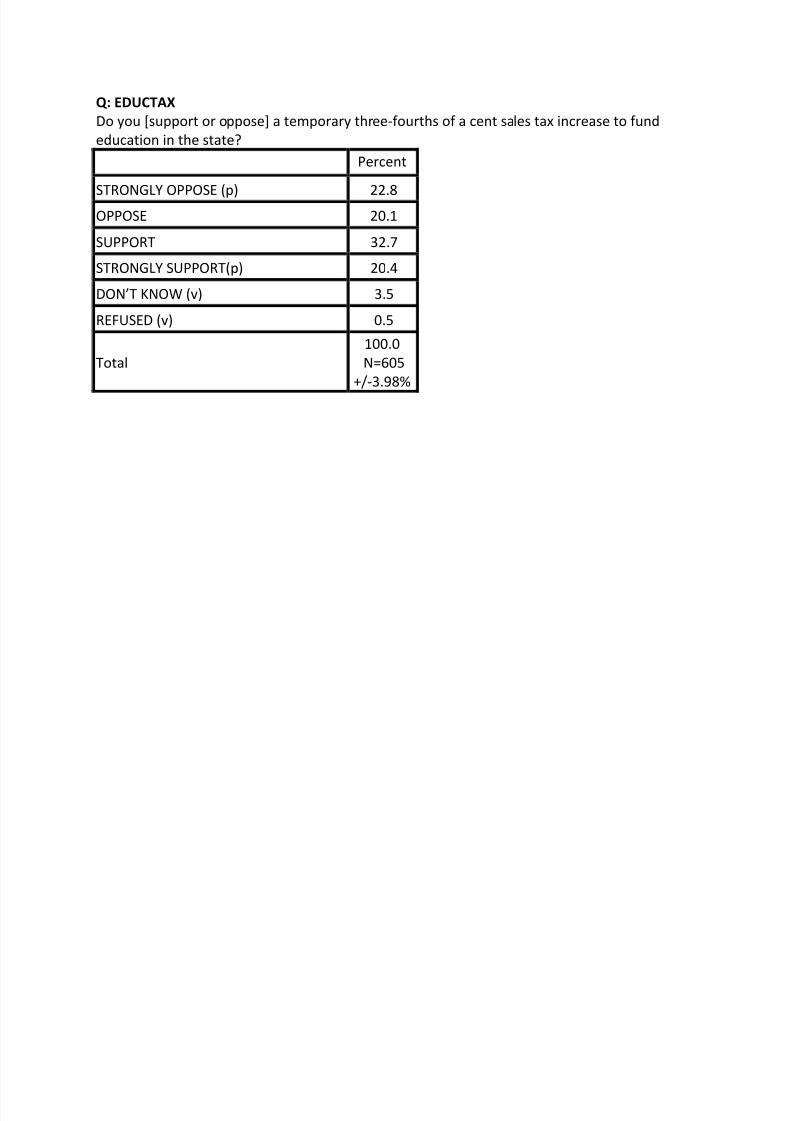
Q:EDUCTAX
Doyou[supportoroppose]atemporarythree-fourthsofacentsalestaxincreasetofund
educationinthestate?
Percent
STRONGLYOPPOSE(p) 22.8OPPOSE 20.1
SUPPORT 32.7
STRONGLYSUPPORT(p) 20.4
DON’TKNOW(v) 3.5
REFUSED(v) 0.5
Total
100.0
N=605
+/-3.98%
8/2/2019 Elon North Carolina Poll (March 9)
http://slidepdf.com/reader/full/elon-north-carolina-poll-march-9 13/15
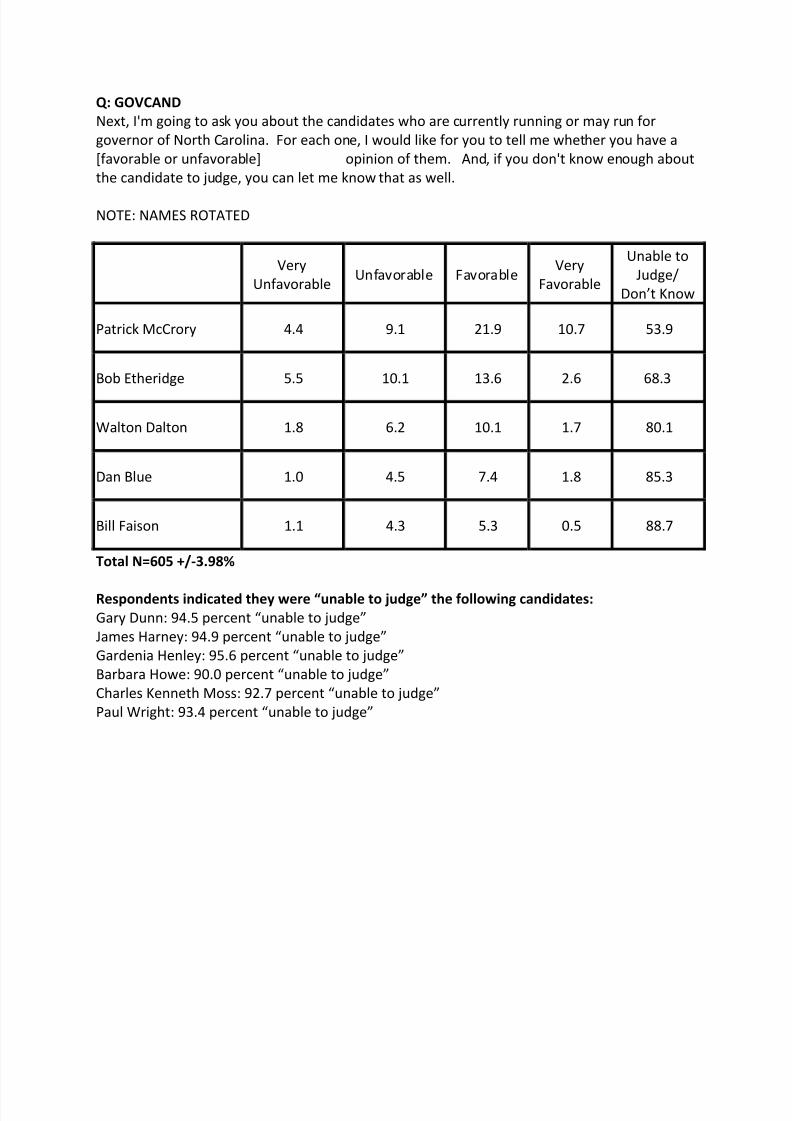
Q:GOVCAND
Next,I'mgoingtoaskyouaboutthecandidateswhoarecurrentlyrunningormayrunfor
governorofNorthCarolina.Foreachone,Iwouldlikeforyoutotellmewhetheryouhavea
[favorableorunfavorable]opinionofthem.And,ifyoudon'tknowenoughabout
thecandidatetojudge,youcanletmeknowthataswell.
NOTE:NAMESROTATED
Very
UnfavorableUnfavorable Favorable
Very
Favorable
Unableto
Judge/
Don’tKnow
PatrickMcCrory 4.4 9.1 21.9 10.7 53.9
BobEtheridge 5.5 10.1 13.6 2.6 68.3
WaltonDalton 1.8 6.2 10.1 1.7 80.1
DanBlue 1.0 4.5 7.4 1.8 85.3
BillFaison 1.1 4.3 5.3 0.5 88.7
TotalN=605+/-3.98%
Respondentsindicatedtheywere“unabletojudge”thefollowingcandidates:
GaryDunn:94.5percent“unabletojudge”
JamesHarney:94.9percent“unabletojudge”
GardeniaHenley:95.6percent“unabletojudge”
BarbaraHowe:90.0percent“unabletojudge”
CharlesKennethMoss:92.7percent“unabletojudge”
PaulWright:93.4percent“unabletojudge”
8/2/2019 Elon North Carolina Poll (March 9)
http://slidepdf.com/reader/full/elon-north-carolina-poll-march-9 14/15
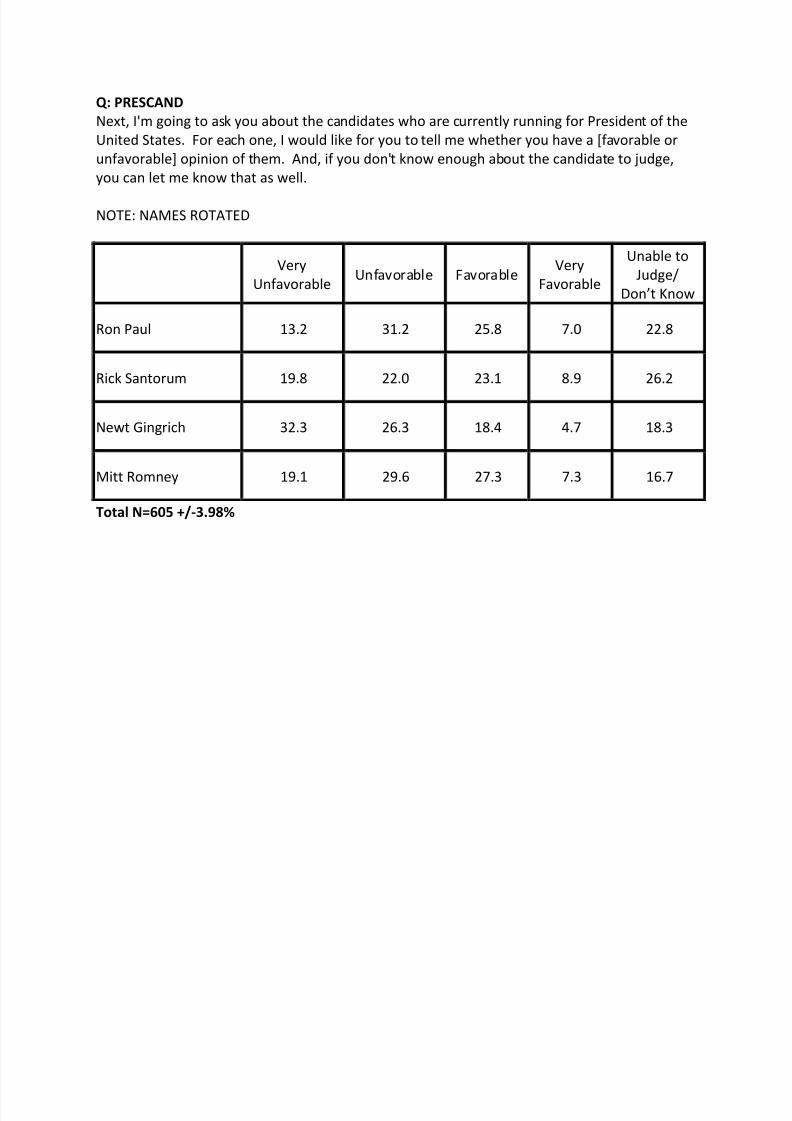
Q:PRESCAND
Next,I'mgoingtoaskyouaboutthecandidateswhoarecurrentlyrunningforPresidentofthe
UnitedStates.Foreachone,Iwouldlikeforyoutotellmewhetheryouhavea[favorableor
unfavorable]opinionofthem.And,ifyoudon'tknowenoughaboutthecandidatetojudge,
youcanletmeknowthataswell.
NOTE:NAMESROTATED
Very
UnfavorableUnfavorable Favorable
Very
Favorable
Unableto
Judge/
Don’tKnow
RonPaul 13.2 31.2 25.8 7.0 22.8
RickSantorum 19.8 22.0 23.1 8.9 26.2
NewtGingrich 32.3 26.3 18.4 4.7 18.3
MittRomney 19.1 29.6 27.3 7.3 16.7
TotalN=605+/-3.98%
8/2/2019 Elon North Carolina Poll (March 9)
http://slidepdf.com/reader/full/elon-north-carolina-poll-march-9 15/15
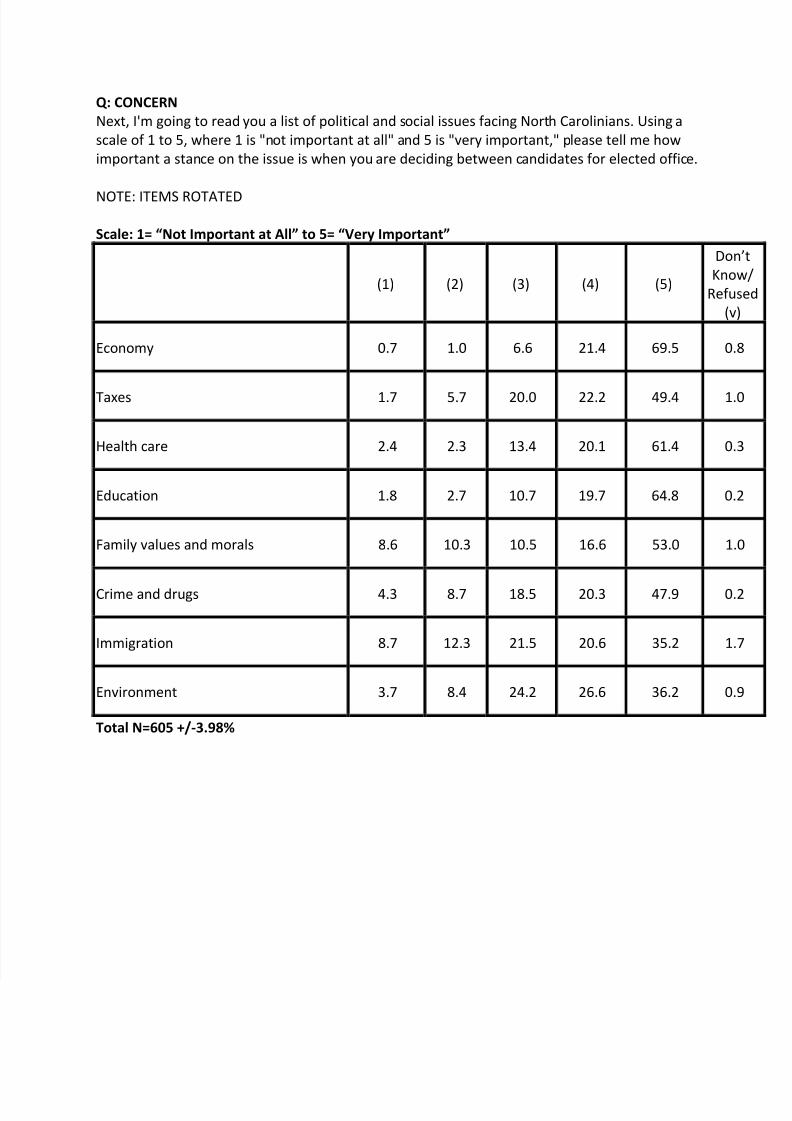
Q:CONCERN
Next,I'mgoingtoreadyoualistofpoliticalandsocialissuesfacingNorthCarolinians.Usinga
scaleof1to5,where1is"notimportantatall"and5is"veryimportant,"pleasetellmehow
importantastanceontheissueiswhenyouaredecidingbetweencandidatesforelectedoffice.
NOTE:ITEMSROTATED
Scale:1=“NotImportantatAll”to5=“VeryImportant”
(1) (2) (3) (4) (5)
Don
Know
Refus
(v)
Economy 0.7 1.0 6.6 21.4 69.5 0.8
Taxes 1.7 5.7 20.0 22.2 49.4 1.0
Healthcare 2.4 2.3 13.4 20.1 61.4 0.3
Education 1.8 2.7 10.7 19.7 64.8 0.2
Familyvaluesandmorals 8.6 10.3 10.5 16.6 53.0 1.0
Crimeanddrugs 4.3 8.7 18.5 20.3 47.9 0.2
Immigration 8.7 12.3 21.5 20.6 35.2 1.7
Environment 3.7 8.4 24.2 26.6 36.2 0.9
TotalN=605+/-3.98%