elisa for detection of nap transgene ... - europepmc.org
TRANSCRIPT

1
Supplemental Data Lentiviral transduction. Endogenous expression of urokinase receptor (uPAR) was confirmed
in both CT-2A and GL261 cell lines by cell surface staining for uPAR-1 Alexa Fluor 594
(Novus Biologicals; clone A544; catalog 1443118; 1:200) by Flow cytometry analysis.
J774A.1 cell line was transduced with uPAR packaged lentivirus (LV-uPAR; in house
production) at MOI: 2 with 8 µg/ml Polybrene (EMD Millipore, USA) in a 6-well tissue
culture-treated plate (CORNING) in complete DMEM medium. UPAR over-expressed stably
transduced cell line was obtained by puromycin selection (2µg/ml; Gibco, Life Technologies)
6 days after transduction. Transduction efficiency was examined by surface expression of
uPAR-1 measured by Flow cytometry.
ELISA for detection of NAP transgene expression by infected cells. Secretory NAP release by
MV-s-NAP infected glioblastoma cells was quantified in vitro by NAP-specific ELISA. Highly
sensitive quantitative NAP-specific ELISA (detection limit is 5pg/ml) was developed in house
using the well characterized NAP-specific monoclonal antibody 16F4. Known concentration
of NAP antigen was used to create a standard curve. In short, Pierce™ 96-well polystyrene
ELISA plates (ThermoFisher Scientific; catalog 15041) were coated overnight with 2µg
purified 16F4 NAP antibody resuspended in carbonate-bicarbonate buffer (CBB), pH 9.6. and
after blocking with 1% bovine serum albumin (BSA; Sigma), serially diluted cell lysate
supernatant from virally infected in culture samples was added. Next, plates were incubated
with HRP-conjugated IgG secondary antibody (Santa Cruz Biotechnology). Plates were
washed four times with PBS/0.05% Tween 20 (Sigma) before each step. The reaction was
developed with TMB substrate (Bethyl Laboratories) and enzymatic reaction was stopped by
addition of ELISA stop solution (Invitrogen). Optical density (OD) was read at 450nm using a
Microplate reader (Infinite® M Nano, TECAN) and anti-NAP concentrations were calculated
using the standard curve values as reference.
Quantitative Real Time PCR. UPAR retargeted MV viral titers were determined by probe-
based quantitative PCR (qPCR). Measles virus nucleoprotein (N) was detected in mice bearing
orthotopic CT-2A glioma at day 2, after intratumoral injection of 2×10⁵ per median tissue
culture infectious dose (TCID50/ml) MV-GFP-uPA or MV-s-NAP-uPA. Briefly, individual
mouse brains were dissected under sterile conditions, snap frozen immediately in liquid
nitrogen and stored in -80°C. Biopsies from the left and right side of the brain, including the
tumor and the surrounding brain tissue area were collected and placed in Qiazol® Lysis
Reagent (QIAGEN; catalog 1023537) in the presence of a 5mm stainless steel bead. Complete
homogenization of the tissue was accomplished by operating the TissueLyser II instrument for

2
2 min at 20Hz. Total RNA was extracted using the RNeasy plus Universal Mini kit (QIAGEN;
catalog 73404), following the manufacturer’s protocol. RNA concentration of each sample
was measured using a NanoDrop™ (ThermoFisher Scientific). MV-N was measured using the
TaqMan®RNA-to-CT™ 1-Step Kit (Applied Biosystems; catalog 4392938) and run on a
LightCycler® Roche 480 machine (LifeScience). The forward and reverse primer sequences
used for detection of N protein were 5’-GGGTGTGCCGGTTGGA-3’ and 5’-
AGAAGCCAGGGAGAG CTACAGA-3’ respectively. The probe sequence was: (5’-/56-
FAM/TGGGCAGCTCTCGCATCACTTGC3BHQ_1/-3’). MV-N copy numbers were
calculated using a standard curve of 10-fold dilutions, containing 10^2 to 10^7 MV-N gene
copies/ml, generated with the purified 82bp genomic RNA oligonucleotide:
5’GGGUGUGCCGGUUGGAAGAUGGGCAGCUCUCGCAUCACUUGCUCUGCUGGG
CCCGGUUUCUCUGUAGCUCUCCCUGGCUUCU-3’. The PCR conditions included: 48°C
for 15 min, 95°C for 10 min, and 45 cycles of 95°C for 15 s and 60°C for 1 min. Non template
control, deionized diethylpyrocarbonate (DEPC) treated Nuclease Free Water with or without
reverse transcriptase was taken along to serve as negative controls. Known concentration of
MV RNA isolated from MV-NIS was used as positive control in each reaction. To assess the
quality of the total RNA obtained, RNA from tested tissue samples were run in Master mix
buffer omitting reverse transcriptase. Real-time PCR data were analyzed using LightCycler®
Roche 480 machine absolute quantification software.
Antibody detection and virus neutralization test. Pierce™ 96-well polystyrene ELISA plates
(ThermoFisher Scientific) were coated with 2×10⁴ TCID50 per well of purified MV-s-NAP
virus particles resuspended in carbonate-bicarbonate buffer (CBB) and after blocking with 5%
BSA, serially diluted sera in 1% BSA were added. Next, plates were incubated with HRP-
conjugated IgG secondary antibody (Santa Cruz Biotechnology). MV specific immunoglobulin
levels were measured following the same ELISA steps described previously for MV-s-NAP
ELISA. Systemic neutralization titers against uPAR retargeted MVs were measured in
peripheral blood of animals at 19 days after the first intracranial-intratumoral MV injection by
plaque-reduction microneutralization assay. Plaque reduction neutralization titer 50% (PNT50)
was calculated as previously reported (66). In vitro MV neutralization capacity of mAbs was
determined based on the antibody concentration required for 50% neutralization of the viral
particles (defined as 1 PNT50 activity).
Flow cytometry staining. Fluorochrome -labelled antibodies specific for mouse PD-L1 Pe/Cy7
(BioLegend; clone 10F.9G2; catalog 124314; 1:200), H-2Kb APC (BioLegend; clone DF6-
88.5; catalog 116517; 1:200), IFNAR-1 Pe (BioLegend; clone MAR1-5A3; catalog 127311;

3
1:200) and TLR2 Pe (BioLegend; clone CB225; catalog 148604; 1:100) and human PD-L1 Pe
(BioLegend; clone 29E.2A3; catalog 329706; 1:150) were used to label glioma cells for
experiments in vitro. Blood cells, brain cells and splenocytes were phenotyped by flow
cytometry. Briefly, cells were blocked with Fc block (CD16/CD132; clone 2.4G2, catalog
553142; 1:100, BD) in staining buffer (containing 2% FBS and 0.05% sodium azide in PBS)
for 15 minutes at room temperature, labeled with Viability Ghost Red APC/Cy7 (TONBO
biosciences; catalog 13-0865; 1:800), B220 FITC (BioLegend; clone RA3-6B2; catalog
553087; 1:100), CD45 PerCP (BioLegend; clone 30-F11; catalog 103130; 1:200), CD3 APC
(BioLegend; clone 145-2C11; catalog 553066; 1:200), CD3 Pe/Cy7 (clone 145-2C11; catalog
100320; 1:800), CD4 BV786 (BD Biosciences; clone RM4-5; catalog 563727; 1:200), CD8a
V450 (TONDO biosciences, clone 2.43; catalog 75-1886-U100; 1: 100), CD8 FITC
(BioLegend; clone 53-6.7; catalog 100706; 1:150), CD11b Brillian Violet 650 (BioLegend;
clone M1/70; catalog 101239; 1:150), F4/80 Pe (TONDO biosciences; clone BM8.1; catalog
50-4801; 1:200), NK1.1 Pe/Cy7 (eBioscience; clone PK136; catalog 25-5941-81; 1:200),
Ly6G A700 (BioLegend; clone 1A8; catalog 127622; 1:1000), Gr1 A700 (BioLegend; clone
RB6-8C5; catalog 108422; 1:800), Ly-6C APC (BioLegend; clone HK1.4; catalog 128015;
1:200), KLRG1 Pe/Cy7 (Biolegend; clone 2F1; catalog 138416; 1:200), CD25 APC
(BioLegend; clone PC61.5; catalog 108412; 1:200) and PD1 FITC (eBioscience; clone RPMI-
30; catalog 4347279; 1:200) mouse antibodies in staining buffer for 30 minutes at 4°C, and
washed x2 with staining buffer. Next, samples were resuspended in 100 µl of fixation buffer
(BD Biosciences) for 10 minutes and washed once with PBS and x2 with staining buffer. For
intracellular staining cells were fixed and permeabilized with Cytofix/Cytoperm™ buffer (BD
Biosciences) and stained for Granzyme B Pe (BD Biosciences; clone GB11; catalog 561142;
1:100) and Ki67 FITC (BD Biosciences; clone B-56; catalog 556026; 1:25, or resuspended in
FOXP3 Fix/Perm buffer (BioLegend) and stained for FOXP3 PE (eBioscience; clone FJK-16a;
12-5773-80; 1:200) according to manufacturer’s instructions. Samples were resuspended in
150 µl staining buffer and analyzed by flow cytometry in an LSRII or Fortessa Cytometer (BD
Biosciences). FlowJo software (Treestar Inc.) was used for data analysis. Immunophenotyping
gating strategies of immune cells in the mouse brain, spleen and peripheral blood are provided
in Supplemental Figure 11.

4
Supplemental Figure 1. MV-s-NAP-uPA shows cytopathic effect in CT-2A tumors in vivo and co-
treatment with ruxolitinib increases TILs recruitment in the tumor area. (A) Mice bearing CT-2A
tumors were treated intratumorally with inactivated MV-s-NAP-uPA or MV-s-NAP-uPA at day 5 and
day 8 post tumor implantation. Mice received 50 mg/kg ruxolitinib or vehicle (DMSO) twice daily by
oral gavage. Ruxolitinib was administered a day before viral infection and was terminated 48 h after
second viral injection. Mice were perfused and individual brains were collected in 10% formalin
fixative. (B) Representative H&E stained glioblastoma biopsies. Top left: Syncytia identified in the
tumor invasive front (left arrow and circle) and tumor core (right arrows and circles) of DMSO + MV-
s-NAP-uPA treated gliomas. Top right: High power microphotograph of a syncytium detected in
ruxolitinib + MV-s-NAP-uPA treated gliomas. Low left: Low density of tumor infiltrating lymphocytes
in DMSO + MV-s-NAP-uPA treated gliomas. Low right: High density of tumor infiltrating
lymphocytes in ruxolitinib + MV-s-NAP-uPA treated gliomas. (C) Tumor volumes (mm), syncytial
count (cells/mm2) and immune infiltrate density (% TILs) differences between groups (n=3 mice per
group). (D) MV-N copies/ µg of RNA measured in CT-2A brain-tumor biopsies of mice 48h post
second viral injection (n=4 mice per group). Each dot represents an individual mouse. The experiment
was repeated twice with similar outcome. Values represent Mean ±SD. *, P<0.05 and ns, not significant by 2-tailed unpaired Student’s t-test and one-way ANOVA with Tukey's multiple comparisons test.
Supplemental Figure 2: Infection with MV-s-NAP-uPA suppresses IFN type I activation in glioma
cells. (A) Interferon β concentration (pg/ml) was measured by ELISA at the cell culture supernatant of
CT-2A and GL261 glioma cells infected with MV strains at MOI=2 and MOI=5 at 24h and 48h after
infection. (B) MFI of IFNAR1 and (C) TLR-2 cell surface expression was measured 24h and 48h after
MV infection at MOI=2. Stimulation of J774A.1 with 500U/ml exogenous IFN- β was employed as
positive control for the assay. Results are representative of at least two independent experiments (n=3
sets of cells/group). Values represent Mean ±SD. Statistical significance is indicated (*, P<0.05; **,
P<0.01; ***, P<0.001; ****, P<0.0001 and ns, not significant) by two-way ANOVA followed by
Tukey’s multiple comparisons test for multiple comparisons.
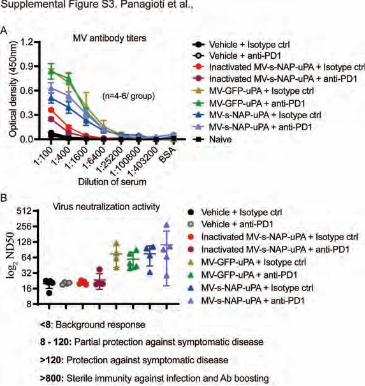
Supplemental Figure 3: Systemic uPAR retargeted anti-MV neutralization antibody titers
support repeated intracranial MV administration. (A) C57BL/6 mice bearing intracranial GL261
tumors were treated as described in Figure 5D. Sera samples were obtained at day 19 after primary MV
infection. ELISA plates were coated with 2 x 10⁴ TCID50 MV-s-NAP and detection of MV total IgG
specific antibodies in serially diluted sera samples was assessed. Sera samples collected from naïve
mice served as negative control. Optical density values were measured at 450 nm. Data represent mean
values and are representative of two independent experiments (n=4-6 mice per group). (B) Measles
neutralizing antibody titer was determined using fluorescence-based plaque-reduction
microneutralization assay. The number of syncytia per well was determined 48 hours post-inoculation

5
using a fluorescent microscopy (Nikon). Plaque reduction neutralization titer 50% (PNT50) was
calculated using the Karber’s formula. Each symbol represents an individual mouse. Data represent
Mean ±SD values and are representative of two independent experiments (n=4-6 mice per group).
Supplemental Figure 4: MV-s-NAP-uPA and anti-PD1 immunovirotherapy causes systemic PD1
upregulation on CD4+ and CD8+ T cells. C57BL/6 mice bearing GL261 received the treatment
described in Figure 5D and at day 24 after last intracranial virus administration whole blood was
collected from all survivor mice and surface staining for immune cell activation markers was performed.
Percentages of CD45+, CD3+, CD8+, CD4+ and PD-1 expressing CD4+ and CD8+ T cells are depicted.
Data represent Mean ±SD and are representative of two independent experiments (n=3-4 mice per
group). Statistical comparisons between the naïve + vehicle control group and the rest of the groups in
shown. *, P< 0.05; **, P< 0.01; ***, P< 0.001; ns, not significant by two-way ANOVA followed by
Tukey’s multiple comparisons test.
Supplemental Figure 5: Intratumoral MV-s-NAP-uPA and systemic anti-PD1 immuno-
virotherapy increases CD8+ T cell infiltration in GL261 tumors. Mice bearing GL261 orthotopic
tumors were treated according to Figure 5, D schema. At the time point that at least two mice from the
vehicle + isotype control group exhibited clinical symptoms of GBM disease progression, all groups of
mice were sacrificed for analysis of immune cell responses in the brain. Mice were perfused and brains
were processed for immunophenotyping. Absolute numbers of cellular immune subsets measured in the
brains are depicted. Graph values represent Mean ±SD (n=4-5 mice per group). Healthy naïve mice and
naïve mice injected with saline (vehicle) intracranially were included at the experiments to serve as
controls. The experiment was repeated twice with similar outcome. *, P<0.05; **, P<0.01 and ns, not
significant by two-way ANOVA followed by Tukey’s multiple comparisons test.
Supplemental Figure 6: MV-s-NAP-uPA and anti-PD1 combination therapy leads to T cell
activation in peripheral lymphoid tissues. C57BL/6 mice harboring orthotopic CT-2A tumors were
treated as described in Figure 5B. Animal individual spleens were collected when two mice from the
vehicle + isotype control group started exhibiting GBM disease progression symptoms. Percentages of
CD3+, CD4+, CD8+ and KLRG1+ CD4+ and CD8+ T cells measured in the spleen. Data represent Mean
±SD values, and are representative of two independent experiments (n=4-5 mice per group). Statistical
comparisons between the vehicle + isotype control group and the rest of the groups in shown. *, P<0.05;
**, P<0.01; ***, P<0.001; ****, 0.0001 and ns, not significant by one-way ANOVA followed by
Dunnett’s multiple comparisons test.
Supplemental Figure 7: Depletion efficiency of peripheral blood immune cell subsets. Graphs
depict percentages of immune cell subsets measured in the whole blood of mice after the second

6
intraperitoneal administration of depleting antibodies. Depleting antibody treatment led to >97%
removal of the targeted immune cells. Data represent Mean ±SD values, and are representative of two
independent experiments (n=2-10 mice per group).
Supplemental Figure 8: The long-term therapeutic response of MV-s-NAP-uPA and anti-PD1
combination therapy at the GL261 model depends on CD8+ T cells. (A) Mice with long term GL261
tumor specific immunity (day 300) were divided in two groups; half of the survivors received anti-CD8
and the other half anti-IgG2b depletion antibodies. Subsequently, mice were challenged intracranially
(at the right side of the brain) with homologous GL261 cells (3x10⁵ cells). Mice continued receiving
IgG2b or CD8 depletion antibody treatments every 3 days for 20 days. Naïve mice, of the same age that
received intracranially injected GL261 cells, served as positive controls. (B) Survival response rate was
monitored daily. Kaplan-Meier survival using log-rank Mantel-Cox tests (n=1-3 mice per group). Due
to small sample size, statistical significance was not reached.
Supplemental Figure 9: MV-s-NAP-uPA and anti-PD1 combination immunovirotherapy reverses
GBM mediated systemic immunosuppression. Mice bearing GL261 orthotopic tumors were treated
according to Figure 5D schema. Weights (mg) of spleen and thymus gland and total number of spleen
cells (x107) from individual mice after completion of the MV-s-NAP-uPA and/or anti-PD1 treatment.
Healthy naïve mice and naïve mice injected with saline (vehicle) intracranially were included at the
experiment to serve as controls. Statistical comparisons between the vehicle + isotype control group
and the rest of the groups in shown. The experiment was repeated twice with similar results. Data
represent Mean ±SD values. *, P<0.05; **, P<0.01 and ns, not significant by one-way ANOVA with
Dunnett's multiple comparisons test.
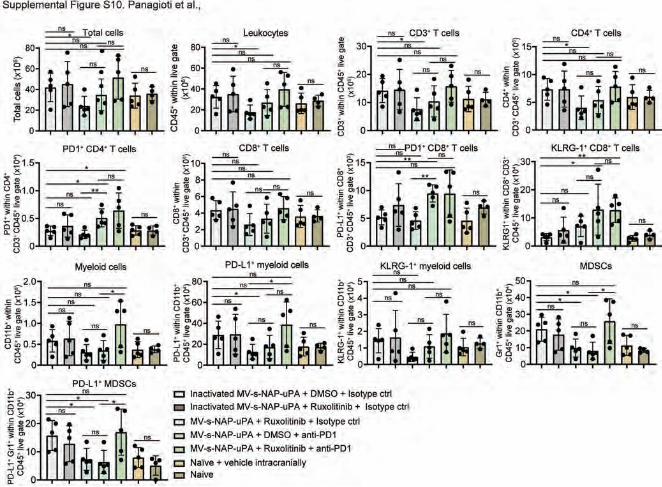
Supplemental Figure 10: MV-s-NAP + ruxolitinib + anti-PD1 triple combination treatments do
not alter immune cell responses in the spleen. C57BL/6 mice bearing CT-2A gliomas were treated
as described in Figure 8A. Absolute numbers of cellular immune responses measured in the spleen of
treated animals (n=4-5 mice per group). Values represent Mean ±SD. *, P<0.05; **, P<0.01 and ns, not
significant by two-way ANOVA followed by Tukey’s multiple comparisons test for multiple
comparisons.
Supplemental Figure 11. Flow cytometry gating strategy. Representative plots show the gating
strategy followed to determine immune cell subsets in mouse brain, spleen, and whole blood. In
sequential gating, cells were first gated on immune cells (forward scatter vs. side scatter), then singlets
(FSC-A vs FSC-H) followed by viability (FSC-A vs. Glost red viability marker). Subsequently, cells
were gated on leukocytes (CD45 vs. SSC-A) and analyzed for expression of B220+, CD11b+, F4/80+,
NK1.1+, CD3+, CD4+, CD8+, KLRG-1+, Ki67+, Granzyme B+, CD25+ and FOXP3+.