electronic supplementary information for - rsc.org · electronic supplementary information for...
TRANSCRIPT

1
Electronic Supplementary Information for
Storage
Yunxia Hu,a Shengchang Xiang,b Wenwei Zhang,a,* Zhuxiu Zhang,a
Lei Wang,a Junfeng Bai,a,* and Banglin Chenb,* a State Key Laboratory of Coordination Chemistry, School of Chemistry and Chemical Engineering, Nanjing University, Nanjing 210093, China. E-mail: [email protected], [email protected] b Department of Chemistry, University of Texas at San Antonio, San Antonio, TX 78249-0698, USA. E-mail: [email protected],
Supplementary Material (ESI) for Chemical CommunicationsThis journal is © The Royal Society of Chemistry 2009
2
General Method Elemental analyses (C, H, and N) were carried out on a Perkin-Elmer 240 analyzer. The IR
spectra were obtained on a VECTOR TM 22 spectrometer with KBr pellets in the 4000∼400 cm-1 region. 1H NMR spectra were recorded on a Bruker DRX-500 spectrometer at ambient temperature with tetramethylsilane as an internal reference. The MS spectra were measured on a Finnigan LCQ electron spray mass spectrometer. TGA-DTA diagrams were recorded by a CA Instruments DTA-TGA 2960 type simultaneous analyzer heating from 293 to 973 K in nitrogen atmosphere at a rate of 20 K/min. Powder X-ray diffraction (PXRD) data were recorded on a Shimadzu XRD-6000 diffractometer with Cu Kα (λ = 1.54056 Å) radiation at room temperature with a scan speed of 5º/min and a step size of 0.02 in 2θ. Synthesis of H4EBTC The organic linker molecule H4EBTC was prepared according the literatures.1 It was characterized by IR and MS.
Data for H4EBTC: IR (cm-1):3087∼2867(br, m), 2953(m), 2159(w∼m), 1707 (vs), 1595 (m), 1446
(s), 1279(vs), 908(m), 755 (m), 690 (m); MS: m/z 353.00 [M-1] - (calcd 353.04).
Derivation of the Isosteric Heats of Adsorption. A virial type expression of the following form was used to fit the combined isotherm data for a given material at 295 and 273 K.
(1)
Here, P is the pressure expressed in Torr, N is the amount adsorbed in mmol/g, T is the temperature in K, ai and bi are virial coefficients, and m, n represent the number of coefficients required to adequately describe the isotherms. The equation was fit using the statistical software package SPSS 16.0; m and n were gradually increased until the contribution of extra added a and b coefficients was deemed to be statistically insignificant towards the overall fit, as determined using the t-test, and the average value of the squared deviations from the experimental values was minimized. The values of the virial coefficients a0 through am were then used to calculate the isosteric heat of adsorption using the following expression.
(2)
Here, Qst is the coverage-dependent isosteric heat of adsorption and R is the universal gas
Supplementary Material (ESI) for Chemical CommunicationsThis journal is © The Royal Society of Chemistry 2009

3
constant. The parameters ai and bi in the Virial type expression after the data fitting a0 a1 a2 a3 a4 a5 a6 b0 b1 B2 B3
C2H
2
-4265.215±60.9
07
125.029±2.3
41
-4.509±0.2
05
0±
0
0±
0
0±
0
0±
0
16.788±0.2
14
0±
0
0±
0
0±
0
Coefficientsa
Unstandardized Coefficients
Standardized
Coefficients
Model B Std. Error Beta t Sig.
(Constant) 16.788 .214 78.597 .000
1/T*N 125.029 2.341 1.716 53.397 .000
1/T -4265.215 60.907 -.693 -70.028 .000
3
1/T*N^2 -4.509 .205 -.727 -21.972 .000
a. Dependent Variable: LnP-LnN
Model Summary
Model R R Square
Adjusted R
Square
Std. Error of the
Estimate
3 .998c .995 .995
.0596656041134
77
c. Predictors: (Constant), 1/T*N, 1/T, 1/T*N^2
Supplementary Material (ESI) for Chemical CommunicationsThis journal is © The Royal Society of Chemistry 2009

4
Table S1. Crystal data and structure refinement for [Cu2(EBTC)(H2O)2] (MOF 1) Identification code MOF 1 Empirical formula C18 H10 Cu2 O10 Formula weight 513.34 Temperature 293K Wavelength 0.71073 Å Crystal system Trigonal Space group R-3m Unit cell dimensions.
a = 18.6844(11) Å b = 18.6844(11) Å c = 32.862(4)
α = 90° β = 90˚ γ =120˚
Volume 9935.3(14) Å3 Z 9 Density (calculated) 0.772 Mg/m3 Absorption coefficient 0.987 mm-1 F(000) 2304 Crystal size 0.26 x 0.26 x 0.24 mm Theta range for data collection. 1.77 to 28.33° Index ranges -24<=h<=13, -15<=k<=24, -42<=l<=38 Reflections collected 20186 Independent reflections 2954 [R(int) = 0.143] Completeness to theta = 28.33° 98.0 % Absorption correction Multi-scan Max. and min. transmission 0.79 and 0.76 Refinement method Full-matrix least-squares on F2 Data / restraints / parameters 2954 / 0 / 76 Goodness-of-fit on F2 1.088 Final R indices [I>2sigma(I)] R1 = 0.0472, wR2 = 0.1077 R indices (all data) R1 = 0.1052, wR2 = 0.1101 Largest diff. peak and hole 0.543 and -0.300 e.Å-3
Supplementary Material (ESI) for Chemical CommunicationsThis journal is © The Royal Society of Chemistry 2009
5
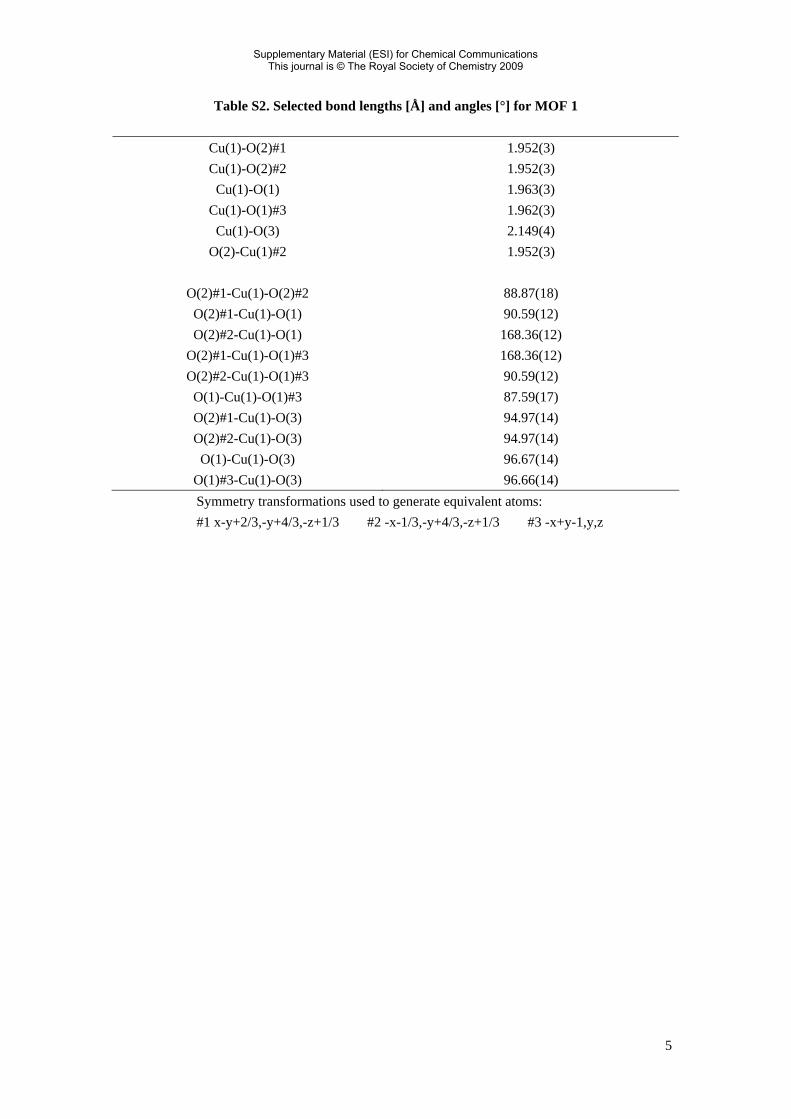
Table S2. Selected bond lengths [Å] and angles [°] for MOF 1
Cu(1)-O(2)#1 1.952(3) Cu(1)-O(2)#2 1.952(3)
Cu(1)-O(1) 1.963(3) Cu(1)-O(1)#3 1.962(3)
Cu(1)-O(3) 2.149(4) O(2)-Cu(1)#2 1.952(3)
O(2)#1-Cu(1)-O(2)#2 88.87(18)
O(2)#1-Cu(1)-O(1) 90.59(12) O(2)#2-Cu(1)-O(1) 168.36(12)
O(2)#1-Cu(1)-O(1)#3 168.36(12) O(2)#2-Cu(1)-O(1)#3 90.59(12) O(1)-Cu(1)-O(1)#3 87.59(17) O(2)#1-Cu(1)-O(3) 94.97(14) O(2)#2-Cu(1)-O(3) 94.97(14) O(1)-Cu(1)-O(3) 96.67(14)
O(1)#3-Cu(1)-O(3) 96.66(14) Symmetry transformations used to generate equivalent atoms: #1 x-y+2/3,-y+4/3,-z+1/3 #2 -x-1/3,-y+4/3,-z+1/3 #3 -x+y-1,y,z
Supplementary Material (ESI) for Chemical CommunicationsThis journal is © The Royal Society of Chemistry 2009
6
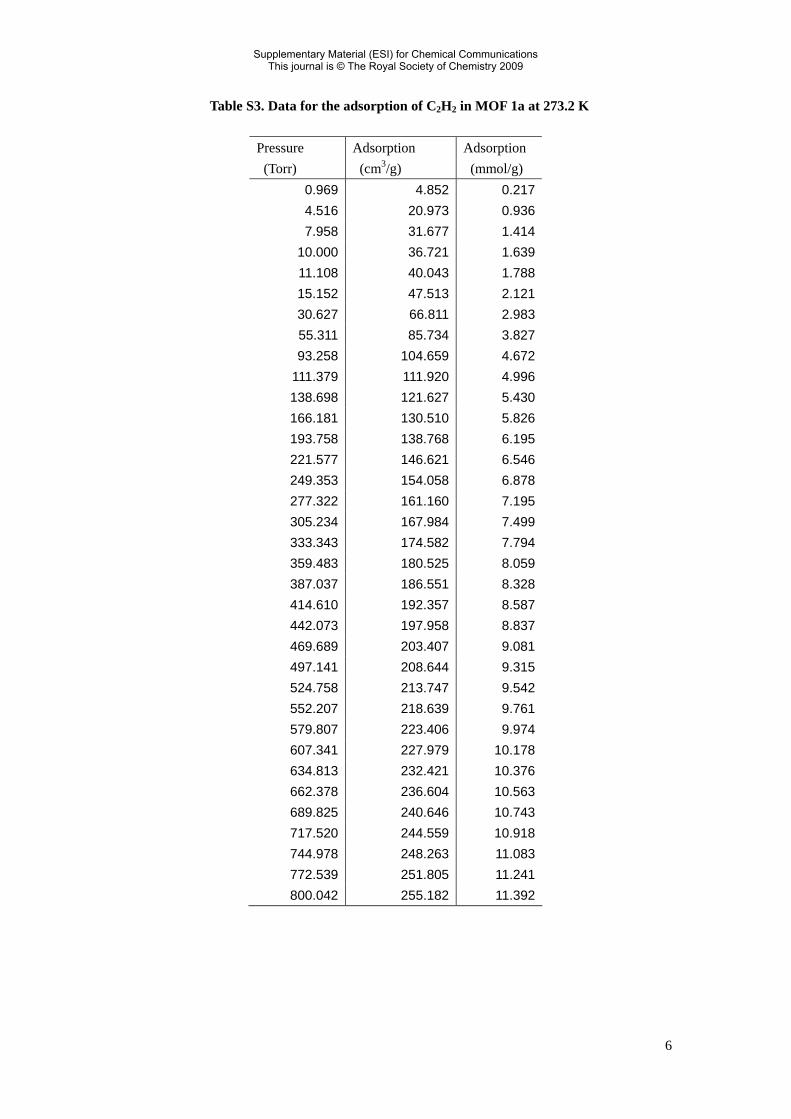
Table S3. Data for the adsorption of C2H2 in MOF 1a at 273.2 K
Pressure (Torr)
Adsorption (cm3/g)
Adsorption (mmol/g)
0.969 4.852 0.2174.516 20.973 0.9367.958 31.677 1.414
10.000 36.721 1.63911.108 40.043 1.78815.152 47.513 2.12130.627 66.811 2.98355.311 85.734 3.82793.258 104.659 4.672
111.379 111.920 4.996138.698 121.627 5.430166.181 130.510 5.826193.758 138.768 6.195221.577 146.621 6.546249.353 154.058 6.878277.322 161.160 7.195305.234 167.984 7.499333.343 174.582 7.794359.483 180.525 8.059387.037 186.551 8.328414.610 192.357 8.587442.073 197.958 8.837469.689 203.407 9.081497.141 208.644 9.315524.758 213.747 9.542552.207 218.639 9.761579.807 223.406 9.974607.341 227.979 10.178634.813 232.421 10.376662.378 236.604 10.563689.825 240.646 10.743717.520 244.559 10.918744.978 248.263 11.083772.539 251.805 11.241800.042 255.182 11.392
Supplementary Material (ESI) for Chemical CommunicationsThis journal is © The Royal Society of Chemistry 2009

7
Table S4. Data for the desorption of C2H2 in MOF 1a at 273.2 K
Pressure (Torr)
Adsorption (cm3/g)
Adsorption (mmol/g)
746.491 249.665 11.146704.671 244.662 10.922663.371 239.255 10.681633.745 235.142 10.497592.279 229.027 10.224550.775 222.482 9.932509.289 215.498 9.621467.613 208.071 9.289426.048 200.246 8.939384.474 191.969 8.570342.952 183.187 8.178301.516 173.862 7.762259.741 163.847 7.315218.366 153.128 6.836176.754 141.381 6.312135.317 128.273 5.72793.849 112.807 5.03653.187 92.353 4.12310.183 45.578 2.034
Supplementary Material (ESI) for Chemical CommunicationsThis journal is © The Royal Society of Chemistry 2009

8
Table S5. Data for the adsorption of C2H2 in MOF 1a at 295.0 K
Pressure (Torr)
Adsorption (cm3/g)
Adsorption (mmol/g)
1.031 1.872 0.0844.261 7.528 0.3368.354 13.785 0.615
9.3457 15.227 0.68011.673 18.238 0.81414.931 22.171 0.990
29.7075 36.016 1.60856.8041 53.029 2.36779.7431 63.462 2.833111.413 74.888 3.343139.020 83.076 3.709166.735 90.161 4.025194.575 96.416 4.304222.253 102.037 4.555250.041 107.149 4.783277.957 111.885 4.995305.925 116.285 5.191333.464 120.334 5.372359.400 123.897 5.531386.919 127.456 5.690414.620 130.821 5.840442.172 134.012 5.983469.674 137.004 6.116497.247 139.848 6.243524.668 142.537 6.363552.263 145.100 6.478579.749 147.519 6.586607.373 149.803 6.688634.898 151.941 6.783662.414 153.957 6.873689.948 155.849 6.958717.480 157.649 7.038745.092 159.329 7.113772.555 160.886 7.182800.110 162.329 7.247
Supplementary Material (ESI) for Chemical CommunicationsThis journal is © The Royal Society of Chemistry 2009

9
Table S6. Data for the desorption of C2H2 in MOF 1a at 295.0 K
Pressure (Torr)
Adsorption (cm3/g)
Adsorption (mmol/g)
745.112 160.057 7.145703.395 157.974 7.052661.962 155.591 6.946633.797 153.813 6.867592.438 150.921 6.738550.889 147.679 6.593509.112 144.07 6.432467.632 140.142 6.256426.222 135.806 6.063384.598 131.015 5.849342.899 125.729 5.613301.375 119.908 5.353260.056 113.418 5.063218.208 105.954 4.73176.882 97.3996 4.348135.31 87.0976 3.888
94.0579 74.182 3.31252.879 56.3441 2.515
8.18486 19.1635 0.856
Supplementary Material (ESI) for Chemical CommunicationsThis journal is © The Royal Society of Chemistry 2009

10
Figure S1. X-ray single crystal structure of [Cu2(EBTC)(H2O)2]·8H2O·DMF·DMSO exhibiting 1D pores along c axis.
0 10 20 30 40
2θ / degree
a
b
c
d
Figure S2. PXRD patterns of MOF 1: a) simulated pattern based on X-ray single-crystal structure, b) as-synthesized, c) methanol exchanged and d) activated.
Supplementary Material (ESI) for Chemical CommunicationsThis journal is © The Royal Society of Chemistry 2009
11
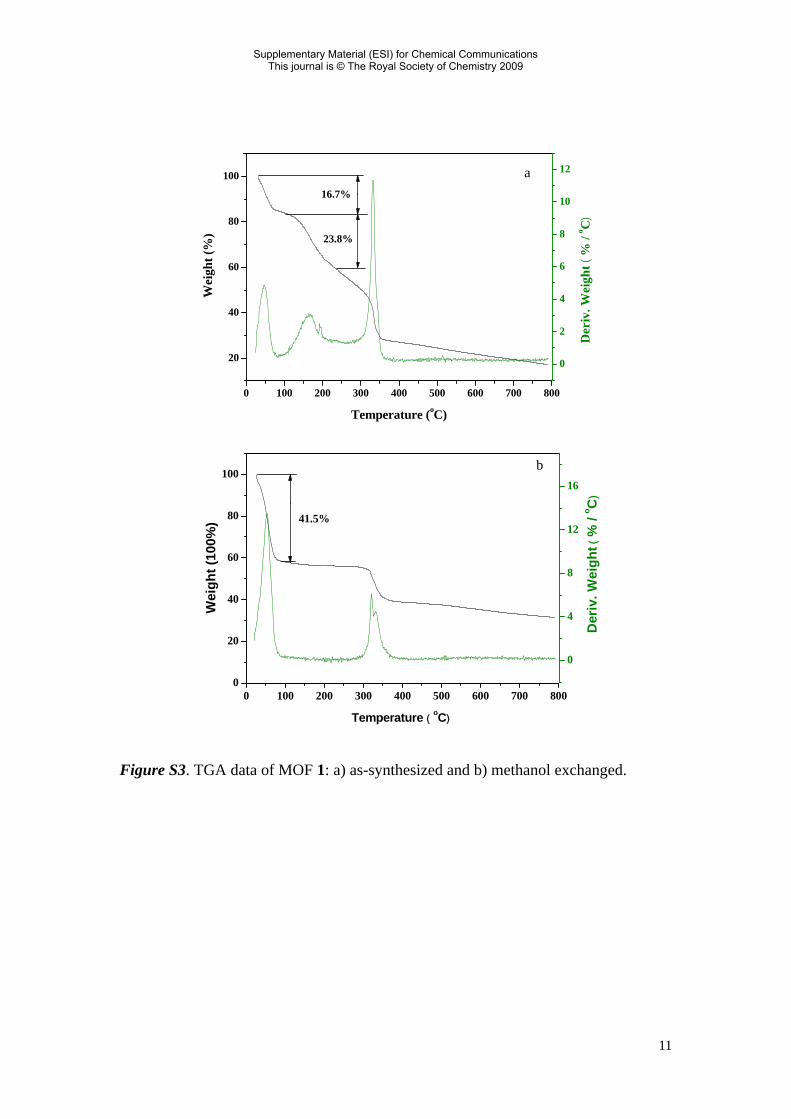
Figure S3. TGA data of MOF 1: a) as-synthesized and b) methanol exchanged.
0 100 200 300 400 500 600 700 800
20
40
60
80
100
0
2
4
6
8
10
12
Der
iv. W
eigh
t (%
/ o C)
Wei
ght (
%)
Temperature (oC)
16.7%
23.8%
a
0 100 200 300 400 500 600 700 8000
20
40
60
80
100
0
4
8
12
16
D
eriv
. Wei
ght (
% /
o C)
Wei
ght (
100%
)
Temperature ( oC)
41.5%
b
Supplementary Material (ESI) for Chemical CommunicationsThis journal is © The Royal Society of Chemistry 2009

12
0 5 10 15 200
1
2
3
4
5
H2
upta
ke (w
t%)
Pressure (bar)
Figure S4. High pressure hydrogen adsorption isotherm of MOF 1a at 77 K.
References:
1 (a) I. Aujard, J.-P. Baltaze, J.-B. Baudin, E. Cogné, F. Ferrage, L. Jullien, É. Perez, V. Prévost,
L. M. Qian and O. Ruel, J. Am. Chem. Soc., 2001,123, 8177. (b) G. J. Bodwell, D. O. Miller and R.J. Vermeij, Org. Lett., 2001, 3, 2093. (c) H. Zhou, H. Dang, J.-H. Yi, A. Nanci, A. Rochefort and J. D. Wuest, J. Am. Chem. Soc., 2007, 129, 13774.
Supplementary Material (ESI) for Chemical CommunicationsThis journal is © The Royal Society of Chemistry 2009