electronic arts inc. fiscal year 2018 proxy statement and ... · the financial performance,...
TRANSCRIPT

Electronic Arts Inc.Fiscal Year 2018
Proxy Statement and Annual Report

Pro
xyS
tatemen
tNotice of 2018 Annual Meetingand Proxy Statement

Pro
xyS
tatemen
t
Electronic Arts Inc. Notice of 2018 Annual Meeting of Stockholders
DATE: August 2, 2018
TIME: 2:00 p.m. (Pacific)
PLACE: ELECTRONIC ARTS’ HEADQUARTERSBuilding 250*209 Redwood Shores ParkwayRedwood City, CA 94065
* Please note: Building 250 is located on the headquarters’ campus at 250 Shoreline Drive
MATTERS TO BE VOTED UPON:
Agenda Item Board of Directors Recommendation
1. The election of nine members of the Board of Directors tohold office for a one-year term.
FOR ALL
2. Advisory vote on the compensation of our named executiveofficers.
FOR
3. Ratification of the appointment of KPMG LLP as ourindependent public registered accounting firm for the fiscalyear ending March 31, 2019.
FOR
4. Any other matters that may properly come before themeeting.
Any action on the items of business described above may be considered at the 2018 Annual Meetingof Stockholders (the “Annual Meeting”) at the time and on the date specified above or at any time anddate to which the Annual Meeting may be properly adjourned or postponed.
Stockholders of record as of the close of business on June 8, 2018 are entitled to notice of the AnnualMeeting and to attend and vote at the Annual Meeting. A live audio webcast of the Annual Meeting willalso be made available at http://investor.ea.com.
Your vote is important. You do not need to attend the Annual Meeting to vote if you have submittedyour proxy in advance of the meeting. Whether or not you plan to attend the Annual Meeting, weencourage you to read this Proxy Statement and submit your proxy or voting instructions as soon aspossible, so that your shares may be represented at the Annual Meeting. You may vote on the Internet,in person, by telephone, or, if you requested to receive printed proxy materials, by mailing a proxy cardor voting instruction card. For specific instructions on how to vote your shares, please refer to theinstructions on the Notice of Internet Availability of Proxy Materials (“Notice”) you received in the mail,the section titled “Commonly Asked Questions and Answers” beginning on page 55 of this ProxyStatement or, if you requested to receive printed proxy materials, your enclosed proxy card. Pleasenote that this Proxy Statement, as well as our Annual Report on Form 10-K (the “Annual Report”) forfiscal year ended March 31, 2018, is available at http://investor.ea.com.
By Order of the Board of Directors,
Jacob J. SchatzExecutive Vice President, General Counseland Corporate Secretary
TABLE OF CONTENTS
Page
2018 PROXY STATEMENT SUMMARY AND HIGHLIGHTS . . . . . . . . . . . . . . . . . . . . . . . . . . . . . . 1Fiscal 2018 Summary of EA’s Business . . . . . . . . . . . . . . . . . . . . . . . . . . . . . . . . . . . . . . . . . . . . . 1Executive Compensation Highlights . . . . . . . . . . . . . . . . . . . . . . . . . . . . . . . . . . . . . . . . . . . . . . . . . 2Board Nominees . . . . . . . . . . . . . . . . . . . . . . . . . . . . . . . . . . . . . . . . . . . . . . . . . . . . . . . . . . . . . . . . 3Board Diversity and Refreshment . . . . . . . . . . . . . . . . . . . . . . . . . . . . . . . . . . . . . . . . . . . . . . . . . . 4Corporate Governance Highlights and Report . . . . . . . . . . . . . . . . . . . . . . . . . . . . . . . . . . . . . . . . 5Corporate Social Responsibility . . . . . . . . . . . . . . . . . . . . . . . . . . . . . . . . . . . . . . . . . . . . . . . . . . . . 5
BOARD OF DIRECTORS AND CORPORATE GOVERNANCE . . . . . . . . . . . . . . . . . . . . . . . . . . . . 6Director Biographies . . . . . . . . . . . . . . . . . . . . . . . . . . . . . . . . . . . . . . . . . . . . . . . . . . . . . . . . . . . . . 6Director Independence . . . . . . . . . . . . . . . . . . . . . . . . . . . . . . . . . . . . . . . . . . . . . . . . . . . . . . . . . . . 9Board of Directors, Board Meetings and Committees . . . . . . . . . . . . . . . . . . . . . . . . . . . . . . . . . . 9Annual Board and Committee Self-Evaluations . . . . . . . . . . . . . . . . . . . . . . . . . . . . . . . . . . . . . . . 11Compensation Committee Interlocks and Insider Participation . . . . . . . . . . . . . . . . . . . . . . . . . . . 11Consideration of Director Nominees . . . . . . . . . . . . . . . . . . . . . . . . . . . . . . . . . . . . . . . . . . . . . . . . 11Global Code of Conduct and Corporate Governance Guidelines . . . . . . . . . . . . . . . . . . . . . . . . . 12Oversight of Risk Issues . . . . . . . . . . . . . . . . . . . . . . . . . . . . . . . . . . . . . . . . . . . . . . . . . . . . . . . . . . 12Related Person Transactions Policy . . . . . . . . . . . . . . . . . . . . . . . . . . . . . . . . . . . . . . . . . . . . . . . . 13Certain Relationships and Related Person Transactions . . . . . . . . . . . . . . . . . . . . . . . . . . . . . . . . 13Section 16(a) Beneficial Ownership Reporting Compliance . . . . . . . . . . . . . . . . . . . . . . . . . . . . . . 14Director Attendance at Annual Meeting . . . . . . . . . . . . . . . . . . . . . . . . . . . . . . . . . . . . . . . . . . . . . . 14Stockholder Communications with the Board of Directors . . . . . . . . . . . . . . . . . . . . . . . . . . . . . . . 14Other Business . . . . . . . . . . . . . . . . . . . . . . . . . . . . . . . . . . . . . . . . . . . . . . . . . . . . . . . . . . . . . . . . . 14Report of the Audit Committee of the Board of Directors . . . . . . . . . . . . . . . . . . . . . . . . . . . . . . . . 15
DIRECTOR COMPENSATION AND STOCK OWNERSHIP GUIDELINES . . . . . . . . . . . . . . . . . . . 17Fiscal 2018 Director Compensation Table . . . . . . . . . . . . . . . . . . . . . . . . . . . . . . . . . . . . . . . . . . . 18
COMPENSATION DISCUSSION AND ANALYSIS . . . . . . . . . . . . . . . . . . . . . . . . . . . . . . . . . . . . . . 20Compensation Committee Report on Executive Compensation . . . . . . . . . . . . . . . . . . . . . . . . . . 35
EXECUTIVE COMPENSATION . . . . . . . . . . . . . . . . . . . . . . . . . . . . . . . . . . . . . . . . . . . . . . . . . . . . . . 36Fiscal 2018 Summary Compensation Table . . . . . . . . . . . . . . . . . . . . . . . . . . . . . . . . . . . . . . . . . . 36Fiscal 2018 Grants of Plan-Based Awards Table . . . . . . . . . . . . . . . . . . . . . . . . . . . . . . . . . . . . . . 39Outstanding Equity Awards at Fiscal 2018 Year-End . . . . . . . . . . . . . . . . . . . . . . . . . . . . . . . . . . . 41Fiscal 2018 Option Exercises and Stock Vested Table . . . . . . . . . . . . . . . . . . . . . . . . . . . . . . . . . 44Potential Payments Upon Termination or Change in Control . . . . . . . . . . . . . . . . . . . . . . . . . . . . 44Fiscal 2018 Pay Ratio . . . . . . . . . . . . . . . . . . . . . . . . . . . . . . . . . . . . . . . . . . . . . . . . . . . . . . . . . . . . 47Equity Compensation Plan Information . . . . . . . . . . . . . . . . . . . . . . . . . . . . . . . . . . . . . . . . . . . . . . 48
SECURITY OWNERSHIP OF CERTAIN BENEFICIAL OWNERS AND MANAGEMENT . . . . . . . 49PROPOSALS TO BE VOTED ON . . . . . . . . . . . . . . . . . . . . . . . . . . . . . . . . . . . . . . . . . . . . . . . . . . . . 51
Proposal One: Election of Directors . . . . . . . . . . . . . . . . . . . . . . . . . . . . . . . . . . . . . . . . . . . . . . . . . 51Proposal Two: Advisory Vote on the Compensation of the Company’s Named Executive
Officers . . . . . . . . . . . . . . . . . . . . . . . . . . . . . . . . . . . . . . . . . . . . . . . . . . . . . . . . . . . . . . . . . . . . . . 52Proposal Three: Ratification of the Appointment of KPMG LLP, Independent Registered Public
Accounting Firm . . . . . . . . . . . . . . . . . . . . . . . . . . . . . . . . . . . . . . . . . . . . . . . . . . . . 53COMMONLY ASKED QUESTIONS AND ANSWERS . . . . . . . . . . . . . . . . . . . . . . . . . . . . . . . . . . . . 55APPENDIX A: ELECTRONIC ARTS INC. SUPPLEMENTAL INFORMATION FOR THE 2018
COMPENSATION DISCUSSION AND ANALYSIS . . . . . . . . . . . . . . . . . . . . . . . . . . . . . . . . . . . . A-1
i
Pro
xyS
tatemen
t
Pro
xyS
tatemen
t
In this Proxy Statement, we may make forward-looking statements regarding future events or thefuture financial performance of the Company. Statements including words such as “anticipate,”“believe,” “estimate” or “expect” and statements in the future tense are forward-looking statements.These forward-looking statements are subject to risks and uncertainties that could cause actual eventsor actual future results to differ materially from those set forth in the forward-looking statements.Please refer to the Annual Report for a discussion of important factors that could cause actual eventsor actual results to differ materially from those discussed in this Proxy Statement. These forward-looking statements speak only as of the date of this Proxy Statement; we assume no obligation to, anddo not necessarily intend to, update these forward-looking statements.
2018 PROXY STATEMENT SUMMARY ANDHIGHLIGHTSThis summary highlights information contained in this Proxy Statement, and it is qualified in its entiretyby the remainder of this Proxy Statement which was distributed and/or made available via the Internetto stockholders on or about June 15, 2018 along with the Electronic Arts Inc. Notice of 2018 AnnualMeeting of Stockholders, Annual Report and form of proxy. You are encouraged to read the entire
Proxy Statement carefully before voting. In this Proxy Statement, the terms “EA,” “we,” “our” and“the Company” refer to Electronic Arts Inc.
FISCAL 2018 SUMMARY OF EA’S BUSINESS
EA’s core strategies continued to deliver award-winning games and services to our players and deepplayer engagement. The breadth and depth of EA’s portfolio of games across key platforms, combinedwith our focus on live services to extend and enhance our games, generated strong financial results forthe Company. We exceeded our net revenue and operating income guidance for fiscal 2018, drovehigher gross margins, increased our cash provided by operations and invested in products andservices for the future.
Fiscal 2018 GAAP Financial and Operating Highlights
• We generated $5,150 million of net revenue and $3.34 diluted earnings per share.
• Our digital net revenue increased to $3,450 million and represented 67% of our total netrevenue.
• Operating profit margins were 27.8%.
• We delivered net income of $1,043 million and operating cash flow of $1,692 million.
• We generated net bookings for a fiscal year of $5,180 million.
• Titles in our top franchises, including FIFA 18, Battlefield 1, Star Wars Battlefront 2, The Sims 4,our live services including Ultimate Team in our sports franchises and mobile titles includingStar Wars: Galaxy of Heroes and Madden NFL Mobile delivered hundreds of millions of hours ofentertainment.
• We repurchased 5.3 million shares for $601 million.
The financial performance, operational achievements and other fiscal year events summarized aboveprovide context for the compensation decisions made by the Compensation Committee and Board ofDirectors in fiscal 2018 as we continue to structure our executive compensation program to align withpay-for-performance considerations. The Company’s executive compensation program is designed toreward our officers for the achievement of specific Company-wide financial objectives and the creationof long-term stockholder value.
1

EXECUTIVE COMPENSATION HIGHLIGHTS
Compensation Principles — Promoting Pay-for-Performance
The design of our compensation programs is guided by a compensation philosophy based on threecore principles intended to attract and retain high-performing executives and promote apay-for-performance approach to executive compensation:
• Principle 1 — Cash Compensation: A significant portion of each NEO’s cash compensationshould be at risk, based on the annual financial and operational performance of the Company, inaddition to the NEO’s individual performance;
• Principle 2 — Equity Compensation: A significant portion of each NEO’s total compensationshould be provided in the form of long-term equity to enhance alignment between the interestsof our NEOs and our stockholders and to promote long-term retention of a strong leadershipteam in an industry and geographic area that are highly competitive for executive talent; and
• Principle 3 — Target Total Direct Compensation: The target total direct compensationpackage for each NEO should be consistent with market practices for executive talent andshould reflect each NEO’s individual experience, responsibilities and performance.
Our executive compensation programs are designed to align the interests of our executives with theinterests of our stockholders.
What We Do What We Don’t Do
Í Incorporate both performance-basedrestricted stock units (“PRSUs”) and time-based restricted stock units (“RSUs”)
È Have a “single-trigger” change in controlplan
Í Require at least 50% of our executiveofficers’ total equity value to be granted inthe form of PRSUs
È Provide excise tax gross-up upon a changein control
Í Require our executives to satisfy stockownership guidelines
È Have executive employment contracts(other than as required by localjurisdictions)
Í Prohibit all employees from engaging inhedging transactions in EA stock andprohibit executive officers from pledging EAcommon stock
È Reprice options without stockholderapproval
Í Conduct annual “say on pay” advisory votes
Í Recover (clawback) equity compensationfor misconduct in the event of a financialrestatement
Í Align performance-based equity vestingwith stockholder interests
2

Pro
xyS
tatemen
t
BOARD NOMINEES
The following table provides summary information about our director nominees, each of whom is acurrent director of the Company.
Name Principal OccupationDirector
Since IndependentCommittee
Memberships
Mr. Leonard S. Coleman Former President of The NationalLeague of Professional Baseball
Clubs
2001 X NG, C
Mr. Jay C. Hoag Founding General Partner,Technology Crossover Ventures
2011 X C (chair)
Mr. Jeffrey T. Huber Vice Chairman, GRAIL, Inc. 2009 X A
Mr. Lawrence F. Probst III(Chairman)
Chairman, United States OlympicCommittee
1991 X
Ms. Talbott Roche President and Chief ExecutiveOfficer, Blackhawk Network
Holdings, Inc.
2016 X C
Mr. Richard A. Simonson Executive Vice President,Chief Financial Officer, Sabre
Corporation
2006 X A (chair)
Mr. Luis A. Ubiñas(Lead Director*)
Former President,Ford Foundation
2010 X NG (chair)
Ms. Heidi J. Ueberroth President, Globicon 2017 X
Mr. Andrew Wilson Chief Executive Officer,Electronic Arts Inc.
2013
* Elected by independent directors
NG: Nominating and Governance Committee
C: Compensation Committee
A: Audit Committee
On May 30, 2018, EA announced that Mr. Vivek Paul and Ms. Denise Warren would retire from theBoard of Directors, effective as of the date and time of the Annual Meeting. The Board of Directors hasdetermined to reduce the size of the Board of Directors from eleven members to nine members,effective as of the date and time of the Annual Meeting and thus is nominating nine directors forelection or re-election at the Annual Meeting. The Board of Directors will designate a board member tosucceed Ms. Warren on the Audit Committee.
3

BOARD DIVERSITY AND REFRESHMENT
The Board of Directors routinely assesses its composition and believes that stockholder value can bedriven by a board that balances the knowledge and understanding of the Company’s business thatresults from long-term service with the fresh perspective and ideas driven by the addition of newmembers. In addition, the Board of Directors believes that complementary and diverse perspectives,whether based on business experience, diversity of gender, ethnicity, culture or other factors,contribute to the Board of Directors’ effectiveness as a whole. The Board of Directors has regularlyadded new members — three of our nine director nominees have served for five years or less — andthe two most recent additions to the Board of Directors, Ms. Talbott Roche and Ms. Heidi Ueberroth,represent an increase in the Board of Directors’ gender diversity.
Director TenureMedian Tenure – 7 years
Average Tenure – 9.2 years
Director AgeMedian Age – 55 years old
Average Age – 56.3 years old
6-10 Years33.3%
5 Years or Less33.3%More than 10 Years
33.4%
55 to 65 years old33.3%
Less than 55 years old44.4%
65 to 75 years old22.3%
Director Diversity
Female / Minority: 4*
44% 56%
Non-Minority: 5
* Mr. Coleman, Ms. Roche, Mr. Ubiñas, Ms. Ueberroth
4

Pro
xyS
tatemen
t
CORPORATE GOVERNANCE HIGHLIGHTS AND REPORT
Board Independence
Independent Director Nominees 8 of 9
Independent Lead Director Luis A. Ubiñas
Independent Board Committees All
Conflict of Interest Policy YesDirector Elections
Frequency of Board elections Annual
Voting standard for uncontested elections Majority of votes cast
Stockholder proxy access YesBoard Operations
Number of incumbent directors that attended 100% of applicable Boardand standing committee meetings in fiscal 2018;
Number of incumbent directors that attended at least 80% of all applicablemeetings
8 of 11
11 of 11
Board Evaluations Annual
Committee Evaluations Annual
Director stock ownership requirement Yes, 5x retainer
Chairman/CEO role SplitStockholder Rights
Voting rights for all shares One-share, one-vote
Poison Pill No
Supermajority Voting Provisions None
CORPORATE SOCIAL RESPONSIBILITY
Diversity and Inclusion. We believe in creating games and experiences for our global playercommunity that are a reflection of a diverse world. As we aim to inspire the world to play, a diverse andinclusive workforce enables us to deliver the games and experiences that inspire and delight ourdiverse player community. We are investing in internal and external initiatives that empower ouremployees, celebrate diversity and foster inclusion within EA and our communities, including employeeresource groups and inclusion training courses.
Equal Pay for Equal Work. EA believes in equal pay for equal work, and we have made efforts acrossour global organization to promote equal pay practices. We are committed to continuing to assess payequity and aim for equal pay for equal work across our global organization.
Sustainability. We aim to integrate environmental responsibility and sustainability into our operationaland product strategies. We reduce our carbon footprint by the manner through which we bring our gamesand services to players and by making environmentally-conscious choices in our offices worldwide.
Our business is transforming as players increasingly engage with our games and services digitallyinstead of purchasing disc-based products through retailers. Delivering digital games to our playersdoes not require the manufacturing, packaging, and distribution of physical discs, which reduces ourcarbon footprint and the waste generated by our operations. We recognize that reliably deliveringdigital products and operating our increasingly digital business has increased our reliance on datacenters, and the associated energy consumption. As a result, we aim to manage a significant portion ofour data center usage through partners that have made a commitment to increasing the amount ofrenewable energy in their electricity supply.
5

BOARD OF DIRECTORS AND CORPORATEGOVERNANCEEach of the following directors has been nominated for election or re-election at the Annual Meeting.As set forth below, we believe each of these directors brings a valuable and unique perspective to theBoard of Directors and has the necessary experience, skills and attributes to serve on the Board ofDirectors and contribute to its overall effectiveness, and the Board of Directors has concluded thateach is qualified to serve as a director based on the experiences, qualifications and attributes set forthbelow.
Leonard S. ColemanDirector since 2001Mr. Coleman, age 69, served as Senior Advisor to Major League Baseball from 1999 until 2005 and,from 2001 to 2002, was the Chairman of ARENACO, a subsidiary of Yankees/Nets. Mr. Coleman wasPresident of The National League of Professional Baseball Clubs from 1994 to 1999. Mr. Coleman alsoserves on the board of directors of Avis Budget Group, Inc., Hess Corporation and Omnicom GroupInc. and has served as a director of Aramark and Churchill Downs Incorporated during the past fiveyears.
Mr. Coleman brings a wealth of corporate governance, public sector and international experience tothe Board of Directors from his years of service on the boards of directors for numerous large, publiccompanies and his involvement in diverse public-service organizations, as well as his extensiveknowledge of the sports industry.
Jay C. HoagDirector since 2011Mr. Hoag, age 60, co-founded Technology Crossover Ventures, a leading provider of growth capital totechnology companies, in 1995, and serves as its Founding General Partner. Mr. Hoag serves on theboard of directors of Netflix, Inc., TripAdvisor, Inc. and Zillow Group, Inc. and several privatecompanies. Mr. Hoag also serves on the Boards of Trustees of Northwestern University and VanderbiltUniversity, and on the Investment Advisory Board of the University of Michigan. Mr. Hoag has servedas a director of TechTarget, Inc. during the past five years. Mr. Hoag holds a B.A. from NorthwesternUniversity and an M.B.A. from the University of Michigan.
As a venture capital investor, Mr. Hoag brings strategic insight and financial experience to the Board ofDirectors. He has evaluated, invested in and served as a board member and compensation committeemember at numerous companies, both public and private, and is familiar with a full range of corporateand board functions. His many years of experience in helping companies shape and implementstrategy provide the Board of Directors with useful perspectives on matters such as risk management,compensation program structure and design, corporate governance, talent selection and management.
Jeffrey T. HuberDirector since 2009Mr. Huber, age 50, is the Vice Chairman of GRAIL, Inc., a life sciences company. Previously,Mr. Huber served as Senior Vice President of Alphabet Inc. (formerly Google Inc.), where he workedfrom 2003 to 2016. From 2001 to 2003, Mr. Huber served as Vice President of Architecture andSystems Development at eBay Inc. Prior to joining eBay, Mr. Huber was Senior Vice President ofEngineering at Excite@Home, where he worked from 1996 to 2001. Mr. Huber has served on theboard of directors of Illumina, Inc. during the past five years. Mr. Huber holds a B.S. degree inComputer Engineering from the University of Illinois and a Masters degree from Harvard University.Mr. Huber serves as a visiting scholar at Stanford University.
Mr. Huber has extensive operational and management experience at companies that apply rapidly-changing technology. Mr. Huber’s experience at Alphabet and eBay, in particular, provide backgroundand experience, including risk management experience with respect to consumer online companiesthat deploy large-scale technological infrastructure.
6
Pro
xyS
tatemen
t
Lawrence F. Probst III
Director since 1991, Chairman since 1994Mr. Probst, age 68, has been our Chairman of the Board of Directors since July 1994. He wasemployed by EA from 1984 to 2008, as well as from March 2013 until December 2014, serving as ourChief Executive Officer from 1991 until 2007 and as our interim Chief Executive Officer from March2013 until September 2013. Mr. Probst serves as the Chairman of the board of directors of the U.S.Olympic Committee and is a member of the International Olympic Committee. Mr. Probst has servedas a director of Blackhawk Network Holdings, Inc. during the past five years. Mr. Probst holds a B.S.degree from the University of Delaware.
Mr. Probst served as the Company’s Chief Executive Officer for more than 15 years and has served asthe Chairman of the Board of Directors for over 20 years. Mr. Probst contributes to the Board ofDirectors his deep understanding of the Company’s operational and strategic business goals and directexperience with Company and industry-specific opportunities and challenges.
Talbott Roche
Director since June 2016Ms. Roche, age 51, has served as Chief Executive Officer and a member of the board of directors ofBlackhawk Network Holdings, Inc., a leading prepaid payment network, since February 2016, and asPresident since November 2010. Ms. Roche has held several positions at Blackhawk NetworkHoldings since joining in 2001, including Senior Vice President, Marketing, Product and BusinessDevelopment and Assistant Vice President. Prior to joining Blackhawk Network Holdings, Ms. Rocheserved as a Branding Consultant and Director of New Business Development for Landor Associates, amarketing consulting firm, and held executive positions at News Corporation, a media and marketingservices company. Ms. Roche has previously served as a member of the board of directors of theNetwork Branded Prepaid Card Association, a trade association. Ms. Roche holds a B.A. in economicsfrom Stanford University.
Ms. Roche brings to the Board of Directors her operational and management experience within aglobal organization. In addition, Ms. Roche’s understanding and experience with digital commerce,marketing and consumer trends provide the Board of Directors with valuable perspective.
Richard A. Simonson
Director since 2006Mr. Simonson, age 59, has served as Executive Vice President and Chief Financial Officer of SabreCorporation since March 2013. Previously, Mr. Simonson served as President, Business Operationsand Chief Financial Officer of Rearden Commerce from April 2011 through May 2012. From 2001 to2010, Mr. Simonson held a number of executive positions at Nokia Corporation, including ExecutiveVice President, Head of Mobile Phones and Sourcing, Chief Financial Officer, and Vice President andHead of Customer Finance. Mr. Simonson also serves on the Board of Trustees of the SMU LyleSchool of Engineering. Mr. Simonson served as a director of Silver Spring Networks, Inc. during thepast five years. Mr. Simonson holds a B.S. degree from the Colorado School of Mines and an M.B.A.from Wharton School of Business at the University of Pennsylvania.
Mr. Simonson brings to the Board of Directors extensive financial expertise, corporate governance andrisk management experience as a public company Chief Financial Officer. He also has extensiveexperience with the strategic and operational challenges of leading a global company.
7

Luis A. Ubiñas
Director since 2010, Lead Director since 2015Mr. Ubiñas, age 55, served as President of the Ford Foundation from 2008 to 2013. Prior to joining theFord Foundation, Mr. Ubiñas spent 18 years with McKinsey & Company, where he held variouspositions, including Managing Director of the firm’s west coast media practice working with technology,telecommunications and media companies. Mr. Ubiñas also serves on the board of directors of BostonPrivate Financial Holdings, Inc. and on the boards of several non-profit organizations. Mr. Ubiñas hasserved as a director of CommerceHub, Inc. and Valassis Communications, Inc. during the past fiveyears. He holds a B.A. degree from Harvard College and an M.B.A. from Harvard Business School, isa fellow of the American Academy of Arts and Sciences and a member of the Council on ForeignRelations.
Mr. Ubiñas has extensive experience in business management and operations from his years ofoverseeing more than $12 billion in assets and over $500 million in annual giving at the FordFoundation. In addition, through his prior experience as a Managing Director at McKinsey & Company,he has worked with technology, telecommunications and media companies in understanding thechallenges and opportunities presented by digital distribution platforms and applications. Mr. Ubiñashas worked extensively with companies managing the transition from physical to digital distribution andbusiness models.
Heidi J. Ueberroth
Director since 2017Ms. Ueberroth, age 52, is the President of Globicon, a private investment and advisory firm focused onthe media, sports, entertainment and hospitality industries. Prior to Globicon, Ms. Ueberroth served inseveral positions at the National Basketball Association between 1994 and 2013, including asPresident of NBA International from 2009 to 2013 and as President of Global Marketing Partnershipsand International Business Operations from 2006 to 2009. Ms. Ueberroth also serves on the board ofdirectors of the privately-held Four Seasons Hotels and Resorts, the privately-held Pebble BeachCompany and on the boards of several non-profit organizations. Ms. Ueberroth has served as adirector of Santander Consumer USA Holdings Inc. during the past five years. Ms. Ueberroth holds aB.A. degree from Vanderbilt University and serves on its Arts and Science Board of Visitors.
Ms. Ueberroth brings to the Board of Directors extensive global experience in the sports, media andentertainment industries, including with respect to developing and marketing products and services inAsian markets. In addition, Ms. Ueberroth’s past and present board service bring the experience ofoverseeing strategic and operational challenges of a global company.
Andrew Wilson
Director since 2013Mr. Wilson, age 43, has served as EA’s Chief Executive Officer and as a director of EA sinceSeptember 2013. Prior to his appointment as our Chief Executive Officer, Mr. Wilson held severalpositions within the Company since joining EA in May 2000, including Executive Vice President, EASPORTS from August 2011 to September 2013 and Senior Vice President, EA SPORTS from March2010 to August 2011. Mr. Wilson also serves as a director of Intel Corporation and is chairman of theboard of the privately-held World Surf League.
Mr. Wilson has served as the Company’s Chief Executive Officer since September 2013 and has beenemployed by EA in several roles since 2000. In addition to Mr. Wilson’s extensive experience andknowledge of the Company and the industry, we believe it is crucial to have the perspective of theCompany’s Chief Executive Officer represented on the Board of Directors to provide direct insight intothe Company’s day-to-day operation and strategic vision.
8

Pro
xyS
tatemen
t
DIRECTOR INDEPENDENCE
Our Board of Directors has determined that each of our non-employee directors qualifies as an“independent director” as that term is used in the NASDAQ Stock Market Rules; each member of ourstanding committees is independent in accordance with those standards. Mr. Wilson, our CEO, doesnot qualify as independent. The NASDAQ Stock Market Rules have both objective tests and asubjective test for determining independence. The Board of Directors has not established categoricalstandards or guidelines to make these subjective determinations, but considers all relevant facts andcircumstances. In May 2018, the Board of Directors, acting upon the recommendation of theNominating and Governance Committee, determined that Mr. Probst, our Chairman of the Board,qualified as an independent director. Mr. Probst has not been an employee of the Company for overthree years and meets all objective tests for independence. In addition, the Board of Directorsdetermined that Mr. Probst meets the subjective tests of independence.
In addition to the board-level standards for director independence, the directors who serve on theNominating and Governance, Audit and Compensation Committees each satisfy standards establishedby the SEC and the NASDAQ Stock Market to qualify as “independent” for the purposes ofmembership on those committees.
BOARD OF DIRECTORS, BOARD MEETINGS AND COMMITTEES
In fiscal 2018, the Board of Directors met five times and also acted by written consent. At regularlyscheduled meetings, the independent members of the Board of Directors meet in executive sessionseparately without management present.
Board of Directors Leadership Structure
Mr. Wilson serves as our CEO, and Mr. Probst serves as our Chairman. In addition, Mr. Ubiñas, ourLead Director, was elected by the independent directors and is responsible for chairing executivesessions of the Board of Directors and other meetings of the Board of Directors in the absence of theChairman, serving as a liaison between the Chairman and the other independent directors, andoverseeing the Board of Directors’ stockholder communication policies and procedures (including,under appropriate circumstances, meeting with stockholders). Mr. Ubiñas also may call meetings of theindependent directors. Mr. Ubiñas has served as our Lead Director since 2015. Mr. Ubiñas was chosenby the independent directors to serve as Lead Director following the 2017 annual meeting for anadditional two-year term, ending with our 2019 annual meeting, subject to Mr. Ubiñas’ re-election to theBoard of Directors.
The Board of Directors believes that this leadership structure with Mr. Wilson serving as CEO,Mr. Probst serving as the Chairman and Mr. Ubiñas serving as Lead Director is the appropriateleadership structure for the Company. Mr. Probst, though an independent director, was an employee ofthe Company for 25 years, more than 15 of which were in service as CEO and Executive Chairman. Asa result of his many years of service to the Company, Mr. Probst has invaluable knowledge regardingthe Company and the interactive entertainment industry and is uniquely positioned to lead the Board ofDirectors in its review of management’s strategic plans. Given Mr. Probst’s past service with theCompany, the Board of Directors believes that a strong and empowered Lead Director provides anessential mechanism for independent viewpoints, and as the Chairman of the Nominating andGovernance Committee, Mr. Ubiñas is well suited for this role because, among other things, he is notaffiliated with the Company under any applicable rules or guidelines.
Board Committees
The Board of Directors currently has a standing Audit Committee, Compensation Committee andNominating and Governance Committee. Each of these standing committees operates under a writtencharter adopted by the Board of Directors. These charters are available in the Investor Relationssection of our website at http://investor.ea.com.
9
All members of these committees are independent directors. During fiscal 2018, all eleven incumbentdirectors attended or participated in 80% or more of the aggregate of (1) the number of applicablemeetings of the Board or Directors and (2) the number of applicable meetings held by each committeeon which such director was a member. The members of our standing committees are set forth below:
Audit Committee: Richard A. Simonson (Chair), Jeffrey T. Huber andDenise F. Warren
Nominating and Governance Committee: Luis A. Ubiñas (Chair), Leonard S. Coleman and Vivek PaulCompensation Committee: Jay C. Hoag (Chair), Leonard S. Coleman and
Talbott Roche
Audit Committee
The Audit Committee assists the Board of Directors in its oversight of the Company’s financialreporting and is directly responsible for the appointment, compensation and oversight of ourindependent auditors. The Audit Committee also is responsible for establishing and maintainingcomplaint procedures with respect to internal and external concerns regarding accounting or auditingmatters, oversight of tax and treasury policies and practices and oversight of the Company’s internalaudit function. The Audit Committee has the authority to obtain advice and assistance from outsideadvisors without seeking approval from the Board of Directors, and the Company will provideappropriate funding for payment of compensation to advisors engaged by the Audit Committee. TheAudit Committee currently is comprised of three directors, each of whom in the opinion of the Board ofDirectors meets the independence requirements and the financial literacy standards of the NASDAQStock Market Rules, as well as the independence requirements of the SEC. The Board of Directors hasdetermined that Mr. Simonson meets the criteria for an “audit committee financial expert” as set forth inapplicable SEC rules. The Audit Committee met ten times and also acted by written consent in fiscal2018. For further information about the Audit Committee, please see the “Report of the AuditCommittee of the Board of Directors” below.
Nominating and Governance Committee
The Nominating and Governance Committee is responsible for recommending to the Board of Directorsnominees for director and committee memberships. The Nominating and Governance Committee also isresponsible for reviewing developments in corporate governance, recommending formal governancestandards to the Board of Directors, establishing the Board of Directors’ criteria for selecting nominees fordirector and for reviewing from time to time the appropriate skills, characteristics and experience requiredof the Board of Directors as a whole, as well as its individual members, including such factors asbusiness experience and diversity. In addition, the Nominating and Governance Committee isresponsible for reviewing the performance of the CEO. The Nominating and Governance Committeemanages the process for emergency planning in the event the CEO is unable to fulfill the responsibilitiesof the role and also periodically evaluates internal and external CEO candidates for succession planningpurposes. The Nominating and Governance Committee also reviews with management diversity,corporate responsibility and sustainability issues affecting the Company. The Nominating andGovernance Committee currently is comprised of three directors, each of whom in the opinion of theBoard of Directors meets the independence requirements of the NASDAQ Stock Market Rules. TheNominating and Governance Committee met four times in fiscal 2018.
Compensation Committee
The Compensation Committee is responsible for setting the overall compensation strategy for theCompany, recommending the compensation of the CEO to the Board of Directors, determining thecompensation of our other executive officers and overseeing the Company’s bonus and equityincentive plans and other benefit plans. For further information about the role of our executive officersin recommending the amount or form of executive compensation, please see “The Process forDetermining our NEOs’ Compensation” in the “Compensation Discussion and Analysis” section of thisProxy Statement. In addition, the Compensation Committee is responsible for reviewing and
10
Pro
xyS
tatemen
t
recommending to the Board of Directors compensation for non-employee directors and compensationfor employees that would qualify as a “Related Person Transaction” under our Related PersonTransaction Policy. The Compensation Committee currently is comprised of three directors, each ofwhom in the opinion of the Board of Directors meets the independence requirements of the NASDAQStock Market Rules and the SEC rules. Each director also qualifies as an “outside director” within themeaning of Section 162(m) of the Internal Revenue Code of 1986, as amended (the “Code”). TheCompensation Committee may delegate any of its authority and duties to subcommittees, individualcommittee members or management, as it deems appropriate in accordance with applicable laws,rules and regulations. During fiscal 2018, the Compensation Committee met five times and also actedby written consent.
The Compensation Committee has the authority to engage the services of outside advisors, after firstconducting an independence assessment in accordance with applicable laws, regulations andexchange listing standards. During fiscal 2018, the Compensation Committee engaged and directlyretained Compensia, Inc. (“Compensia”), a national compensation consulting firm, to assist with theCompensation Committee’s analysis and review of the compensation of our executive officers andother aspects of our total compensation strategy. Compensia performed no other services for theCompany and its management team during fiscal 2018. The Compensation Committee has reviewedthe independence of Compensia and determined that Compensia’s engagement did not raise anyconflicts of interest.
ANNUAL BOARD AND COMMITTEE SELF-EVALUATIONS
Our Board of Directors and each of our committees conducts an annual evaluation, which includes aqualitative assessment by each director of the performance of the Board of Directors, as a whole, andthe committee or committees on which each director sits. The evaluation is intended to determinewhether the Board of Directors and each committee are functioning effectively, and to provide themwith an opportunity to reflect upon and improve processes and effectiveness. The evaluations are ledby Mr. Ubiñas, our Lead Director and Chairman of the Nominating and Governance Committee. Asummary of the results is presented to the Nominating and Governance Committee and the Board ofDirectors on an aggregated basis, noting any themes or common issues.
COMPENSATION COMMITTEE INTERLOCKS AND INSIDER PARTICIPATION
During fiscal 2018, no member of the Compensation Committee was an employee or current or formerofficer of EA, nor did any member of the Compensation Committee have a relationship requiringdisclosure by EA under Item 404 of SEC Regulation S-K. No EA officer serves or has served since thebeginning of fiscal 2018 as a member of the board of directors or the compensation committee of acompany at which a member of EA’s Board of Directors and Compensation Committee is an employeeor officer.
CONSIDERATION OF DIRECTOR NOMINEES
In evaluating nominees for director to recommend to the Board of Directors, the Nominating andGovernance Committee will take into account many factors within the context of the characteristics andthe needs of the Board of Directors as a whole. While the specific needs of the Board of Directors maychange from time to time, all nominees for director are considered on the basis of the followingminimum qualifications:
• The highest level of personal and professional ethics and integrity, including a commitment toEA’s purpose and beliefs;
• Practical wisdom and mature judgment;
• Broad training and significant leadership experience in business, entertainment, technology,finance, digital commerce, corporate governance, public interest or other disciplines relevant toEA’s long-term success;
11

• The ability to gain an in-depth understanding of EA’s business; and
• A willingness to represent the best interests of all EA stockholders and objectively appraisemanagement’s performance.
While there is no formal policy with regard to diversity, when considering candidates as potentialmembers of the Board of Directors, the Nominating and Governance Committee considers the skills,background and experience of each candidate to evaluate his or her ability to contribute diverseperspectives to the Board of Directors. The goal of the Nominating and Governance Committee is toselect candidates that have complementary and diverse perspectives, whether based on businessexperience, diversity of gender, ethnicity, culture, or other factors, which together contribute to theBoard of Directors’ effectiveness as a whole. The primary consideration is to identify candidates whowill best fulfill the Board of Directors’ and the Company’s needs at the time of the search. Therefore,the Nominating and Governance Committee does not believe it is appropriate to either nominate orexclude from nomination an individual based on gender, ethnicity, race, age, or similar factors.
The Nominating and Governance Committee will evaluate candidates proposed by our stockholdersunder similar criteria, except that it also may consider as one of the factors in its evaluation the amountof EA voting stock held by the stockholder and the length of time the stockholder has held such stock.
GLOBAL CODE OF CONDUCT AND CORPORATE GOVERNANCE GUIDELINES
We have adopted a Global Code of Conduct that applies to our directors, and all other employees,including our principal executive officer, principal financial officer, principal accounting officer, and othersenior financial officers, as well as Corporate Governance Guidelines. These documents, along with ourorganizational documents and committee charters, form the framework of our corporate governance. OurGlobal Code of Conduct, Corporate Governance Guidelines and committee charters are available in theInvestor Relations section of our website at http://investor.ea.com. We post amendments to or waiversfrom our Global Code of Conduct in the Investor Relations section of our website.
OVERSIGHT OF RISK ISSUES
Our Board of Directors as a whole has responsibility for overseeing our risk management. The Boardof Directors exercises this oversight responsibility directly and through its committees. The oversightresponsibility of the Board of Directors and its committees is informed by reports from our managementteam that are designed to provide visibility into our key risks and our risk mitigation strategies.Business and strategic risks, including risks related to cybersecurity, as well as the steps taken bymanagement to monitor and control these risks are reviewed by the full Board of Directors. Risksrelated to investments, financial reporting, internal controls and procedures, tax and treasury mattersand compliance issues are reviewed regularly by the Audit Committee, which oversees the financialreporting, global audit and legal compliance functions. The Audit Committee also oversees ourenterprise risk management program, which identifies and prioritizes material risks for the Companyand the mitigation steps needed to address them. The Nominating and Governance Committeereviews risks related to director and CEO succession and monitors the effectiveness of our corporategovernance policies. Compensation-related risks are reviewed by the Compensation Committee withmembers of management responsible for structuring the Company’s compensation programs. Each ofthe committees regularly report to the full Board of Directors on matters relating to the specific areas ofrisk that each committee oversees.
As part of their risk oversight efforts, the Compensation Committee evaluated our compensationprograms to determine whether the design and operation of our policies and practices could encourageexecutives or employees to take excessive or inappropriate risks that would be reasonably likely tohave a material adverse effect on the Company and have concluded that they do not.
In making that determination, the Compensation Committee considered the design, size and scope ofour cash and equity incentive programs and program features that mitigate against potential risks, suchas payout caps, cash and equity award clawbacks, the quality and mix of performance-based and “at
12
Pro
xyS
tatemen
t
risk” compensation, and, with regard to our equity incentive programs, the stock ownershiprequirements applicable to our executives. The Compensation Committee reviewed the results of theirevaluation with management and Compensia. The Compensation Committee concluded that ourcompensation policies and practices strike an appropriate balance of risk and reward in relation to ouroverall business strategy, and do not create risks that are reasonably likely to have a material adverseeffect on the Company.
The “Compensation Discussion and Analysis” section below generally describes the compensationpolicies and practices applicable to our named executive officers.
RELATED PERSON TRANSACTIONS POLICY
Our Board of Directors has adopted a written Related Person Transactions Policy that describes theprocedures used to process, evaluate, and, if necessary, disclose transactions between the Companyand its directors, officers, director nominees, greater than 5% stockholders, or an immediate familymember of any of the foregoing. We review any transaction or series of transactions which exceeds$120,000 in a single fiscal year and in which any related person has a direct or indirect interest, as wellas any transaction for which EA’s Global Code of Conduct or Conflict of Interest Policy would requireapproval of the Board of Directors.
Once a transaction has been identified, the Audit Committee (if the transaction involves an executiveofficer) or the Nominating and Governance Committee (if the transaction involves a director) will reviewthe transaction at the next scheduled meeting of such committee. Transactions involving our CEO alsowill be reviewed by our independent Chairman or independent Lead Director if the Chairman is notindependent. If it is not practicable or desirable to wait until the next scheduled meeting, thechairperson of the applicable committee considers the matter and reports back to the relevantcommittee at the next scheduled meeting. In determining whether to approve or ratify a transaction, theAudit Committee or Nominating and Governance Committee (or the relevant chairperson of suchcommittee) considers all of the relevant facts and circumstances available and transactions are onlyapproved if they are in, or not inconsistent with, the best interests of EA and its stockholders. Nomember of the Audit Committee or Nominating and Governance Committee may participate in anyreview, consideration or approval of any transaction if the member or their immediate family member isthe related person.
CERTAIN RELATIONSHIPS AND RELATED PERSON TRANSACTIONS
Scott Probst
Scott Probst, the son of our Chairman, was employed by the Company for a portion of fiscal 2018 inour game development studios prior to leaving the Company in October 2017 to pursue anotheropportunity. The aggregate value of his total compensation in fiscal 2018 was consistent withcompensation provided to other EA employees in similar positions and less than $400,000. TheCompensation Committee reviewed Mr. Probst’s fiscal 2018 compensation in accordance with ourRelated Person Transactions Policy. Our Board of Directors considered Mr. Probst’s employment inreaching its determination that Mr. Lawrence F. Probst III, our Chairman, is an independent director.
Blackhawk Network Holdings
We enter into commercial dealings with Blackhawk Network Holdings, Inc., whereby BlackhawkNetwork Holdings offers EA-branded gift cards. During fiscal 2018, the aggregate amount involved intransactions with Blackhawk Network Holdings totaled approximately $2.5 million. Ms. Roche, one ofour directors, is the Chief Executive Officer of Blackhawk Network Holdings. Ms. Roche has noinvolvement in Blackhawk Network Holdings’ commercial dealings with EA and has no material director indirect interest in these transactions. Therefore, we do not consider these transactions to be“related person transactions” within the meaning of applicable SEC rules. Our Board of Directorsconsidered our dealings with Blackhawk Network Holdings in reaching its determination thatMs. Roche is an independent director.
13
SECTION 16(a) BENEFICIAL OWNERSHIP REPORTING COMPLIANCE
We have adopted procedures to assist EA’s directors and officers in complying with the requirementsof Section 16(a) of the Exchange Act, which include assisting officers and directors in preparing formsfor filing. To EA’s knowledge, based solely upon review of such reports furnished to us and writtenrepresentations that no other reports were required, we believe that all Section 16(a) filingrequirements applicable to our officers and directors were timely met during fiscal 2018.
DIRECTOR ATTENDANCE AT ANNUAL MEETING
Our directors are expected to make every effort to attend the Annual Meeting. All directors who wereelected at the 2017 annual meeting of stockholders attended the meeting.
STOCKHOLDER COMMUNICATIONS WITH THE BOARD OF DIRECTORS
EA stockholders may communicate with the Board of Directors as a whole, with a committee of theBoard of Directors, or with an individual director by sending a letter to EA’s Corporate Secretary atElectronic Arts Inc., 209 Redwood Shores Parkway, Redwood City, CA 94065, or by sending an emailto [email protected]. Our Corporate Secretary will forward to the Board ofDirectors all communications that are not of a commercial or frivolous nature or otherwise inappropriatefor their consideration. For further information regarding the submission of stockholdercommunications, please visit the Investor Relations section of our website at http://investor.ea.com.
OTHER BUSINESS
The Board of Directors does not know of any other matter that will be presented for consideration atthe Annual Meeting except as specified in the notice of the Annual Meeting. If any other matter doesproperly come before the Annual Meeting, or at any adjournment or postponement of the AnnualMeeting, it is intended that the proxies will be voted in respect thereof in accordance with the judgmentof the persons voting the proxies.
14

Pro
xyS
tatemen
t
REPORT OF THE AUDIT COMMITTEE OF THE BOARD OF DIRECTORS
The following Report of the Audit Committee shall not be deemed to be “soliciting material” or to be“filed” with the SEC nor shall this information be incorporated by reference into any future filing underthe Securities Act of 1933, as amended (the “Securities Act”), or the Exchange Act, except to theextent that EA specifically incorporates it by reference into a filing.
The Audit Committee of the Board of Directors operates under a written charter, which was most recentlyamended in May 2018. The Audit Committee is currently comprised of three non-employee directors,each of whom in the opinion of the Board of Directors meets the current independence requirements andfinancial literacy standards of the NASDAQ Stock Market Rules, as well as the independencerequirements of the SEC. In fiscal 2018, the Audit Committee consisted of Richard A. Simonson, JeffreyT. Huber and Denise F. Warren. The Board of Directors has determined that Mr. Simonson meets thecriteria for an “audit committee financial expert” as set forth in applicable SEC rules.
The Company’s management is primarily responsible for the preparation, presentation and integrity ofthe Company’s financial statements. EA’s independent registered public accounting firm, KPMG LLP(the “independent auditors”), is responsible for performing an independent audit of the Company’s(1) financial statements and expressing an opinion as to the conformity of the financial statements withU.S. generally accepted accounting principles, and (2) internal control over financial reporting inaccordance with the auditing standards of the Public Company Accounting Oversight Board (the“PCAOB”) and issuing an opinion thereon.
The Audit Committee assists the Board of Directors in its oversight responsibility with respect to theintegrity of EA’s accounting policies, internal control function and financial reporting processes. TheAudit Committee reviews EA’s quarterly and annual financial statements prior to public earningsreleases and submission to the SEC; oversees EA’s internal audit function; consults with theindependent auditors and EA’s internal audit function regarding internal controls and the integrity of theCompany’s financial statements; oversees tax and treasury matters, oversees EA’s enterprise riskmanagement program; assesses the independence of the independent auditors; and is directlyresponsible for the appointment, retention, compensation and oversight of the independent auditors. Inthis context, the Audit Committee has met and held discussions with members of management, EA’sinternal audit function and the independent auditors. Company management has represented to theAudit Committee that the Company’s consolidated financial statements for the most recently completedfiscal year were prepared in accordance with accounting principles generally accepted in the UnitedStates, and the Audit Committee has reviewed and discussed the consolidated financial statementswith Company management and the independent auditors. Company management also hasrepresented to the Audit Committee that the Company’s internal control over financial reporting waseffective as of the end of the Company’s most recently completed fiscal year, and the Audit Committeehas reviewed and discussed the Company’s internal control over financial reporting with managementand the independent auditors. The Audit Committee also discussed with the independent auditorsmatters required to be discussed by PCAOB Auditing Standard No. 16, Communications with AuditCommittees, including the quality and acceptability of the Company’s financial reporting and internalcontrol processes. The Audit Committee also has discussed with the Company’s independent auditorsthe scope and plans for their annual audit and reviewed the results of that audit with management andthe independent auditors.
In addition, the Audit Committee received and reviewed the written disclosures and the letter from theindependent auditors required by the applicable requirements of the PCAOB regarding theircommunications with the Audit Committee concerning independence, and has discussed with theindependent auditors the auditors’ independence from the Company and its management. The AuditCommittee also has considered whether the provision of any non-audit services (as described onpage 53 of this Proxy Statement under the heading “Proposal Three: Ratification of the Appointment ofKPMG LLP, Independent Registered Public Accounting Firm” — “Fees of Independent Auditors”) andthe employment of former KPMG LLP employees by the Company are compatible with maintaining theindependence of KPMG LLP.
15
The members of the Audit Committee are not engaged in the practice of auditing or accounting. Inperforming its functions, the Audit Committee necessarily relies on the work and assurances of theCompany’s management and the independent auditors.
In reliance on the reviews and discussions referred to in this report and in light of its role andresponsibilities, the Audit Committee recommended to the Board of Directors that the Company’saudited financial statements for fiscal 2018 be included for filing with the SEC in the Company’s AnnualReport. The Audit Committee has also approved the selection of KPMG LLP as the Company’sindependent auditors for fiscal 2019.
AUDIT COMMITTEE
Richard A. Simonson (Chairman)
Jeffrey T. Huber
Denise F. Warren
16

Pro
xyS
tatemen
t
DIRECTOR COMPENSATION AND STOCKOWNERSHIP GUIDELINESOur Compensation Committee is responsible for reviewing and recommending to our Board ofDirectors the compensation paid to our non-employee directors. Our non-employee directors are paid amix of cash and equity compensation for their service as directors.
Cash Compensation
The table below reflects the annualized components of cash compensation for non-employee directorsthat were in place during fiscal 2018. For more information regarding the specific compensationreceived by each non-employee director during fiscal 2018, see the “Fiscal 2018 DirectorCompensation Table” table below.
Compensation Component Amount
Annual Retainer . . . . . . . . . . . . . . . . . . . . . . . . . . . . . . . . . . . . . . . . . . . . . . . . . . . . . . . . . . . . . . . $60,000Service on the Audit Committee . . . . . . . . . . . . . . . . . . . . . . . . . . . . . . . . . . . . . . . . . . . . . . . . . . $15,000Chair of the Audit Committee . . . . . . . . . . . . . . . . . . . . . . . . . . . . . . . . . . . . . . . . . . . . . . . . . . . . $15,000Service on the Compensation Committee . . . . . . . . . . . . . . . . . . . . . . . . . . . . . . . . . . . . . . . . . . $12,500Chair of the Compensation Committee . . . . . . . . . . . . . . . . . . . . . . . . . . . . . . . . . . . . . . . . . . . . $12,500Service on the Nominating and Governance Committee . . . . . . . . . . . . . . . . . . . . . . . . . . . . . . $10,000Chair of the Nominating and Governance Committee . . . . . . . . . . . . . . . . . . . . . . . . . . . . . . . . . $10,000Chairman of the Board of Directors . . . . . . . . . . . . . . . . . . . . . . . . . . . . . . . . . . . . . . . . . . . . . . . $50,000Service as Lead Director . . . . . . . . . . . . . . . . . . . . . . . . . . . . . . . . . . . . . . . . . . . . . . . . . . . . . . . . $25,000
In addition, individual directors are eligible to earn up to $1,000 per day, with the approval of the Boardof Directors, for special assignments, which may include providing oversight to management in areassuch as sales, marketing, public relations, technology and finance (provided, however, no independentdirector is eligible for a special assignment if the assignment or payment for the assignment wouldprevent the director from being considered independent under applicable NASDAQ Stock Market orSEC rules). No directors earned any compensation for special assignments during fiscal 2018.
Our Compensation Committee reviews our non-employee director compensation every two years. OurCompensation Committee reviewed our non-employee director compensation in February 2018 inconsultation with the Compensation Committee’s independent consultant, Frederick W. Cook & Co(“FWC”). FWC conducted a competitive analysis of our non-employee director compensation againstour peer group (as defined in the “Compensation Discussion and Analysis” section below) and, basedon the Compensation Committee’s review, no changes to the compensation paid to our non-employeedirectors were recommended to our Board of Directors. The Compensation Committee will conduct itsnext review of non-employee director compensation in 2020.
Stock Compensation
In fiscal 2018, each of our non-employee directors who were re-elected at the 2017 annual meeting ofstockholders were granted restricted stock units with time-based vesting (“RSUs”) with a grant date fairvalue of approximately $260,000. These RSUs will vest in their entirety on August 2, 2018.
Under the EIP, non-employee directors may elect to receive all or part of their cash compensation inthe form of common stock. As an incentive for our non-employee directors to increase their stockownership in EA, non-employee directors making such an election receive shares of common stockvalued at 110% of the cash compensation they would have otherwise received. These shares areawarded via the grant and immediate exercise of a stock option having an exercise price equal to thefair market value of our common stock on the date of grant, which is the first trading day of eachquarter of the Board year. Mr. Hoag, Mr. Huber, Ms. Roche, Mr. Simonson, Mr. Ubiñas andMs. Warren received all or part of their cash compensation in the form of our common stock duringfiscal 2018.
17
Other Benefits
Non-employee directors who are not employed with any other company are offered an opportunity topurchase certain EA health, dental and vision insurance while serving as a director. Participatingdirectors pay 100% of their own insurance premiums.
Stock Ownership Guidelines
Each non-employee director is required, within five years of becoming a director, to own a number ofshares of EA common stock having a value of at least five years’ annual retainer for service on ourBoard of Directors.
Non-employee directors are permitted to include the value of vested, but deferred, RSUs toward theirownership requirement. As of March 31, 2018, each of our directors had either fulfilled their ownershiprequirements or had not yet reached five years of service. Mr. Hoag is eligible to satisfy his ownershiprequirements through holdings of EA stock by Technology Crossover Ventures, where he serves asthe Founding General Partner. Mr. Huber is eligible to satisfy his ownership requirements throughholdings of EA stock through certain trusts over which Mr. Huber maintains investment control andpecuniary interest.
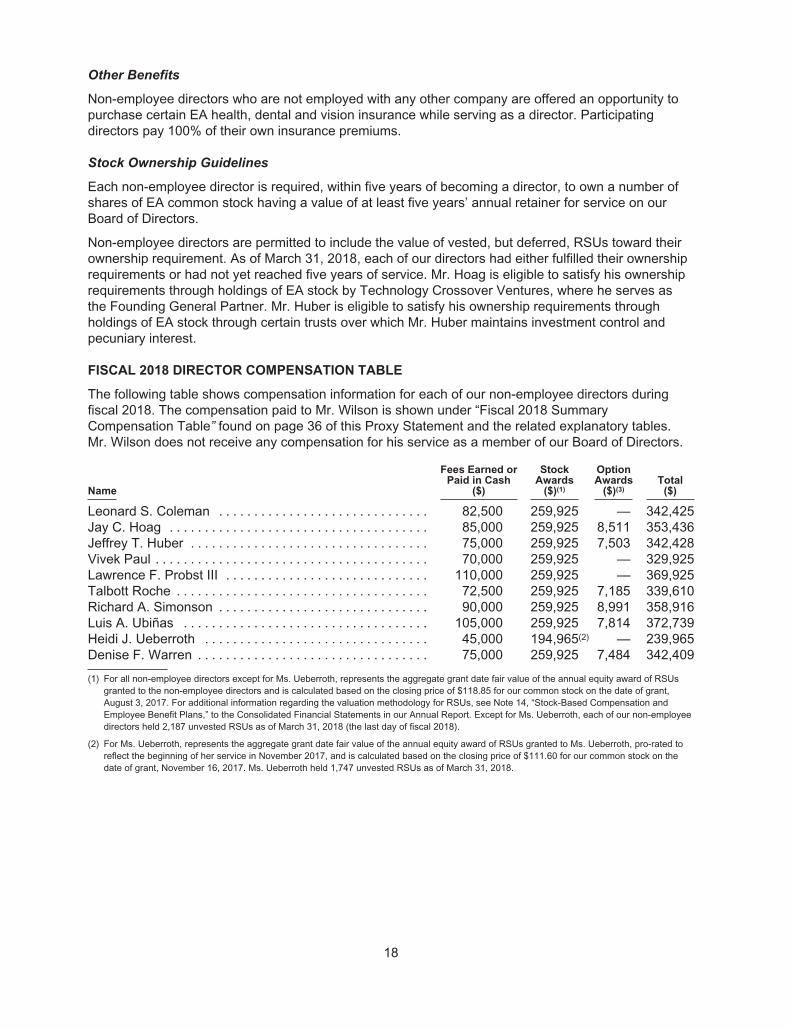
FISCAL 2018 DIRECTOR COMPENSATION TABLE
The following table shows compensation information for each of our non-employee directors duringfiscal 2018. The compensation paid to Mr. Wilson is shown under “Fiscal 2018 SummaryCompensation Table” found on page 36 of this Proxy Statement and the related explanatory tables.Mr. Wilson does not receive any compensation for his service as a member of our Board of Directors.
Name
Fees Earned orPaid in Cash
($)
StockAwards
($)(1)
OptionAwards
($)(3)Total
($)
Leonard S. Coleman . . . . . . . . . . . . . . . . . . . . . . . . . . . . . . 82,500 259,925 — 342,425Jay C. Hoag . . . . . . . . . . . . . . . . . . . . . . . . . . . . . . . . . . . . . 85,000 259,925 8,511 353,436Jeffrey T. Huber . . . . . . . . . . . . . . . . . . . . . . . . . . . . . . . . . . 75,000 259,925 7,503 342,428Vivek Paul . . . . . . . . . . . . . . . . . . . . . . . . . . . . . . . . . . . . . . . 70,000 259,925 — 329,925Lawrence F. Probst III . . . . . . . . . . . . . . . . . . . . . . . . . . . . . 110,000 259,925 — 369,925Talbott Roche . . . . . . . . . . . . . . . . . . . . . . . . . . . . . . . . . . . . 72,500 259,925 7,185 339,610Richard A. Simonson . . . . . . . . . . . . . . . . . . . . . . . . . . . . . . 90,000 259,925 8,991 358,916Luis A. Ubiñas . . . . . . . . . . . . . . . . . . . . . . . . . . . . . . . . . . . 105,000 259,925 7,814 372,739Heidi J. Ueberroth . . . . . . . . . . . . . . . . . . . . . . . . . . . . . . . . 45,000 194,965(2) — 239,965Denise F. Warren . . . . . . . . . . . . . . . . . . . . . . . . . . . . . . . . . 75,000 259,925 7,484 342,409
(1) For all non-employee directors except for Ms. Ueberroth, represents the aggregate grant date fair value of the annual equity award of RSUsgranted to the non-employee directors and is calculated based on the closing price of $118.85 for our common stock on the date of grant,August 3, 2017. For additional information regarding the valuation methodology for RSUs, see Note 14, “Stock-Based Compensation andEmployee Benefit Plans,” to the Consolidated Financial Statements in our Annual Report. Except for Ms. Ueberroth, each of our non-employeedirectors held 2,187 unvested RSUs as of March 31, 2018 (the last day of fiscal 2018).
(2) For Ms. Ueberroth, represents the aggregate grant date fair value of the annual equity award of RSUs granted to Ms. Ueberroth, pro-rated toreflect the beginning of her service in November 2017, and is calculated based on the closing price of $111.60 for our common stock on thedate of grant, November 16, 2017. Ms. Ueberroth held 1,747 unvested RSUs as of March 31, 2018.
18

Pro
xyS
tatemen
t
(3) Non-employee directors may elect to receive all or part of their cash compensation in the form of common stock, and directors making such anelection receive common stock valued at 110% of the cash compensation they would have otherwise received. These shares are awarded viathe grant and immediate exercise of a stock option having an exercise price equal to the fair market value of our common stock on the date ofgrant. The values represent the premium received for shares in lieu of cash compensation. The following table presents information regardingthe shares granted to each director during fiscal 2018, who elected to receive all or part of their cash compensation in the form of commonstock:
Name Grant DateExercise Price
($)
SharesSubject to
ImmediatelyExercised
StockOptionGrants
Grant DateFair Value
($)
Jay C. Hoag . . . . . . . . . . . . . . . . . . . . . 5/1/2017 94.79 246 23,3188/1/2017 116.92 200 23,384
11/1/2017 114.47 204 23,3522/1/2018 128.18 183 23,457
93,511
Jeffrey T. Huber . . . . . . . . . . . . . . . . . . 5/1/2017 94.79 217 20,5698/1/2017 116.92 176 20,578
11/1/2017 114.47 181 20,7192/1/2018 128.18 161 20,637
82,503
Talbott Roche . . . . . . . . . . . . . . . . . . . . 5/1/2017 94.79 210 19,9068/1/2017 116.92 171 19,993
11/1/2017 114.47 174 19,9182/1/2018 128.18 155 19,868
79,685
Richard A. Simonson . . . . . . . . . . . . . . 5/1/2017 94.79 261 24,7408/1/2017 116.92 212 24,787
11/1/2017 114.47 216 24,7262/1/2018 128.18 193 24,739
98,991
Luis A. Ubiñas . . . . . . . . . . . . . . . . . . . 8/1/2017 116.92 246 28,76211/1/2017 114.47 253 28,9612/1/2018 128.18 225 28,841
86,564
Denise F. Warren . . . . . . . . . . . . . . . . . 5/1/2017 94.79 218 20,6648/1/2017 116.92 176 20,578
11/1/2017 114.47 180 20,6052/1/2018 128.18 161 20,637
82,484
19
COMPENSATION DISCUSSION AND ANALYSISOVERVIEW
Our Compensation Discussion and Analysis describes and discusses the fiscal 2018 compensationpaid to our named executive officers (“NEOs”) and is organized into six sections:
• Executive Summary
• Compensation Practices, Principles and Say on Pay Vote
• The Process for Determining Our NEOs’ Compensation
• Our Elements of Pay
• Our NEOs’ Fiscal 2018 Compensation
• Other Compensation Information
For fiscal 2018, EA’s NEOs and their titles were:
• Andrew Wilson, Chief Executive Officer;
• Blake Jorgensen, Executive Vice President and Chief Financial Officer;
• Patrick Söderlund, Executive Vice President, EA Worldwide Studios;
• Kenneth Moss, Executive Vice President and Chief Technology Officer; and
• Chris Bruzzo, Chief Marketing Officer
On April 12, 2018, EA announced changes to certain of its NEOs’ roles, which position the Companyfor continued transformation and leadership. Blake Jorgensen now serves as the Company’s ChiefOperating Officer in addition to his role as EA’s Chief Financial Officer; Patrick Söderlund transitionedto the newly established Company-wide leadership role of Chief Design Officer focused on deliveringnext-generation game designs, driving our marketing teams on creative content and meta-gameexperiences, and working with our central technology teams to transform gaming; and Chris Bruzzoleads the Company’s integrated marketing, publishing and analytics organization, as Laura Miele,previously head of Global Publishing, has taken over the Chief Studios Officer role.
EXECUTIVE SUMMARY
Fiscal 2018 Summary of EA’s Business
EA’s core strategies continued to deliver award-winning games and services to our players and deepplayer engagement. The breadth and depth of EA’s portfolio of games across key platforms, combinedwith our focus on live services to extend and enhance our games, generated strong financial results forthe Company. We exceeded our net revenue and operating income guidance for fiscal 2018, drovehigher gross margins, increased our cash provided by operations and invested in products andservices for the future.
Fiscal 2018 GAAP Financial and Operating Highlights
• We generated $5,150 million of net revenue and $3.34 diluted earnings per share.
• Our digital net revenue increased to $3,450 million and represented 67% of our total netrevenue.
• Operating profit margins were 27.8%.
• We delivered net income of $1,043 million and operating cash flow of $1,692 million.
• We generated net bookings for a fiscal year of $5,180 million.
20
Pro
xyS
tatemen
t
• Titles in our top franchises, including FIFA 18, Battlefield 1, Star Wars Battlefront 2, The Sims 4,our live services including Ultimate Team in our sports franchises and mobile titles includingStar Wars: Galaxy of Heroes and Madden NFL Mobile delivered hundreds of millions of hours ofentertainment.
• We repurchased 5.3 million shares for $601 million.
The financial performance, operational achievements and other fiscal year events summarized aboveprovide context for the compensation decisions made by the Compensation Committee and Board ofDirectors in fiscal 2018 as we continue to structure our executive compensation program to align withpay-for-performance considerations. The Company’s executive compensation program is designed toreward our officers for the achievement of specific Company-wide financial objectives and the creationof long-term stockholder value.
COMPENSATION PRACTICES, PRINCIPLES AND SAY ON PAY VOTE
Compensation Design
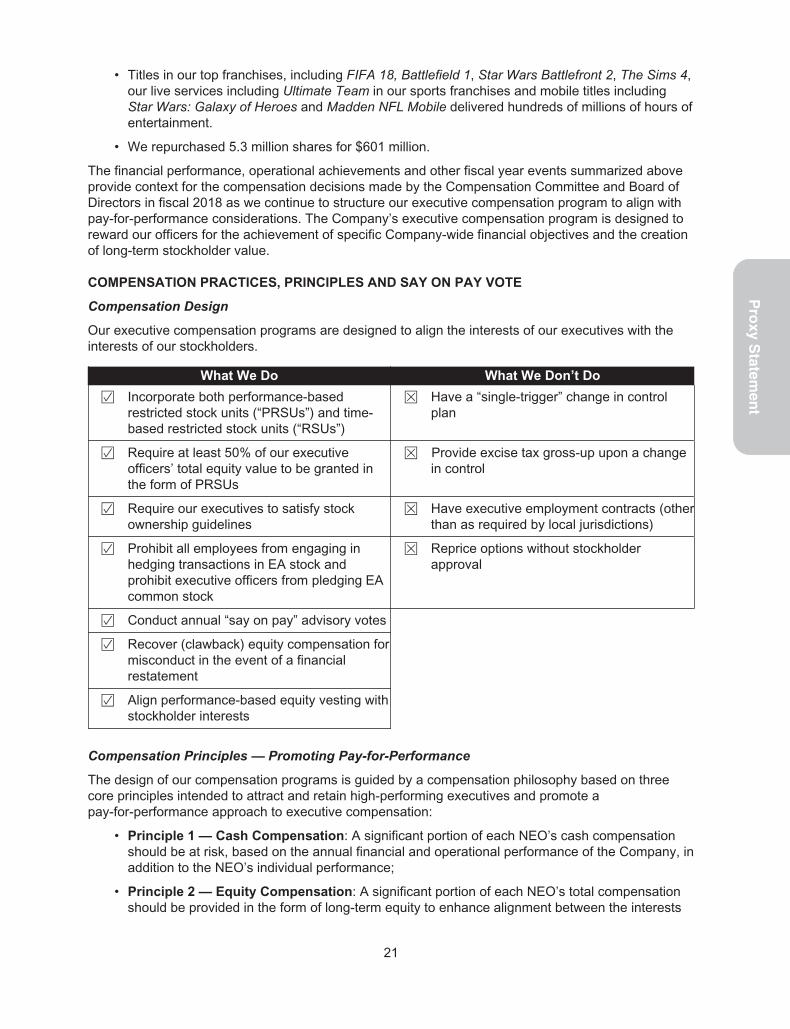
Our executive compensation programs are designed to align the interests of our executives with theinterests of our stockholders.
What We Do What We Don’t Do
Í Incorporate both performance-basedrestricted stock units (“PRSUs”) and time-based restricted stock units (“RSUs”)
È Have a “single-trigger” change in controlplan
Í Require at least 50% of our executiveofficers’ total equity value to be granted inthe form of PRSUs
È Provide excise tax gross-up upon a changein control
Í Require our executives to satisfy stockownership guidelines
È Have executive employment contracts (otherthan as required by local jurisdictions)
Í Prohibit all employees from engaging inhedging transactions in EA stock andprohibit executive officers from pledging EAcommon stock
È Reprice options without stockholderapproval
Í Conduct annual “say on pay” advisory votes
Í Recover (clawback) equity compensation formisconduct in the event of a financialrestatement
Í Align performance-based equity vesting withstockholder interests
Compensation Principles — Promoting Pay-for-Performance
The design of our compensation programs is guided by a compensation philosophy based on threecore principles intended to attract and retain high-performing executives and promote apay-for-performance approach to executive compensation:
• Principle 1 — Cash Compensation: A significant portion of each NEO’s cash compensationshould be at risk, based on the annual financial and operational performance of the Company, inaddition to the NEO’s individual performance;
• Principle 2 — Equity Compensation: A significant portion of each NEO’s total compensationshould be provided in the form of long-term equity to enhance alignment between the interests
21
of our NEOs and our stockholders and to promote long-term retention of a strong leadershipteam in an industry and geographic area that are highly competitive for executive talent; and
• Principle 3 — Target Total Direct Compensation: The target total direct compensationpackage for each NEO should be consistent with market practices for executive talent andreflect each NEO’s individual experience, responsibilities and performance.
Fiscal 2017 Say On Pay Vote and Say on Pay Frequency Vote
We received a favorable 96% of votes cast for our annual say on pay advisory proposal at our 2017annual meeting. At that meeting, we also presented our stockholders with a proposal on the frequencyof our say on pay advisory proposal. Based on the results of this vote, the Compensation Committeeand the Board of Directors will continue to present an advisory say on pay proposal on an annualbasis.
EA’s management, the Compensation Committee and the Board of Directors are committed tomaintaining a pay-for-performance alignment in our executive compensation programs and value theopinions of our stockholders regarding our programs.
THE PROCESS FOR DETERMINING OUR NEOS’ COMPENSATION
Role of the Board of Directors, Compensation Committee and Management
Our Board of Directors approves the target total direct compensation and makes compensationdecisions for our CEO, in consultation with the Compensation Committee and the CompensationCommittee’s independent compensation consultant, Compensia. The Compensation Committeeapproves the target total direct compensation and makes compensation decisions for all other NEOsafter input, at the Compensation Committee’s request, from our CEO, our Chief People Officer andCompensia.
Compensation decisions made by the Board of Directors and the Compensation Committee are basedon several factors, including the Company’s financial performance, individual performance, markettrends and other factors unique to each individual. The impact of the Company’s financial performanceand individual considerations in our fiscal 2018 compensation decisions are detailed in the section ofthis Compensation Discussion and Analysis entitled “Our NEOs’ Fiscal 2018 Compensation.” TheCompensation Committee and the Board of Directors also reference certain market-basedconsiderations, such as peer group data, benchmarking and percentiles when making compensationdecisions.
Selection and Use of Peer Group
To assess market compensation practices, each year the Compensation Committee selects a group ofcompanies (“peer group”) comparable to us with respect to several quantitative factors, includingrevenue, market capitalization, total stockholder return, net income margin and number of employees,as well as qualitative factors including competition for talent.
In the third quarter of fiscal 2017, the Compensation Committee selected the following peer group touse as a reference for fiscal 2018 compensation decisions. This peer group was consistent with theprior year’s other than the removal of Yahoo! and LinkedIn Corporation, because each was acquiredand thus no longer publicly-traded. As compared to our fiscal 2018 peer group and based on publicfilings through June 1, 2018, the Company was at the 38th percentile with respect to annual revenuesand at the 69th percentile with respect to market capitalization.
22

Pro
xyS
tatemen
t
FISCAL 2018 PEER GROUP
Video Game Technology/Internet Entertainment Toys/Games
Activision Blizzard Adobe Systems AMC Networks Inc. HasbroZynga Autodesk Discovery Communications Mattel
eBay Lions Gate EntertainmentExpedia
IAC/Interactive Corp.Intuit
PricelineSalesforce.com
Symantec
In the third quarter of fiscal 2018, the Compensation Committee assessed this peer group andconsidered the Company’s significant market capitalization growth over the past several fiscal yearsand its evolving business models. Based on these factors, as well as other commonalities, theCompensation Committee added VMware, Take-Two Interactive Software, Nvidia, CBS and Netflix toour peer group for use in benchmarking fiscal 2019 compensation decisions. These companies weredetermined by the Committee to be relevant comparable companies in the video game, entertainmentand technology sectors. The Compensation Committee also removed Mattel and Lions GateEntertainment from our peer group for fiscal 2019 due to our diverging business models.
Compensation Benchmarking and the Role of Consultants
In February 2018, Compensia conducted a comprehensive analysis of our executive compensationprograms using publicly available compensation information on our peer group. The analysis includeda comparison of the base salary, target cash compensation, long-term incentives and target total directcompensation of each of our senior vice-president level positions and above against similar positions inour peer group. Where sufficient market data for our peer group was not available, Compensia useddata from a broader group of similarly sized technology companies. Compensia provided theCompensation Committee with its findings in February 2018 to be used as a reference for makingbonus decisions for fiscal 2018 and base salary and equity decisions for fiscal 2019.
Use of Percentiles
When setting the fiscal 2018 base salaries and bonus targets for our executive officers, theCompensation Committee referenced the 50th to 75th percentiles of the market range of comparablecompanies, and for target guidelines for annual equity awards, the Compensation Committeereferenced the 75th percentile. We believe these percentiles are appropriate to recruit and retain astrong leadership team in an industry and geographic area that are highly competitive for executivetalent. Our guidelines for annual equity awards reference a higher percentile because of the importantretention value of the awards. While we consider each component, the actual base salary, bonus andequity compensation awarded to an NEO may be above these targets and is determined based on ourfinancial performance, individual performance, market trends and other factors unique to eachindividual.
The Compensation Committee also considered the aggregate value of the target total directcompensation components (i.e., base salary, bonus and annual equity awards), and referenced the50th to 75th percentiles of the market for target total direct compensation. When necessary for newhires, retention, succession planning, or other factors, the Compensation Committee may approve, anddid approve for fiscal 2018, compensation for select key executives that could result in target totaldirect compensation above our referenced range.
23

OUR ELEMENTS OF PAY
We believe that our compensation programs reflect our three compensation principles described underthe heading “Compensation Principles — Promoting Pay-for-Performance” and are designed to rewardachievement of Company-wide financial objectives, individual operational and strategic objectives andthe creation of long-term value for our stockholders, while also recognizing the dynamic and highlycompetitive nature of our business and the market for top executive talent. For fiscal 2018,approximately 93% of our CEO’s target total direct compensation and 91% of the average of ourNEOs’ (excluding our CEO) target total direct compensation is performance-based in the form of anannual performance cash bonus, PRSUs and RSUs. Our compensation structure puts at risk asignificant portion of our NEOs’ target total direct compensation, as set forth below:
Average of the NEOs (Excluding CEO) CEO
PRSUs41%
Base9%
Performance CashBonus 9%
RSUs41%
PRSUs41%
Base7%
Performance CashBonus 11%
RSUs41%
Base Salary
Base salary is the fixed cash component that is market competitive for the role to attract and retainhigh-performing executives. On an annual basis, the Compensation Committee reviews and approvesany base salary adjustments considering factors such as individual performance, the market for similarpositions, level of responsibilities, complexity of role and internal compensation alignment.
Performance Cash Bonus Awards
Our cash bonus programs motivate our executives to achieve challenging short-term performancegoals that are important to the Company’s long-term growth. The Compensation Committee sets theexecutives’ bonus targets each year as a percentage of base salary based on factors such asindividual performance, the market for similar positions, level of responsibilities, complexity of role, andinternal compensation alignment.
The performance cash bonus award to each of our NEOs is determined as follows:
BaseSalary X
Bonus TargetPercentage (%of Base Salary)
XCompany Bonus
FundingPercentage
XIndividual
PerformanceModifier
=NEO Bonus
Payout
The annual performance cash bonuses represented approximately 60% of our CEO’s target total cashcompensation and 50% of the average of our NEOs’ (excluding our CEO) target total cashcompensation.
Executive Bonus Plan: At the beginning of each fiscal year, the Compensation Committee selects theExecutive Bonus Plan participants, performance period, performance measures, and the formula usedto determine maximum bonus funding under each plan. Performance cash bonuses paid under theExecutive Bonus Plan for fiscal 2018 were intended to qualify as tax deductible “performance-based
24

Pro
xyS
tatemen
t
compensation” under Section 162(m) of the Code. In fiscal 2018, all our NEOs, except forMr. Söderlund, were selected to participate in the Executive Bonus Plan. Mr. Söderlund was excludedfrom the Executive Bonus Plan in fiscal 2018, because he resides in Sweden and his compensation didnot qualify as tax deductible under Section 162(m). Mr. Söderlund participated in the general EA BonusPlan in fiscal 2018.
For all NEOs, including Mr. Söderlund, the Compensation Committee selected non-GAAP net incomeas the performance measure, because the level of profitability is a key business focus in any year. Theperformance period was established as fiscal 2018, and the formula to determine the maximum bonusfunding for each NEO was the lower of: (1) 600% of each respective NEO’s annual base salary not toexceed $5,000,000 or (2) 0.5% of our fiscal 2018 non-GAAP net income for each NEO other than ourCEO, for whom the maximum was 1% of our fiscal 2018 non-GAAP net income. For fiscal 2018, theCompany’s non-GAAP net income was $1,368 million, which resulted in a maximum bonus awardfunding of 600% of each respective NEO’s annual base salary, not to exceed $5,000,000. TheCompensation Committee then exercised its discretion to reduce actual bonus awards for each NEObased on the Company’s overall financial performance, the terms of the Executive Bonus Plan and EABonus Plan, target bonus percentages and individual performance against strategic and operationalobjectives, as discussed in “Our NEOs’ Fiscal 2018 Compensation” below.
When making compensation decisions for our executives, we utilize non-GAAP financial measures toevaluate the Company’s financial performance and the performance of our management team againstnon-GAAP targets. Appendix A to this Proxy Statement provides a reconciliation between ournon-GAAP financial measures and our audited financial statements. For more information regardingour use of non-GAAP financial measures for our compensation programs, please refer to theinformation provided under the heading “Use of Non-GAAP Financial Measures” below.
PRSUs
The Compensation Committee grants PRSUs to senior vice president level employees and above aspart of their annual equity awards. To encourage executive retention and to encourage our executivesto focus on long-term stock price performance, the PRSUs generally vest over a three-yearperformance period; however, the Compensation Committee may consider a different performancemeasurement period when appropriate for new-hires, retention, succession planning or other factors.The number of shares earned is adjusted based upon changes in our TSR relative to the TSR of thecompanies in the NASDAQ-100 Index (the “Relative NASDAQ-100 TSR Percentile”) measured overthe vesting measurement periods, which are generally 12-month, 24-month cumulative and 36-monthcumulative periods (each such period, a “Vesting Measurement Period”). PRSUs generally will vestupon the first, second and third anniversaries of the date of grant (which we call “VestingOpportunities”). For fiscal 2018, 50% of the total value of our NEOs’ annual equity awards were madein the form of PRSUs.
The illustration below depicts how the number of shares earned is calculated:
Target PRSUs xRelative
NASDAQ-100TSR Percentile Modifier
= Shares Earned
The Relative NASDAQ-100 TSR Percentile modifier, which can range from 0% to 200%, is based onthe change in our stock price during a Vesting Measurement Period (i.e., approximately the 12-monthperiod, 24-month cumulative period and 36-month cumulative period following of the date of grant),using a 90-day trailing average stock price. If the Company’s Relative NASDAQ-100 TSR Percentile isat the 60th percentile at the end of a Vesting Measurement Period, 100% of target shares will beearned. Thus, target vesting is tied to above-median performance of the NASDAQ 100. Thepercentage of shares earned will be adjusted upward by 3% or downward by 2% for each percentileabove or below the 60th percentile, respectively.
25

The following table illustrates the percentage of shares that could be earned from our PRSUs based onthe Company’s Relative NASDAQ-100 TSR Percentile:
Relative NASDAQ-100 TSR Percentile1st to10th 25th 40th 60th 75th 90th
94th to100th
Relative NASDAQ-100 TSR Multiplier 0% 30% 60% 100% 145% 190% 200%
The following table illustrates the percentage of shares subject to outstanding PRSUs earned at theend of fiscal 2018:
PRSU Grant Date June 2015 June 2016 June 2017
Measurement Period Fiscal 16-18 Fiscal 17-19 Fiscal 18-20
90-day average stock price (at start of measurement
period) $61.26 $70.55 $102.99
Length of Vesting Measurement Period 3 Years 2 Years 1 Year
90-day average stock price (at end of measurement
period) $121.20
EA’s TSR 97.85% 71.80% 17.68%
EA’s Relative NASDAQ-100 TSR Percentile 83rd 76th 56th
Percentage of Target Shares Vested in May 2018 169% 148% 92%
The number of shares earned is capped at 200% of the target shares available for vesting at a VestingOpportunity. If the Company’s TSR at any Vesting Opportunity is negative on an absolute basis, thenumber of shares that can be earned is capped at 100% of the target regardless of the Company’sRelative NASDAQ-100 TSR Percentile.
In addition, as an incentive to keep our executives focused on long-term TSR performance, our PRSUprogram provides an opportunity for our executives to earn shares at the second and third VestingOpportunities that were not earned at the first and second Vesting Opportunities in an amount up to100% of the target number of shares unearned from the previous Vesting Opportunities. These sharesare earned if the Company’s Relative NASDAQ-100 TSR Percentile subsequently improves over thecumulative 24-month and/or 36-month Vesting Measurement Periods. This feature has not beenapplied to our PRSU program to date.
RSUs
RSUs reward absolute long-term stock price appreciation and promote retention. Annual equity awardgrants of RSUs to our NEOs vest annually over 35 months from the grant date in approximately equalincrements each May. The Compensation Committee may also grant RSUs with different vestingschedules when necessary for new hires, retention, succession planning, or other factors. For fiscal2018, approximately 50% of the total value of our NEOs’ annual equity awards were made in the formof RSUs.
Use of Non-GAAP Financial Measures
The Company uses certain adjusted non-GAAP financial measures when establishing performance-based targets, such as non-GAAP net revenue, non-GAAP gross profit, non-GAAP operatingexpenses, non-GAAP net income, non-GAAP diluted earnings per share and non-GAAP dilutedshares, among others. These measures adjust for certain items that may not be indicative of theCompany’s core business, operating results or future outlook. We believe that these non-GAAPfinancial measures provide meaningful supplemental information about the Company’s operatingresults primarily because they exclude amounts that we do not consider part of ongoing operating
26

Pro
xyS
tatemen
t
results when planning and forecasting for future periods and when assessing the performance of theorganization. These non-GAAP financial measures exclude the following items as applicable, in eachreporting period: acquisition-related expenses, amortization of debt discount, change in deferred netrevenue (online-enabled games), income tax rate adjustments and stock-based compensation, amongothers. In addition, for purposes of determining the Company bonus funding percentage, we add backbonus expense. Appendix A to this Proxy Statement provides a reconciliation between our non-GAAPfinancial measures and our audited financial statements.
OUR NEOS’ FISCAL 2018 COMPENSATION
2018 Annual Base Salary
To determine an executive’s base salary, the Compensation Committee with assistance fromCompensia, considers the pay practices of our peer group for comparable positions, experience,tenure and internal equity based on the scale and scope of the role. As part of its May 2017compensation review, the Compensation Committee (and Board of Directors for Mr. Wilson) approvedfiscal 2018 base salaries increases, effective June 1, 2017, of 4.5% for Mr. Wilson to $1,150,000;4.58% for Mr. Jorgensen to $800,000; 28% for Mr. Söderlund to $800,000; 4% for Mr. Moss to$650,000; and 4.17% for Mr. Bruzzo to $625,000. Based on Compensia’s analysis, Mr. Wilson’s fiscal2017 base salary was in the 50th to 75th percentile for the CEOs in our peer group. These increases inbase salary for fiscal 2018 were based on the strength of the Company’s financial and operatingperformance in fiscal 2017 and in line with company-wide base salary merit increases for strongperformers. In the case of Mr. Söderlund, his increase was driven by the exceptional performance ofthe worldwide studios organization in fiscal 2017, in particular, the success of Battlefield I and the FIFAfranchises. In addition, the Committee recognized the unique scope of Mr. Söderlund’s role overseeingall game development at the Company across multiple platforms and genres.
Fiscal 2018 Performance Cash Bonus Awards
The Compensation Committee also sets the values of the annual performance bonus cash awards asa percentage of each executive’s base salary (“target bonus”) based on factors including the paypractices of our peer group for comparable positions, experience, tenure and internal equity based onthe scale and scope of the role.
The Board of Directors did not increase Mr. Wilson’s target bonus percentage for fiscal 2018. TheCompensation Committee increased Mr. Söderlund’s target bonus percentage from 100% to 150%,effective June 1, 2017, due to the same considerations outlined above with respect to Mr. Söderlund’sbase salary increase. The Compensation Committee did not increase our other NEOs’ target bonuspercentage for fiscal 2018.
Base Salaryin Fiscal 2018
Target BonusPercentage
Mr. Wilson . . . . . . . . . . . . . . . . . . . . . . . . . . . . . . . . . . . . . . . . . . . . . . . . . . . . . $1,141,667 175%Mr. Jorgensen . . . . . . . . . . . . . . . . . . . . . . . . . . . . . . . . . . . . . . . . . . . . . . . . . . $ 794,167 100%Mr. Söderlund(1) . . . . . . . . . . . . . . . . . . . . . . . . . . . . . . . . . . . . . . . . . . . . . . . . . $ 821,537 150%Mr. Moss . . . . . . . . . . . . . . . . . . . . . . . . . . . . . . . . . . . . . . . . . . . . . . . . . . . . . . $ 645,833 75%Mr. Bruzzo . . . . . . . . . . . . . . . . . . . . . . . . . . . . . . . . . . . . . . . . . . . . . . . . . . . . . $ 620,833 75%
(1) Mr. Söderlund resides in Stockholm, Sweden and is paid in Swedish krona (“SEK”). Mr. Söderlund’s fiscal 2018 base salary was derived froman average of the SEK to USD exchange rates on the last day of each month during fiscal 2018 of 0.120427.
Performance cash bonus awards represented approximately one-half of our average NEO’s target totalcash compensation, thus putting at risk a significant portion of our NEOs’ cash compensation.
Fiscal 2018 Company Bonus Funding Percentage: In order to align our NEOs’ bonus payouts to theperformance of the Company, each NEO’s performance cash bonus award is tied to the bonus fundingpercentage applied to our overall Company bonus pool. This pool is based on the Company’s financialperformance with equal weighting given to our non-GAAP net revenue and non-GAAP diluted earnings
27
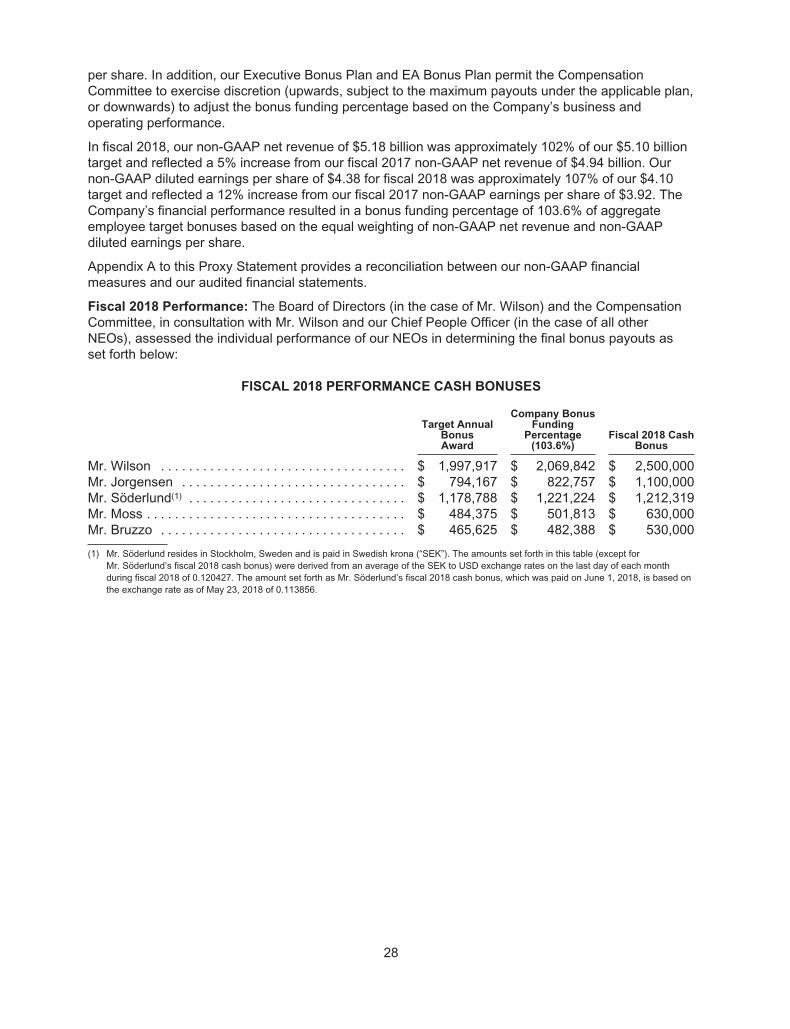
per share. In addition, our Executive Bonus Plan and EA Bonus Plan permit the CompensationCommittee to exercise discretion (upwards, subject to the maximum payouts under the applicable plan,or downwards) to adjust the bonus funding percentage based on the Company’s business andoperating performance.
In fiscal 2018, our non-GAAP net revenue of $5.18 billion was approximately 102% of our $5.10 billiontarget and reflected a 5% increase from our fiscal 2017 non-GAAP net revenue of $4.94 billion. Ournon-GAAP diluted earnings per share of $4.38 for fiscal 2018 was approximately 107% of our $4.10target and reflected a 12% increase from our fiscal 2017 non-GAAP earnings per share of $3.92. TheCompany’s financial performance resulted in a bonus funding percentage of 103.6% of aggregateemployee target bonuses based on the equal weighting of non-GAAP net revenue and non-GAAPdiluted earnings per share.
Appendix A to this Proxy Statement provides a reconciliation between our non-GAAP financialmeasures and our audited financial statements.
Fiscal 2018 Performance: The Board of Directors (in the case of Mr. Wilson) and the CompensationCommittee, in consultation with Mr. Wilson and our Chief People Officer (in the case of all otherNEOs), assessed the individual performance of our NEOs in determining the final bonus payouts asset forth below:
FISCAL 2018 PERFORMANCE CASH BONUSES
Target AnnualBonusAward
Company BonusFunding
Percentage(103.6%)
Fiscal 2018 CashBonus
Mr. Wilson . . . . . . . . . . . . . . . . . . . . . . . . . . . . . . . . . . . $ 1,997,917 $ 2,069,842 $ 2,500,000Mr. Jorgensen . . . . . . . . . . . . . . . . . . . . . . . . . . . . . . . . $ 794,167 $ 822,757 $ 1,100,000Mr. Söderlund(1) . . . . . . . . . . . . . . . . . . . . . . . . . . . . . . . $ 1,178,788 $ 1,221,224 $ 1,212,319Mr. Moss . . . . . . . . . . . . . . . . . . . . . . . . . . . . . . . . . . . . . $ 484,375 $ 501,813 $ 630,000Mr. Bruzzo . . . . . . . . . . . . . . . . . . . . . . . . . . . . . . . . . . . $ 465,625 $ 482,388 $ 530,000
(1) Mr. Söderlund resides in Stockholm, Sweden and is paid in Swedish krona (“SEK”). The amounts set forth in this table (except forMr. Söderlund’s fiscal 2018 cash bonus) were derived from an average of the SEK to USD exchange rates on the last day of each monthduring fiscal 2018 of 0.120427. The amount set forth as Mr. Söderlund’s fiscal 2018 cash bonus, which was paid on June 1, 2018, is based onthe exchange rate as of May 23, 2018 of 0.113856.
28
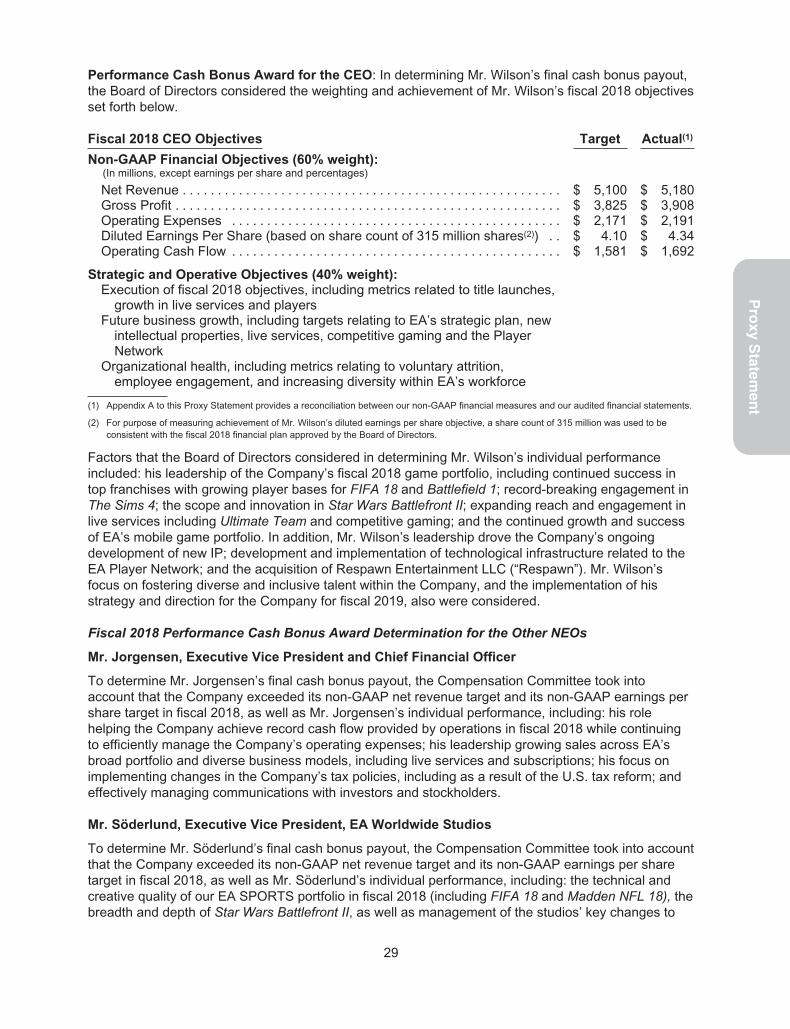
Pro
xyS
tatemen
t
Performance Cash Bonus Award for the CEO: In determining Mr. Wilson’s final cash bonus payout,the Board of Directors considered the weighting and achievement of Mr. Wilson’s fiscal 2018 objectivesset forth below.
Fiscal 2018 CEO Objectives Target Actual(1)
Non-GAAP Financial Objectives (60% weight):(In millions, except earnings per share and percentages)
Net Revenue . . . . . . . . . . . . . . . . . . . . . . . . . . . . . . . . . . . . . . . . . . . . . . . . . . . . . . $ 5,100 $ 5,180Gross Profit . . . . . . . . . . . . . . . . . . . . . . . . . . . . . . . . . . . . . . . . . . . . . . . . . . . . . . . $ 3,825 $ 3,908Operating Expenses . . . . . . . . . . . . . . . . . . . . . . . . . . . . . . . . . . . . . . . . . . . . . . . $ 2,171 $ 2,191Diluted Earnings Per Share (based on share count of 315 million shares(2)) . . $ 4.10 $ 4.34Operating Cash Flow . . . . . . . . . . . . . . . . . . . . . . . . . . . . . . . . . . . . . . . . . . . . . . . $ 1,581 $ 1,692
Strategic and Operative Objectives (40% weight):Execution of fiscal 2018 objectives, including metrics related to title launches,
growth in live services and playersFuture business growth, including targets relating to EA’s strategic plan, new
intellectual properties, live services, competitive gaming and the PlayerNetwork
Organizational health, including metrics relating to voluntary attrition,employee engagement, and increasing diversity within EA’s workforce
(1) Appendix A to this Proxy Statement provides a reconciliation between our non-GAAP financial measures and our audited financial statements.
(2) For purpose of measuring achievement of Mr. Wilson’s diluted earnings per share objective, a share count of 315 million was used to beconsistent with the fiscal 2018 financial plan approved by the Board of Directors.
Factors that the Board of Directors considered in determining Mr. Wilson’s individual performanceincluded: his leadership of the Company’s fiscal 2018 game portfolio, including continued success intop franchises with growing player bases for FIFA 18 and Battlefield 1; record-breaking engagement inThe Sims 4; the scope and innovation in Star Wars Battlefront II; expanding reach and engagement inlive services including Ultimate Team and competitive gaming; and the continued growth and successof EA’s mobile game portfolio. In addition, Mr. Wilson’s leadership drove the Company’s ongoingdevelopment of new IP; development and implementation of technological infrastructure related to theEA Player Network; and the acquisition of Respawn Entertainment LLC (“Respawn”). Mr. Wilson’sfocus on fostering diverse and inclusive talent within the Company, and the implementation of hisstrategy and direction for the Company for fiscal 2019, also were considered.
Fiscal 2018 Performance Cash Bonus Award Determination for the Other NEOs
Mr. Jorgensen, Executive Vice President and Chief Financial Officer
To determine Mr. Jorgensen’s final cash bonus payout, the Compensation Committee took intoaccount that the Company exceeded its non-GAAP net revenue target and its non-GAAP earnings pershare target in fiscal 2018, as well as Mr. Jorgensen’s individual performance, including: his rolehelping the Company achieve record cash flow provided by operations in fiscal 2018 while continuingto efficiently manage the Company’s operating expenses; his leadership growing sales across EA’sbroad portfolio and diverse business models, including live services and subscriptions; his focus onimplementing changes in the Company’s tax policies, including as a result of the U.S. tax reform; andeffectively managing communications with investors and stockholders.
Mr. Söderlund, Executive Vice President, EA Worldwide Studios
To determine Mr. Söderlund’s final cash bonus payout, the Compensation Committee took into accountthat the Company exceeded its non-GAAP net revenue target and its non-GAAP earnings per sharetarget in fiscal 2018, as well as Mr. Söderlund’s individual performance, including: the technical andcreative quality of our EA SPORTS portfolio in fiscal 2018 (including FIFA 18 and Madden NFL 18), thebreadth and depth of Star Wars Battlefront II, as well as management of the studios’ key changes to
29
the game; the continued expansion and success of Battlefield 1 and The Sims 4; improvedperformance for EA’s mobile portfolio, including top-performing titles Star Wars: Galaxy of Heroes,Madden NFL Mobile and FIFA Mobile; improved player engagement with our products and theincrease in digital revenue driven by live service engagement. In addition, our development of newgames for launch in fiscal 2019 was considered, including Anthem, the next and new mobile titles; ourcreation of new IP for both console and PC; attracting and retaining talent; spearheading theacquisition of Respawn; Mr. Söderlund’s leadership of the EA Originals program to partner withindependent studios to publish creative and innovative games such as A Way Out; and his overallleadership of our EA Worldwide Studios organization.
Mr. Moss, Executive Vice President and Chief Technology Officer
To determine Mr. Moss’ final cash bonus payout, the Compensation Committee took into account thatthe Company exceeded its non-GAAP net revenue target and its non-GAAP earnings per share targetin fiscal 2018, as well as Mr. Moss’ individual performance, including: the successful scaling andenhancement of EA’s digital platform, the technology supporting our growing digital business, as wellas the development of the EA Player Network; his leadership of EA’s proprietary game enginetechnology, Frostbite; his team’s support of the Company’s products and services, such as ensuringthe platform performance, stability and timely delivery of the Company’s fiscal 2018 games includingFIFA 18, Star Wars Battlefront II and Madden NFL 18; and leading development of EA’s newtechnological innovations, including investments in streaming technology and artificial intelligence.
Mr. Bruzzo, Chief Marketing Officer
To determine Mr. Bruzzo’s final cash bonus payout, the Compensation Committee took into accountthat the Company exceeded its non-GAAP net revenue target and its non-GAAP earnings per sharetarget in fiscal 2018, as well as Mr. Bruzzo’s individual performance, including: successful multichannelglobal marketing campaigns for EA’s major titles, including the FIFA 18 campaign across socialplatforms; continued subscriber base growth in EA’s subscription services EA Access and OriginAccess; the expansion and execution of EA PLAY, the company’s independent event in June forplayers, media and community influencers; ongoing leadership of the EA Player Network; anddeepening EA’s player relationships with a focus on engagement and retention.
Fiscal 2018 Annual Equity Awards
Equity compensation is used as a tool to hire, retain and motivate the Company’s top talent. In fiscal2018, the NEOs’ annual equity awards were targeted to be comprised of 50% PRSUs with vesting tiedto the Company’s TSR and 50% RSUs with a three-year pro rata vesting schedule. The number ofPRSUs and RSUs awarded to each NEO was determined based upon an assessment of variousindividual factors, including each NEO’s role and tenure with the Company, individual performance, thevalue of unvested equity for retention considerations, the grant date fair-value of the award,competitive market practices, including benchmarking data for the position, and internal compensationalignment among our executive officers. In determining the size of each NEO’s annual equity award,the Compensation Committee or Board of Directors, in the case of Mr. Wilson, considered the availablemarket data for the NEO, the NEO’s current unvested equity holdings and the NEO’s individualperformance during fiscal 2018, including the individual performance factors in fiscal 2018 highlightedabove that factored into the individual NEO’s cash bonus.
30

Pro
xyS
tatemen
t
The following table shows the value of the annual equity awards granted to our NEOs in fiscal 2018:
Target PRSUs(1)(2) RSUs(1)(2)
Mr. Wilson . . . . . . . . . . . . . . . . . . . . . . . . . . . . . . . . . . . . . . . . . . . . . . . . $ 7,500,000 $ 7,500,000Mr. Jorgensen . . . . . . . . . . . . . . . . . . . . . . . . . . . . . . . . . . . . . . . . . . . . . $ 3,250,000 $ 3,250,000Mr. Söderlund . . . . . . . . . . . . . . . . . . . . . . . . . . . . . . . . . . . . . . . . . . . . . $ 5,000,000 $ 5,000,000Mr. Moss . . . . . . . . . . . . . . . . . . . . . . . . . . . . . . . . . . . . . . . . . . . . . . . . . $ 2,750,000 $ 2,750,000Mr. Bruzzo . . . . . . . . . . . . . . . . . . . . . . . . . . . . . . . . . . . . . . . . . . . . . . . . $ 2,000,000 $ 2,000,000
(1) Represents the value of the awards approved by the Compensation Committee on May 18, 2017 and the Board of Directors on May 19, 2017,in the case of Mr. Wilson. On the date of grant, the value was converted into PRSUs and RSUs over an equivalent number of shares roundeddown to the nearest whole share.
(2) Awards granted on June 16, 2017.
Approximately 85% of the aggregate compensation granted to our NEOs for fiscal 2018 was in theform of long-term equity, excluding the special equity awards discussed below.
Fiscal 2018 PIRSU Awards
During fiscal 2018, the Compensation Committee, and the Board of Directors in the case of Mr. Wilson,granted special equity awards comprised of performance-based incremental RSUs (“PIRSUs”) toMr. Wilson, Mr. Jorgensen, Mr. Söderlund and Mr. Moss, exclusively. At the time the grant wasapproved in the summer of 2017, the Compensation Committee and the Board of Directors noted thesignificant growth in Company’s performance under the leadership of these executives. In particular,from fiscal 2014 to fiscal 2017, the Company grew net revenue from $3,575 million to $4,845 millionand nearly doubled operating cash flow from $712 million to $1,383 million. Fiscal 2017 net revenueand operating cash flow were records for the Company. Looking ahead to the next several years, theBoard of Directors and the Compensation Committee determined that incentivizing and retaining thesekey executives was critical to the Company’s continued strong growth and success.
These PIRSU awards are entirely performance-based and depend on achieving aggressive growthtargets, which support the Company’s plan to build on the same level of exceptional performance that itachieved in fiscal 2017. If these targets are not met, these awards do not pay out. The number ofPIRSUs that ultimately vest depends on the growth in the Company’s non-GAAP net revenue and freecash flow (“FCF”) over a four-year performance period beginning in fiscal 2018 and ending with fiscal2021. These awards have one long-term cliff vesting, beyond the duration of the Company’s annualequity grants to our NEOs. The non-GAAP net revenue and FCF performance measures were chosenbecause they align with stockholders’ interest in the goal of achieving long-term, sustained andprofitable growth for the Company. In addition, the Compensation Committee and the Board ofDirectors believe that the FCF metric reflects the cash generation capability of the business necessaryto finance its continued growth and investment requirements and to return value to stockholders.
The PIRSUs, or a portion thereof, will cliff vest on May 26, 2021, provided one or both of thenon-GAAP net revenue and FCF performance targets are achieved and that the NEO remainsemployed on the vesting date. The metrics are weighted evenly where 50% of the total PIRSUs thatvest will be determined by our four-year cumulative non-GAAP net revenue achievement and the other50% will be determined by our four-year cumulative FCF achievement. The payout for each metric isindependent from the other.
The following chart shows vesting based on the threshold, target and maximum levels for non-GAAPnet revenue and FCF (with linear interpolation applying to performance between threshold, target andmaximum, with no funding for performance below threshold):
Threshold Target Maximum
Non-GAAP Net Revenue
(50% weighting) 50% Payout 100% Payout 200% Payout
FCF
(50% weighting) 50% Payout 100% Payout 200% Payout
31
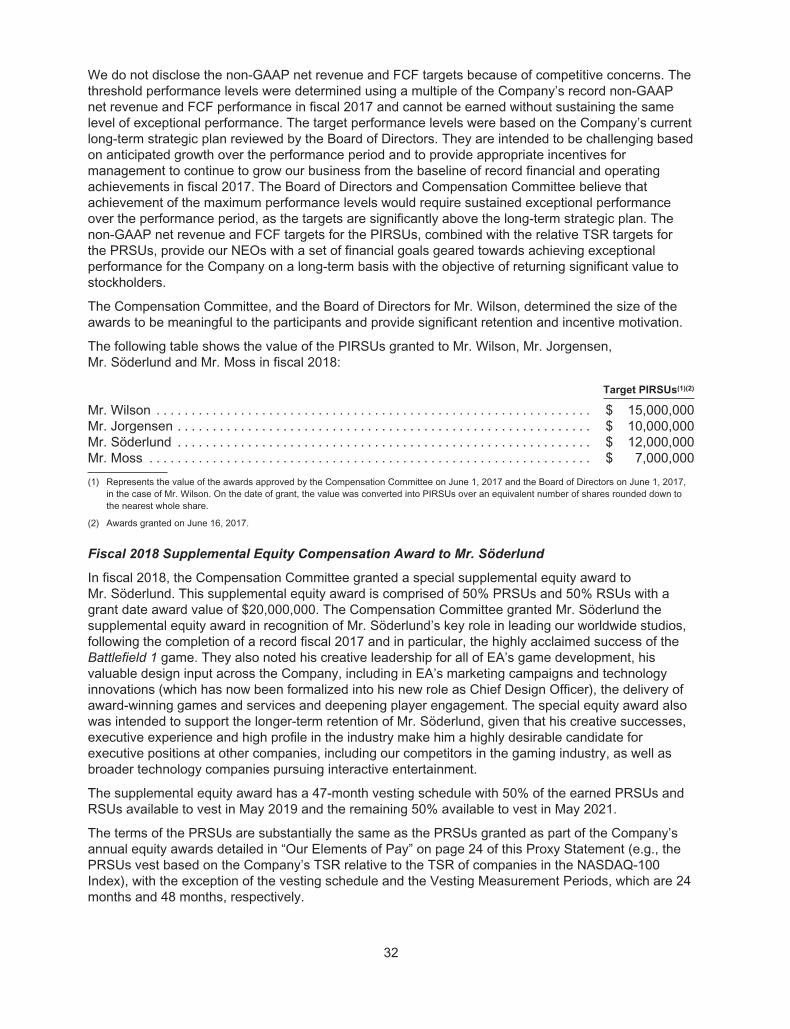
We do not disclose the non-GAAP net revenue and FCF targets because of competitive concerns. Thethreshold performance levels were determined using a multiple of the Company’s record non-GAAPnet revenue and FCF performance in fiscal 2017 and cannot be earned without sustaining the samelevel of exceptional performance. The target performance levels were based on the Company’s currentlong-term strategic plan reviewed by the Board of Directors. They are intended to be challenging basedon anticipated growth over the performance period and to provide appropriate incentives formanagement to continue to grow our business from the baseline of record financial and operatingachievements in fiscal 2017. The Board of Directors and Compensation Committee believe thatachievement of the maximum performance levels would require sustained exceptional performanceover the performance period, as the targets are significantly above the long-term strategic plan. Thenon-GAAP net revenue and FCF targets for the PIRSUs, combined with the relative TSR targets forthe PRSUs, provide our NEOs with a set of financial goals geared towards achieving exceptionalperformance for the Company on a long-term basis with the objective of returning significant value tostockholders.
The Compensation Committee, and the Board of Directors for Mr. Wilson, determined the size of theawards to be meaningful to the participants and provide significant retention and incentive motivation.
The following table shows the value of the PIRSUs granted to Mr. Wilson, Mr. Jorgensen,Mr. Söderlund and Mr. Moss in fiscal 2018:
Target PIRSUs(1)(2)
Mr. Wilson . . . . . . . . . . . . . . . . . . . . . . . . . . . . . . . . . . . . . . . . . . . . . . . . . . . . . . . . . . . . . . $ 15,000,000Mr. Jorgensen . . . . . . . . . . . . . . . . . . . . . . . . . . . . . . . . . . . . . . . . . . . . . . . . . . . . . . . . . . . $ 10,000,000Mr. Söderlund . . . . . . . . . . . . . . . . . . . . . . . . . . . . . . . . . . . . . . . . . . . . . . . . . . . . . . . . . . . $ 12,000,000Mr. Moss . . . . . . . . . . . . . . . . . . . . . . . . . . . . . . . . . . . . . . . . . . . . . . . . . . . . . . . . . . . . . . . $ 7,000,000
(1) Represents the value of the awards approved by the Compensation Committee on June 1, 2017 and the Board of Directors on June 1, 2017,in the case of Mr. Wilson. On the date of grant, the value was converted into PIRSUs over an equivalent number of shares rounded down tothe nearest whole share.
(2) Awards granted on June 16, 2017.
Fiscal 2018 Supplemental Equity Compensation Award to Mr. Söderlund
In fiscal 2018, the Compensation Committee granted a special supplemental equity award toMr. Söderlund. This supplemental equity award is comprised of 50% PRSUs and 50% RSUs with agrant date award value of $20,000,000. The Compensation Committee granted Mr. Söderlund thesupplemental equity award in recognition of Mr. Söderlund’s key role in leading our worldwide studios,following the completion of a record fiscal 2017 and in particular, the highly acclaimed success of theBattlefield 1 game. They also noted his creative leadership for all of EA’s game development, hisvaluable design input across the Company, including in EA’s marketing campaigns and technologyinnovations (which has now been formalized into his new role as Chief Design Officer), the delivery ofaward-winning games and services and deepening player engagement. The special equity award alsowas intended to support the longer-term retention of Mr. Söderlund, given that his creative successes,executive experience and high profile in the industry make him a highly desirable candidate forexecutive positions at other companies, including our competitors in the gaming industry, as well asbroader technology companies pursuing interactive entertainment.
The supplemental equity award has a 47-month vesting schedule with 50% of the earned PRSUs andRSUs available to vest in May 2019 and the remaining 50% available to vest in May 2021.
The terms of the PRSUs are substantially the same as the PRSUs granted as part of the Company’sannual equity awards detailed in “Our Elements of Pay” on page 24 of this Proxy Statement (e.g., thePRSUs vest based on the Company’s TSR relative to the TSR of companies in the NASDAQ-100Index), with the exception of the vesting schedule and the Vesting Measurement Periods, which are 24months and 48 months, respectively.
32

Pro
xyS
tatemen
t
The terms of the RSUs are substantially the same as the terms of the annual equity award RSUs, asdetailed in “Our Elements of Pay” on page 24 of this Proxy Statement with the exception of the vestingschedule.
The Compensation Committee determined the size of the award to be meaningful relative to the size ofMr. Söderlund’s annual equity grants to provide significant retention and incentive motivation.
The following table shows the value of the supplemental equity awards granted to Mr. Söderlund infiscal 2018:
TargetSupplemental
PRSUs(1)(2)Supplemental
RSUs(1)(2)
Mr. Söderlund . . . . . . . . . . . . . . . . . . . . . . . . . . . . . . . . . . . . . . . . . . . . . $ 10,000,000 $ 10,000,000
(1) Represents the value of the awards approved by the Compensation Committee on June 1, 2017. On the date of grant, the value wasconverted into PRSUs and RSUs over an equivalent number of shares rounded down to the nearest whole share.
(2) Awards granted on June 16, 2017.
OTHER COMPENSATION INFORMATION
Benefits and Retirement Plans
We provide a wide array of significant employee benefit programs to all of our regular, full-timeemployees, including our NEOs, including medical, dental, prescription drug, vision care, disabilityinsurance, life insurance, accidental death and dismemberment (“AD&D”) insurance, a flexiblespending plan, business travel accident insurance, an educational reimbursement program, anadoption assistance program, an employee assistance program, an employee stock purchase plan,paid time off, and relocation assistance.
We offer retirement plans to our employees based upon country of employment. In the United States,our employees, including our U.S.-based NEOs, are eligible to participate in a tax-qualified section401(k) plan, with a Company discretionary matching contribution of up to 6% of eligible compensation.The amount of the total matching contribution is determined based on the Company’s fiscal yearperformance. We also maintain a nonqualified deferred compensation plan in which executive-levelemployees, including our NEOs and our directors, are eligible to participate. None of our NEOsparticipated in the deferred compensation plan during fiscal 2018. In Sweden, where Mr. Söderlundresides, the Company contributes to supplementary ITP occupational pension plans (the “ITP Plans”)for eligible employees, which provide retirement, life insurance and disability benefits. Eligibleemployees above certain income thresholds also may elect to participate in an alternative ITP Plan.The ITP Plans are offered pursuant to the terms of a collective agreement between the Confederationof Swedish Enterprise and the Council for Negotiation and Cooperation.
Perquisites and Other Personal Benefits
While our NEOs generally receive the same benefits that are available to our other regular, full-timeemployees, they also receive certain additional benefits, including access to a Company-paid physicalexamination program, and greater maximum benefit levels for life insurance, AD&D and long-termdisability coverage. We consider these benefits to be standard components of a competitive executivecompensation package. Our officers with a ranking of vice president and above and certain worldwidestudio organization employees also are eligible to participate in the EA Executive and StudioLeadership Digital Game Benefit program. Company reimbursed air and ground transportationgenerally is limited to business travel. Pursuant to his employment agreement, Mr. Söderlund wasprovided with the use of a company car through December 31, 2017.
Change in Control Arrangements and Severance
Our executive officers with a ranking of senior vice presidents and above, including our NEOs, areeligible to participate in the Electronic Arts Inc. Change in Control Plan (the “CiC Plan”), which is a
33
“double-trigger” change in control plan that provides our executive officers with payments and benefitsif their employment is terminated in connection with a change in control. For more information on theCiC Plan, please refer to the information included under the heading “Potential Payments UponTermination or Change in Control” beginning on page 44 of this Proxy Statement.
We also maintain an ERISA-regulated severance plan (the “Severance Plan”) that applies generally toall our U.S.-based employees. Under the Severance Plan, eligible employees may receive a cashseverance payment and premiums for continued health benefits, if such benefits are continuedpursuant to COBRA. Any severance arrangements with our NEOs, whether paid pursuant to theSeverance Plan or otherwise, require the prior approval of the Compensation Committee. In the eventof a change in control of the Company, the cash severance payment payable under the SeverancePlan may be reduced, in whole or in part, by any amount paid under the CiC Plan.
Stock Ownership Holding Requirements
We maintain stock ownership holding requirements for our Section 16 officers. Our Section 16 officerswho hold the title of senior vice president must maintain stock ownership equal to at least 1x their basesalary. The stock ownership multiple increases to 2x base salary for Section 16 officers, who areexecutive vice presidents and 5x base salary for our CEO. We test the stock ownership holdingrequirement on an annual basis, and any Section 16 officer not in compliance with these guidelinesmust hold 50% of any net after-tax shares vesting from equity awards until the applicable requirementis met.
As of March 31, 2018, each of our executive officers, either had met his or her then-applicable stockownership holding requirement or had not yet reached the date on which he or she must to meet his orher ownership requirement, which is generally 50 months from the date of hire or appointment.
Insider Trading, Anti-Hedging and Anti-Pledging Policies
We maintain an insider trading policy designed to promote compliance by our employees and directorswith both federal and state insider trading laws. In addition, our insider trading policy prohibits ourdirectors, executive officers and other employees from engaging in any hedging transaction or shortsale of our stock or trading in any derivatives of our stock. Our directors and Section 16 officers alsoare prohibited from pledging our stock as collateral for any loan.
Compensation Recovery (Clawbacks)
Our equity award agreements contain a provision providing that if an employee engages in fraud orother misconduct that contributes to an obligation to restate the Company’s financial statements, theCompensation Committee may terminate the equity award and recapture any equity award proceedsreceived by the employee within the 12-month period following the public issuance or filing of thefinancial statements required to be restated.
Risk Considerations
The Compensation Committee considers, in establishing and reviewing our compensation program,whether the program encourages unnecessary or excessive risk taking and has concluded that it doesnot. See the section of this Proxy Statement entitled “Oversight of Risk Issues” above for an additionaldiscussion of risk considerations.
34

Pro
xyS
tatemen
t
COMPENSATION COMMITTEE REPORT ON EXECUTIVE COMPENSATION
The following Compensation Committee Report on Executive Compensation shall not be deemed to be“soliciting material” or to be “filed” with the SEC, nor shall this information be incorporated by referenceinto any future filing under the Securities Act or the Exchange Act except to the extent that EAspecifically incorporates it by reference into a filing.
The Compensation Committee has reviewed and discussed with management the CompensationDiscussion and Analysis. Based on its review and discussions with management, the CompensationCommittee recommended to the Board of Directors that the Compensation Discussion and Analysis beincluded in this Proxy Statement.
COMPENSATION COMMITTEE MEMBERS
Jay C. Hoag (Chair)
Leonard S. Coleman
Talbott Roche
35

EXECUTIVE COMPENSATIONFISCAL 2018 SUMMARY COMPENSATION TABLE
The following table shows information concerning the compensation earned by or awarded to our ChiefExecutive Officer, our Chief Financial Officer and our next three most highly compensated executiveofficers for fiscal 2018, fiscal 2017 and where applicable fiscal 2016. For purposes of the compensationtables that follow, we refer to these individuals collectively as the “Named Executive Officers” or“NEOs.”
Name and Principal Position for Fiscal 2018(1)FiscalYear
Salary($)
StockAwards
($)(2)
Non-EquityIncentive PlanCompensation
($)(3)
All OtherCompensation
($)(4)Total
($)
Andrew Wilson . . . . . . . . . . . . . . . . . . . . . . . . . . 2018 1,141,731 32,025,759(5) 2,500,000 61,274 35,728,764Chief Executive Officer 2017 1,083,846 16,150,342 2,690,860 47,670 19,972,718
2016 1,019,231 13,617,852 2,076,653 16,971 16,730,707
Blake Jorgensen . . . . . . . . . . . . . . . . . . . . . . . . 2018 794,211 17,377,775(6) 1,100,000 14,055 19,286,041Executive Vice President, 2017 762,981 7,498,342 1,100,000 17,427 9,378,750Chief Financial Officer 2016 756,538 6,808,926 1,100,000 17,287 8,682,751
Patrick Söderlund(7) . . . . . . . . . . . . . . . . . . . . . . 2018 821,539 46,253,078(8) 1,212,319 98,901 48,385,837Executive Vice President, 2017 611,291 9,805,485 1,094,161 84,720 11,595,657EA Worldwide Studios 2016 588,702 9,078,520 1,085,526 108,118 10,860,866
Kenneth Moss . . . . . . . . . . . . . . . . . . . . . . . . . . 2018 645,865 13,242,574(9) 630,000 14,327 14,532,766Executive Vice President, 2017 619,104 5,767,942 615,000 17,738 7,019,784Chief Technology Officer 2016 603,731 3,971,790 615,000 152,767 5,343,288
Chris Bruzzo . . . . . . . . . . . . . . . . . . . . . . . . . . . . 2018 620,865 4,539,994(10) 530,000 22,433 5,713,292Chief Marketing Officer 2017 596,365 4,614,285 500,000 17,427 5,728,077
(1) As discussed in the “Compensation Discussion and Analysis” above, EA announced changes to certain of its NEOs’ roles on April 12, 2018.Blake Jorgensen serves as the Company’s Chief Operating Officer in addition to his role as EA’s Chief Financial Officer; Patrick Söderlundtransitioned to the newly established Company-wide leadership role of Chief Design Officer; and Chris Bruzzo leads the Company’s integratedmarketing, publishing and analytics organization.
(2) Represents the aggregate grant date fair value of RSUs, PRSUs, and, with respect to fiscal 2018, PIRSUs. Grant date fair value is determinedfor financial statement reporting purposes in accordance with FASB ASC Topic 718 and the amounts shown may not reflect the actual valuerealized by the recipient. For RSUs and PIRSUs, grant date fair value is calculated using the closing price of our common stock on the grantdate with the PIRSUs being valued at target. For PRSUs, the grant date fair value is determined using a Monte-Carlo simulation model. Foradditional information regarding the valuation methodology for RSUs, PRSUs and PIRSUs, see Note 14, “Stock-Based Compensation andEmployee Benefit Plans,” to the Consolidated Financial Statements in our Annual Report on Form 10-K filed with the Securities and ExchangeCommission on May 23, 2018 (the “Annual Report”). The PRSUs granted to our NEOs in fiscal 2018 are referred to as “Market-BasedRestricted Stock Units” and the PIRSUs granted to our NEOs in fiscal 2018 are referred to as “Performance-Based Restricted Stock Units” inNote 14 “Stock-Based Compensation and Employee Benefit Plans.” For additional information regarding the specific terms of the RSUs,PRSUs and PIRSUs granted to our NEOs in fiscal 2018, see the “Fiscal 2018 Grants of Plan-Based Awards Table” below.
(3) Represents amounts awarded under the Executive Bonus Plan to Messrs. Wilson, Jorgensen, Moss and Bruzzo and amounts awarded toMr. Söderlund under the EA Bonus Plan. For additional information about the bonuses paid to our NEOs in fiscal 2018, see “Our NEOs’ Fiscal2018 Compensation” under the heading “Fiscal 2018 Performance Cash Bonus Awards” in the “Compensation Discussion and Analysis”above.
36

Pro
xyS
tatemen
t
(4)
All Other Compensation Table
NameFiscalYear
InsurancePremiums
($)(A)
RetirementBenefits
($)(B)Other
($)Tax Gross-Up
($)Total
($)
Andrew Wilson . . . . . . . . . . . . . . . . 2018 928 12,150 36,105(C) 12,091(D) 61,2742017 928 15,900 30,099 793 47,7202016 1,071 15,900 — — 16,971
Blake Jorgensen . . . . . . . . . . . . . . 2018 928 12,150 — 977(E) 14,0552017 928 15,900 — 599 17,4272016 1,071 15,900 — 316 17,287
Patrick Söderlund . . . . . . . . . . . . . . 2018 936 61,169 35,992(F) 804(G) 98,9012017 768 56,448 27,476 28 84,7202016 783 55,957 51,378 — 108,118
Kenneth Moss . . . . . . . . . . . . . . . . 2018 928 12,150 — 1,249(H) 14,3272017 928 15,900 — 910 17,7382016 1,071 15,900 98,002 37,794 152,767
Chris Bruzzo . . . . . . . . . . . . . . . . . . 2018 928 12,150 — 9,355(I) 22,4332017 928 15,900 — 599 17,427
(A) Amounts shown represent premiums paid on behalf of our NEOs under Company sponsored group life insurance, AD&D and disabilityprograms.
(B) Amounts shown for Messrs. Wilson, Jorgensen and Moss reflect Company-matching 401(k) contributions for fiscal years 2018, 2017 and2016, paid during each subsequent fiscal year. The amount shown for Mr. Söderlund reflects Company contributions during fiscal 2018,2017 and 2016 to a Swedish ITP2 occupational pension plan, which includes a defined contribution component, as well as life anddisability coverage, and an alternative ITP plan.
(C) Amounts shown represent membership dues for executive leadership organizations ($35,025) and the leadership digital game codebenefit under the EA Executive and Studio Leadership Digital Game Benefit program.
(D) Represents the aggregate value of taxes paid on behalf of Mr. Wilson resulting from Company paid executive leadership organizationmembership fees, the leadership digital game code benefit and video game merchandise from the Company store.
(E) Represents the aggregate value of taxes paid on behalf of Mr. Jorgensen for the leadership digital game benefit.
(F) Amounts shown represent car payments, paid time off, expired time off, leadership digital game code benefit, console reimbursementsand incidental expenses paid on behalf of Mr. Söderlund.
(G) Represents the aggregate value of taxes paid on behalf of Mr. Söderlund for costs incurred in connection with his executive physical, theleadership digital game code benefit and business meals.
(H) Represents the aggregate value of taxes paid on behalf of Mr. Moss for digital game reimbursement, the leadership digital game codebenefit and video game merchandise from Company store.
(I) Represents the aggregate value of taxes paid on behalf of Mr. Bruzzo for the leadership digital game code benefit, video gamemerchandise from the Company store and costs incurred in connection with attending the Super Bowl with business partners.
(5) Represents the aggregate grant date fair value of 67,867 RSUs granted to Mr. Wilson in fiscal 2018 of $7,499,982, the target payout of 67,867PRSUs granted to Mr. Wilson in fiscal 2018 of $9,525,812 and the target payout of 135,734 PIRSUs granted to Mr. Wilson in fiscal 2018 of$14,999,964. The actual vesting of the PRSUs and PIRSUs will be between zero and 200% of the target number of PRSUs and PIRSUs,respectively. The value of the PRSUs on the date of grant assuming the highest level of performance conditions will be achieved is$14,999,964, which is based on the maximum vesting of 135,734 PRSUs multiplied by the closing price of our common stock on the date ofgrant of $110.51. The value of the PIRSUs on the date of grant assuming the highest level of performance conditions will be achieved is$29,999,929, which is based on the maximum vesting of 271,468 PIRSUs multiplied by the closing price of our common stock on the date ofgrant of $110.51.
(6) Represents the aggregate grant date fair value of 29,409 RSUs granted to Mr. Jorgensen in fiscal 2018 of $3,249,989, the target payout of29,409 PRSUs granted to Mr. Jorgensen in fiscal 2018 of $4,127,847 and the target payout of 90,489 PIRSUs granted to Mr. Jorgensen infiscal 2018 of $9,999,939. The actual vesting of the PRSUs and PIRSUs will be between zero and 200% of the target number of PRSUs andPIRSUs, respectively. The value of the PRSUs on the date of grant assuming the highest level of performance conditions will be achieved is$6,499,977, which is based on the maximum vesting of 58,818 PRSUs multiplied by the closing price of our common stock on the date ofgrant of $110.51. The value of the PIRSUs on the date of grant assuming the highest level of performance conditions will be achieved is$19,999,879, which is based on the maximum vesting of 180,978 PIRSUs multiplied by the closing price of our common stock on the date ofgrant of $110.51.
(7) Mr. Söderlund is based in Stockholm, Sweden and was paid in Swedish krona. The amounts reported as salary and all other compensation forMr. Söderlund in fiscal 2016, fiscal 2017 and fiscal 2018 were derived from an average of the Swedish krona to U.S. dollar exchange rates onthe last day of each month during fiscal 2016, fiscal 2017 and fiscal 2018, respectively. The amount reported as non-equity incentive plancompensation for Mr. Söderlund in fiscal 2018 is based on the Swedish krona to U.S. dollar exchange rate as of May 23, 2018 of 0.113856.
(8) Represents the aggregate grant date fair value of equity awards granted to Mr. Söderlund in fiscal 2018, including supplemental RSUs andsupplemental PRSUs. This includes 135,733 RSUs granted to Mr. Söderlund in fiscal 2018 of $14,999,854, the target payout of 135,733PRSUs granted to Mr. Söderlund in fiscal 2018 of $19,253,275 and the target payout of 108,587 PIRSUs granted to Mr. Söderlund in fiscal
37

2018 of $11,999,949. The actual vesting of the PRSUs and PIRSUs will be between zero and 200% of the target number of PRSUs andPIRSUs, respectively. The value of the PRSUs on the date of grant assuming the highest level of performance conditions will be achieved is$29,999,708, which is based on the maximum vesting of 271,466 PRSUs multiplied by the closing price of our common stock on the date ofgrant of $110.51. The value of the PIRSUs on the date of grant assuming the highest level of performance conditions will be achieved is$23,999,899, which is based on the maximum vesting of 217,174 PIRSUs multiplied by the closing price of our common stock on the date ofgrant of $110.51.
(9) Represents the aggregate grant date fair value of 24,884 RSUs granted to Mr. Moss in fiscal 2018 of $2,749,931, the target payout of 24,884PRSUs granted to Mr. Moss in fiscal 2018 of $3,492,718 and the target payout of 63,342 PIRSUs granted to Mr. Moss in fiscal 2018 of$6,999,924. The actual vesting of the PRSUs and PIRSUs will be between zero and 200% of the target number of PRSUs and PIRSUs,respectively. The value of the PRSUs on the date of grant assuming the highest level of performance conditions will be achieved is$5,499,862, which is based on the maximum vesting of 49,768 PRSUs multiplied by the closing price of our common stock on the date ofgrant of $110.51. The value of the PIRSUs on the date of grant assuming the highest level of performance conditions will be achieved is$13,999,849, which is based on the maximum vesting of 126,684 PIRSUs multiplied by the closing price of our common stock on the date ofgrant of $110.51.
(10) Represents the aggregate grant date fair value of 18,097 RSUs granted to Mr. Bruzzo in fiscal 2018 of $1,999,899 and the target payout of18,097 PRSUs granted to Mr. Bruzzo in fiscal 2018 of $2,540,095. The actual vesting of the PRSUs will be between zero and 200% of thetarget number of PRSUs. The value of the PRSUs on the date of grant assuming the highest level of performance conditions will be achievedis $3,999,799, which is based on the maximum vesting of 36,194 PRSUs multiplied by the closing price of our common stock on the date ofgrant of $110.51.
38

Pro
xyS
tatemen
t
FISCAL 2018 GRANTS OF PLAN-BASED AWARDS TABLE
The following table shows information regarding non-equity incentive and equity plan-based awardsgranted to our NEOs during fiscal 2018.
NameGrantDate
ApprovalDate(1)
Estimated FuturePayouts Under
Non-EquityIncentive Plan
Awards(2)
Estimated FuturePayouts Under
Equity IncentivePlan Awards(3)
AllOtherStock
Awards:Number
ofShares
of Stockor Units
(#)(4)
GrantDate FairValue of
StockAwards
($)(5)Target
($)Maximum
($)Threshold
($)Target
($)Maximum
($)
Andrew Wilson . . . . . . . . . . .Annual Bonus Opportunity — — 1,997,917 5,000,000 — — — — —PRSUs 6/16/2017 5/18/2017 — — — 67,867 135,734 — 9,525,812PIRSUs 6/16/2017 6/1/2017 — — 67,867 135,734 271,468 — 14,999,964RSUs 6/16/2017 5/18/2017 — — — — — 67,867(6) 7,499,982
Blake Jorgensen . . . . . . . . . .Annual Bonus Opportunity — — 794,167 2,382,501 — — — — —PRSUs 6/16/2017 5/17/2017 — — — 29,409 58,818 — 4,127,847PIRSUs 6/16/2017 6/1/2017 — — 45,244 90,489 180,978 — 9,999,939RSUs 6/16/2017 5/17/2017 — — — — — 29,409(6) 3,249,989
Patrick Söderlund . . . . . . . . .Annual Bonus Opportunity — — 1,178,788 3,536,364 — — — — —PRSUs 6/16/2017 5/17/2017 — — — 45,244 90,488 — 6,350,448Supplemental PRSUs(7) 6/16/2017 6/1/2017 — — — 90,489 180,978 — 12,902,827PIRSUs 6/16/2017 6/1/2017 — — 54,293 108,587 217,174 — 11,999,949RSUs 6/16/2017 5/17/2017 — — — — — 45,244(6) 4,999,914Supplemental RSUs 6/16/2017 6/1/2017 — — — — — 90,489(8) 9,999,939
Kenneth Moss . . . . . . . . . . . .Annual Bonus Opportunity — — 484,375 1,453,125 — — — — —PRSUs 6/16/2017 5/17/2017 — — — 24,884 49,768 — 3,492,718PIRSUs 6/16/2017 6/1/2017 — — 31,671 63,342 126,684 — 6,999,924RSUs 6/16/2017 5/17/2017 — — — — — 24,884(6) 2,749,931
Chris Bruzzo . . . . . . . . . . . . .Annual Bonus Opportunity — — 465,625 1,396,875 — — — — —PRSUs 6/16/2017 5/17/2017 — — — 18,097 36,194 — 2,540,095RSUs 6/16/2017 5/17/2017 — — — — — 18,097(6) 1,999,899
(1) Each grant was approved on the approval date indicated above by our Compensation Committee or the Board of Directors, in the case of ourCEO, for grant on the specific grant date indicated above.
(2) The amounts shown represent the target and maximum amount of cash bonus plan awards provided for under the Executive Bonus Plan forall NEOs other than Mr. Söderlund who participated in the EA Bonus Plan. The target amounts are pre-established as a percentage of salaryand the maximum amounts represent the greatest payout that could be made under the Executive Bonus Plan or the EA Bonus Plan, asapplicable. For Mr. Söderlund, the target cash bonus amounts were converted to U.S. dollars derived from an average of the Swedish krona toU.S. dollar exchange rates on the last day of each month during fiscal 2018. For more information regarding the bonuses paid to our NEOs infiscal 2018 and an explanation of the amount of salary and bonus in proportion to total compensation, see the sections titled “Our NEOs’ Fiscal2018 Compensation” and “Our Elements of Pay” in the “Compensation Discussion and Analysis” above.
(3) Represents awards of PRSUs and PIRSUs granted to our NEOs. Other than Mr. Söderlund’s supplemental PRSUs (which are described infootnote 7), the PRSUs vest over a full three-year period. The number of PRSUs that vest is adjusted based on EA’s Relative NASDAQ-100TSR Percentile measured over 12-month, 24-month cumulative and 36-month cumulative periods. Earned PIRSUs will cliff vest on May 26,2021 based on the interpolated growth in the Company’s non-GAAP net revenue and FCF performance targets over a full four-yearperformance period. For additional information regarding the specific terms of the PRSUs and PIRSUs granted to our NEOs in fiscal 2018, seethe discussion in the “Compensation Discussion and Analysis” above. Upon vesting, each earned PRSU or PIRSU automatically converts intoone share of EA common stock and does not have an exercise price or expiration date. The PRSUs and PIRSUs are not entitled to receivedividends, if any, paid by EA on its common stock.
(4) Represents awards of RSUs granted to our NEOs. Upon vesting, each RSU automatically converts into one share of EA common stock. RSUsare granted for no consideration and do not expire. The RSUs do not have voting rights and are not entitled to receive dividends, if any, paidby EA on its common stock.
(5) For grants of RSUs and PIRSUs, represents the aggregate grant date fair value of RSUs and PIRSUs calculated using the closing price of ourcommon stock on the date of grant. For grants of PRSUs (including Mr. Söderlund’s supplemental PRSUs), represents the aggregate grant
39

date fair value of the award using the Monte-Carlo simulation method assuming target payout. For a more detailed discussion of the valuationmethodology and assumptions used to calculate fair value, see Note 14 “Stock-Based Compensation and Employee Benefit Plans,” of theConsolidated Financial Statements in our Annual Report.
(6) RSUs vested as to one-third of the units on May 16, 2018 and will vest as to one-third of the units on each of May 16, 2019 and May 16, 2020.
(7) Represents awards of supplemental PRSUs granted Mr. Söderlund. The PRSUs vest over a four-year period. The number of supplementalPRSUs that vest is adjusted based on EA’s Relative NASDAQ-100 TSR Percentile measured over 24-month and 48-month cumulativeperiods. Upon vesting, each earned supplemental PRSU automatically converts into one share of EA common stock and does not have anexercise price or expiration date. The supplemental PRSUs are not entitled to receive dividends, if any, paid by EA on its common stock.
(8) Supplemental RSUs granted to Mr. Söderlund will vest as to one half of the units on each of May 16, 2019 and May 16, 2021.
40
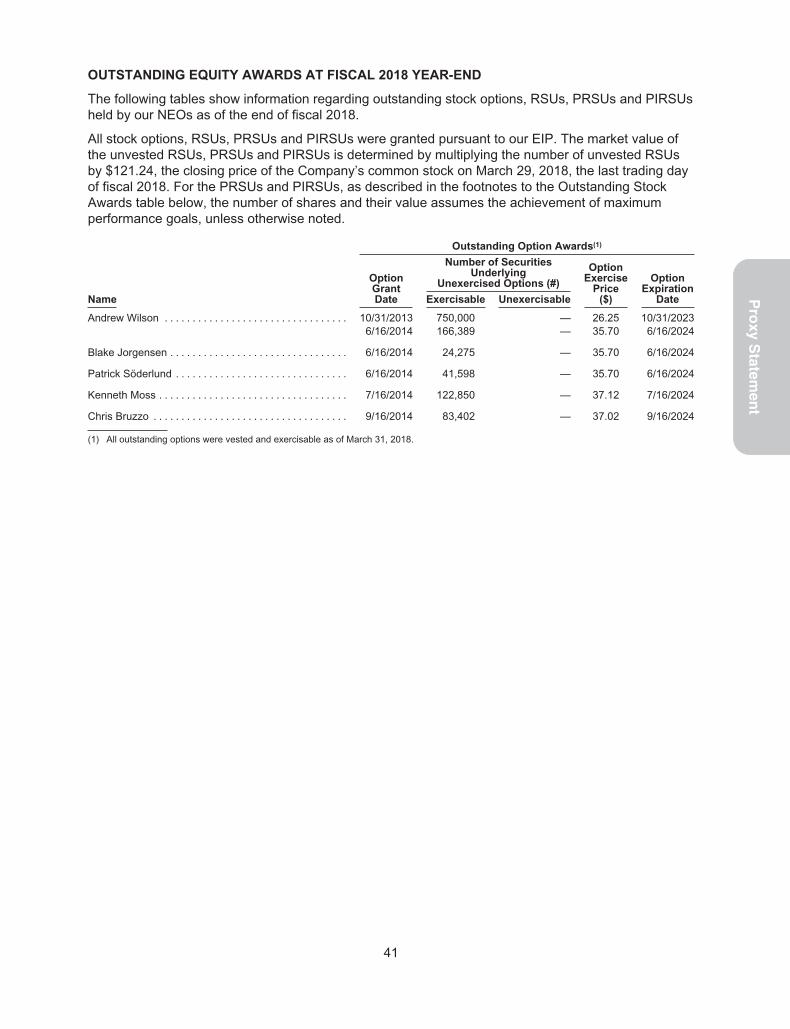
Pro
xyS
tatemen
t
OUTSTANDING EQUITY AWARDS AT FISCAL 2018 YEAR-END
The following tables show information regarding outstanding stock options, RSUs, PRSUs and PIRSUsheld by our NEOs as of the end of fiscal 2018.
All stock options, RSUs, PRSUs and PIRSUs were granted pursuant to our EIP. The market value ofthe unvested RSUs, PRSUs and PIRSUs is determined by multiplying the number of unvested RSUsby $121.24, the closing price of the Company’s common stock on March 29, 2018, the last trading dayof fiscal 2018. For the PRSUs and PIRSUs, as described in the footnotes to the Outstanding StockAwards table below, the number of shares and their value assumes the achievement of maximumperformance goals, unless otherwise noted.
Outstanding Option Awards(1)
OptionGrantDate
Number of SecuritiesUnderlying
Unexercised Options (#)
OptionExercise
Price($)
OptionExpiration
DateName Exercisable Unexercisable
Andrew Wilson . . . . . . . . . . . . . . . . . . . . . . . . . . . . . . . . . 10/31/2013 750,000 — 26.25 10/31/20236/16/2014 166,389 — 35.70 6/16/2024
Blake Jorgensen . . . . . . . . . . . . . . . . . . . . . . . . . . . . . . . . 6/16/2014 24,275 — 35.70 6/16/2024
Patrick Söderlund . . . . . . . . . . . . . . . . . . . . . . . . . . . . . . . 6/16/2014 41,598 — 35.70 6/16/2024
Kenneth Moss . . . . . . . . . . . . . . . . . . . . . . . . . . . . . . . . . . 7/16/2014 122,850 — 37.12 7/16/2024
Chris Bruzzo . . . . . . . . . . . . . . . . . . . . . . . . . . . . . . . . . . . 9/16/2014 83,402 — 37.02 9/16/2024
(1) All outstanding options were vested and exercisable as of March 31, 2018.
41

Outstanding Stock Awards
Time-Based VestingAwards
Performance-Based VestingAwards
NameGrantDate
Number ofShares orUnits ofStock
That HaveNot
Vested(#)
MarketValue of
Shares orUnits ofStock
That HaveNot
Vested($)
EquityIncentive
Plan Awards:Number ofUnearned
Shares, Unitsor Other
Rights ThatHave NotVested
(#)
EquityIncentive
Plan Awards:Market or
Payout Valueof Unearned
Shares,Units or
Other RightsThat HaveNot Vested
($)
Andrew Wilson . . . . . . . . . . . . . . . . . . . . . . . . . . . . . . . . 6/16/2015 — — 63,634(1) 7,714,9866/16/2016 — — 124,444(1) 15,087,5916/16/2017 — — 67,867(1) 8,228,1956/16/2017 — — 271,468(2) 32,912,7806/16/2015 31,817(4) 3,857,493 — —6/16/2016 62,222(4) 7,543,795 — —6/16/2017 67,867(4) 8,228,195 — —
Blake Jorgensen . . . . . . . . . . . . . . . . . . . . . . . . . . . . . . 6/16/2015 — — 31,817(1) 3,857,4936/16/2016 — — 57,778(1) 7,005,0056/16/2017 — — 29,409(1) 3,565,5476/16/2017 — — 180,978(2) 21,941,7736/16/2015 15,909(4) 1,928,807 — —6/16/2016 28,889(4) 3,502,502 — —6/16/2017 29,409(4) 3,565,547 — —
Patrick Söderlund . . . . . . . . . . . . . . . . . . . . . . . . . . . . . 6/16/2015 — — 42,422(1) 5,143,2436/16/2016 — — 75,556(1) 9,160,4096/16/2017 — — 45,244(1) 5,485,3836/16/2017 — — 180,978(3) 21,941,7736/16/2017 — — 217,174(2) 26,330,1766/16/2015 21,211(4) 2,571,622 — —6/16/2016 37,778(4) 4,580,205 — —6/16/2017 45,244(4) 5,485,383 — —6/16/2017 90,489(5) 10,970,886 — —
Kenneth Moss . . . . . . . . . . . . . . . . . . . . . . . . . . . . . . . . 6/16/2015 — — 18,560(1) 2,250,2146/16/2016 — — 44,444(1) 5,388,3916/16/2017 — — 24,884(1) 3,016,9366/16/2017 — — 126,684(2) 15,359,1686/16/2015 9,280(4) 1,125,107 — —6/16/2016 22,222(4) 2,694,195 — —6/16/2017 24,884(4) 3,016,936 — —
Chris Bruzzo . . . . . . . . . . . . . . . . . . . . . . . . . . . . . . . . . . 6/16/2015 — — 18,560(1) 2,250,2146/16/2016 — — 35,556(1) 4,310,8096/16/2017 — — 18,097(1) 2,194,0806/16/2015 9,280(4) 1,125,107 — —6/16/2016 17,778(4) 2,155,405 — —6/16/2017 18,097(4) 2,194,080 — —
(1) Represents PRSUs at the maximum achievement level of 200% of target for the June 2015 and June 2016 grants and the target level of 100%for the June 2017 PRSU grants. Earned PRSUs vested or will vest as to one-third of the earned units one month prior to each of the first threeanniversaries of the grant date. The number of PRSUs that vest is based on EA’s Relative NASDAQ-100 TSR Percentile. For additionalinformation regarding the specific terms of the PRSUs granted to our NEOs, see the discussion of “PRSUs” in the “Compensation Discussionand Analysis” above.
(2) Represents PIRSUs at the maximum achievement level of 200% of target for the June 2017 PIRSUs granted to certain of our NEOs. Thenumber of PIRSUs that vest is based on the achievement of one or both of the non-GAAP net revenue and FCF goals over the four-yearperformance period. For additional information regarding the specific terms of the PIRSUs granted to certain of our NEOs, see the discussionof “PIRSUs” in the “Compensation Discussion and Analysis” above. Any earned PIRSUs will vest in full on May 26, 2021.
(3) Represents an award of RSUs that vested or will vest as to one-third of the units one month prior to each of the first three anniversaries of thegrant date.
42

Pro
xyS
tatemen
t
(4) Represents PRSUs at the maximum achievement level of 200% for Mr. Söderlund’s supplemental June 2017 PRSU grants. Earnedsupplemental PRSUs will vest as to one-half of the earned units one month prior to each of the second and fourth anniversaries of the grantdate. The number of PRSUs that vest is based on EA’s Relative NASDAQ-100 TSR Percentile. For additional information regardingMr. Söderlund’s supplemental equity award including the supplemental PRSUs, see the discussion of “Fiscal 2018 Supplemental EquityCompensation Award to Mr. Söderlund” in the “Compensation Discussion and Analysis” above.
(5) Represents an award of RSUs that will vest as to one-half of the units one month prior to each of the second and fourth anniversaries of thegrant date.
43

FISCAL 2018 OPTION EXERCISES AND STOCK VESTED TABLE
The following table shows all stock options exercised and value realized upon exercise, as well as allRSUs and PRSUs vested and value realized upon vesting by our NEOs during fiscal 2018.
Option Awards Stock Awards
Name
Number of SharesAcquired on
Exercise(#)
Value Realizedon Exercise
($)(1)
Number of SharesAcquired on
Vesting(#)(2)
Value Realizedon Vesting
($)(3)
Andrew Wilson . . . . . . . . . . . . . . . . . . 200,000 15,280,000 219,301 24,320,481Blake Jorgensen . . . . . . . . . . . . . . . . . 12,130 649,925 102,726 11,392,313Patrick Söderlund . . . . . . . . . . . . . . . . — — 148,664 16,614,689Kenneth Moss . . . . . . . . . . . . . . . . . . . — — 73,251 8,072,081Chris Bruzzo . . . . . . . . . . . . . . . . . . . . — — 68,811 7,861,291
(1) The value realized upon the exercise of stock options is calculated by: (a) subtracting the option exercise price from the market value per shareof EA common stock on the date of exercise to determine the realized value per share, and (b) multiplying the realized value per share by thenumber of shares underlying the options exercised.
(2) Represents shares of EA common stock released upon vesting of RSUs and PRSUs during fiscal 2018.
(3) The value realized upon vesting of RSUs and PRSUs is calculated by multiplying the number of RSUs and PRSUs vested by the prior day’sclosing price of EA common stock on the vest date.
POTENTIAL PAYMENTS UPON TERMINATION OR CHANGE IN CONTROL
Termination of Employment
With the exception of Mr. Söderlund, our NEOs have not entered into employment agreements with theCompany. Mr. Söderlund’s employment agreement is filed as Exhibit 10.18 to the Company’s Form10-Q, dated August 3, 2004. Our NEOs, other than Mr. Söderlund, will have a right to any accrued paidtime off as of the date of the NEO’s termination. Pursuant to Mr. Söderlund’s employment agreement,Mr. Söderlund will have a right to any benefits, accrued paid time off and bonus payments during thetermination notice period applicable to him under Swedish law. All outstanding equity awards held byour NEOs will be forfeited upon termination unless the applicable NEOs’ employment is terminated forreasons due to death, disability or change in control.
Electronic Arts Change in Control Plan
Our NEOs participate in the Electronic Arts Inc. Change in Control Plan (the “CiC Plan”). The CiC Planis filed as Exhibit 10.4 on the Company’s Form 8-K dated May 18, 2018. The CiC Plan is a “double-trigger” plan, which provides those serving as Senior Vice Presidents and above with payments andbenefits if their employment is terminated without “cause” or if they resign for “good reason” during thethree-month period preceding or 18-month period following a change in control of the Company (andthe Compensation Committee determines the termination was made in connection with the change incontrol). The CiC Plan payments and benefits include a cash severance payment, continued healthbenefits or equivalent payments for up to 18 months (24 months for our CEO) and full vesting of alloutstanding and unvested equity awards (other than performance-based awards, the vesting of whichis described below).
The CiC Plan does not provide for any additional payments or benefits (for example, tax gross-ups orreimbursements) in the event that the payments under the CiC Plan and other arrangements offered bythe Company or its affiliates cause an executive officer to owe an excise tax under Section 280G of theCode (“Section 280G”). However, the CiC Plan provides that, if an executive officer would receive agreater net after-tax benefit by having his or her CiC Plan payments reduced to an amount that wouldavoid the imposition of the Section 280G excise tax, his or her payment will be reduced accordingly.
As a condition to our NEOs’ right to receive the payments and benefits provided under the CiC Plan,the NEO is required to execute a waiver of claims against the Company and will be bound by the terms
44
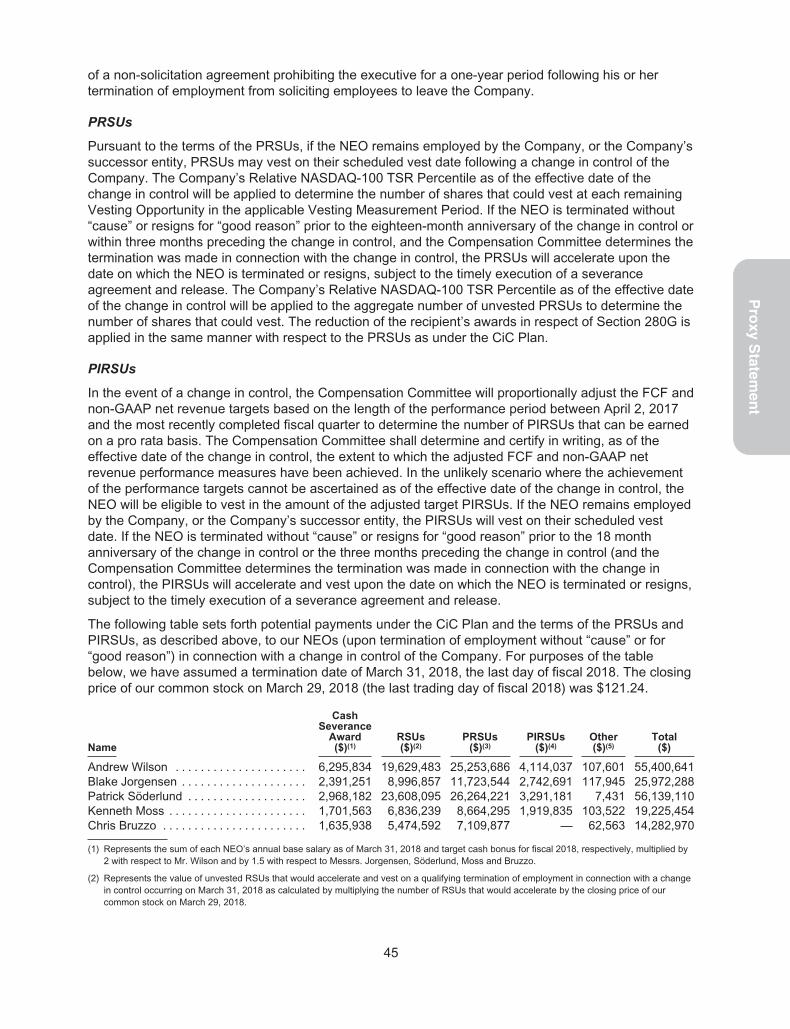
Pro
xyS
tatemen
t
of a non-solicitation agreement prohibiting the executive for a one-year period following his or hertermination of employment from soliciting employees to leave the Company.
PRSUs
Pursuant to the terms of the PRSUs, if the NEO remains employed by the Company, or the Company’ssuccessor entity, PRSUs may vest on their scheduled vest date following a change in control of theCompany. The Company’s Relative NASDAQ-100 TSR Percentile as of the effective date of thechange in control will be applied to determine the number of shares that could vest at each remainingVesting Opportunity in the applicable Vesting Measurement Period. If the NEO is terminated without“cause” or resigns for “good reason” prior to the eighteen-month anniversary of the change in control orwithin three months preceding the change in control, and the Compensation Committee determines thetermination was made in connection with the change in control, the PRSUs will accelerate upon thedate on which the NEO is terminated or resigns, subject to the timely execution of a severanceagreement and release. The Company’s Relative NASDAQ-100 TSR Percentile as of the effective dateof the change in control will be applied to the aggregate number of unvested PRSUs to determine thenumber of shares that could vest. The reduction of the recipient’s awards in respect of Section 280G isapplied in the same manner with respect to the PRSUs as under the CiC Plan.
PIRSUs
In the event of a change in control, the Compensation Committee will proportionally adjust the FCF andnon-GAAP net revenue targets based on the length of the performance period between April 2, 2017and the most recently completed fiscal quarter to determine the number of PIRSUs that can be earnedon a pro rata basis. The Compensation Committee shall determine and certify in writing, as of theeffective date of the change in control, the extent to which the adjusted FCF and non-GAAP netrevenue performance measures have been achieved. In the unlikely scenario where the achievementof the performance targets cannot be ascertained as of the effective date of the change in control, theNEO will be eligible to vest in the amount of the adjusted target PIRSUs. If the NEO remains employedby the Company, or the Company’s successor entity, the PIRSUs will vest on their scheduled vestdate. If the NEO is terminated without “cause” or resigns for “good reason” prior to the 18 monthanniversary of the change in control or the three months preceding the change in control (and theCompensation Committee determines the termination was made in connection with the change incontrol), the PIRSUs will accelerate and vest upon the date on which the NEO is terminated or resigns,subject to the timely execution of a severance agreement and release.
The following table sets forth potential payments under the CiC Plan and the terms of the PRSUs andPIRSUs, as described above, to our NEOs (upon termination of employment without “cause” or for“good reason”) in connection with a change in control of the Company. For purposes of the tablebelow, we have assumed a termination date of March 31, 2018, the last day of fiscal 2018. The closingprice of our common stock on March 29, 2018 (the last trading day of fiscal 2018) was $121.24.
Name
CashSeverance
Award($)(1)
RSUs($)(2)
PRSUs($)(3)
PIRSUs($)(4)
Other($)(5)
Total($)
Andrew Wilson . . . . . . . . . . . . . . . . . . . . . 6,295,834 19,629,483 25,253,686 4,114,037 107,601 55,400,641Blake Jorgensen . . . . . . . . . . . . . . . . . . . . 2,391,251 8,996,857 11,723,544 2,742,691 117,945 25,972,288Patrick Söderlund . . . . . . . . . . . . . . . . . . . 2,968,182 23,608,095 26,264,221 3,291,181 7,431 56,139,110Kenneth Moss . . . . . . . . . . . . . . . . . . . . . . 1,701,563 6,836,239 8,664,295 1,919,835 103,522 19,225,454Chris Bruzzo . . . . . . . . . . . . . . . . . . . . . . . 1,635,938 5,474,592 7,109,877 — 62,563 14,282,970
(1) Represents the sum of each NEO’s annual base salary as of March 31, 2018 and target cash bonus for fiscal 2018, respectively, multiplied by2 with respect to Mr. Wilson and by 1.5 with respect to Messrs. Jorgensen, Söderlund, Moss and Bruzzo.
(2) Represents the value of unvested RSUs that would accelerate and vest on a qualifying termination of employment in connection with a changein control occurring on March 31, 2018 as calculated by multiplying the number of RSUs that would accelerate by the closing price of ourcommon stock on March 29, 2018.
45

(3) Represents the value of unvested PRSUs that would accelerate and vest on a qualifying termination of employment in connection with achange in control occurring on March 31, 2018. For purposes of the table, we have used EA’s Relative NASDAQ-100 TSR Percentiles as ofMarch 31, 2018, which was in the 83rd percentile with respect to PRSUs granted in June 2015, the 76th percentile with respect to PRSUsgranted in June 2016 and the 56th percentile with respect to PRSUs granted in June 2017. Based on these percentiles, the PRSUs granted toMessrs. Wilson, Jorgensen, Söderlund, Moss and Bruzzo in June 2015 would accelerate and vest as to 169% of the target number of sharesfor the remaining vest date in the performance period, the PRSUs granted to Messrs. Wilson, Jorgensen, Söderlund, Moss and Bruzzo in June2016, would each accelerate and vest as to 148% of the target number of shares for the remaining vest dates in their respective performanceperiods, and the PRSUs granted to Messrs. Wilson, Jorgensen, Söderlund, Moss and Bruzzo in June 2017, including Mr. Söderlund’ssupplemental PRSUs, would each accelerate and vest as to 92% of the target number of shares for the remaining vest dates in their respectiveperformance periods.
(4) Represents the estimated value of unvested PIRSUs that would accelerate and vest at target on a qualifying termination of employment inconnection with a change in control occurring on March 31, 2018. For purposes of the table, we have used the estimated target number ofPIRSUs that would accelerate and vest on a qualifying termination of employment in connection with a change in control occurring onMarch 31, 2018 based on the completion of 25% of the four-year performance period. If we estimated the value of the unvested PIRSUs atmaximum based on the completion of 25% of the four-year performance-period, the value of the PIRSUs would be $8,228,195 for Mr. Wilson;$5,485,383 for Mr. Jorgensen; $6,582,483 for Mr. Söderlund; and $3,839,792 for Mr. Moss.
(5) Includes 24 months of post-termination health benefits for Mr. Wilson and accrued paid time off or vacation benefits and 18 months of post-termination health benefits for Messrs. Jorgensen, Söderlund, Bruzzo and Moss and accrued paid time off or vacation benefits.
46
Pro
xyS
tatemen
t
FISCAL 2018 PAY RATIO
For fiscal 2018:
• the median of the annual total compensation of all our employees (other than Mr. Wilson) was$96,336; and
• the annual total compensation of Mr. Wilson, was $35,728,764, as reported in the Fiscal 2018Summary Compensation Table.
Based on this information, for fiscal 2018 the ratio of Mr. Wilson’s annual total compensation to themedian of the annual total compensation of all employees was 371:1.
This ratio is a reasonable estimate calculated in a manner consistent with Item 402(u) of RegulationS-K under the Securities Exchange Act of 1934.
Mr. Wilson’s annual total compensation for fiscal 2018 included the grant date fair market value of aspecial performance-based incremental RSU (“PIRSU”) award granted to Mr. Wilson and certain otherNEOs in fiscal 2018. The PIRSUs cliff vest after four years subject to the achievement ofpre-established performance conditions based on non-GAAP net revenue and free cash flow targets.The Compensation Committee granted the PIRSUs in order to retain and incentivize Mr. Wilson andcertain other key executives, and aligned the vesting of the PIRSUs to measures that are critical to theachievement of EA’s long-term strategic plan. Additional information regarding the PIRSUs can befound under the heading “Our Elements of Pay” in the “Compensation Discussion and Analysis”beginning on page 20 of the Proxy Statement.
If we annualized the PIRSUs over the four-year vesting period, the ratio of Mr. Wilson’s annual totalcompensation to the median of the annual total compensation of all employees would be 254:1.
We identified our median employee by applying a consistently applied compensation measure(“CACM”) to all employees on the Company’s worldwide payroll as of January 1, 2018, including butnot limited to, full time, part-time, regular and temporary employees. Our CACM aggregated thefollowing elements of compensation which we obtained from our internal payroll systems:
• base salary as of December 31, 2017 (annualized for permanent employees on leave ofabsence or not employed for the full year);
• discretionary bonuses (performance or other bonuses) paid to employees in calendar year2017; and
• the grant date fair market value of equity awards granted to employees in calendar year 2017.
We did not exclude any employees or, other than annualizing base salary for permanent employees,make any compensation adjustments whether for cost of living or otherwise when identifying ourmedian employee.
Our median employee was identified to be a software engineer employed in Canada (the “MedianEmployee”).
The Median Employee’s fiscal 2018 compensation was calculated in Canadian dollars and determinedusing the same methodology as used to determine Mr. Wilson’s annual total compensation set forth inthe Fiscal 2018 Summary Compensation Table. The Median Employee’s annual total compensationwas then converted to U.S. dollars based on the exchange rate of the Canadian dollar to the U.S.dollar as of March 31, 2018 of 0.776036.
47
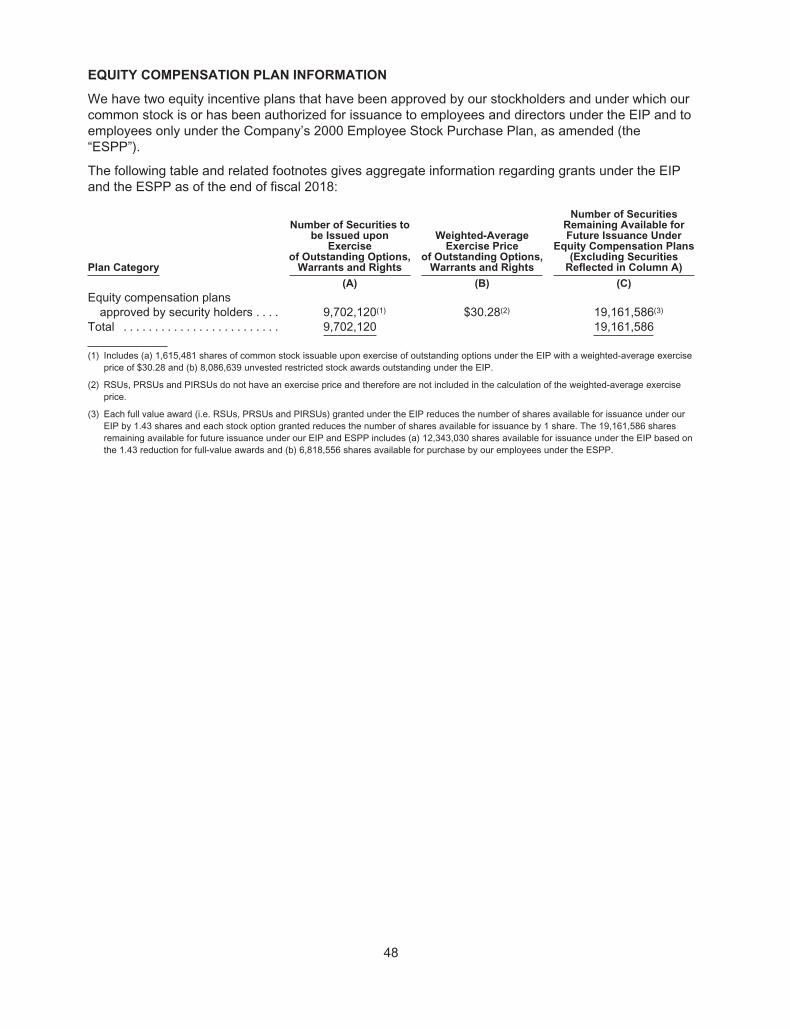
EQUITY COMPENSATION PLAN INFORMATION
We have two equity incentive plans that have been approved by our stockholders and under which ourcommon stock is or has been authorized for issuance to employees and directors under the EIP and toemployees only under the Company’s 2000 Employee Stock Purchase Plan, as amended (the“ESPP”).
The following table and related footnotes gives aggregate information regarding grants under the EIPand the ESPP as of the end of fiscal 2018:
Plan Category
Number of Securities tobe Issued upon
Exerciseof Outstanding Options,
Warrants and Rights
Weighted-AverageExercise Price
of Outstanding Options,Warrants and Rights
Number of SecuritiesRemaining Available forFuture Issuance Under
Equity Compensation Plans(Excluding Securities
Reflected in Column A)
(A) (B) (C)
Equity compensation plansapproved by security holders . . . . 9,702,120(1) $30.28(2) 19,161,586(3)
Total . . . . . . . . . . . . . . . . . . . . . . . . . 9,702,120 19,161,586
(1) Includes (a) 1,615,481 shares of common stock issuable upon exercise of outstanding options under the EIP with a weighted-average exerciseprice of $30.28 and (b) 8,086,639 unvested restricted stock awards outstanding under the EIP.
(2) RSUs, PRSUs and PIRSUs do not have an exercise price and therefore are not included in the calculation of the weighted-average exerciseprice.
(3) Each full value award (i.e. RSUs, PRSUs and PIRSUs) granted under the EIP reduces the number of shares available for issuance under ourEIP by 1.43 shares and each stock option granted reduces the number of shares available for issuance by 1 share. The 19,161,586 sharesremaining available for future issuance under our EIP and ESPP includes (a) 12,343,030 shares available for issuance under the EIP based onthe 1.43 reduction for full-value awards and (b) 6,818,556 shares available for purchase by our employees under the ESPP.
48
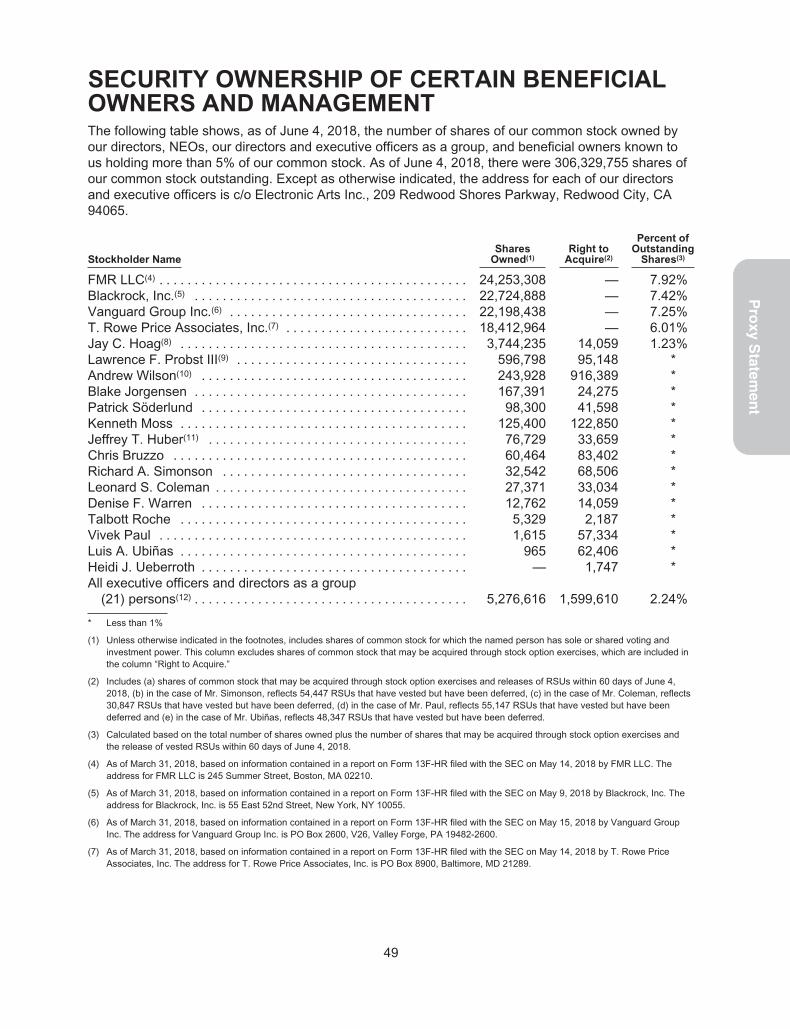
Pro
xyS
tatemen
t
SECURITY OWNERSHIP OF CERTAIN BENEFICIALOWNERS AND MANAGEMENTThe following table shows, as of June 4, 2018, the number of shares of our common stock owned byour directors, NEOs, our directors and executive officers as a group, and beneficial owners known tous holding more than 5% of our common stock. As of June 4, 2018, there were 306,329,755 shares ofour common stock outstanding. Except as otherwise indicated, the address for each of our directorsand executive officers is c/o Electronic Arts Inc., 209 Redwood Shores Parkway, Redwood City, CA94065.
Stockholder NameShares
Owned(1)Right to
Acquire(2)
Percent ofOutstanding
Shares(3)
FMR LLC(4) . . . . . . . . . . . . . . . . . . . . . . . . . . . . . . . . . . . . . . . . . . . . 24,253,308 — 7.92%Blackrock, Inc.(5) . . . . . . . . . . . . . . . . . . . . . . . . . . . . . . . . . . . . . . . 22,724,888 — 7.42%Vanguard Group Inc.(6) . . . . . . . . . . . . . . . . . . . . . . . . . . . . . . . . . . 22,198,438 — 7.25%T. Rowe Price Associates, Inc.(7) . . . . . . . . . . . . . . . . . . . . . . . . . . 18,412,964 — 6.01%Jay C. Hoag(8) . . . . . . . . . . . . . . . . . . . . . . . . . . . . . . . . . . . . . . . . . 3,744,235 14,059 1.23%Lawrence F. Probst III(9) . . . . . . . . . . . . . . . . . . . . . . . . . . . . . . . . . 596,798 95,148 *Andrew Wilson(10) . . . . . . . . . . . . . . . . . . . . . . . . . . . . . . . . . . . . . . 243,928 916,389 *Blake Jorgensen . . . . . . . . . . . . . . . . . . . . . . . . . . . . . . . . . . . . . . . 167,391 24,275 *Patrick Söderlund . . . . . . . . . . . . . . . . . . . . . . . . . . . . . . . . . . . . . . 98,300 41,598 *Kenneth Moss . . . . . . . . . . . . . . . . . . . . . . . . . . . . . . . . . . . . . . . . . 125,400 122,850 *Jeffrey T. Huber(11) . . . . . . . . . . . . . . . . . . . . . . . . . . . . . . . . . . . . . 76,729 33,659 *Chris Bruzzo . . . . . . . . . . . . . . . . . . . . . . . . . . . . . . . . . . . . . . . . . . 60,464 83,402 *Richard A. Simonson . . . . . . . . . . . . . . . . . . . . . . . . . . . . . . . . . . . 32,542 68,506 *Leonard S. Coleman . . . . . . . . . . . . . . . . . . . . . . . . . . . . . . . . . . . . 27,371 33,034 *Denise F. Warren . . . . . . . . . . . . . . . . . . . . . . . . . . . . . . . . . . . . . . 12,762 14,059 *Talbott Roche . . . . . . . . . . . . . . . . . . . . . . . . . . . . . . . . . . . . . . . . . 5,329 2,187 *Vivek Paul . . . . . . . . . . . . . . . . . . . . . . . . . . . . . . . . . . . . . . . . . . . . 1,615 57,334 *Luis A. Ubiñas . . . . . . . . . . . . . . . . . . . . . . . . . . . . . . . . . . . . . . . . . 965 62,406 *Heidi J. Ueberroth . . . . . . . . . . . . . . . . . . . . . . . . . . . . . . . . . . . . . . — 1,747 *All executive officers and directors as a group
(21) persons(12) . . . . . . . . . . . . . . . . . . . . . . . . . . . . . . . . . . . . . . . 5,276,616 1,599,610 2.24%
* Less than 1%
(1) Unless otherwise indicated in the footnotes, includes shares of common stock for which the named person has sole or shared voting andinvestment power. This column excludes shares of common stock that may be acquired through stock option exercises, which are included inthe column “Right to Acquire.”
(2) Includes (a) shares of common stock that may be acquired through stock option exercises and releases of RSUs within 60 days of June 4,2018, (b) in the case of Mr. Simonson, reflects 54,447 RSUs that have vested but have been deferred, (c) in the case of Mr. Coleman, reflects30,847 RSUs that have vested but have been deferred, (d) in the case of Mr. Paul, reflects 55,147 RSUs that have vested but have beendeferred and (e) in the case of Mr. Ubiñas, reflects 48,347 RSUs that have vested but have been deferred.
(3) Calculated based on the total number of shares owned plus the number of shares that may be acquired through stock option exercises andthe release of vested RSUs within 60 days of June 4, 2018.
(4) As of March 31, 2018, based on information contained in a report on Form 13F-HR filed with the SEC on May 14, 2018 by FMR LLC. Theaddress for FMR LLC is 245 Summer Street, Boston, MA 02210.
(5) As of March 31, 2018, based on information contained in a report on Form 13F-HR filed with the SEC on May 9, 2018 by Blackrock, Inc. Theaddress for Blackrock, Inc. is 55 East 52nd Street, New York, NY 10055.
(6) As of March 31, 2018, based on information contained in a report on Form 13F-HR filed with the SEC on May 15, 2018 by Vanguard GroupInc. The address for Vanguard Group Inc. is PO Box 2600, V26, Valley Forge, PA 19482-2600.
(7) As of March 31, 2018, based on information contained in a report on Form 13F-HR filed with the SEC on May 14, 2018 by T. Rowe PriceAssociates, Inc. The address for T. Rowe Price Associates, Inc. is PO Box 8900, Baltimore, MD 21289.
49
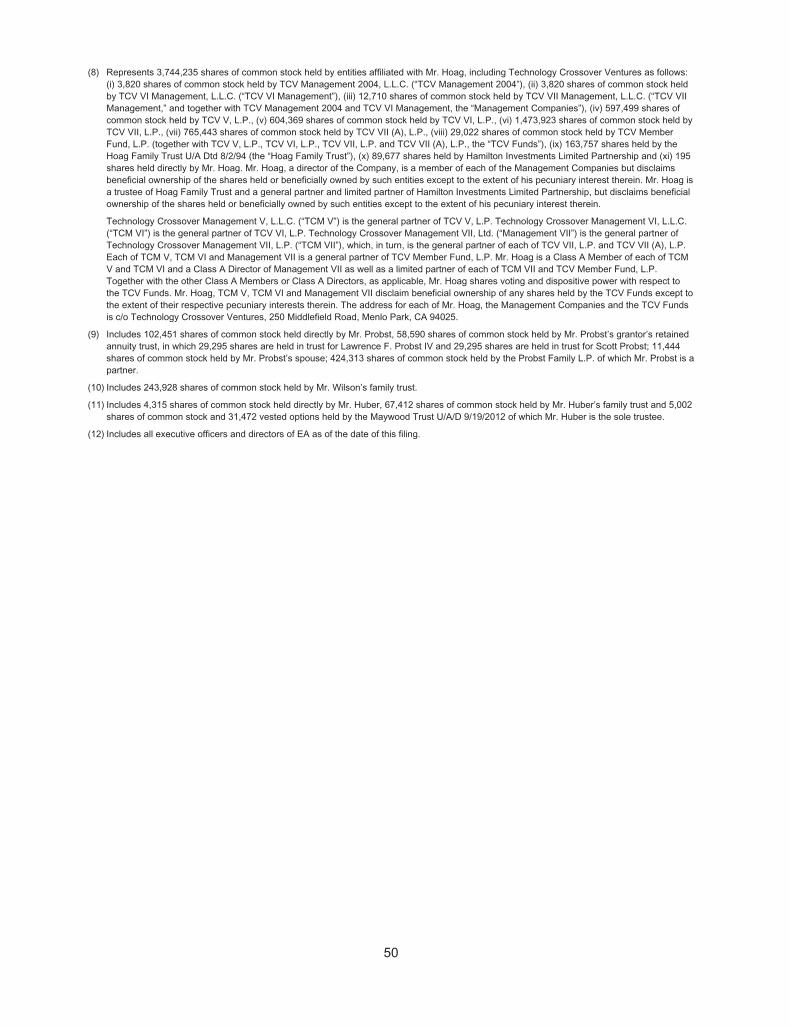
(8) Represents 3,744,235 shares of common stock held by entities affiliated with Mr. Hoag, including Technology Crossover Ventures as follows:(i) 3,820 shares of common stock held by TCV Management 2004, L.L.C. (“TCV Management 2004”), (ii) 3,820 shares of common stock heldby TCV VI Management, L.L.C. (“TCV VI Management”), (iii) 12,710 shares of common stock held by TCV VII Management, L.L.C. (“TCV VIIManagement,” and together with TCV Management 2004 and TCV VI Management, the “Management Companies”), (iv) 597,499 shares ofcommon stock held by TCV V, L.P., (v) 604,369 shares of common stock held by TCV VI, L.P., (vi) 1,473,923 shares of common stock held byTCV VII, L.P., (vii) 765,443 shares of common stock held by TCV VII (A), L.P., (viii) 29,022 shares of common stock held by TCV MemberFund, L.P. (together with TCV V, L.P., TCV VI, L.P., TCV VII, L.P. and TCV VII (A), L.P., the “TCV Funds”), (ix) 163,757 shares held by theHoag Family Trust U/A Dtd 8/2/94 (the “Hoag Family Trust”), (x) 89,677 shares held by Hamilton Investments Limited Partnership and (xi) 195shares held directly by Mr. Hoag. Mr. Hoag, a director of the Company, is a member of each of the Management Companies but disclaimsbeneficial ownership of the shares held or beneficially owned by such entities except to the extent of his pecuniary interest therein. Mr. Hoag isa trustee of Hoag Family Trust and a general partner and limited partner of Hamilton Investments Limited Partnership, but disclaims beneficialownership of the shares held or beneficially owned by such entities except to the extent of his pecuniary interest therein.
Technology Crossover Management V, L.L.C. (“TCM V”) is the general partner of TCV V, L.P. Technology Crossover Management VI, L.L.C.(“TCM VI”) is the general partner of TCV VI, L.P. Technology Crossover Management VII, Ltd. (“Management VII”) is the general partner ofTechnology Crossover Management VII, L.P. (“TCM VII”), which, in turn, is the general partner of each of TCV VII, L.P. and TCV VII (A), L.P.Each of TCM V, TCM VI and Management VII is a general partner of TCV Member Fund, L.P. Mr. Hoag is a Class A Member of each of TCMV and TCM VI and a Class A Director of Management VII as well as a limited partner of each of TCM VII and TCV Member Fund, L.P.Together with the other Class A Members or Class A Directors, as applicable, Mr. Hoag shares voting and dispositive power with respect tothe TCV Funds. Mr. Hoag, TCM V, TCM VI and Management VII disclaim beneficial ownership of any shares held by the TCV Funds except tothe extent of their respective pecuniary interests therein. The address for each of Mr. Hoag, the Management Companies and the TCV Fundsis c/o Technology Crossover Ventures, 250 Middlefield Road, Menlo Park, CA 94025.
(9) Includes 102,451 shares of common stock held directly by Mr. Probst, 58,590 shares of common stock held by Mr. Probst’s grantor’s retainedannuity trust, in which 29,295 shares are held in trust for Lawrence F. Probst IV and 29,295 shares are held in trust for Scott Probst; 11,444shares of common stock held by Mr. Probst’s spouse; 424,313 shares of common stock held by the Probst Family L.P. of which Mr. Probst is apartner.
(10) Includes 243,928 shares of common stock held by Mr. Wilson’s family trust.
(11) Includes 4,315 shares of common stock held directly by Mr. Huber, 67,412 shares of common stock held by Mr. Huber’s family trust and 5,002shares of common stock and 31,472 vested options held by the Maywood Trust U/A/D 9/19/2012 of which Mr. Huber is the sole trustee.
(12) Includes all executive officers and directors of EA as of the date of this filing.
50

Pro
xyS
tatemen
t
PROPOSALS TO BE VOTED ONPROPOSAL ONE
ELECTION OF DIRECTORS
At the Annual Meeting, stockholders will elect nine directors to hold office for a one-year term until thenext annual meeting (or until their respective successors are elected and qualified). All nominees haveconsented to serve a one-year term, if elected. For additional information regarding the nominees andour corporate governance practices, including our director resignation policies, please see the sectionsof this Proxy Statement entitled “2018 Proxy Statement Summary and Highlights,” “Commonly AskedQuestions and Answers” and “Board of Directors and Corporate Governance.”
The 2018 election of directors will be uncontested. Accordingly, EA’s Amended and Restated Bylawsprovide that in an uncontested election of directors each nominee must receive more votes cast “for”than “against” his or her election or re-election in order to be re-elected to the Board of Directors.
The Board of Directors has nominated Ms. Heidi J. Ueberroth, who was appointed to the Board ofDirectors in November 2017 to stand for election, and the following directors to stand for re-election, atthe Annual Meeting:
• Leonard S. Coleman
• Jay C. Hoag
• Jeffrey T. Huber
• Lawrence F. Probst III
• Richard A. Simonson
• Talbott Roche
• Luis A. Ubiñas
• Andrew Wilson
The Board of Directors recommends a vote FOR each of the nominees.
51
PROPOSAL TWO
ADVISORY VOTE ON THE COMPENSATION OF THE COMPANY’S NAMED EXECUTIVE
OFFICERS
In accordance with the SEC’s proxy rules, we seek an advisory, non-binding stockholder vote withrespect to the compensation of our NEOs for fiscal 2018. This vote, which is undertaken by usannually, is not intended to address any specific item of compensation, but rather the overallcompensation of our NEOs and the compensation philosophy, policies and practices, as disclosed inthis Proxy Statement.
Approval of this proposal requires the affirmative vote of a majority of the voting shares present at theAnnual Meeting in person or by proxy and voting for or against the proposal.
We previously have submitted advisory say on pay proposals for each fiscal year beginning with fiscal2011 and have received majority stockholder support for the compensation of our NEOs for each ofthese years.
EA’s management, the Compensation Committee and the Board of Directors are committed tomaintaining a pay-for-performance alignment in our executive compensation programs and continue tosolicit feedback from our stockholders regarding our programs and practices. We received a favorable96% of votes cast for our annual say on pay advisory proposal at our 2017 annual meeting.
We encourage you to read the “Compensation Discussion and Analysis” at pages 20 through 35 foradditional details on our executive compensation programs and the fiscal 2018 compensation of ourNEOs.
We believe our compensation programs and policies for fiscal 2018 were consistent with our corecompensation principles, supported by strong compensation governance practices and are worthy ofcontinued stockholder support. Accordingly, we ask for our stockholders to indicate their support for thecompensation paid to our NEOs, by voting “FOR” the following resolution at the Annual Meeting:
“RESOLVED, that the Company’s stockholders approve, on an advisory basis, the
compensation of the named executive officers for fiscal 2018, as disclosed in the
Compensation Discussion and Analysis, the compensation tables and the related narrative
disclosures in this Proxy Statement.”
Although the vote is advisory and non-binding, our Board of Directors and Compensation Committeevalue the opinions of our stockholders and will consider the outcome of the vote, along with otherrelevant factors, in evaluating the future compensation of our NEOs.
The Board of Directors recommends a vote FOR the approval of the foregoing resolution.
52

Pro
xyS
tatemen
t
PROPOSAL THREE
RATIFICATION OF THE APPOINTMENT OF KPMG LLP, INDEPENDENT REGISTERED PUBLIC
ACCOUNTING FIRM
The Audit Committee is directly responsible for the appointment, retention, compensation and oversightof the Company’s independent registered public accounting firm. The Audit Committee has appointedKPMG LLP as the Company’s independent auditors for the fiscal year ending March 31, 2019. KPMGLLP has audited the financial statements of the Company and its consolidated subsidiaries since fiscal1987. The Audit Committee and the Board of Directors believe that KPMG LLP’s long-term knowledge ofEA and its subsidiaries is valuable to the Company as discussed further below. Representatives ofKPMG LLP have direct access to members of the Audit Committee and the Board of Directors. Weexpect one or more representatives of KPMG LLP to attend the Annual Meeting in order to respond toappropriate questions from stockholders and make a statement if they desire to do so.
Ratification of the appointment of KPMG LLP as our independent auditors is not required by ourAmended and Restated Bylaws or otherwise. The Board of Directors has determined to submit thisproposal to the stockholders as a matter of good corporate practice. Approval of this proposal requiresthe affirmative vote of a majority of the voting shares present at the meeting in person or by proxy andvoting for or against the proposal. If the stockholders do not ratify the appointment, the Audit Committeewill review its future selection of auditors. Even if the appointment is ratified, the Audit Committee may, inits discretion, direct the appointment of different independent auditors at any time during the year if itdetermines that such a change would be in the best interests of the Company and the stockholders.
Fees of Independent Auditors
The aggregate fees billed for the last two fiscal years for each of the following categories of servicesare set forth below:
Description of FeesYear Ended
March 31, 2018Year Ended
March 31, 2017
Audit Fees(1) . . . . . . . . . . . . . . . . . . . . . . . . . . . . . . . . . . . . . . . . . . . . . . . . . . $4,990,000 $4,563,000Audit-Related Fees(2) . . . . . . . . . . . . . . . . . . . . . . . . . . . . . . . . . . . . . . . . . . . 254,000 115,000Tax Fees — Compliance(3) . . . . . . . . . . . . . . . . . . . . . . . . . . . . . . . . . . . . . . 329,000 367,000
Total All Fees . . . . . . . . . . . . . . . . . . . . . . . . . . . . . . . . . . . . . . . . . . . . . . . . . $5,573,000 $5,045,000
(1) Audit Fees: This category includes the annual audit of the Company’s financial statements and internal controls over financial reporting(including quarterly reviews of financial statements included in the Company’s quarterly reports on Form 10-Q), and services normallyprovided by the independent auditors in connection with regulatory filings. This category also includes consultation on matters that aroseduring, or as a result of the audit or review of financial statements, statutory audits required for our non-US subsidiaries, and servicesassociated with our periodic reports and other documents filed with the SEC, as well as Sarbanes-Oxley Section 404 compliance consultation.
(2) Audit-Related Fees: This category consists of fees for assurance and related services that are reasonably related to the performance of theaudit or review of the Company’s financial statements and are not reported under “Audit Fees.” In fiscal 2018, these fees were for accountingconsultations and services in the U.S. and in connection with other regulatory filings in our international jurisdictions.
(3) Tax Fees: This category includes compliance services rendered for U.S. and foreign tax compliance and returns and transfer pricingdocumentation.
Services Provided by the Independent Auditor
KPMG LLP audits our consolidated operations and provides statutory audits for legal entities within ourinternational corporate structure. Having one audit firm with a strong global presence responsible forthese audits ensures that a coordinated approach is used to address issues that may impact ourbusinesses across multiple geographies and legal entities. Few audit firms have the knowledge of oursector and the capability of servicing our global audit requirements. KPMG LLP has the geographicalscope that our operations require and the accounting expertise in the matters relevant to our sector. Inaddition, KPMG LLP’s experience working with the Company gives them the institutional knowledge tounderstand our operations and processes, which we believe helps them address the relevant issuesand improves the quality of the audit.
53

In appointing KPMG LLP as our independent auditors for fiscal 2019, the Audit Committee and theBoard of Directors have considered the performance of KPMG LLP in fiscal 2018, as well as in prioryears, and have taken into account the alternative options available to the Company. The AuditCommittee and the Board of Directors have determined that it is in the best interest of the Company tocontinue KPMG LLP’s engagement.
We believe the experience and expertise held by the members of the Audit Committee give them thenecessary skills to evaluate the relationship between the Company and its independent auditors and tooversee auditor independence. The Audit Committee periodically considers whether there should berotation of our independent external audit firm. The Audit Committee is empowered under its charter toobtain advice and assistance from outside legal, accounting and other advisors as it deems appropriate.
At each meeting of the Audit Committee, Company management is provided the opportunity to meet inprivate session with the Audit Committee to discuss any issues relating to KPMG LLP’s engagement.Similarly, KPMG LLP regularly meets in private session with the Audit Committee with no members ofCompany management present.
Audit Partner Rotation
Our KPMG LLP lead and concurring audit partner have been working on the Company’s audit sincethe first quarter of fiscal 2016 and the first quarter of fiscal 2015, respectively. Each audit partner mayserve a maximum of five years on the Company’s audit. Candidates are proposed by KPMG LLPbased on their expertise and experience and are vetted by Company management and arecommendation is made to the Audit Committee. The Audit Committee has final approval of the leadaudit partner and the concurring audit partner.
Pre-approval Procedures
The Audit Committee is required to pre-approve the engagement of, and fees incurred by, KPMG LLPto perform audit and other services for the Company and its subsidiaries. The Company’s proceduresfor the pre-approval by the Audit Committee of all services provided by KPMG LLP and the related feescomply with SEC regulations regarding pre-approval of services. Services subject to these SECrequirements include audit services, audit-related services, tax services and other services. In somecases, pre-approval for a particular category or group of services and the related fees are provided bythe Audit Committee for up to a year, subject to a specific budget and to regular managementreporting. In other cases, the Chairman of the Audit Committee has the delegated authority from theAudit Committee to pre-approve additional services and the related fees up to a specified dollar limit,and such pre-approvals are then communicated to the full Audit Committee. The Audit Committeereviews quarterly the status of all pre-approved services and the related fees to date and approves anynew services and the related fees to be provided.
In determining whether to grant a pre-approval, the Audit Committee considers the level of non-auditfees incurred to date as a percentage of the total annual fees paid to KPMG LLP. In addition, the AuditCommittee considers additional factors to assess the potential impact on auditor independence ofKPMG LLP performing such services, including whether the services are permitted under the rules andrecommendations of the Public Company Accounting Oversight Board, the American Institute ofCertified Public Accountants, and the NASDAQ Stock Market, whether the proposed services arepermitted under EA’s policies, and whether the proposed services are consistent with the principles ofthe SEC’s auditor independence rules. The Company also annually confirms with each of its directorsand executive officers whether there are any relationships that they are aware of with KPMG LLP thatmay impact the auditor independence evaluation. The Audit Committee considered and determinedthat fees for services other than audit and audit-related services paid to KPMG LLP during fiscal 2018are compatible with maintaining KPMG LLP’s independence.
The Board of Directors recommends a vote FOR the ratification of KPMG LLP as our
independent auditors for the fiscal year ending March 31, 2019.
54

Pro
xyS
tatemen
t
COMMONLY ASKED QUESTIONS AND ANSWERS
1. Why am I receiving these materials?
You are receiving these materials in connection with the Company’s solicitation of proxies for use atour Annual Meeting, which will take place on Thursday, August 2, 2018 at 2:00 p.m. local time, at ourcorporate headquarters in Redwood City, California. This Proxy Statement describes proposals onwhich you, as a stockholder, are being asked to vote. It also gives you information on the proposalsthat will be considered at the Annual Meeting, as well as other information so that you can make aninformed decision. As a stockholder, you are invited to attend the Annual Meeting and are requested tovote on the items of business described in this Proxy Statement.
2. Why did I receive a Notice in the mail regarding the Internet availability of proxy materials
instead of a full set of proxy materials?
In accordance with rules adopted by the Securities and Exchange Commission (the “SEC”), we mayfurnish proxy materials, including this Proxy Statement and our Annual Report, to our stockholders byproviding access on the Internet instead of mailing printed copies. Stockholders will receive onlyprinted copies of the proxy materials if they request them. Instead, the Notice, which was mailed to ourstockholders, provides instructions on how to access and review all of the proxy materials on theInternet. The Notice also describes how you may submit your proxy on the Internet. If you would like toreceive a paper or email copy of our proxy materials, you should follow the instructions for requestingthose materials in the Notice or you may contact the Company directly. The Company will provide youwithout charge, upon request, a paper or email copy of our proxy materials (paper copies will be sentby first class mail). Any such request should be directed as follows: Corporate Secretary, ElectronicArts Inc., 209 Redwood Shores Parkway, Redwood City, CA 94065 or call (650) 628-1500.
3. How can I get electronic access to the proxy materials?
The proxy card provides instructions on how to inform us to send future proxy materials to youelectronically by email. If you choose to receive future proxy materials by email, you will receive anemail next year with instructions containing a link to those materials and a link to our proxy website.Your election to receive proxy materials by email will remain in effect until you terminate it. We
encourage you to receive future proxy materials by email. Doing so will allow us to provide you
with the information you need in a more timely manner, will save us the cost of printing and
mailing documents to you, and will help conserve natural resources.
4. Can I vote my shares by filling out and returning the Notice?
No. However, the Notice provides instructions on how to vote on the Internet, by telephone, by mail orby submitting a ballot in person at the Annual Meeting.
55

5. Who can vote at the Annual Meeting?
Stockholders who owned common stock as of the close of business on June 8, 2018 may attend andvote at the Annual Meeting. If your shares are registered directly in your name with our transfer agent,Computershare, you are considered, with respect to those shares, the stockholder of record. As thestockholder of record, you have the right to vote in person at the Annual Meeting. If your shares areheld in a brokerage account or by another nominee or trustee, you are considered the beneficial ownerof shares held in “street name.” As the beneficial owner, you are also invited to attend the AnnualMeeting. As a beneficial owner, you are not the stockholder of record and may not vote these shares inperson at the Annual Meeting unless you obtain a “legal proxy” from your broker, nominee, or trusteethat holds your shares, giving you the right to vote the shares at the meeting. Each share of commonstock is entitled to one vote. There were 306,111,943 shares of common stock outstanding on therecord date, June 8, 2018.
A quorum is required to conduct business at the Annual Meeting. A quorum exists if a majority of EA’soutstanding voting shares, or at least 153,055,972 shares, as of June 8, 2018 is present orrepresented by proxies at the Annual Meeting. On June 8, 2018, a total of 306,111,943 shares ofcommon stock were outstanding and entitled to vote.
Shares are counted as present or represented at the Annual Meeting if:
• They are entitled to vote at the Annual Meeting and are present at the Annual Meeting inperson, or
• The stockholder has voted on the Internet, by telephone or a properly submitted proxy card priorto 11:59 p.m. Eastern Time on August 1, 2018.
6. What am I voting on?
We are asking you to
• Elect Leonard S. Coleman, Jay C. Hoag, Jeffrey T. Huber, Lawrence F. Probst III, TalbottRoche, Richard A. Simonson, Luis A. Ubiñas, Heidi J. Ueberroth and Andrew Wilson to theBoard of Directors to hold office for a one-year term (Proposal 1);
• Cast an advisory vote on the compensation of the Company’s named executive officers(Proposal 2); and
• Ratify the appointment of KPMG LLP as the Company’s independent public registeredaccounting firm for the fiscal year ending March 31, 2019 (Proposal 3).
56

Pro
xyS
tatemen
t
7. How do I vote my shares if I won’t be able to attend the Annual Meeting in person?
You do not need to attend the Annual Meeting in person in order to vote. You may, instead, vote on theInternet, by telephone or by mail (if you have received printed proxy materials) prior to 11:59 p.m.Eastern Time on August 1, 2018. By doing so, you are giving a proxy appointing Andrew Wilson (theCompany’s Chief Executive Officer), Blake Jorgensen (the Company’s Chief Operating Officer andChief Financial Officer) and Jacob Schatz (the Company’s General Counsel and Corporate Secretary)or any of them, each with power of substitution, to vote your shares at the Annual Meeting, or anyadjournment thereof, as you have instructed. If a proposal comes up for a vote at the Annual Meetingfor which you have not indicated an instruction, Mr. Wilson, Mr. Jorgensen and Mr. Schatz, or any oneof them, will vote your shares according to their best judgment. Even if you currently plan to attend theAnnual Meeting, it is a good idea to vote on the Internet, by telephone or, if you received printed proxymaterials, to complete and return your proxy card before the meeting date, in case your plans change.
• On the Internet or by Telephone — If you have Internet access, you may submit your proxyonline by following the instructions provided in the Notice or, if you receive printed proxymaterials, the proxy card. You may also vote by telephone by following the instructions providedon your proxy card or voting instruction card.
• By Mail — If you receive printed proxy materials, you may submit your proxy by mail by signingyour proxy card or, for shares held in street name, by following the voting instructions includedby your broker, trustee or nominee, and mailing it in the enclosed, postage-paid envelope. If youprovide specific voting instructions, your shares will be voted as you have instructed.
8. What does it mean if I receive more than one Notice or proxy card?
It means that you have multiple accounts at the transfer agent or with brokers. Please complete andreturn all proxy cards, or follow the instructions on each proxy card to vote on the Internet or bytelephone, to ensure that all your shares are voted.
9. I share an address with another stockholder, and we received only one paper copy of the
proxy materials. How can I obtain an additional copy of the proxy materials?
The Company has adopted an SEC-approved procedure called “householding.” Under this procedure,the Company may deliver a single copy of the Notice, Annual Report and this Proxy Statement tomultiple stockholders who share the same last name and address and who have consented tohouseholding, unless the Company has received contrary instructions from one or more of thosestockholders. This procedure reduces the environmental impact of the Company’s annual meetingsand reduces the Company’s printing and mailing costs. Stockholders who participate in householdingwill continue to receive separate proxy cards. Upon written or oral request, the Company will deliverpromptly a separate copy of the Notice, Annual Report and this Proxy Statement to any stockholder ata shared address to which the Company delivered a single copy of any of these documents.
To receive free of charge a separate copy of the Notice, Annual Report and this Proxy Statement, orseparate copies of these documents in the future, stockholders may write our Corporate Secretary at209 Redwood Shores Parkway, Redwood City, CA 94065 or call (650) 628-1500.
If you are receiving more than one copy of the proxy materials at a single address and would like toparticipate in householding, please contact the Company using the mailing address or phone numberabove. Stockholders who hold shares in street name may contact their brokerage firm, bank, broker-dealer or other similar organization to request information about householding.
57

10. What if I change my mind after I give my proxy?
You may revoke your proxy and change your vote at any time before the polls close at the AnnualMeeting. You may do this by:
• Sending a signed statement to the Company that the proxy is revoked (you may send such astatement to the Corporate Secretary at our corporate headquarters address listed above);
• Signing and returning another proxy with a later date;
• Voting on the Internet or by telephone at any time prior to 11:59 p.m. Eastern Time on August 1,2018 (your latest vote is counted); or
• Voting in person at the Annual Meeting.
Your proxy will not be revoked if you attend the Annual Meeting but do not vote.
11. Who will count the votes?
A representative of Broadridge Financial Solutions will tabulate the votes and act as the inspector ofelection.
12. How are votes counted?
You may vote “for,” “against” or “abstain” with respect to each of the nominees for election to the Boardof Directors and on each of the proposals. A share voted “abstain” with respect to any proposal isconsidered present at the Annual Meeting for purposes of establishing a quorum and entitled to votewith respect to that proposal, but is not considered a vote cast with respect to that proposal. Thus,abstentions will not affect the outcome of any matter being voted on at the Annual Meeting. If you signand return your proxy without voting instructions, your shares will be voted as recommended by theBoard of Directors.
13. What is the effect of a “broker non-vote” on the proposals to be voted on at the Annual
Meeting?
If your shares are held by a broker, bank or other nominee or trustee and you do not provide yourbroker, bank or other nominee or trustee with voting instructions, your shares may constitute “brokernon-votes.” Broker non-votes occur on a matter when a broker is not permitted to vote on that matterwithout instructions from the beneficial owners and instructions are not given. These matters arereferred to as “non-routine” matters. Proposals 1 and 2 are “non-routine”. In tabulating the votingresults for any particular proposal, shares that constitute broker non-votes are not considered votescast on that proposal. Thus, broker non-votes will not affect the outcome of Proposals 1 and 2.Proposal 3, the ratification of KPMG LLP as our independent auditor for fiscal 2019, is a “routine”proposal and no broker-non votes are expected in connection with Proposal 3. If your shares are heldof record by a bank, broker, or other nominee, we urge you to give instructions to your bank, broker orother nominee as to how you wish your shares to be voted.
58

Pro
xyS
tatemen
t
14. How many votes must the nominees receive to be elected as directors?
In an uncontested election, our Amended and Restated Bylaws require each nominee to receive morevotes cast “for” than “against” his or her election or re-election in order to be elected or re-elected tothe Board of Directors. Since we are not aware of any intention by any stockholder to nominate one ormore candidates to compete with the Board of Directors’ nominees for election at the Annual Meeting,the 2018 election will be uncontested.
In accordance with our Corporate Governance Guidelines, the Board of Directors expects anincumbent director to tender his or her resignation if he or she fails to receive the required number ofvotes for election or re-election in an uncontested election. In such an event, the Nominating andGovernance Committee will act on an expedited basis to determine whether to accept the director’sresignation and will submit such recommendation for prompt consideration by the Board of Directors.The director whose resignation is under consideration will abstain from participating in any decisionregarding his or her resignation. The Nominating and Governance Committee and the Board ofDirectors may consider any factors they deem relevant in deciding whether to accept and recommenda director’s resignation. The Board of Directors will act on the Nominating and GovernanceCommittee’s recommendation within 90 days from the date of the certification of election results andwill publicly disclose its decision promptly thereafter.
Shares represented by your proxy will be voted by EA’s management “for” the election of the ninenominees recommended by EA’s Board of Directors unless you vote against any or all of suchnominees or you mark your proxy to “abstain” from so voting. Abstentions and broker non-votes willhave no effect on the outcome of the director elections.
15. What happens if one or more of the nominees is unable to serve or for good cause will not
serve?
If, prior to the Annual Meeting, one or more of the nominees notifies us that he or she is unable toserve, or for good cause will not serve, as a member of the Board of Directors, the Board of Directorsmay reduce the number of directors or select a substitute nominee or substitute nominees, as the casemay be. In the latter case, if you have completed and returned your proxy card, Mr. Wilson,Mr. Jorgensen and Mr. Schatz, or any of them, may vote for any nominee designated by the incumbentBoard of Directors to fill the vacancy. They cannot vote for more than nine nominees.
16. How many votes are required to approve each of the other proposals?
The advisory vote on the compensation of our named executive officers (Proposal 2) and theratification of KPMG LLP (Proposal 3) must receive a “for” vote from a majority of the voting sharespresent at the Annual Meeting in person or by proxy and voting for or against these proposals. As anadvisory vote, the result of voting on Proposal 2 is non-binding. Although this vote is non-binding, theBoard of Directors and the Compensation Committee value the opinions of our stockholders and willconsider the outcome of this vote, along with other relevant factors, in evaluating the compensationprogram for our named executive officers.
Shares represented by your proxy will be voted by EA’s management in accordance with the Board ofDirectors’ recommendation unless you vote otherwise on your proxy or you mark your proxy to“abstain” from voting. Abstentions and broker non-votes will have no effect on the outcome of theseproposals.
59

17. What is the deadline to propose matters for consideration at the 2019 Annual Meeting of
stockholders?
Proposals to be considered for inclusion in our proxy materials: No later than February 15, 2019.All proposals must comply with Rule 14a-8 under the Securities Exchange Act of 1934, as amended(the “Exchange Act”).
Other proposals to be brought at our 2019 Annual Meeting: No earlier than April 4, 2019 and nolater than May 4, 2019. The submission must include certain information concerning the stockholderand the proposal, as specified in the Company’s Amended and Restated Bylaws.
18. What is the deadline to nominate individuals for election as directors at the 2019 Annual
Meeting of stockholders?
Director nominations for inclusion in our proxy materials (proxy access nominees): No earlierthan March 5, 2019 and no later than April 4, 2019. The nomination must include certain informationconcerning the stockholder or stockholder group and the nominee, as specified in Section 1.6 of theCompany’s Amended and Restated Bylaws.
Director brought pursuant to our advance notice bylaws: No earlier than April 4, 2019 and no laterthan May 4, 2019. The nomination must include certain information concerning the stockholder and thenominee, as specified in Section 1.5 of the Company’s Amended and Restated Bylaws.
19. Where should I send proposals and director nominations for the 2019 Annual Meeting of
stockholders?
Stockholder proposals and director nominations should be sent in writing to Jacob Schatz, CorporateSecretary at Electronic Arts Inc., 209 Redwood Shores Parkway, Redwood City, CA 94065.
20. How can I obtain a copy of the Company’s Amended and Restated Bylaws?
Our Amended and Restated Bylaws are included as an exhibit to a Current Report on Form 8-K/A wefiled with the SEC on May 27, 2016, which you may access through the SEC’s electronic data systemcalled EDGAR at www.sec.gov. You may also request a copy of our Amended and Restated Bylaws bycontacting our Corporate Secretary at the address above.
21. How can I listen to the live audio webcast of the Annual Meeting?
You can listen to the live audio webcast of the Annual Meeting by going to the Investor Relationssection of our website at http://investor.ea.com. An archived copy of the webcast will also be availableon our website for one year following the Annual Meeting. Please note that participation in the questionand answer portion of the Annual Meeting will be limited to those attending in person.
22. Where do I find the voting results of the meeting?
We expect to announce preliminary voting results at the Annual Meeting. We will also publish the finalresults on Form 8-K, which we will file with the SEC within four business days after the AnnualMeeting. Once filed, you can request a copy of the Form 8-K by contacting our Investor Relationsdepartment at (650) 628-0406 or the SEC at (800) SEC-0330 for the location of its nearest publicreference room. You can also get a copy on the Internet at http://investor.ea.com or through the SEC’selectronic data system called EDGAR at www.sec.gov.
60
Pro
xyS
tatemen
t
23. Who will pay for this proxy solicitation?
We will bear the costs of soliciting proxies from our stockholders. These costs include preparing,assembling, printing, mailing and distributing the notices, proxy statements, proxy cards and annualreports. If you choose to access the proxy materials and/or vote on the Internet, you are responsiblefor the Internet access charges you may incur. If you choose to vote by telephone, you are responsiblefor the telephone charges you may incur. In addition, some of our officers, directors, employees andother agents may also solicit proxies personally, by telephone and by electronic and regular mail, andwe will pay these costs. EA will also reimburse brokerage houses and other custodians for theirreasonable out-of-pocket expenses for forwarding proxy and solicitation materials to the beneficialowners of the Company’s common stock.
24. How is the Company’s fiscal year calculated?
The Company’s fiscal year is reported on a 52- or 53-week period that ends on the Saturday nearestMarch 31. Our results of operations for fiscal 2018 contained 52 weeks and ended on March 31, 2018.For simplicity of disclosure, fiscal periods are referred to as ending on a calendar month end, even ifthe technical end of a fiscal period was not the last day of a calendar month. Thus, in this ProxyStatement, “fiscal 2019,” “fiscal 2018,” “fiscal 2017,” and “fiscal 2016,” refer to our fiscal years endingor ended (as the case may be) on March 31, 2019, 2018, 2017 and 2016 respectively.
25. Who can I call with any questions about my shares?
If you hold shares in street name, you may contact your broker. If you are a stockholder of record, youmay call our transfer agent, Computershare, at (800) 736-3001 or (781) 575-3100 for internationalcallers or visit their website at www.computershare.com/investor.
61

Pro
xyS
tatemen
t
Appendix A
Supplemental Information for the 2018 Compensation Discussion and Analysis
The 2018 Compensation Discussion and Analysis beginning on page 20 contains certain non-GAAPfinancial measures, which are used internally by our management and Board of Directors in ourcompensation programs. The table below reconciles these non-GAAP financial measures to the mostdirectly comparable financial measures prepared in accordance with Generally Accepted AccountingPrinciples (“GAAP”).
CALCULATION OF NON-GAAP FINANCIAL MEASURES
Fiscal Year EndedMarch 31, 2018
GAAP net revenue . . . . . . . . . . . . . . . . . . . . . . . . . . . . . . . . . . . . . . . . . . . . . . . . . . . . . . $5,150Change in deferred net revenue (online-enabled games) . . . . . . . . . . . . . . . . . . . . 30
Non-GAAP net revenue . . . . . . . . . . . . . . . . . . . . . . . . . . . . . . . . . . . . . . . . . . . . . . . . . . $5,180
GAAP gross profit . . . . . . . . . . . . . . . . . . . . . . . . . . . . . . . . . . . . . . . . . . . . . . . . . . . . . . $3,873Acquisition-related expenses . . . . . . . . . . . . . . . . . . . . . . . . . . . . . . . . . . . . . . . . . . . 2Change in deferred net revenue (online-enabled games) . . . . . . . . . . . . . . . . . . . . 30Stock-based compensation . . . . . . . . . . . . . . . . . . . . . . . . . . . . . . . . . . . . . . . . . . . . 3
Non-GAAP gross profit . . . . . . . . . . . . . . . . . . . . . . . . . . . . . . . . . . . . . . . . . . . . . . . . . . $3,908
GAAP operating expenses . . . . . . . . . . . . . . . . . . . . . . . . . . . . . . . . . . . . . . . . . . . . . . . $2,439Acquisition-related expenses . . . . . . . . . . . . . . . . . . . . . . . . . . . . . . . . . . . . . . . . . . . (9)Stock-based compensation . . . . . . . . . . . . . . . . . . . . . . . . . . . . . . . . . . . . . . . . . . . . (239)
Non-GAAP operating expenses . . . . . . . . . . . . . . . . . . . . . . . . . . . . . . . . . . . . . . . . . . . $2,191
GAAP net income . . . . . . . . . . . . . . . . . . . . . . . . . . . . . . . . . . . . . . . . . . . . . . . . . . . . . . . $1,043Acquisition-related expenses . . . . . . . . . . . . . . . . . . . . . . . . . . . . . . . . . . . . . . . . . . . 11Change in deferred net revenue (online-enabled games) . . . . . . . . . . . . . . . . . . . . 30Stock-based compensation . . . . . . . . . . . . . . . . . . . . . . . . . . . . . . . . . . . . . . . . . . . . 242Income tax rate adjustments . . . . . . . . . . . . . . . . . . . . . . . . . . . . . . . . . . . . . . . . . . . 42
Non-GAAP net income . . . . . . . . . . . . . . . . . . . . . . . . . . . . . . . . . . . . . . . . . . . . . . . . . . $1,368GAAP diluted earnings per share . . . . . . . . . . . . . . . . . . . . . . . . . . . . . . . . . . . . . . . . . $ 3.34Non-GAAP diluted earnings per share . . . . . . . . . . . . . . . . . . . . . . . . . . . . . . . . . . . . . $ 4.38Number of diluted shares used in computation . . . . . . . . . . . . . . . . . . . . . . . . . . . . . 312Non-GAAP diluted shares . . . . . . . . . . . . . . . . . . . . . . . . . . . . . . . . . . . . . . . . . . . . . . . . 312
About Non-GAAP Financial Measures
Non-GAAP financial measures should not be considered as a substitute for, or superior to, measures offinancial performance prepared in accordance with GAAP. These non-GAAP financial measures do notreflect a comprehensive system of accounting, differ from GAAP measures with the same names and maydiffer from non-GAAP financial measures with the same or similar names that are used by other companies.
We compute non-GAAP financial measures using the same consistent method. We may considerwhether other significant items that arise in the future should be excluded from our non-GAAP financialmeasures. The Company uses certain non-GAAP financial measures when establishing performance-based targets. These measures adjust for certain items that may not be indicative of the Company’score business, operating results or future outlook. We believe that these non-GAAP financial measuresprovide meaningful supplemental information about the Company’s operating results primarily becausethey exclude amounts that we do not consider part of ongoing operating results when planning andforecasting for future periods and when assessing the performance of the organization. When makingcompensation decisions for our executives, we utilize non-GAAP financial measures to evaluate theCompany’s financial performance and the performance of our management team.
A-1
The Company’s target and actual non-GAAP financial measures are calculated with reference toadjustments to GAAP financial measures. These adjustments exclude the following items:
• Acquisition-related expenses
• Change in deferred net revenue (online-enabled games)
• Income tax rate adjustments
• Stock-based compensation
We believe it is appropriate to exclude these items for the following reasons:
Acquisition-Related Expenses. GAAP requires expenses to be recognized for various types of eventsassociated with a business acquisition. These events include expensing acquired intangible assets,including acquired in-process technology, post-closing adjustments associated with changes in theestimated amount of contingent consideration to be paid in an acquisition, and the impairment ofaccounting goodwill created as a result of an acquisition when future events indicate there has been adecline in its value. When analyzing the operating performance of an acquired entity, our managementfocuses on the total return provided by the investment (i.e., operating profit generated from theacquired entity as compared to the purchase price paid including the final amounts paid for contingentconsideration) without taking into consideration any allocations made for accounting purposes. Whenanalyzing the operating performance of an acquisition in subsequent periods, the Company’smanagement excludes the GAAP impact of any adjustments to the fair value of these acquisition-related balances to its financial results.
Change in Deferred Net Revenue (Online-enabled Games). The majority of our software games andrelated content have online connectivity whereby a consumer may be able to download unspecifiedcontent or updates on a when-and-if-available basis (“unspecified updates”) for use with the originalgame software. In addition, we may also offer a service of online activities, such as online playability,that permits consumers to play against each other without a separate fee. GAAP requires us toaccount for the consumer’s right to receive unspecified updates or the service of online activities for noadditional fee as a “bundled” sale, or multiple-element arrangement. We are not able to objectivelydetermine the fair value of these unspecified updates or online service included in certain of its online-enabled games. As a result, the Company recognizes the revenue from the sale of these online-enabled games on a straight-line basis over the estimated offering period. Our management excludesthe impact of the change in deferred net revenue related to online-enabled games in its non-GAAPfinancial measures for the reasons stated above and also to facilitate an understanding of ouroperations because all related costs of revenue are expensed as incurred instead of deferred andrecognized ratably.
Income Tax Rate Adjustments. The Company uses a fixed, long term projected tax rate internally toevaluate its operating performance, to forecast, plan and analyze future periods, and to assess theperformance of its management team. Accordingly, the Company applies the same tax rate to itsnon-GAAP financial results. During the fiscal 2018, the Company applied a tax rate of 21% to itsnon-GAAP financial results.
Stock-Based Compensation. When evaluating the performance of its individual business units, theCompany does not consider stock-based compensation charges. Likewise, the Company’smanagement teams exclude stock-based compensation expense from their short and long-termoperating plans. In contrast, the Company’s management teams are held accountable for cash-basedcompensation and such amounts are included in their operating plans. Further, when considering theimpact of equity award grants, we place a greater emphasis on overall stockholder dilution rather thanthe accounting charges associated with such grants.
A-2

An
nu
alRep
ort
2018 Annual Report on Form 10-K
UNITED STATES SECURITIES AND EXCHANGE COMMISSIONWashington, D.C. 20549
Form 10-KÍ ANNUAL REPORT PURSUANT TO SECTION 13 OR 15(d) OF THE
SECURITIES EXCHANGE ACT OF 1934For the fiscal year ended March 31, 2018
OR
‘ TRANSITION REPORT PURSUANT TO SECTION 13 OR 15(d) OF THESECURITIES EXCHANGE ACT OF 1934
For the transition period from toCommission File No. 000-17948
ELECTRONIC ARTS INC.(Exact name of registrant as specified in its charter)
Delaware 94-2838567(State or other jurisdiction of
incorporation or organization)(I.R.S. Employer
Identification No.)
209 Redwood Shores Parkway 94065Redwood City, California (Zip Code)
(Address of principal executive offices)
Registrant’s telephone number, including area code:(650) 628-1500
Securities registered pursuant to Section 12(b) of the Act:Title of Each Class Name of Each Exchange on Which Registered
Common Stock, $0.01 par value NASDAQ Global Select Market
Securities registered pursuant to Section 12(g) of the Act:None
Indicate by check mark if the registrant is a well-known seasoned issuer, as defined in Rule 405 of the SecuritiesAct. Yes Í No ‘
Indicate by check mark if the registrant is not required to file reports pursuant to Section 13 or Section 15(d) of theAct. Yes ‘ No Í
Indicate by check mark whether the registrant (1) has filed all reports required to be filed by Section 13 or 15(d) of theSecurities Exchange Act of 1934 during the preceding 12 months (or for such shorter period that the registrant was required tofile such reports), and (2) has been subject to such filing requirements for the past 90 days. Yes Í No ‘
Indicate by check mark whether the registrant has submitted electronically and posted on its corporate Web site, if any, everyInteractive Data File required to be submitted and posted pursuant to Rule 405 of Regulation S-T (§ 232.405 of this chapter)during the preceding 12 months (or for such shorter period that the registrant was required to submit and post suchfiles). Yes Í No ‘
Indicate by check mark if disclosure of delinquent filers pursuant to Item 405 of Regulation S-K (§ 229.405 of this chapter) isnot contained herein, and will not be contained, to the best of registrant’s knowledge, in definitive proxy or informationstatements incorporated by reference in Part III of this Form 10-K or any amendment to this Form 10-K. Í
Indicate by check mark whether the registrant is a large accelerated filer, an accelerated filer, a non-accelerated filer, a smallerreporting company, or an emerging growth company. See the definitions of “large accelerated filer,” “accelerated filer,”“smaller reporting company,” and “emerging growth company” in Rule 12b-2 of the Exchange Act.Large accelerated filer Í Accelerated filer ‘ Non-accelerated filer ‘ Smaller reporting company ‘Emerging growth company ‘ (Do not check if a smaller reporting company)If an emerging growth company, indicate by check mark if the registrant has elected not to use the extended transition periodfor complying with any new or revised financial accounting standards provided pursuant to Section 13(a) of the ExchangeAct. ‘
Indicate by check mark whether the registrant is a shell company (as defined in Rule 12b-2 of the ExchangeAct). Yes ‘ No Í
The aggregate market value of the registrant’s common stock, $0.01 par value, held by non-affiliates of the registrant as ofSeptember 30, 2017, the last business day of our second fiscal quarter, was $35,692 million.As of May 21, 2018, there were 306,832,936 shares of the registrant’s common stock, $0.01 par value, outstanding.
Documents Incorporated by ReferencePortions of the registrant’s definitive proxy statement for its 2018 Annual Meeting of Stockholders (the “2018 Proxy”) areincorporated by reference into Part III hereof. The 2018 Proxy is expected to be filed not later than 120 days after theregistrant’s fiscal year end. Except with respect to information specifically incorporated by reference into this Form 10-K, the2018 Proxy is not deemed to be filed as part hereof.
An
nu
alRep
ort

An
nu
alRep
ort
ELECTRONIC ARTS INC.2018 FORM 10-K ANNUAL REPORT
Table of Contents
Page
PART I
Item 1 Business . . . . . . . . . . . . . . . . . . . . . . . . . . . . . . . . . . . . . . . . . . . . . . . . . . . . . . . . . . . . . . . . . . . . . . 2
Item 1A Risk Factors . . . . . . . . . . . . . . . . . . . . . . . . . . . . . . . . . . . . . . . . . . . . . . . . . . . . . . . . . . . . . . . . . . . 8
Item 1B Unresolved Staff Comments . . . . . . . . . . . . . . . . . . . . . . . . . . . . . . . . . . . . . . . . . . . . . . . . . . . . . . 20
Item 2 Properties . . . . . . . . . . . . . . . . . . . . . . . . . . . . . . . . . . . . . . . . . . . . . . . . . . . . . . . . . . . . . . . . . . . . . 20
Item 3 Legal Proceedings . . . . . . . . . . . . . . . . . . . . . . . . . . . . . . . . . . . . . . . . . . . . . . . . . . . . . . . . . . . . . . 20
Item 4 Mine Safety Disclosures . . . . . . . . . . . . . . . . . . . . . . . . . . . . . . . . . . . . . . . . . . . . . . . . . . . . . . . . . 20
PART II
Item 5 Market for Registrant’s Common Equity, Related Stockholder Matters and Issuer Purchases ofEquity Securities . . . . . . . . . . . . . . . . . . . . . . . . . . . . . . . . . . . . . . . . . . . . . . . . . . . . . . . . . . . . . . . 21
Item 6 Selected Financial Data . . . . . . . . . . . . . . . . . . . . . . . . . . . . . . . . . . . . . . . . . . . . . . . . . . . . . . . . . . 23
Item 7 Management’s Discussion and Analysis of Financial Condition and Results of Operations . . . . . 24
Item 7A Quantitative and Qualitative Disclosures About Market Risk . . . . . . . . . . . . . . . . . . . . . . . . . . . . 44
Item 8 Financial Statements and Supplementary Data . . . . . . . . . . . . . . . . . . . . . . . . . . . . . . . . . . . . . . . . 46
Item 9 Changes in and Disagreements with Accountants on Accounting and Financial Disclosure . . . . . 91
Item 9A Controls and Procedures . . . . . . . . . . . . . . . . . . . . . . . . . . . . . . . . . . . . . . . . . . . . . . . . . . . . . . . . . 91
Item 9B Other Information . . . . . . . . . . . . . . . . . . . . . . . . . . . . . . . . . . . . . . . . . . . . . . . . . . . . . . . . . . . . . . 92
PART III
Item 10 Directors, Executive Officers and Corporate Governance . . . . . . . . . . . . . . . . . . . . . . . . . . . . . . . 93
Item 11 Executive Compensation . . . . . . . . . . . . . . . . . . . . . . . . . . . . . . . . . . . . . . . . . . . . . . . . . . . . . . . . . 93
Item 12 Security Ownership of Certain Beneficial Owners and Management and Related StockholderMatters . . . . . . . . . . . . . . . . . . . . . . . . . . . . . . . . . . . . . . . . . . . . . . . . . . . . . . . . . . . . . . . . . . . . . . . 93
Item 13 Certain Relationships and Related Transactions, and Director Independence . . . . . . . . . . . . . . . . 93
Item 14 Principal Accounting Fees and Services . . . . . . . . . . . . . . . . . . . . . . . . . . . . . . . . . . . . . . . . . . . . . 93
PART IV
Item 15 Exhibits, Financial Statement Schedules . . . . . . . . . . . . . . . . . . . . . . . . . . . . . . . . . . . . . . . . . . . . . 93
Exhibit Index . . . . . . . . . . . . . . . . . . . . . . . . . . . . . . . . . . . . . . . . . . . . . . . . . . . . . . . . . . . . . . . . . . . . . . . . . . 95
Signatures . . . . . . . . . . . . . . . . . . . . . . . . . . . . . . . . . . . . . . . . . . . . . . . . . . . . . . . . . . . . . . . . . . . . . . . . . . . . . 99
1

CAUTIONARY NOTE ABOUT FORWARD-LOOKING STATEMENTS
This Report contains forward-looking statements within the meaning of the Private Securities LitigationReform Act of 1995. All statements, other than statements of historical fact, made in this Report areforward looking. Examples of forward-looking statements include statements related to industryprospects, our future economic performance including anticipated revenues and expenditures, results ofoperations or financial position, and other financial items, trends in our business, our business plans andobjectives, including our intended product releases, and may include certain assumptions that underlie theforward-looking statements. We use words such as “anticipate,” “believe,” “expect,” “intend,” “estimate”(and the negative of any of these terms), “future” and similar expressions to help identify forward-lookingstatements. These forward-looking statements are subject to business and economic risk and reflectmanagement’s current expectations, and involve subjects that are inherently uncertain and difficult topredict. Our actual results could differ materially from those in the forward-looking statements. We willnot necessarily update information if any forward-looking statement later turns out to be inaccurate. Risksand uncertainties that may affect our future results include, but are not limited to, those discussed underthe heading “Risk Factors,” beginning on page 8.
PART I
Item 1: Business
Overview
We are a global leader in digital interactive entertainment, with a mission to inspire the world to play. Wedevelop, market, publish and distribute games, content and services that can be played on a variety of platforms,including game consoles, PCs, mobile phones and tablets.
Our Strategic Pillars
There are three core pillars to our strategy:
• Players First
• Commitment to Digital
• One EA
These strategic pillars are built on our focus of delivering a broad and deep portfolio of games and services thatengages players across a wide range of geographies, platforms and business models.
Players First
Players are the foundation of our success, and we are committed to thinking about players first in everything wedo. Our goal is to build deep, on-going and meaningful relationships with our players. We aim to build theserelationships by creating amazing games and services that deliver long-lasting fun and enduring value, byconnecting with our players across platforms and social channels, and by delivering flexibility and innovation inour business models.
Our games and services are based on a portfolio of intellectual property that includes established brands such asFIFA, Madden NFL, Star Wars, Battlefield, the Sims and Need for Speed. We develop and publish a broad anddeep portfolio of games and services that engage players across geographies, platforms and business models.
Commitment to Digital
Players increasingly purchase our games as digital downloads, as opposed to purchasing physical discs, andengage with the live services that we provide on an ongoing basis. Our live services provide additional depth andengagement opportunities for our players and include microtransactions, extra content, subscriptions, and esports.For example, the Ultimate Team mode associated with our sports franchises and live services provided for ourStar Wars, Battlefield and Sims franchises, have extended the life of those games by engaging players over
2
An
nu
alRep
ort
longer periods of time. The digital transformation also is creating opportunities in platforms, content models andthe way in which players engage with our games and services. For example, we have leveraged brands and assetsfrom franchises historically associated with consoles and traditional PC gaming, such as FIFA, Madden NFL,The Sims, SimCity, and Star Wars, to create successful mobile games that are monetized through live servicesprovided with the game. We also offer subscription services, such as EA Access and Origin Access, as we lookto build deeper relationships with our players.
We have significantly increased our digital net revenue from $2.409 billion in fiscal year 2016 to $2.874 billionin fiscal year 2017 and $3.450 billion during fiscal year 2018. It now comprises 67% of our total net revenue. Webelieve that our digital revenue, which generally has a higher gross margin relative to packaged goods revenue,will continue to increase during fiscal year 2019, both relative to packaged goods revenue and in absolute termsas we continue to focus on developing and monetizing products and services that can be delivered digitally.
One EA
As a global leader in digital interactive entertainment, we have an opportunity to leverage our scale to deliverengaging games and services to more players across more platforms. Our “One EA” model provides strategicadvantages. For example, we have moved substantially all of our PC and console development to one gameengine and are working to do the same for the development of our mobile games and services. This transition hascreated operational flexibility as our development teams now code on a consistent engine and can work acrosstitles. In addition, it has accelerated the pace of our development as content and technological advances areleveraged across franchises. We also can transition our products and services to new platforms quickly and cost-effectively.
We also are strengthening our player network, connecting our players to each other and to the games they love.We are adopting consistent, cross-company methodologies to better understand our players’ needs and continueto invest in technology that enables us to build personalized player relationships that can last for years instead ofdays or weeks by connecting our players to us and to each other. This connection allows us to market and delivercontent and services for popular franchises like FIFA, Battlefield and Star Wars to our players more efficiently.That same foundation also enables new player-centric ways to discover and try new games and experiences, suchas our subscription-based EA Access and Origin Access services.
Our Games and Services
We develop, market, publish and deliver games and services that can be played on a variety of platforms,including consoles, PCs, mobile phones and tablets. We market and sell our games and services through digitaldistribution channels and through retail channels. We believe that flexibility across platforms, distributionchannels and business models is critical to maintaining and growing our player base, as well as increasingengagement with our games and services. New platforms, engagement models and business models are expectedto continue to emerge in the future, and we intend to evaluate these opportunities on a case-by-case basis.
Digitally, our console games and services can be purchased through third-party storefronts, such as the digitalstores of our console platform partners Sony, Microsoft and Nintendo. Our direct sales to Sony and Microsoftrepresented approximately 27 percent and 16 percent of total net revenue, respectively, in fiscal 2018;approximately 19 percent and 17 percent of total net revenue, respectively, in fiscal 2017; and approximately16 percent and 14 percent of total net revenue, respectively, in fiscal 2016. Our mobile and tablet games andservices are available through third-party application storefronts such as the Apple App Store and Google Play.Our PC games and services can be downloaded directly through our Origin platform, as well as through third-party online download stores. We also partner with third parties to publish our mobile and PC games and serviceson their platforms in certain Asian territories, such as our partnerships with Tencent Holdings Limited and NexonCo. Ltd. for FIFA Online in China and Korea, respectively. Players also can access a selection of our console andPC games and services through our EA Access and Origin Access subscription services. Our packaged goodsgames are sold directly to mass market retailers, electronics specialty stores and game software specialty storesor through distribution arrangements.
3
In our games and services, we use brands that we either wholly own (such as Battlefield, Mass Effect, Need forSpeed, The Sims and Plants v. Zombies) or license from others (such as FIFA, Madden NFL and Star Wars). Wedevelop and publish games and services across diverse genres such as sports, first-person shooter, action, role-playing and simulation. We believe that the breadth and depth of our portfolio gives us the opportunity to engagean increasing number of players across more platforms and geographies and through more business models.
Our largest and most popular game is FIFA, the annualized version of which is consistently one of the best-selling games in the marketplace. Net revenue from FIFA 18, FIFA 17, and FIFA 16 represented approximately11 percent of our total net revenue in fiscal years 2018, 2017, and 2016, respectively.
Within our games, we offer live services, including microtransactions, downloadable content, subscriptions, andesports, that provide additional depth and engagement opportunities for our players. Our live services net revenuecomprised 40% of our total net revenue during fiscal year 2018 and we expect that live services net revenue willcontinue to be material to our business. Our most popular live service is the Ultimate Team mode associated withour sports franchises. Ultimate Team allows players to collect and trade current and former professional playersin order to build, and compete as, a personalized team. Net revenue from Ultimate Team representedapproximately 21 percent, 16 percent and 15 percent of our total net revenue during fiscal year 2018, 2017 and2016, respectively, a substantial portion of which was derived from FIFA Ultimate Team.
We also are investing in a number of long-term initiatives that we believe will allow us to better serve and deepenour engagement with our players, such as our focus on esports through our Competitive Gaming Division. Webelieve that the interest and enthusiasm that surrounds esports will drive sales of our games and engagement withour live services in addition to providing revenue through partnerships with sponsors and broadcasters.
Significant Relationships
Sony & Microsoft. Under the terms of agreements we have entered into with Sony Computer Entertainment Inc.and its affiliates and with Microsoft Corporation and its affiliates, we are authorized to develop and distributedisc-based and digitally-delivered software products and services compatible with PlayStation and Xboxconsoles, respectively. Under these agreements with Sony and Microsoft, we are provided with the non-exclusiveright to use, for a fixed term and in a designated territory, technology that is owned or licensed by them topublish our games on their respective platform. With respect to our digitally-delivered products and services, theconsole manufacturers pay us either a wholesale price or a “royalty” percentage on the revenue they derive fromtheir sales of our products and services. Our transactions for packaged goods products are made pursuant toindividual purchase orders, which are accepted on a case-by case basis by Sony or Microsoft (or their designatedreplicators), as the case may be. For packaged goods products, we pay the console manufacturers a per-unitroyalty for each unit manufactured. Many key commercial terms of our relationships with Sony andMicrosoft — such as manufacturing terms, delivery times, platform policies and approval conditions — aredetermined unilaterally, and are subject to change by the console manufacturers.
The platform license agreements also require us to indemnify the console manufacturers for any loss, liabilityand expense resulting from any claim against the console manufacturer regarding our games and services,including any claims for patent, copyright or trademark infringement brought against the console manufacturer.Each platform license may be terminated by the console manufacturer if a breach or default by us is not curedafter we receive written notice from the console manufacturer, or if we become insolvent. The consolemanufacturers are not obligated to enter into platform license agreements with us for any future consoles,products or services.
Apple, Google and Other App Stores. We have agreements to distribute our mobile applications and additionalcontent through distributors such as Apple and Google. Our applications are downloaded for mobile devices fromthird party application storefronts. The distributor charges consumers for content purchased within theapplication or charges consumers a one-time fee to download the application. Our distribution agreementsestablish the amounts that are retained by the distributor and the amounts passed through to us. Thesearrangements are typically terminable on short notice. The agreements generally do not obligate the distributorsto market or distribute any of our applications.
4

An
nu
alRep
ort
Publishing Partners in Asia. We have entered into agreements whereby we partner with certain companies,including Tencent Holdings Limited and Nexon Co., Ltd. or their respective affiliates, pursuant to which thesecompanies publish our mobile and PC free-to-download games in certain Asian territories, including China andKorea. Our players access games from the publishers’ platforms and are charged for additional content purchasedwithin our game environment. The agreements generally establish the amounts that are retained by the publisher,and the amounts passed through to us.
Competition
The market for interactive entertainment is intensely competitive and changes rapidly as new products andplatforms are introduced. We also face competition for the right to use certain intellectual property included inour products. We face significant competition from companies such as Activision Blizzard, Take-TwoInteractive, Ubisoft, Bethesda, Epic Games Tencent, Sony and Microsoft, primarily with respect to developinggames and services that operate on consoles, PCs and/or mobile devices.
More broadly, we compete against providers of different sources of entertainment, such as motion pictures,television, social networking, online casual entertainment and music that our players could enjoy in their freetime. Important competitive factors in our industry include game quality and ease of use, innovation,compatibility of products with certain platforms, brand recognition, publisher reputation, reliability, security,price, marketing, and quality of customer service.
Intellectual Property
To establish and protect our intellectual property, we rely on a combination of copyrights, trademarks, patents,patent applications, trade secrets, know-how, license agreements, confidentiality provisions and procedures andother contractual provisions. We actively engage in enforcement and other activities to protect our intellectualproperty. In addition, we engage in activities designed to limit the impact of abuse of our digital products andservices, including monitoring our games for evidence of exploitation and re-balancing our game environmentsin the event that such abuse is discovered.
Governmental Regulation
We are subject to a number of foreign and domestic laws and regulations that affect companies conductingbusiness on the Internet. In addition, laws and regulations that may have an impact on our business relating touser privacy, data collection, retention, electronic commerce, virtual items and currency, consumer protection,content, advertising, localization and information security have been adopted or are being considered foradoption by many countries throughout the world.
Seasonality
We have historically experienced the highest percentage of our sales in our third fiscal quarter due to seasonalholiday demand and the launch timing of our games. While we expect this trend to continue in fiscal year 2019,there is no assurance that it will. In addition, we have historically deferred the recognition of a significant amountof net revenue over an extended period of time. As a result, the quarter in which we generated the highest netbookings has been different from the quarter in which we recognized the highest amount of net revenue. ASU2014-09, Revenue from Contracts with Customers (Topic 606), which is effective for us at the beginning of fiscalyear 2019, will decrease the amount of net revenue that we defer as compared to our historical practices. As aresult, we expect our net revenue and net bookings to align more closely during fiscal year 2019 and beyond.
Employees
As of March 31, 2018, we had approximately 9,300 regular, full-time employees, over 5,800 of whom wereoutside the United States. We believe that our ability to attract and retain qualified employees is a critical factorin the successful development of our products and services and that our future success will depend, in largemeasure, on our ability to continue to attract and retain qualified employees. Approximately 9 percent of ouremployees, all of whom work for our DICE development studio in Sweden, are represented by a union.
5

Investor Information
Our annual reports on Form 10-K, quarterly reports on Form 10-Q and current reports on Form 8-K, and anyamendments to those reports filed pursuant to Section 13(a) or 15(d) of the Securities Exchange Act, as amended,are available free of charge on the Investor Relations section of our website at http://ir.ea.com as soon asreasonably practicable after they are electronically filed with or furnished to the Securities and ExchangeCommission (“SEC”). Except as expressly set forth in this Form 10-K annual report, the contents of our websiteare not incorporated into, or otherwise to be regarded as part of this report.
Company Information
We were incorporated originally in California in 1982. In September 1991, we were reincorporated under thelaws of Delaware. Our principal executive offices are located at 209 Redwood Shores Parkway, Redwood City,California 94065 and our telephone number is (650) 628-1500.
Information about Geographic Areas and Research & Development Expense
Information regarding financial data by geographic area is set forth in Part II, Item 8 of this Form 10-K in theNotes to Consolidated Financial Statements in Note 17, “Segment Information”. Information regarding financialdata is set forth in Part II, Item 6 of this Form 10-K under the heading “Selected Financial Data” and informationregarding certain risks attendant to our foreign operations is set forth in Part I, Item 1A of this Form 10-K underthe heading “Risk Factors”. For the fiscal years ended March 31, 2018, 2017 and 2016, research anddevelopment expenses were $1,320 million, $1,205 million and $1,109 million, respectively.
Executive Officers
The following table sets forth information regarding our executive officers as of May 23, 2018:
Name Age Position
Andrew Wilson . . . . . . . . . . . . . . . . . . . . 43 Chief Executive Officer
Blake Jorgensen . . . . . . . . . . . . . . . . . . . . 58 Chief Operating Officer and Chief Financial Officer
Patrick Söderlund . . . . . . . . . . . . . . . . . . . 44 Chief Design Officer
Laura Miele . . . . . . . . . . . . . . . . . . . . . . . 48 Chief Studios Officer
Kenneth Moss . . . . . . . . . . . . . . . . . . . . . 52 Chief Technology Officer
Christopher Bruzzo . . . . . . . . . . . . . . . . . 48 Chief Marketing Officer
Joel Linzner . . . . . . . . . . . . . . . . . . . . . . . 66 Executive Vice President, Worldwide Business Affairs
Mala Singh . . . . . . . . . . . . . . . . . . . . . . . . 46 Chief People Officer
Matthew Bilbey . . . . . . . . . . . . . . . . . . . . 42 Executive Vice President of Strategic Growth
Kenneth A. Barker . . . . . . . . . . . . . . . . . . 51 Senior Vice President, Chief Accounting Officer
Jacob J. Schatz . . . . . . . . . . . . . . . . . . . . . 49 Executive Vice President, General Counsel and CorporateSecretary
Mr. Wilson has served as EA’s Chief Executive Officer and as a director of EA since September 2013. Prior tohis appointment as our Chief Executive Officer, Mr. Wilson held several positions within the Company sincejoining EA in May 2000, including Executive Vice President, EA SPORTS from August 2011 to September2013. Mr. Wilson serves as a director of Intel Corporation and is chairman of the board of the privately-heldWorld Surf League.
Mr. Jorgensen has served as EA’s Chief Financial Officer since September 2012 and, in addition, became EA’sChief Operating Officer in April 2018. Prior to joining EA, he served as Executive Vice President, ChiefFinancial Officer of Levi Strauss & Co. from July 2009 to August 2012. From June 2007 to June 2009,Mr. Jorgensen served as Executive Vice President, Chief Financial Officer of Yahoo! Inc. Mr. Jorgensen earnedhis M.B.A. from Harvard Business School and his undergraduate degree from Stanford University.
6

An
nu
alRep
ort
Mr. Söderlund has served as EA’s Chief Design Officer since April 2018. From September 2013 to April 2018,he was Executive Vice President, EA Worldwide Studios. Prior to that time, he served as Executive VicePresident, EA Games Label from August 2011 to September 2013. Mr. Söderlund joined EA in October 2006when EA purchased DICE studios where he was the Chief Executive Officer.
Ms. Miele has served as EA’s Chief Studios Officer since April 2018. Ms. Miele joined the Company in March1996 and has held several positions at the Company, including Executive Vice President, Global Publishing fromApril 2016 to April 2018, Senior Vice President of Americas Publishing from June 2014 to April 2016, GeneralManager of the Company’s Star Wars business from June 2013 to June 2014, and several senior roles in theCompany’s marketing organization. Ms. Miele serves on the board of Silicon Valley Community Foundation.
Mr. Moss has served as EA’s Chief Technology Officer since July 2014. He served as Vice President of MarketPlaces Technology, Science and Data at eBay Inc. from November 2011 to July 2014. Prior to joining eBay, heco-founded CrowdEye, Inc. and served as its Chief Executive Officer from October 2008 to November 2011.Mr. Moss graduated from Princeton University.
Mr. Bruzzo has served as EA’s Chief Marketing Officer since September 2014. Prior to joining EA, he served asSenior Vice President at Starbucks Corporation from June 2011 to August 2014. Mr. Bruzzo graduated fromWhitworth University.
Mr. Linzner has served as EA’s Executive Vice President, Worldwide Business Affairs since April 2016. FromMarch 2005 until April 2016, Mr. Linzner was EA’s Executive Vice President, Business and Legal Affairs. Priorto joining EA in July 1999, Mr. Linzner served as outside litigation counsel to EA and several other companies inthe video game industry. Mr. Linzner earned his J.D. from Boalt Hall at the University of California, Berkeley,after graduating from Brandeis University.
Ms. Singh has served as EA’s Chief People Officer since October 2016. Ms. Singh was previously employed byEA from 2009 to 2013, serving as Vice President, Human Resources, EA Labels from 2011 to 2013. Prior torejoining EA, Ms. Singh served as the Chief People Officer of Minted, LLC from January 2014 to October 2016.Ms. Singh earned both her undergraduate and graduate degrees from Rutgers University — New Brunswick.
Mr. Bilbey has served as EA’s Executive Vice President of Strategic Growth since April 2018. Mr. Bilbeyjoined EA in 1995 and has held several positions within the Company, including Chief Operating Officer,Worldwide Studios from August 2016 to April 2018, Senior Vice President, Group General Manager fromNovember 2013 to January 2017, and Vice President, General Manager Development and Marketing, Soccerfrom January 2009 to November 2013.
Mr. Barker has served as Senior Vice President, Chief Accounting Officer since April 2006. From February2012 to September 2012, he also served as Interim Chief Financial Officer. From June 2003 to April 2006,Mr. Barker held the position of Vice President, Chief Accounting Officer. Prior to joining EA, Mr. Barker was atSun Microsystems, Inc., as their Vice President and Corporate Controller from October 2002 to June 2003 andAssistant Corporate Controller from April 2000 to September 2002. Prior to that, he was an audit partner atDeloitte & Touche. Mr. Barker serves on the Board of Directors of Gatepath, a non-profit organization, and onthe Accounting Advisory Board for the University of Notre Dame. Mr. Barker graduated from the University ofNotre Dame.
Mr. Schatz has served as EA’s General Counsel and Corporate Secretary since June 2014. Mr. Schatz joined EAin 1999, and prior to his current role, he served as Deputy General Counsel and as Vice President from 2006 to2014. Mr. Schatz earned his J.D. from Georgetown University Law Center, and received his undergraduatedegree from Pomona College. Mr. Schatz is a member of the Bar of the State of California and is admitted topractice in the United States Supreme Court, the Ninth Circuit Court of Appeals and several United StatesDistrict Courts.
7
Item 1A. Risk Factors
Our business is subject to many risks and uncertainties, which may affect our future financial performance. If anyof the events or circumstances described below occurs, our business or financial performance could be harmed,our actual results could differ materially from our expectations and the market value of our stock could decline.The risks and uncertainties discussed below are not the only ones we face. There may be additional risks anduncertainties not currently known to us or that we currently do not believe could be material that may harm ourbusiness or financial performance.
Our business is intensely competitive and “hit” driven. We may not deliver “hit” products and services, orconsumers may prefer our competitors’ products or services over our own.
Competition in our industry is intense. Many new products and services are regularly introduced in each majorindustry segment (console, mobile and PC), but only a relatively small number of “hit” titles account for asignificant portion of total revenue in each segment. Our competitors range from established interactiveentertainment companies and diversified media companies to emerging start-ups, and we expect new competitorsto continue to emerge throughout the world. If our competitors develop and market more successful and engagingproducts or services, offer competitive products or services at lower price points, or if we do not continue todevelop consistently high-quality, well-received and engaging products and services, our revenue, margins, andprofitability will decline.
We maintain a relatively limited product portfolio in an effort to focus on developing high-quality and engagingproducts with the potential to become hits. High-quality titles, even if highly-reviewed, may not turn into hitproducts. Many hit products within our industry are iterations of prior hit products with large establishedconsumer bases and significant brand recognition, which makes competing in certain product categorieschallenging. In addition, hit products or services of our competitors may take a larger portion of consumerspending or time than we anticipate, which could cause our products and services to underperform relative to ourexpectations. Publishing a relatively small number of major titles each year also concentrates risk in those titlesand means each major title has greater associated risk. A significant portion of our revenue historically has beenderived from games and services based on a few popular franchises, and the underperformance of a single majortitle could have a material adverse impact on our financial results. For example, we have historically derived asignificant portion of our net revenue from sales related to our largest and most popular game, FIFA, theannualized version of which is consistently one of the best-selling games in the marketplace. Any events orcircumstances that negatively impact our FIFA franchise, such as game or service quality, the delay orcancellation of a product or service launch, or real or perceived security risks could negatively impact ourfinancial results to a disproportionate extent.
The increased importance of live services revenue to our business heightens the risks associated with our limitedproduct portfolio. Live services that are either poorly-received or provided in connection with underperforminggames may generate lower than expected sales. Any lapse, delay or failure in our ability to provide high-qualitylive services content to consumers over an extended period of time could materially and adversely affect ourfinancial results, consumer engagement with our live services, and cause harm to our reputation and brand. Ourmost popular live service is the Ultimate Team mode associated with our sports franchises. Any events orcircumstances that negatively impact our ability to reliably provide content or sustain engagement for UltimateTeam, particularly FIFA Ultimate Team, would negatively impact our financial results to a disproportionateextent.
Technology changes rapidly in our business and we may fail to anticipate or successfully implement newtechnologies or adopt new business strategies, technologies or methods.
Rapid technology changes in our industry require us to anticipate, sometimes years in advance, whichtechnologies we must develop, implement and take advantage of in order to make our products and servicescompetitive in the market. We have invested, and in the future may invest, in new business strategies,technologies, products, and services. For example, we are investing in the infrastructure for our EA Player
8

An
nu
alRep
ort
Network which we expect will allow us to market and deliver content and services for our franchises moreefficiently as well as enable new player-centric ways to discover and try new experiences. Such endeavors mayinvolve significant risks and uncertainties, and no assurance can be given that the technology we choose to adoptand the products and services that we pursue will be successful. If we do not successfully implement these newtechnologies, our reputation and brand may be materially adversely affected and our financial condition andoperating results may be impacted. We also may miss opportunities to adopt technology or develop products,services or new ways to engage with our games that become popular with consumers, which could adverselyaffect our financial results. It may take significant time and resources to shift our focus to such technologies,putting us at a competitive disadvantage.
Our development process usually starts with particular platforms and distribution methods in mind, and a rangeof technical development and feature goals that we hope to be able to achieve. We may not be able to achievethese goals, or our competition may be able to achieve them more quickly and effectively than we can. In eithercase, our products and services may be technologically inferior to those of our competitors, less appealing toconsumers, or both. If we cannot achieve our technology goals within the original development schedule for ourproducts and services, then we may delay their release until these goals can be achieved, which may delay orreduce revenue and increase our development expenses. Alternatively, we may increase the resources employedin research and development in an attempt to accelerate our development of new technologies, either to preserveour product or service launch schedule or to keep up with our competition, which would increase ourdevelopment expenses.
We may experience security breaches and cyber threats.
Our industry is prone to, and our systems and networks are subject to, cyber-attacks, computer viruses, worms,phishing attacks, malicious software programs and other information security incidents that seek to exploit,disable, damage, disrupt or gain access to our networks, our products and services, supporting technologicalinfrastructure, intellectual property and other assets. We expect these threats to our systems and networks tocontinue. In addition, we rely on technological infrastructure provided by third-party business partners to supportthe online functionality of our products and services. These business partners, as well as our channel partners,also are subject to cyber risks and threats. Both our partners and we have expended, and expect to continue toexpend, financial and operational resources to implement certain systems, processes and technologies to guardagainst cyber risks and to help protect our data and systems. However, the techniques used to exploit, disable,damage, disrupt or gain access to our networks, our products and services, supporting technologicalinfrastructure, intellectual property and other assets change frequently, continue to evolve in sophistication andvolume, and often are not detected for long periods of time. Our systems, processes and technologies, and thesystems, processes and technologies of our business partners, may not be adequate against all eventualities. Inaddition, the costs to respond to, mitigate, and/or notify affected parties of cyber-attacks and other securityvulnerabilities are significant. Any failure to prevent or mitigate security breaches or cyber risks, or detect orrespond adequately to a security breach or cyber risk, could result in a loss of anticipated revenue, interruptionsto our products and services, cause us to incur significant remediation and notification costs, degrade the userexperience, cause consumers to lose confidence in our products and services and significant legal and financialcosts. This could harm our business, reputation and brand, disrupt our relationships with partners and customersand diminish our competitive position.
The virtual economies that we have established in many of our games are subject to abuse, exploitation and otherforms of fraudulent activity that can negatively impact our business. Virtual economies involve the use of virtualcurrency and/or virtual assets that can be used or redeemed by a player within a particular game or service. Theabuse or exploitation of our virtual economies include the illegitimate generation and sale of virtual items,including in black markets. Our online services have been impacted by in-game exploits and the use ofautomated or other fraudulent processes to generate virtual item or currency illegitimately, and such activity maycontinue. These abuses and exploits, and the steps that we take to address these abuses and exploits may result ina loss of anticipated revenue, increased costs to protect against or remediate these issues, interfere with players’enjoyment of a balanced game environment and cause harm to our reputation and brand.
9

Our business could be adversely affected if our consumer protection, data privacy and security practicesare not adequate, or perceived as being inadequate, to prevent data breaches, or by the application ofconsumer protection and data privacy and security laws generally.
In the course of our business, we collect, process, store and use consumer, employee and other information,including personal information, passwords, credit card information gameplay details and banking information.Although we expend, and expect to continue to expend, financial and operational resources to create and enforcesecurity measures, policies and controls that are designed to protect this information from improper orunauthorized access, acquisition and misuse and/or the uninformed disclosure, our security measures, policiesand controls may not be able successful against all eventualities. The improper or unauthorized access,acquisition or misuse and/or uninformed disclosure of consumer and other information, or a perception that wedo not adequately secure this information or provide consumers with adequate notice about the information thatthey authorize us to disclose, could result in legal liability, costly remedial measures, governmental andregulatory investigations, harm our profitability, reputation and brand, and cause our financial results to bematerially affected. In addition, third party vendors and business partners receive access to information that wecollect. These vendors and business partners may not prevent data security breaches with respect to theinformation we provide them or fully enforce our policies, contractual obligations and disclosures regarding thecollection, use, storage, transfer and retention of personal data. A data security breach of one of our vendors orbusiness partners could cause reputational and financial harm to them and us, negatively impact our ability tooffer our products and services, and could result in legal liability, costly remedial measures, governmental andregulatory investigations, harm our profitability, reputation and brand, and cause our financial results to bematerially affected.
We are subject to payment card association rules and obligations pursuant to contracts with payment cardprocessors. Under these rules and obligations, if information is compromised, we could be liable to payment cardissuers for the cost of associated expenses and penalties. In addition, if we fail to follow payment card industrysecurity standards, even if no consumer information is compromised, we could incur significant fines orexperience a significant increase in payment card transaction costs.
Data privacy, data protection, localization, security and consumer-protection laws are evolving, and theinterpretation and application of these laws in the United States, Europe and elsewhere often are uncertain,contradictory and changing. For example, recent developments in Europe have created compliance uncertaintyand increased the complexity of certain transfers of information from Europe to the United States. In addition,the European General Data Protection Regulation (GDPR), effective as of May 2018 applies to us because wereceive and process the personal data of European Union residents. The GDPR contains significant penalties fornon-compliance. It is possible that these laws may be interpreted or applied in a manner that is adverse to us,unforeseen, or otherwise inconsistent with our practices or that we may not adequately adapt our internal policiesand/or procedures to evolving regulations, any of which could result in litigation, regulatory investigations andpotential legal liability, require us to change our practices in a manner adverse to our business or limit access toour products and services in certain countries. As a result, our reputation and brand may be harmed, we couldincur substantial costs, and we could lose both consumers and revenue.
We may experience outages, disruptions or degradations in our services, products and/or technologicalinfrastructure.
The reliable performance of our products and services increasingly depends on the continuing operation andavailability of our information technology systems and those of our external service providers, including third-party “cloud” computing services. Our games and services are complex software products, and maintaining thesophisticated technological infrastructure required to reliably deliver these games and services is expensive andcomplex. The reliable delivery and stability of our products and services could be adversely impacted by outages,disruptions, failures or degradations in our network and related infrastructure, as well as in the online platformsor services of key business partners who offer or support our products and services. Possible causes of theseoutages, disruptions, failures or degradations include natural disasters, power loss, terrorism, cyber-attacks,
10

An
nu
alRep
ort
computer viruses, bugs or other malware or ransomware that may harm our systems. In addition, we occasionallymigrate data among data centers and to third-party hosted environments and perform upgrades and maintenanceon our systems.
If we were to experience an event that caused a significant system outage, disruption or degradation or if atransition among data centers or service providers or an upgrade or maintenance session encountered unexpectedinterruptions, unforeseen complexity or unplanned disruptions, our products and services may not be available toconsumers or may not be delivered reliably and stably. As a result, our reputation and brand may be harmed,consumer engagement with our products and services may be reduced, and our revenue and profitability could benegatively impacted. We do not have redundancy for all our systems, many of our critical applications reside inonly one of our data centers, and our disaster recovery planning may not account for all eventualities.
As our digital business grows, we will require an increasing amount of technical infrastructure, includingnetwork capacity and computing power to continue to satisfy the needs of consumers. We are investing, andexpect to continue to invest, in technology, hardware and software to support our business, but it is possible thatwe may fail to scale effectively and grow our technical infrastructure to accommodate these increased demands,which may adversely affect the reliable and stable performance of our games and services, therefore negativelyimpacting engagement, reputation, brand and revenue growth.
Negative perceptions about and responses to our brands, products, services and/or business practices maydamage our business, and we may incur costs to address concerns.
Expectations regarding the quality, performance and integrity of our products and services are high. Players maybe critical of our brands, products, services, business models and/or business practices for a wide variety ofreasons, including perceptions about gameplay fun, fairness, game content, features or services, or objections tocertain of our business practices. These negative responses may not be foreseeable. We also may not effectivelymanage these responses because of reasons within or outside of our control. For example, we have included incertain games the ability for players to purchase digital items, including in some instances virtual “packs”,“boxes” or “crates” that contain variable digital items. The inclusion of variable digital items in certain of ourgames has attracted the attention of our community and if the future implementation of these features creates anegative perception of gameplay fairness or other negative perceptions, our reputation and brand could beharmed and our revenue could be negatively impacted. In addition, we have taken actions, including delaying therelease of our games and delaying or discontinuing features and services for our games, after taking intoconsideration, among other things, feedback from our community even if those decisions negatively impactedour operating results in the short term. We expect to continue to take actions to address concerns as appropriate,including actions that may result in additional expenditures and the loss of revenue. Negative sentiment aboutgameplay fairness, our business practices, business models or game content also can lead to investigations orincreased scrutiny from governmental bodies and consumer groups, as well as litigation, which, regardless oftheir outcome, may be costly, damaging to our reputation and harm our business.
Our business depends on the success and availability of platforms developed by third parties and ourability to develop commercially successful products and services for those platforms.
The success of our business is driven in part by the commercial success and adequate supply of third partyplatforms for which we develop our products and services or through which our products and services aredistributed. Our success also depends on our ability to accurately predict which platforms will be successful inthe marketplace, our ability to develop commercially successful products and services for these platforms, ourability to simultaneously manage products and services on multiple platforms and our ability to effectivelytransition our products and services to new platforms. We must make product development decisions and commitsignificant resources well in advance of the commercial availability of new platforms, and we may incursignificant expense to adjust our product portfolio and development efforts in response to changing consumerplatform preferences. Additionally, we may enter into certain exclusive licensing arrangements that affect ourability to deliver or market products or services on certain platforms. A platform for which we are developingproducts and services may not succeed as expected or new platforms may take market share and interactive
11
entertainment consumers away from platforms for which we have devoted significant resources. If consumerdemand for the platforms for which we are developing products and services is lower than our expectations, wemay be unable to fully recover the investments we have made in developing our products and services, and ourfinancial performance will be harmed. Alternatively, a platform for which we have not devoted significantresources could be more successful than we initially anticipated, causing us to not be able to take advantage ofmeaningful revenue opportunities.
Government regulations applicable to us may negatively impact our business.
We are subject to a number of foreign and domestic laws and regulations that affect companies conductingbusiness on the Internet. In addition, laws and regulations relating to user privacy, data collection, retention,consumer protection, content, advertising, localization, and information security have been adopted or are beingconsidered for adoption by many jurisdictions and countries throughout the world. These laws could harm ourbusiness by limiting the products and services we can offer consumers or the manner in which we offer them.The costs of compliance with these laws may increase in the future as a result of changes in interpretation. Anyfailure on our part to comply with these laws or the application of these laws in an unanticipated manner mayharm our business and result in penalties or significant legal liability.
Certain of our business models could be subject to new laws or regulations or evolving interpretations of existinglaws and regulations. For example, the growth and development of electronic commerce, virtual items and virtualcurrency has prompted calls for laws and regulations that could limit or restrict the sale of our products andservices or otherwise impact our products and services. In addition, we include modes in our games that allowplayers to compete against each other and manage player competitions that are based on our products andservices. Although we structure and operate our skill-based competitions with applicable laws in mind, our skill-based competitions in the future could become subject to evolving laws and regulations. New laws related tothese business models, or changes in the interpretation of current laws that impact these business models, couldsubject us to additional regulation and oversight, lessen the engagement with, and growth of, profitable businessmodels, and expose us to increased compliance costs, significant liability, penalties and harm to our reputationand brand.
We are subject to laws in certain foreign countries, and adhere to industry standards in the United States, thatmandate rating requirements or set other restrictions on the advertisement or distribution of interactiveentertainment software based on content. In addition, certain foreign countries allow government censorship ofinteractive entertainment software products. Adoption of ratings systems, censorship or restrictions ondistribution of interactive entertainment software based on content could harm our business by limiting theproducts we are able to offer to our customers. In addition, compliance with new and possibly inconsistentregulations for different territories could be costly, delay or prevent the release of our products in thoseterritories.
We may not meet our product development schedules or key events, sports seasons and/or movies that aretied to our product release schedule to may be delayed, cancelled or poorly received.
Our ability to meet product development schedules is affected by a number of factors both within and outside ourcontrol, including feedback from our players, the creative processes involved, the coordination of large andsometimes geographically dispersed development teams, the complexity of our products and the platforms forwhich they are developed, the need to fine-tune our products prior to their release and, in certain cases, approvalsfrom third parties. We have experienced development delays for our products in the past, which caused us todelay or cancel release dates. We also seek to release certain products in conjunction with key events, such as thebeginning of a sports season, major sporting event, or the release of a related movie. If such a key event weredelayed, cancelled or poorly received, our sales likely would suffer materially. Any failure to meet anticipatedproduction or release schedules likely would result in a delay of revenue and/or possibly a significant shortfall inour revenue, increase our development and/or marketing expenses, harm our profitability, and cause ouroperating results to be materially different than anticipated.
12

An
nu
alRep
ort
Historically our business has been highly seasonal with the highest percentage of our sales occurring in thequarter ending in December. While we expect this trend to continue in fiscal year 2019, there is no assurance thatit will be so. If we miss key selling periods for products or services for any reason, including product delays orproduct cancellations our sales likely will suffer significantly. Additionally, macroeconomic conditions or theoccurrence of unforeseen events that negatively impact consumer or retailer buying patterns, particularly duringthe quarter ending in December, likely will harm our financial performance disproportionately.
Our marketing and advertising efforts may fail to resonate with consumers.
Our products and services are marketed worldwide through a diverse spectrum of advertising and promotionalprograms, such as online and mobile advertising, television advertising, retail merchandising, marketing throughwebsites, event sponsorship and direct communications with consumers including via email. Furthermore, anincreasing portion of our marketing activity is taking place on social media platforms that are outside of ourdirect control. Our ability to sell our products and services is dependent in part upon the success of theseprograms, and changes to consumer preferences, marketing regulations, technology changes or servicedisruptions may negatively impact our ability to reach our customers. Moreover, if the marketing for ourproducts and services fails to resonate with our customers, particularly during the critical holiday season orduring other key selling periods, or if advertising rates or other media placement costs increase, our business andoperating results could be harmed.
We may not attract and retain key personnel.
The market for technical, creative, marketing and other personnel essential to the development, marketing andsupport of our products and services and management of our businesses is extremely competitive. Our leadingposition within the interactive entertainment industry makes us a prime target for recruiting our executives, aswell as key creative and technical talent. We may experience significant compensation costs to hire and retainsenior executives and other personnel that we deem critical to our success. If we cannot successfully recruit andretain qualified employees, or replace key employees following their departure, our ability to develop andmanage our business will be impaired.
We may experience declines or fluctuations in the recurring portion of our business.
Our business model includes revenue that we deem recurring in nature, such as revenue from our annualizedtitles (e.g., FIFA and Madden NFL) and associated services, subscriptions and our ongoing mobilebusinesses. While we have been able to forecast the revenue from these areas of our business with greaterrelative confidence than for new games, services and business models, we cannot provide assurances thatconsumer demand will remain consistent. Furthermore, we may cease to offer games and services that wepreviously had deemed to be recurring in nature. Consumer demand may decline or fluctuate as a result of anumber of factors, including their level of satisfaction with our games and services, our ability to improve andinnovate our annualized titles, our ability to adapt our games and services to new platforms and business models,outages and disruptions of online services, the games and services offered by our competitors, our marketing andadvertising efforts or declines in consumer activity generally as a result of economic downturns, among others.The reception to our licensed sports games may be adversely impacted by circumstances outside our controlimpacting the sports leagues and organizations. Any decline or fluctuation in the recurring portion of ourbusiness may have a negative impact on our financial and operating results.
We could fail to successfully adopt new business models.
From time to time we seek to establish and implement new business models. Forecasting the success of any newbusiness model is inherently uncertain and depends on a number of factors both within and outside of our control.Our actual revenue and profit for these businesses may be significantly greater or less than our forecasts. Inaddition, these new business models could fail, resulting in the loss of our investment in the development andinfrastructure needed to support these new business models, as well as the opportunity cost of divertingmanagement and financial resources away from more successful and established businesses. For example, we
13

have devoted financial and operational resources to our subscription offerings without any assurance that thesebusinesses will be financially successful. While we anticipate growth in this area of our business, consumerdemand is difficult to predict as a result of a number of factors, including satisfaction with our products andservices, our ability to provide engaging products and services, products and services offered by our competitors,reliability of our infrastructure, pricing, the actual or perceived security of our information technology systemsand reductions in consumer spending levels. In addition, if our subscription offerings are successful, sales couldbe diverted from established business models. If we do not select a target price that is optimal for oursubscription services, maintain our target pricing structure or correctly project renewal rates, our financial resultsmay be harmed.
Acquisitions, investments, divestitures and other strategic transactions could result in operating difficultiesand other negative consequences.
We have made and may continue to make acquisitions or enter into other strategic transactions including(1) acquisitions of companies, businesses, intellectual properties, and other assets, (2) minority investments instrategic partners, and (3) investments in new interactive entertainment businesses as part of our long-termbusiness strategy. These transactions involve significant challenges and risks including that the transaction doesnot advance our business strategy, that we do not realize a satisfactory return on our investment, that we acquireliabilities, that our due diligence process does not identify significant issues, liabilities or other challenges,diversion of management’s attention from our other businesses, the incurrence of debt, contingent liabilities oramortization expenses, write-offs of goodwill, intangibles, or acquired in-process technology, or other increasedcash and non-cash expenses. In addition, we may not integrate these businesses successfully, for example withdifficulties with the integration of business systems and technologies, the integration and retention of newemployees, the implementation or remediation of the internal control environment of the acquired entity, or themaintenance of key business and customer relationships. These events could harm our operating results orfinancial condition. We also may divest or sell assets or a business and we may have difficulty selling such assetsor business on acceptable terms in a timely manner. This could result in a delay in the achievement of ourstrategic objectives, cause us to incur additional expense, or the sale of such assets or business at a price or onterms that are less favorable than we anticipated.
We may be unable to maintain or acquire licenses to include intellectual property owned by others in ourgames, or to maintain or acquire the rights to publish or distribute games developed by others.
Many of our products and services are based on or incorporate intellectual property owned by others. Forexample, our EA Sports products include rights licensed from major sports leagues and players’ associations andour Star Wars products include rights licensed from Disney. Competition for these licenses and rights is intense.If we are unable to maintain these licenses and rights or obtain additional licenses or rights with significantcommercial value, our ability to develop and successful and engaging games and services may be adverselyaffected and our revenue, profitability and cash flows may decline significantly. Competition for these licensesalso may increase the amounts that we must pay to licensors and developers, through higher minimum guaranteesor royalty rates, which could significantly increase our costs and reduce our profitability.
We rely on the platforms of our channel partners who have significant influence over the products andservices that we offer on their platforms.
A significant percentage of our digital net revenue is attributable to sales of products and services through oursignificant channel partners, including Sony, Microsoft, Nintendo, Apple and Google. The concentration of amaterial portion of our digital sales in these channel partners exposes us to risks associated with these businesses.Any deterioration in the businesses of our channel partners could disrupt and harm our business, including bylimiting the channels through which our digital products and services are offered and exposing us to collectionrisks.
In addition, our license agreements with our channel partners typically give them significant control over theapproval, manufacturing and distribution of the products and services that we develop for their platform. In
14

An
nu
alRep
ort
particular, our arrangements with Sony and Microsoft could, in certain circumstances, leave us unable to get ourproducts and services approved, manufactured or distributed to customers. For our digital products and servicesdelivered via digital channels maintained by, among others, Sony, Microsoft, Nintendo, Apple and Google, eachrespective channel partner has policies and guidelines that control the promotion and distribution of these titlesand the features and functionalities that we are permitted to offer through the channel. In addition, we aredependent on our channel partners to invest in, and upgrade, digital commerce capabilities in a manner thancorresponds to the way in which consumers purchase our products and services. Failure by our channels partnersto keep pace with consumer preferences could have an adverse impact on our ability to merchandise andcommercialize our products and services which could harm our business and/or financial results.
Moreover, certain of our channel partners can determine and change unilaterally certain key terms andconditions, including the ability to change their user and developer policies and guidelines. In many cases ourchannel partners also set the rates that we must pay to provide our games and services through their onlinechannels, and retain flexibility to change their fee structures or adopt different fee structures for their onlinechannels, which could adversely impact our costs, profitability and margins. In addition, our channel partnerscontrol the information technology systems through which online sales of our products and service channels arecaptured. If our channel partners establish terms that restrict our offerings through their channels, significantlyimpact the financial terms on which these products or services are offered to our customers, or their informationtechnology systems fail or cause an unanticipated delay in reporting, our business and/or financial results couldbe materially affected.
Our business is subject to risks generally associated with the entertainment industry.
Our business is subject to risks that are generally associated with the entertainment industry, many of which arebeyond our control. These risks could negatively impact our operating results and include: the popularity, priceand timing of our games, economic conditions that adversely affect discretionary consumer spending, changes inconsumer demographics, the availability and popularity of other forms of entertainment, and critical reviews andpublic tastes and preferences, which may change rapidly and cannot necessarily be predicted.
Our business partners may be unable to honor their obligations to us or their actions may put us at risk.
We rely on various business partners, including third-party service providers, vendors, licensing partners,development partners, and licensees in many areas of our business. Their actions may put our business and ourreputation and brand at risk. For example, we may have disputes with our business partners that may impact ourbusiness and/or financial results. In many cases, our business partners may be given access to sensitive andproprietary information in order to provide services and support to our teams, and they may misappropriate ourinformation and engage in unauthorized use of it. In addition, the failure of these third parties to provide adequateservices and technologies, or the failure of the third parties to adequately maintain or update their services andtechnologies, could result in a disruption to our business operations. Further, disruptions in the financial markets,economic downturns, poor business decisions, or reputational harm may adversely affect our business partners andthey may not be able to continue honoring their obligations to us or we may cease our arrangements with them.Alternative arrangements and services may not be available to us on commercially reasonable terms or we mayexperience business interruptions upon a transition to an alternative partner or vendor. If we lose one or moresignificant business partners, our business could be harmed and our financial results could be materially affected.
The products or services we release may contain defects, bugs or errors.
Our products and services are extremely complex software programs, and are difficult to develop and distribute.We have quality controls in place to detect defects, bugs or other errors in our products and services before theyare released. Nonetheless, these quality controls are subject to human error, overriding, and reasonable resourceor technical constraints. Therefore, these quality controls and preventative measures may not be effective indetecting all defects, bugs or errors in our products and services before they have been released into themarketplace. In such an event, the technological reliability and stability of our products and services could bebelow our standards and the standards of consumers and our reputation, brand and sales could be adverselyaffected. In addition, we could be required to, or may find it necessary to, offer a refund for the product or
15

service, suspend the availability or sale of the product or service or expend significant resources to cure thedefect, bug or error each of which could significantly harm our business and operating results.
We may be subject to claims of infringement of third-party intellectual property rights.
From time to time, third parties may claim that we have infringed their intellectual property rights. For example,patent holding companies may assert patent claims against us in which they seek to monetize patents they havepurchased or otherwise obtained. Although we take steps to avoid knowingly violating the intellectual propertyrights of others, it is possible that third parties still may claim infringement.
Existing or future infringement claims against us, whether valid or not, may be expensive to defend and divertthe attention of our employees from business operations. Such claims or litigation could require us to paydamages and other costs. We also could be required to stop selling, distributing or supporting products, featuresor services which incorporate the affected intellectual property rights, redesign products, features or services toavoid infringement, or obtain a license, all of which could be costly and harm our business.
In addition, many patents have been issued that may apply to potential new modes of delivering, playing ormonetizing interactive entertainment software products and services, such as those that we produce or would liketo offer in the future. We may discover that future opportunities to provide new and innovative modes of gameplay and game delivery to consumers may be precluded by existing patents that we are unable to license onreasonable terms.
From time to time we may become involved in other legal proceedings.
We are currently, and from time to time in the future may become, subject to legal proceedings, claims, litigationand government investigations or inquiries, which could be expensive, lengthy, disruptive to normal businessoperations and occupy a significant amount of our employees’ time and attention. In addition, the outcome of anylegal proceedings, claims, litigation, investigations or inquiries may be difficult to predict and could have amaterial adverse effect on our business, operating results, or financial condition.
Our products and brands are subject to the threat of piracy, unauthorized copying and other forms ofintellectual property infringement.
We regard our products and brands as proprietary and take measures to protect our products, brands and otherconfidential information from infringement. We are aware that some unauthorized copying of our products andbrands occurs, and if a significantly greater amount were to occur, it could negatively impact our business.
Piracy and other forms of unauthorized copying and use of our content and brands are persistent problems for us,and policing is difficult. Further, the laws of some countries in which our products are or may be distributedeither do not protect our products and intellectual property rights to the same extent as the laws of the UnitedStates, or are poorly enforced. Legal protection of our rights may be ineffective in such countries. In addition,although we take steps to enforce and police our rights, factors such as the proliferation of technology designedto circumvent the protection measures used by our business partners or by us, the availability of broadbandaccess to the Internet, the refusal of Internet service providers or platform holders to remove infringing content incertain instances, and the proliferation of online channels through which infringing product is distributed all havecontributed to an expansion in unauthorized copying of our products and brands.
We may experience outages, disruptions and/or degradations of our infrastructure.
We may experience outrages, disruptions and/or degradations of our infrastructure, including informationtechnology system failures and network disruptions. These may be caused by natural disasters, cyber-incidents,weather events, power disruptions, telecommunications failures, failed upgrades of existing systems ormigrations to new systems, acts of terrorism or other events, including cyber-attacks or malicious software
16

An
nu
alRep
ort
programs that exploit vulnerabilities. System redundancy may be ineffective or inadequate, and our disasterrecovery planning may not be sufficient for all eventualities. Such failures or disruptions could prevent access toour products, services or online stores selling our products and services or interruption in our ability to conductcritical business functions. Our corporate headquarters in Redwood City, CA and our studios in Los Angeles,California, Seattle, Washington and in Burnaby, British Columbia are located in seismically active regions, andcertain of our game development activities and other essential business operations are conducted at theselocations. An event that results in the disruption or degradation of any of our critical business or informationtechnology systems could harm our ability to conduct normal business operations and materially impact ourreputation and brand, financial condition and operating results.
A significant portion of our packaged goods sales are made to a relatively small number of retail anddistribution partners, and these sales may be disrupted.
We derive a significant percentage of our net revenue attributable to sales of our packaged goods products to ourtop retail and distribution partners. The concentration of a significant percentage of these sales through a fewlarge partners could lead to a short-term disruption to our business if certain of these partners significantlyreduced their purchases or ceased to offer our products. We also could be more vulnerable to collection risk ifone or more of these partners experienced a deterioration of their business or declared bankruptcy. Additionally,receivables from these partners generally increase in our December fiscal quarter as sales of our productsgenerally increase in anticipation of the holiday season. Having a significant portion of our packaged goods salesconcentrated in a few partners could reduce our negotiating leverage with them. If one or more of these partnersexperience deterioration in their business, or become unable to obtain sufficient financing to maintain theiroperations, our business could be harmed.
External game developers may not meet product development schedules or otherwise honor theirobligations.
We may contract with external game developers to develop our games or to publish or distribute their games.While we maintain contractual protections, we have less control over the product development schedules ofgames developed by external developers, and we depend on their ability to meet product development schedules.In addition, we may have disputes with external developers over game content, launch timing, achievement ofcertain milestones, the game development timeline, marketing campaigns or other matters. If we have disputeswith external developers or they cannot meet product development schedules, acquire certain approvals or areotherwise unable or unwilling to honor their obligations to us, we may delay or cancel previously announcedgames, alter our launch schedule or experience increased costs and expenses, which could result in a delay orsignificant shortfall in anticipated revenue, harm our profitability and reputation, and cause our financial resultsto be materially affected.
Our financial results are subject to currency fluctuations.
International sales are a fundamental part of our business. For our fiscal year ended March 31, 2018, internationalnet revenue comprised 59 percent of our total net revenue, and we expect our international business to continueto account for a significant portion of our total net revenue. As a result of our international sales, and also thedenomination of our foreign investments and our cash and cash equivalents in foreign currencies, we are exposedto the effects of fluctuations in foreign currency exchange rates. Strengthening of the U.S. dollar, particularlyrelative to the Euro, British pound sterling, Australian dollar, Chinese yuan and South Korean won, has anegative impact on our reported international net revenue but a positive impact on our reported internationaloperating expenses (particularly when the U.S. dollar strengthens against the Swedish krona and the Canadiandollar) because these amounts are translated at lower rates. We use foreign currency hedging contracts tomitigate some foreign currency risk. However, these activities are limited in the protection they provide us fromforeign currency fluctuations and can themselves result in losses.
17
We utilize debt financing and such indebtedness could adversely impact our business and financialcondition.
We have $1 billion in senior unsecured notes outstanding as well as an unsecured committed $500 millionrevolving credit facility. While the facility is currently undrawn, we may use the proceeds of any futureborrowings for general corporate purposes. We may also enter into other financial instruments in the future.
Our indebtedness could affect our financial condition and future financial results by, among other things:
• Requiring the dedication of a substantial portion of any cash flow from operations to the payment ofprincipal of, and interest on, our indebtedness, thereby reducing the availability of such cash flow tofund our growth strategy, working capital, capital expenditures and other general corporate purposes;
• Limiting our flexibility in planning for, or reacting to, changes in our business and our industry; and
• Increasing our vulnerability to adverse changes in general economic and industry conditions.
The agreements governing our indebtedness impose restrictions on us and require us to maintain compliance withspecified covenants. In particular, the revolving credit facility includes a maximum capitalization ratio andminimum liquidity requirements. Our ability to comply with these covenants may be affected by events beyondour control. If we breach any of these covenants and do not obtain a waiver from the lenders or noteholders, then,subject to applicable cure periods, our outstanding indebtedness may be declared immediately due and payable.In addition, changes by any rating agency to our credit rating may negatively impact the value and liquidity ofboth our debt and equity securities, as well as the potential costs associated with any potential refinancing ourindebtedness. Downgrades in our credit rating could also restrict our ability to obtain additional financing in thefuture and could affect the terms of any such financing.
Changes in our tax rates or exposure to additional tax liabilities could adversely affect our earnings andfinancial condition.
We are subject to taxes in the United States and in various foreign jurisdictions. Significant judgment is requiredin determining our worldwide income tax provision, tax assets, and accruals for other taxes, and there are manytransactions and calculations where the ultimate tax determination is uncertain. Our effective income tax rate isbased in part on our corporate operating structure and the manner in which we operate our business and develop,value and use our intellectual property. Taxing authorities in jurisdictions in which we operate may challenge ourmethodologies for calculating our income tax provision or its underlying assumptions, which could increase oureffective income tax rate and have an adverse impact on our results of operations and cash flows. In addition, ourprovision for income taxes could be adversely affected by our profit levels, changes in our business, changes inthe mix of earnings in countries with differing statutory tax rates, changes in the elections we make, changes inapplicable tax laws or interpretations of existing tax laws, or changes in the valuation allowance for deferred taxassets, as well as other factors.
The Tax Cuts and Jobs Act (the “U.S. Tax Act”), enacted on December 22, 2017, represents a significantoverhaul to the U.S. federal tax code. This tax legislation lowers the U.S. statutory tax rate, but also includes anumber of provisions that could significantly and adversely impact our U.S. federal income tax position in areporting period, including the limitation or elimination of certain deductions or credits, and U.S. taxes onforeign earnings. The final calculation of tax expense resulting from the U.S. Tax Act may differ from ourestimates, potentially materially. In addition, any further changes to tax laws applicable to corporatemultinationals in the countries in which we do business could adversely affect our effective tax rates, cause us tochange the way in which we structure our business or result in other costs.
We are also required to pay taxes other than income taxes, such as payroll, sales, use, value-added, net worth,property and goods and services taxes, in both the United States and foreign jurisdictions. Furthermore, we areregularly subject to audit by tax authorities with respect to both income and such other non-income taxes.Unfavorable audit results or tax rulings, or other changes resulting in significant additional tax liabilities, couldhave material adverse effects upon our earnings, cash flows, and financial condition.
18

An
nu
alRep
ort
Our reported financial results could be adversely affected by changes in financial accounting standards.
Our reported financial results are impacted by the accounting standards promulgated by the SEC and nationalaccounting standards bodies and the methods, estimates, and judgments that we use in applying our accountingpolicies. These methods, estimates, and judgments are subject to risks, uncertainties, assumptions and changesthat could adversely affect our reported financial position and financial results. In addition, changes to applicablefinancial accounting standards could adversely affect our reported financial position and financial results. Forexample, ASU 2014-09, Revenue from Contracts with Customers (Topic 606), which is effective for us at thebeginning of fiscal 2019, will materially change the way in which we recognize revenue and will require us tochange how we report mobile platform fees. For more information on ASU 2014-09 and other accountingstandards, see Part II, Item 8 of this Form 10-K in the Notes to Consolidated Financial Statements in Note 1 —Description of Business and Basis of Presentation under the subheading “Impact of Recently Issued AccountingStandards”.
As we enhance, expand and diversify our business and product offerings, the application of existing or futurefinancial accounting standards, particularly those relating to the way we account for revenue, costs and taxes,could have an adverse effect on our reported results although not necessarily on our cash flows.
Our stock price has been volatile and may continue to fluctuate significantly.
The market price of our common stock historically has been, and we expect will continue to be, subject tosignificant fluctuations. These fluctuations may be due to factors specific to us (including those discussed in therisk factors above, as well as others not currently known to us or that we currently do not believe are material), tochanges in securities analysts’ earnings estimates or ratings, to our results or future financial guidance fallingbelow our expectations and analysts’ and investors’ expectations, to factors affecting the entertainment,computer, software, Internet, media or electronics industries, to our ability to successfully integrate anyacquisitions we may make, or to national or international economic conditions. In particular, economicdownturns may contribute to the public stock markets experiencing extreme price and trading volume volatility.These broad market fluctuations could adversely affect the market price of our common stock.
19
Item 1B: Unresolved Staff Comments
None.
Item 2: Properties
We own our 660,000-square-foot Redwood Shores headquarters facilities located in Redwood City, California,which includes development studios, administrative, sales and marketing functions. We also own a418,000-square-foot development studio facility in Burnaby, Canada and a 76,000-square-foot developmentstudio facility in Chatsworth, California. In addition to the properties we own, we lease approximately 740,000square feet in North America and 866,000 square feet in Europe and Asia at various locations at which weconduct research and development, sales and administration functions, including leases for our developmentstudios in Orlando, Florida, Stockholm, Sweden and Austin, Texas.
While we continually evaluate our facility requirements, we believe that suitable additional or substitute spacewill be available as needed to accommodate our future needs. For information regarding our lease commitments,see Part II, Item 8 of this Form 10-K in the Notes to Consolidated Financial Statements in Note 12,“Commitments and Contingencies”.
Item 3: Legal Proceedings
On July 29, 2010, Michael Davis, a former NFL running back, filed a putative class action in the United StatesDistrict Court for the Northern District of California against the Company, alleging that certain past versions ofMadden NFL included the images of certain retired NFL players without their permission. In March 2012, thetrial court denied the Company’s request to dismiss the complaint on First Amendment grounds. In January 2015,that trial court decision was affirmed by the Ninth Circuit Court of Appeals and the case was remanded back tothe United States District Court for the Northern District of California, where the case is pending.
We are also subject to claims and litigation arising in the ordinary course of business. We do not believe that anyliability from any reasonably foreseeable disposition of such claims and litigation, individually or in theaggregate, would have a material adverse effect on our Consolidated Financial Statements.
Item 4: Mine Safety Disclosures
Not applicable.
20

An
nu
alRep
ort
PART II
Item 5: Market for Registrant’s Common Equity, Related Stockholder Matters and Issuer Purchases ofEquity Securities
Market Information
Our common stock is traded on the NASDAQ Global Select Market under the symbol “EA”. The following tablesets forth the quarterly high and low closing sales price per share of our common stock from April 1, 2016through March 31, 2018.
Prices
High Low
Fiscal Year Ended March 31, 2017:First Quarter . . . . . . . . . . . . . . . . . . . . . . . . . . . . . . . . . . . . . . . . . . . . . . . . . . . . . . . . . . . . . $ 77.25 $ 61.85Second Quarter . . . . . . . . . . . . . . . . . . . . . . . . . . . . . . . . . . . . . . . . . . . . . . . . . . . . . . . . . . . 85.40 75.38Third Quarter . . . . . . . . . . . . . . . . . . . . . . . . . . . . . . . . . . . . . . . . . . . . . . . . . . . . . . . . . . . . . 85.56 75.58Fourth Quarter . . . . . . . . . . . . . . . . . . . . . . . . . . . . . . . . . . . . . . . . . . . . . . . . . . . . . . . . . . . . 91.51 78.64
Fiscal Year Ended March 31, 2018:First Quarter . . . . . . . . . . . . . . . . . . . . . . . . . . . . . . . . . . . . . . . . . . . . . . . . . . . . . . . . . . . . . 115.37 88.40Second Quarter . . . . . . . . . . . . . . . . . . . . . . . . . . . . . . . . . . . . . . . . . . . . . . . . . . . . . . . . . . . 121.97 105.42Third Quarter . . . . . . . . . . . . . . . . . . . . . . . . . . . . . . . . . . . . . . . . . . . . . . . . . . . . . . . . . . . . . 120.09 100.83Fourth Quarter . . . . . . . . . . . . . . . . . . . . . . . . . . . . . . . . . . . . . . . . . . . . . . . . . . . . . . . . . . . . 129.12 107.19
Holders
There were approximately 1,159 holders of record of our common stock as of May 21, 2018, and the closingprice of our common stock was $132.91 per share as reported by the NASDAQ Global Select Market. Inaddition, a significant number of beneficial owners of our common stock hold their shares in street name.
Dividends
We have not paid any cash dividends and do not anticipate paying cash dividends in the foreseeable future.
Issuer Purchases of Equity Securities
In May 2015, our Board of Directors authorized a program to repurchase up to $1 billion of our common stock.We repurchased approximately 0.3 million, 6.5 million and 6.9 million shares for approximately $31 million,$508 million and $461 million under this program, respectively, during the fiscal years ended March 31, 2018,2017 and 2016. We completed repurchases under the May 2015 program in April 2017.
In May 2017, a Special Committee of our Board of Directors, on behalf of the full Board of Directors, authorizeda program to repurchase up to $1.2 billion of our common stock. During the fiscal year ended March 31, 2018,we repurchased approximately 5.0 million shares for approximately $570 million under this program. Thisprogram was superseded and replaced by the stock repurchase program approved in May 2018.
The following table summarizes the number of shares repurchased in the fourth quarter of the fiscal year endedMarch 31, 2018:
Fiscal Month
Total Numberof Shares
PurchasedAverage PricePaid per Share
Total Number ofShares Purchased as
part of PubliclyAnnounced Programs
Maximum DollarValue that May
Still Be PurchasedUnder the Programs
(in millions)
December 31, 2017 — January 27, 2018 . . . 383,359 $111.99 383,359 $735January 28 — February 24, 2018 . . . . . . . . . 378,509 $122.48 378,509 $688February 25 — March 31, 2018 . . . . . . . . . . 468,110 $126.11 468,110 $629
1,229,978 $120.59 1,229,978
21

Stock Performance Graph
The following information shall not be deemed to be “filed” with the SEC nor shall this information beincorporated by reference into any future filing under the Securities Act of 1933, as amended, or the ExchangeAct, as amended, except to the extent that we specifically incorporate it by reference into a filing.
The following graph shows a five-year comparison of cumulative total returns during the period from March 31,2013 through March 31, 2018, for our common stock, the S&P 500 Index (to which EA was added in July 2002),the NASDAQ Composite Index, and the RDG Technology Composite Index, each of which assumes an initialvalue of $100. Each measurement point is as of the end of each fiscal year. The performance of our stockdepicted in the following graph is not necessarily indicative of the future performance of our stock.
COMPARISON OF 5 YEAR CUMULATIVE TOTAL RETURN*Among Electronic Arts Inc., the S&P 500 Index, the NASDAQ Composite Index,
and the RDG Technology Composite Index
$0
$100
$200
$300
$400
$500
$600
$800
$700
Electronic Arts Inc. S&P 500
NASDAQ Composite RDG Technology Composite
3/183/173/163/153/143/13
* Based on $100 invested on March 31, 2013 in stock or index, including reinvestment of dividends.
March 31,
2013 2014 2015 2016 2017 2018
Electronic Arts Inc. . . . . . . . . . . . . . . . . . . . . . . . . . . . . . . . . . . . . . . . $100 $164 $332 $374 $506 $685S&P 500 Index . . . . . . . . . . . . . . . . . . . . . . . . . . . . . . . . . . . . . . . . . . 100 122 137 140 164 187NASDAQ Composite Index . . . . . . . . . . . . . . . . . . . . . . . . . . . . . . . . 100 131 154 156 190 229RDG Technology Composite Index . . . . . . . . . . . . . . . . . . . . . . . . . . 100 129 151 156 195 248
22

An
nu
alRep
ort
Item 6: Selected Financial Data
ELECTRONIC ARTS INC. AND SUBSIDIARIES
SELECTED FIVE-YEAR CONSOLIDATED FINANCIAL DATA
(In millions, except per share data)
Year Ended March 31,
STATEMENTS OF OPERATIONS DATA 2018 2017 2016 2015 2014
Net revenue . . . . . . . . . . . . . . . . . . . . . . . . . . . . . . . . . . . . . . . . . . . $5,150 $4,845 $4,396 $4,515 $3,575Cost of revenue . . . . . . . . . . . . . . . . . . . . . . . . . . . . . . . . . . . . . . . . . 1,277 1,298 1,354 1,429 1,347
Gross profit . . . . . . . . . . . . . . . . . . . . . . . . . . . . . . . . . . . . . . . . . . 3,873 3,547 3,042 3,086 2,228Total operating expenses . . . . . . . . . . . . . . . . . . . . . . . . . . . . . . . . . 2,439 2,323 2,144 2,138 2,195
Operating income . . . . . . . . . . . . . . . . . . . . . . . . . . . . . . . . . . . . . 1,434 1,224 898 948 33Interest and other income (expense), net . . . . . . . . . . . . . . . . . . . . . 15 (14) (21) (23) (26)
Income before provision for (benefit from) income taxes . . . . . . 1,449 1,210 877 925 7Provision for (benefit from) income taxes . . . . . . . . . . . . . . . . . . . . 406 243 (279) 50 (1)
Net income . . . . . . . . . . . . . . . . . . . . . . . . . . . . . . . . . . . . . . . . . . $1,043 $ 967 $1,156 $ 875 $ 8
Earnings per share:Basic . . . . . . . . . . . . . . . . . . . . . . . . . . . . . . . . . . . . . . . . . . . . . $ 3.39 $ 3.19 $ 3.73 $ 2.81 $ 0.03Diluted . . . . . . . . . . . . . . . . . . . . . . . . . . . . . . . . . . . . . . . . . . . $ 3.34 $ 3.08 $ 3.50 $ 2.69 $ 0.03
Number of shares used in computation:Basic . . . . . . . . . . . . . . . . . . . . . . . . . . . . . . . . . . . . . . . . . . . . . 308 303 310 311 308Diluted . . . . . . . . . . . . . . . . . . . . . . . . . . . . . . . . . . . . . . . . . . . 312 314 330 325 316
As of March 31,
BALANCE SHEETS DATA 2018 2017 2016 2015 2014
Cash and cash equivalents . . . . . . . . . . . . . . . . . . . . . . . . . . . . . . . . $4,258 $2,565 $2,493 $2,068 $1,782Short-term investments . . . . . . . . . . . . . . . . . . . . . . . . . . . . . . . . . . 1,073 1,967 1,341 953 583Working capital . . . . . . . . . . . . . . . . . . . . . . . . . . . . . . . . . . . . . . . . 3,513 2,784 1,936 973 748Total assets . . . . . . . . . . . . . . . . . . . . . . . . . . . . . . . . . . . . . . . . . . . . 8,584 7,718 7,050 6,147 5,7160.75% convertible senior notes due 2016, net . . . . . . . . . . . . . . . . . — — 163 633 580Senior notes, net . . . . . . . . . . . . . . . . . . . . . . . . . . . . . . . . . . . . . . . . 992 990 989 — —Other long-term liabilities . . . . . . . . . . . . . . . . . . . . . . . . . . . . . . . . 506 253 245 333 324Total liabilities . . . . . . . . . . . . . . . . . . . . . . . . . . . . . . . . . . . . . . . . . 3,989 3,658 3,652 3,080 3,294Total stockholders’ equity . . . . . . . . . . . . . . . . . . . . . . . . . . . . . . . . 4,595 4,060 3,396 3,036 2,422
23
Item 7: Management’s Discussion and Analysis of Financial Condition and Results of Operations
OVERVIEW
The following overview is a high-level discussion of our operating results, as well as some of the trends anddrivers that affect our business. Management believes that an understanding of these trends and drivers providesimportant context for our results for the fiscal year ended March 31, 2018, as well as our future prospects. Thissummary is not intended to be exhaustive, nor is it intended to be a substitute for the detailed discussion andanalysis provided elsewhere in this Form 10-K, including in the “Business” section and the “Risk Factors” above,the remainder of this “Management’s Discussion and Analysis of Financial Condition and Results of Operations(“MD&A”)”, and the Consolidated Financial Statements and related Notes.
About Electronic Arts
We are a global leader in digital interactive entertainment, with a mission to inspire the world to play. Wedevelop, market, publish and deliver games and services that can be played on a variety of platforms, includinggame consoles, PCs, mobile phones and tablets. In our games and services, we use brands that we either whollyown (such as Battlefield, Mass Effect, The Sims and Plants v. Zombies), or license from others (such as FIFA,Madden NFL and Star Wars). We develop and publish games and services across diverse genres such as sports,first-person shooter, action, role-playing and simulation. We believe that the breadth and depth of our portfoliogives us the opportunity to engage an increasing number of players across more platforms and geographies andthrough more business models.
Financial Results
Our key financial results for our fiscal year ended March 31, 2018 were as follows:
• Total net revenue was $5,150 million, up 6 percent year-over-year. On a constant currency basis, net ofhedges, we estimate that total net revenue would have been $5,187 million, up 7 percent year over year.
• Digital revenue was $3,450 million, up 20 percent year-over-year.
• International net revenue was $3,060 million, up 12 percent year-over-year. On a constant currencybasis, net of hedges, we estimate that international net revenue would have been $3,096 million, up14 percent year over year.
• Gross margin was 75.2 percent, up 2 percentage points year-over-year.
• Operating expenses were $2,439 million, up 5 percent year-over-year. On a constant currency basis, netof hedges, we estimate that total operating expenses would have been $2,421 million, up 4 percent yearover year.
• Operating income was $1,434 million, up 17 percent year-over-year.
• Net income was $1,043 million, up 8 percent year-over-year.
• Diluted earnings per share was $3.34, up 8 percent year-over-year.
• Operating cash flow was $1,692 million, up 7 percent year-over-year.
• Total cash, cash equivalents and short-term investments were $5,331 million.
From time to time, we make comparisons of current periods to prior periods with reference to constant currency.Constant currency comparisons are based on translating local currency amounts in the current period at actualforeign exchange rates from the prior comparable period. We evaluate our financial performance on a constantcurrency basis in order to facilitate period-to-period comparisons without regard to the impact of changingforeign currency exchange rates.
Trends in Our Business
Digital Business. Players increasingly purchase our games as digital downloads, as opposed to purchasingphysical discs, and engage with the live services we provide on an ongoing basis. Our live services provide
24
An
nu
alRep
ort
additional depth and engagement opportunities for our players and include microtransactions, extra content,subscriptions, and esports. Our net revenue attributable to live services comprised 40 percent of our total netrevenue during fiscal year 2018 and we expect that live services net revenue will continue to be material to ourbusiness. Our most popular live service is the Ultimate Team mode associated with our sports franchises.Ultimate Team allows players to collect and trade current and former professional players in order to build andcompete as a personalized team. Net revenue from Ultimate Team represented approximately 21 percent of ourtotal net revenue during fiscal year 2018, a substantial portion of which was derived from FIFA Ultimate Team.Our digital transformation is also creating opportunities in platforms, business models and the way in whichplayers engage with our games and services. For example, we have leveraged brands and assets from franchisestypically associated with consoles and traditional PC gaming, such as FIFA, Madden NFL, The Sims, SimCityand Star Wars, to create mobile and PC games that are monetized through live services associated with the game.We also provide our EA Access and Origin Access subscription services, which offer players access to aselection of EA games and other benefits for a monthly or annual fee.
We significantly increased our digital net revenue from $2,409 million in fiscal year 2016 to $2,874 million infiscal year 2017 and $3,450 million during fiscal year 2018. We expect this portion of our business to continue togrow through fiscal year 2019 and beyond as we continue to focus on developing and monetizing products andservices that can be delivered digitally.
Technological Infrastructure. As our digital business has grown, our games and services increasingly dependon the reliability, availability and security of our technological infrastructure. We are investing and expect tocontinue to invest in technology, hardware and software to support our games and services, including withrespect to security protections. Our industry is prone to, and our systems and networks are subject to, cyber-attacks, computer viruses, worms, phishing attacks, malicious software programs, and other information securityincidents that seek to exploit, disable, damage, disrupt or gain access to our networks, our products and services,supporting technological infrastructure, intellectual property and other assets. We expect these threats to oursystems and networks to continue.
Player Network. We have made, and expect to continue to make, investments that strengthen our playernetwork, which connects our players to each other and to the games they love. We are adopting consistent, cross-company methodologies to better understand our players’ needs and will continue to invest in technology thatenables us to build personalized player relationships that can last for years instead of days or weeks byconnecting our players to us and to each other. This connection allows us to market and deliver content andservices for popular franchises like FIFA, Battlefield and Star Wars to our players more efficiently. That samefoundation also enables new player-centric ways to discover and try new games and experiences, such as oursubscription-based EA Access and Origin Access services.
Concentration of Sales Among the Most Popular Games. In all major segments of our industry, we see a largeportion of games sales concentrated on the most popular titles. Similarly, a significant portion of our revenuehistorically has been derived from games based on a few popular franchises, several of which we have releasedon an annual or bi-annual basis. In particular, we have historically derived a significant portion of our netrevenue from our largest and most popular game, FIFA, the annualized version of which is consistently one ofthe best-selling games in the marketplace.
Mobile and PC Free-to-Download Games. The global adoption of mobile devices and a business model forthose devices that allows consumers to try new games with no up-front cost, and that are monetized through thelive service associated with the game, has led to significant growth in the mobile gaming industry. We expect thisgrowth to continue during our 2019 fiscal year. Likewise, the wide consumer acceptance of free-to-download,live service-based PC games played over the Internet has broadened our consumer base. We expect revenuegenerated from mobile and PC free-to-download games to remain an important part of our business.
Recurring Revenue Sources. Our business model includes revenue that we deem recurring in nature, such asrevenue from our annualized titles (such as FIFA and Madden NFL) and associated live services, subscriptionsand our ongoing mobile business. We have been able to forecast revenue from these areas of our business withgreater relative confidence than for new games, services and business models. As we continue to leverage the
25
digital transformation in our industry and incorporate new content models and modalities of play into our games,our goal is to continue to look for opportunities to expand the recurring portion of our business.
Net Bookings. In order to improve transparency into our business, we disclose an operating performance metric,net bookings. Net bookings is defined as the net amount of products and services sold digitally or sold-inphysically in the period. Net bookings is calculated by adding total net revenue to the change in deferred netrevenue for online-enabled games, and, for periods after the fourth quarter of fiscal 2018, excluding mobileplatform fees.
The following is a calculation of our total net bookings for the periods presented:
Year Ended March 31,
(In millions) 2018 2017
Total net revenue . . . . . . . . . . . . . . . . . . . . . . . . . . . . . . . . . . . . . . . . . . . . . . . . . . . . . . . . . . . $5,150 $4,845Change in deferred net revenue (online-enabled games) . . . . . . . . . . . . . . . . . . . . . . . . . . . . . 30 97
Net bookings . . . . . . . . . . . . . . . . . . . . . . . . . . . . . . . . . . . . . . . . . . . . . . . . . . . . . . . . . . . . $5,180 $4,942
Net bookings were $5,180 million for the fiscal year ended March 31, 2018, driven by FIFA 18, FIFA UltimateTeam, Star Wars Battlefront II, and Madden NFL 18. Net bookings increased $238 million or 5 percent ascompared to the fiscal year ended March 31, 2017 due primarily to growth in bookings associated with theUltimate Team game mode. Digital net bookings were $3,538 million for the fiscal year ended March 31, 2018,an increase of $504 million or 17 percent as compared to the fiscal year ended March 31, 2017. The increase indigital net bookings was driven by growth in live services which grew $514 million or 31 percent year-over-year,primarily due to growth in bookings associated with the Ultimate Team game mode and sales of The Sims 4; andour mobile business which grew $31 million or 5 percent year-over-year, primarily due to FIFA Mobile. Theseincreases were offset by a decrease of $41 million or 6 percent in our full game downloads. Full game downloadsof FIFA 18 showed strength in fiscal 2018, but were offset by the success of Battlefield 1 in fiscal 2017.
Recent Developments
Stock Repurchase Program. In May 2018, a Special Committee of our Board of Directors, on behalf of the fullBoard of Directors, authorized a program to repurchase up to $2.4 billion of our common stock. This stockrepurchase program supersedes and replaces the stock repurchase program approved in May 2017, and expires onMay 31, 2020. Under this program, we may purchase stock in the open market or through privately-negotiatedtransactions in accordance with applicable securities laws, including pursuant to pre-arranged stock trading plans.The timing and actual amount of the stock repurchases will depend on several factors including price, capitalavailability, regulatory requirements, alternative investment opportunities and other market conditions. We arenot obligated to repurchase a specific number of shares under this program and it may be modified, suspended ordiscontinued at any time. We are actively repurchasing shares under this program.
Acquisition of Respawn LLC. On December 1, 2017, we completed the acquisition of Respawn. Respawn is aleading game development studio and creators of games including the critically-acclaimed Titanfall franchise. Inconnection with the acquisition, we paid $151 million in cash. In addition, we granted long-term equity awards inthe form of restricted stock units to employees with a grant date fair value of $167 million. Furthermore, we maybe required to pay variable cash consideration that is contingent upon the achievement of certain performancemilestones relating to the development of future titles, through the end of calendar 2022. The additionalconsideration is limited to a maximum of $140 million.
U.S. Tax Act. On December 22, 2017, the Tax Cuts and Jobs Act (the “U.S. Tax Act”) was enacted whichsignificantly revised the U.S. corporate income tax system by, among other things, lowering the U.S. corporateincome tax rates to 21 percent, generally implementing a territorial tax system, and imposing a one-timetransition tax on the deemed repatriation of undistributed earnings of foreign subsidiaries (the “TransitionTax”). We recorded a provisional $235 million tax charge during the year ended March 31, 2018 as a result ofthe application of the U.S. Tax Act; $192 million of which relates to the Transition Tax.
26

An
nu
alRep
ort
CRITICAL ACCOUNTING POLICIES AND ESTIMATES
Our Consolidated Financial Statements have been prepared in accordance with accounting principles generallyaccepted in the United States (“U.S. GAAP”). The preparation of these Consolidated Financial Statementsrequires management to make estimates and assumptions that affect the reported amounts of assets and liabilities,contingent assets and liabilities, and revenue and expenses during the reporting periods. The policies discussedbelow are considered by management to be critical because they are not only important to the portrayal of ourfinancial condition and results of operations, but also because application and interpretation of these policiesrequires both management judgment and estimates of matters that are inherently uncertain and unknown. As aresult, actual results may differ materially from our estimates.
Revenue Recognition, and Sales Returns and Allowances
We derive revenue principally from sales of interactive software games, and related content and services ongame consoles, PCs, mobile phones and tablets. We evaluate revenue recognition based on the criteria set forth inFASB Accounting Standards Codification (“ASC”) 605, Revenue Recognition and ASC 985-605, Software:Revenue Recognition. We classify our revenue as either product revenue or service and other revenue.
Product revenue. Our product revenue includes revenue associated with the sale of software games or relatedproduct content or updates, whether delivered digitally (e.g., full-game downloads, extra-content) or via aphysical disc (e.g., packaged goods), and licensing of game software to third-parties. Product revenue alsoincludes revenue from mobile full game downloads that do not require our hosting support (e.g., premium mobilegames) in order to utilize the game or related content (i.e. can be played with or without an Internet connection),and sales of tangible products such as hardware, peripherals, or collectors’ items.
Service and other revenue. Our service revenue includes revenue recognized from time-based subscriptions,games, content or updates that requires our hosting support in order to utilize the game or related content (i.e.,can only be played with an Internet connection). This includes (1) entitlements to content that are accessedthrough hosting services (e.g., microtransactions for Internet-based, social network and free-to-download mobilegames), (2) massively multi-player online (“MMO”) games (both software game and subscription sales), (3)subscriptions for our Battlefield Premium, EA and Origin Access, and Pogo-branded online game services, and(4) allocated service revenue from sales of software games with a service of online activities (e.g., onlineplayability). Our other revenue includes advertising and non-software licensing revenue.
With respect to the allocated service revenue from sales of software games with a service of online activities(“online services”) mentioned above, our allocation of proceeds between product and service revenue forpresentation purposes is based on management’s best estimate of the selling price of the online services with theresidual value allocated to product revenue. Our estimate of the selling price of the online services are comprisedof several factors including, but not limited to, prior selling prices for the online services, prices chargedseparately by other third-party vendors for similar service offerings, and a cost-plus-margin approach. We reviewthe estimated selling price of the online services on a regular basis and use this methodology consistently toallocate revenue between product and service for software game sales with online services.
We evaluate and recognize revenue when all four of the following criteria are met:
• Evidence of an arrangement. Evidence of an agreement with the customer that reflects the terms andconditions to deliver the related products or services must be present.
• Fixed or determinable fee. If a portion of the arrangement fee is not fixed or determinable, werecognize revenue as the amount becomes fixed or determinable.
• Collection is deemed probable. Collection is deemed probable if we expect the customer to be able topay amounts under the arrangement as those amounts become due. If we determine that collection isnot probable as the amounts become due, we generally conclude that collection becomes probable uponcash collection.
• Delivery. For packaged goods, delivery is considered to occur when a product is shipped and the riskof loss and rewards of ownership have transferred to the customer. For digital downloads, delivery is
27

considered to occur when the software is made available to the customer for download. For servicesand other, delivery is generally considered to occur as the service is delivered, which is determinedbased on the underlying service obligation. If there is significant uncertainty of acceptance, revenue isrecognized once acceptance is reasonably assured.
Online-Enabled Games
The majority of our software games and related content have online connectivity whereby a consumer may beable to download unspecified content or updates on a when-and-if-available basis (“unspecified updates”) for usewith the original game software. In addition, we may also offer a service of online activities (e.g., onlineplayability) without a separate fee. U.S. GAAP requires us to account for the consumer’s right to receiveunspecified updates or the service of online activities for no additional fee as a “bundled” sale, or multiple-element arrangement.
We have an established historical pattern of providing unspecified updates (e.g., player roster updates to MaddenNFL 18) to online-enabled games and related content at no additional charge to the consumer. Because we do nothave vendor-specific objective evidence of fair value (“VSOE”) for these unspecified updates, we are required bycurrent U.S. GAAP to recognize as revenue the entire sales price of these online-enabled games and relatedcontent over the period we expect to offer the unspecified updates to the consumer (“estimated offering period”).
Estimated Offering Period
Because the offering period is not an explicitly defined period, we must make an estimate of the offering period.Determining the estimated offering period is inherently subjective and is subject to regular revision based onhistorical online usage. For example, in determining the estimated offering period for unspecified updatesassociated with our online-enabled games, we consider the period of time consumers are online as onlineconnectivity is required. On an annual basis, we review consumers’ online gameplay of all online-enabled gamesthat have been released 12 to 24 months prior to the evaluation date. For example, if our evaluation date isApril 1, 2017, we evaluate all online-enabled games released between April 1, 2015 and March 31, 2016. Basedon this population of games, for all players that register the game online within the first six months of release ofthe game to the general public, we compute the weighted-average number of days for each online-enabled game,based on when a player initially registers the game online to when that player last plays the game online. We thencompute the weighted-average number of days for all online-enabled games by multiplying the weighted-averagenumber of days for each online-enabled game by its relative percentage of total units sold from these online-enabled games (i.e., a game with more units sold will have a higher weighting to the overall computation than agame with fewer units sold). Under a similar computation, we also consider the estimated period of time betweenthe date a game unit is sold to a reseller and the date the reseller sells the game unit to an end consumer (i.e., timein channel). Based on these two calculations we then consider the method of distribution. For example, physicalsoftware games sold at retail would have a composite offering period equal to the online gameplay plus time inchannel as opposed to digitally distributed software games which are delivered immediately via digital downloadand thus have no concept of channel. Additionally, we consider results from prior analyses, known and expectedonline gameplay trends, as well as disclosed service periods for competitors’ games in determining the estimatedoffering period for future sales.
While we consistently apply this methodology, inherent assumptions used in this methodology include whichonline-enabled games to sample, whether to use only units that have registered online, whether to weight thenumber of days for each game, whether to weight the days based on the units sold of each game, determining theperiod of time between the date of sale to reseller and the date of sale to the consumer and assessing onlinegameplay trends.
We recognize revenue from the sale of online-enabled games for which we do not have VSOE for theunspecified updates on a straight-line basis, generally over an estimated nine-month period beginning in themonth after shipment for physical games sold through retail and an estimated six-month period for digitally-distributed games.
28

An
nu
alRep
ort
Deferred Net Revenue (online-enabled games)
Because the majority of our sales are subject to a deferral period of generally six to nine months, our deferred netrevenue (online-enabled games) balance is material. This balance increases from period to period by the revenuebeing deferred for current sales and is reduced by the recognition of revenue from prior sales that were deferred(i.e., the “net change” in the deferred balance). However, given the seasonal sales nature of our business, the netchange in the deferred balance may be material from period to period. For example, because our sales havehistorically been highest in the fiscal third quarter, the deferred net revenue (online-enabled games) balancegenerally increases significantly in the third fiscal quarter. Similarly, because sales have historically been lowestin the first fiscal quarter, the deferred net revenue (online-enabled games) balance generally decreasessignificantly in the first fiscal quarter of a fiscal year.
Other Multiple-Element Arrangements
In some of our multiple-element arrangements, we sell non-software products with software and/or software-related offerings. These non-software products are generally music soundtracks, peripherals or ancillarycollectors’ items, such as figurines and comic books. Revenue for these arrangements is allocated to eachseparate unit of accounting for each deliverable using the relative selling prices of each deliverable in thearrangement based on the selling price hierarchy described below. If the arrangement contains more than onesoftware deliverable, the arrangement consideration is allocated to the software deliverables as a group and thenallocated to each software deliverable.
We determine the selling price for a non-software product deliverable based on the following selling pricehierarchy: VSOE (i.e., the price we charge when the non-software product is sold separately) if available, third-party evidence (“TPE”) of fair value (i.e., the price charged by others for similar non-software products) if VSOEis not available, or our best estimate of selling price (“BESP”) if neither VSOE nor TPE is available.Determining the BESP is a subjective process that is based on multiple factors including, but not limited to,recent selling prices and related discounts, market conditions, customer classes, sales channels and other factors.Provided the other three revenue recognition criteria other than delivery have been met, we recognize revenueupon delivery to the customer as we have no further obligations.
We must make assumptions and judgments in order to (1) determine whether and when each element isdelivered, (2) determine whether VSOE exists for each undelivered element, and (3) allocate the total priceamong the various elements, as applicable. Changes to any of these assumptions and judgments, or changes tothe elements in the arrangement, could cause a material increase or decrease in the amount of revenue that wereport in a particular period.
Principal Agent Considerations
We evaluate sales of our interactive software games, extra-content, and services from our subscription offeringsvia third party storefronts, including digital channel storefronts from Microsoft, Sony, Apple, and Google, inorder to determine whether or not we are acting as the primary obligor in the sale to the end consumer, which weconsider in determining if revenue should be reported gross or net of fees retained by the storefront. Keyindicators that we evaluate in determining gross versus net treatment include but are not limited to the following:
• The party responsible for delivery/fulfillment of the product or service to the end consumer
• The party responsible for the billing, collection of fees and refunds to the end consumer
• The storefront and Terms of Sale that govern the end consumer’s purchase of the product or service
• The party that sets the pricing with the end consumer and has credit risk
Based on evaluation of the above indicators, we have determined that generally the third party is considered theprimary obligor to end consumers for the sale of our interactive software games. We therefore report revenuerelated to these arrangements net of the fees retained by the storefront.
29
Sales Returns and Allowances
We reduce revenue for estimated future returns and price protection which may occur with our distributors andretailers (“channel partners”). Price protection represents our practice to provide our channel partners with acredit allowance to lower their wholesale price on a particular product that they have not resold to endconsumers. The amount of the price protection is generally the difference between the old wholesale price andthe new reduced wholesale price. In certain countries for our PC and console packaged goods software products,we also have a practice of allowing channel partners to return older software products in the channel in exchangefor a credit allowance. As a general practice, we do not give cash refunds.
When evaluating the adequacy of sales returns and price protection allowances, we analyze the following:historical credit allowances, current sell-through of our channel partners’ inventory of our software products,current trends in retail and the video game industry, changes in customer demand, acceptance of our softwareproducts, and other related factors. In addition, we monitor the volume of sales to our channel partners and theirinventories, as substantial overstocking in the distribution channel could result in high returns or higher priceprotection in subsequent periods.
In the future, actual returns and price protections may materially exceed our estimates as unsold softwareproducts in the distribution channels are exposed to rapid changes in consumer preferences, market conditions ortechnological obsolescence due to new platforms, product updates or competing software products. While webelieve we can make reliable estimates regarding these matters, these estimates are inherently subjective.Accordingly, if our estimates change, our returns and price protection allowances would change and wouldimpact the total net revenue and related Balance Sheet accounts that we report.
Fair Value Estimates
Business Combinations. We must estimate the fair value of assets acquired, liabilities and contingenciesassumed, acquired in-process technology, and contingent consideration issued in a business combination. Ourassessment of the estimated fair value of each of these can have a material effect on our reported results asintangible assets are amortized over various estimated useful lives. Furthermore, the estimated fair value assignedto an acquired asset or liability has a direct impact on the amount we recognize as goodwill, which is an asset thatis not amortized. Determining the fair value of assets acquired requires an assessment of the highest and best useor the expected price to sell the asset and the related expected future cash flows. Determining the fair value ofacquired in-process technology also requires an assessment of our expectations related to the use of thattechnology. Determining the fair value of an assumed liability requires an assessment of the expected cost totransfer the liability. Determining the fair value of contingent consideration requires an assessment of theprobability-weighted expected future cash flows over the period in which the obligation is expected to be settled,and applying a discount rate that appropriately captures the risk associated with the obligation. The significantunobservable inputs used in the fair value measurement of the contingent consideration payable are forecastedearnings. Significant changes in forecasted earnings would result in significantly higher or lower fair valuemeasurement. This fair value assessment is also required in periods subsequent to a business combination. Suchestimates are inherently difficult and subjective and can have a material impact on our Consolidated FinancialStatements.
Royalties and Licenses
Our royalty expenses consist of payments to (1) content licensors, (2) independent software developers, and(3) co-publishing and distribution affiliates. License royalties consist of payments made to celebrities,professional sports organizations, movie studios and other organizations for our use of their trademarks,copyrights, personal publicity rights, content and/or other intellectual property. Royalty payments to independentsoftware developers are payments for the development of intellectual property related to our games.Co-publishing and distribution royalties are payments made to third parties for the delivery of products.
Royalty-based obligations with content licensors and distribution affiliates are either paid in advance andcapitalized as prepaid royalties or are accrued as incurred and subsequently paid. These royalty-based obligations
30
An
nu
alRep
ort
are generally expensed to cost of revenue generally at the greater of the contractual rate or an effective royaltyrate based on the total projected net revenue for contracts with guaranteed minimums. Significant judgment isrequired to estimate the effective royalty rate for a particular contract. Because the computation of effectiveroyalty rates requires us to project future revenue, it is inherently subjective as our future revenue projectionsmust anticipate a number of factors, including (1) the total number of titles subject to the contract, (2) the timingof the release of these titles, (3) the number of software units and amount of extra content that we expect to sell,which can be impacted by a number of variables, including product quality, number of platforms we release on,the timing of the title’s release and competition, and (4) future pricing. Determining the effective royalty rate forour titles is particularly challenging due to the inherent difficulty in predicting the popularity of entertainmentproducts. Furthermore, if we conclude that we are unable to make a reasonably reliable forecast of projected netrevenue, we recognize royalty expense at the greater of contract rate or on a straight-line basis over the term ofthe contract. Accordingly, if our future revenue projections change, our effective royalty rates would change,which could impact the amount and timing of royalty expense we recognize.
Prepayments made to thinly capitalized independent software developers and co-publishing affiliates aregenerally made in connection with the development of a particular product, and therefore, we are generallysubject to development risk prior to the release of the product. Accordingly, payments that are due prior tocompletion of a product are generally expensed to research and development over the development period as theservices are incurred. Payments due after completion of the product (primarily royalty-based in nature) aregenerally expensed as cost of revenue.
Our contracts with some licensors include minimum guaranteed royalty payments, which are initially recorded asan asset and as a liability at the contractual amount when no performance remains with the licensor. Whenperformance remains with the licensor, we record guarantee payments as an asset when actually paid and as aliability when incurred, rather than recording the asset and liability upon execution of the contract.
Each quarter, we also evaluate the expected future realization of our royalty-based assets, as well as anyunrecognized minimum commitments not yet paid to determine amounts we deem unlikely to be realized throughproduct and service sales. Any impairments or losses determined before the launch of a product are generallycharged to research and development expense. Impairments or losses determined post-launch are charged to costof revenue. We evaluate long-lived royalty-based assets for impairment using undiscounted cash flows whenimpairment indicators exist. If impairment exists, then the assets are written down to fair value. Unrecognizedminimum royalty-based commitments are accounted for as executory contracts, and therefore, any losses onthese commitments are recognized when the underlying intellectual property is abandoned (i.e., cease use) or thecontractual rights to use the intellectual property are terminated.
Income Taxes
We recognize deferred tax assets and liabilities for both (1) the expected impact of differences between thefinancial statement amount and the tax basis of assets and liabilities and (2) the expected future tax benefit to bederived from tax losses and tax credit carryforwards. We record a valuation allowance against deferred tax assetswhen it is considered more likely than not that all or a portion of our deferred tax assets will not be realized. Inmaking this determination, we are required to give significant weight to evidence that can be objectively verified.
In addition to considering forecasts of future taxable income, we are also required to evaluate and quantify otherpossible sources of taxable income in order to assess the realization of our deferred tax assets, namely thereversal of existing deferred tax liabilities, the carryback of losses and credits as allowed under current tax law,and the implementation of tax planning strategies. Evaluating and quantifying these amounts involves significantjudgments. Each source of income must be evaluated based on all positive and negative evidence; this evaluationinvolves assumptions about future activity.
In the fourth quarter of fiscal year 2016, we realized significant U.S. pre-tax income for both the fourth quarterand the fiscal year ended March 31, 2016. As a result, we released the valuation allowance against all of the U.S.federal deferred tax assets and a portion of the U.S. state deferred tax assets during the fourth quarter of fiscalyear 2016. We continue to maintain a valuation allowance related to specific U.S. state deferred tax assets andforeign capital loss carryovers, due to uncertainty about the future realization of these assets.
31

Our effective tax rate and resulting provision for income taxes for the year ended March 31, 2018 weresignificantly impacted by the U.S. Tax Act enacted on December 22, 2017. The U.S. Tax Act significantlyrevised the U.S. corporate income tax system by, among other things, lowering the U.S. corporate income taxrate to 21 percent, generally implementing a territorial tax system and imposing the Transition Tax.
Reasonable estimates of the impacts of the U.S. Tax Act are provided in accordance with SEC guidance thatallows for a measurement period of up to one year after the enactment date of the U.S. Tax Act to finalize therecording of the related tax impacts. We expect to complete the accounting under the U.S. Tax Act as soon aspracticable, but in no event later than one year from the enactment date of the U.S. Tax Act.
The final calculations of tax expenses and tax benefits resulting from the U.S. Tax Act may differ from ourestimates, potentially materially, due to, among other things, changes in interpretations of the U.S. Tax Act, ourfurther analysis of the U.S. Tax Act, or any updates or changes to estimates that we have utilized to calculate thetransition impacts.
Prior to the U.S. Tax Act, a substantial majority of undistributed earnings of our foreign subsidiaries wereconsidered to be indefinitely reinvested. The U.S. Tax Act included a mandatory one-time tax on accumulatedearnings of foreign subsidiaries, and as a result, substantially all previously unremitted earnings for which noU.S. deferred tax liability had been accrued have now been subject to U.S. tax.
As part of the process of preparing our Consolidated Financial Statements, we are required to estimate ourincome taxes in each jurisdiction in which we operate prior to the completion and filing of tax returns for suchperiods. This process requires estimating both our geographic mix of income and our uncertain tax positions ineach jurisdiction where we operate. These estimates involve complex issues and require us to make judgmentsabout the likely application of the tax law to our situation, as well as with respect to other matters, such asanticipating the positions that we will take on tax returns prior to our preparing the returns and the outcomes ofdisputes with tax authorities. The ultimate resolution of these issues may take extended periods of time due toexaminations by tax authorities and statutes of limitations. In addition, changes in our business, includingacquisitions, changes in our international corporate structure, changes in the geographic location of businessfunctions or assets, changes in the geographic mix and amount of income, as well as changes in our agreementswith tax authorities, valuation allowances, applicable accounting rules, applicable tax laws and regulations,rulings and interpretations thereof, developments in tax audit and other matters, and variations in the estimatedand actual level of annual pre-tax income can affect the overall effective tax rate.
IMPACT OF RECENTLY ISSUED ACCOUNTING STANDARDS
The information under the subheading “Impact of Recently Issued Accounting Standards” in Note 1 —Description of Business and Basis of Presentation to the Consolidated Financial Statements in this Form 10-K isincorporated by reference into this Item 7.
RESULTS OF OPERATIONS
Our fiscal year is reported on a 52- or 53-week period that ends on the Saturday nearest March 31. Our results ofoperations for the fiscal year ended March 31, 2018 and 2017 contained 52 weeks each and ended on March 31,2018 and April 1, 2017, respectively. Our results of operations for the fiscal year ended March 31, 2016contained 53 weeks and ended on April 2, 2016. For simplicity of disclosure, all fiscal periods are referred to asending on a calendar month end.
Net Revenue
Net revenue consists of sales generated from (1) video games sold as digital downloads or as packaged goods anddesigned for play on game consoles and PCs, (2) video games for mobile phones and tablets, (3) separatesoftware products and extra-content and online game services associated with these products, (4) licensing our
32
An
nu
alRep
ort
game software to third parties, (5) allowing other companies to manufacture and sell our products in conjunctionwith other products, and (6) advertisements on our online web pages and in our games. We recognize revenuefrom the sale of online-enabled games for which we do not have VSOE for the unspecified updates on a straight-line basis, generally over an estimated six-month period for digitally-delivered games and content and anestimated nine-month period beginning in the month after shipment for physical games sold through retail.
We provide two different measures of our Net Revenue. (1) Net Revenue by Product revenue and Service andother revenue, and (2) Net Revenue by Type, which is primarily based on method of distribution. Managementplaces a greater emphasis and focus on assessing our business through a review of the Net Revenue by Type(Digital, and Packaged goods and other) than by Net Revenue by Product revenue and Service and other revenue.
Comparison of Fiscal Year 2018 to Fiscal Year 2017
Net Revenue
For fiscal year 2018, net revenue was $5,150 million, an increase of $305 million, or 6 percent, as compared tofiscal year 2017. This increase was driven by a $681 million increase in revenue primarily from the FIFA andMass Effect franchises. This increase was partially offset by a $376 million decrease in revenue primarily fromthe Star Wars, Plants vs. Zombies, and UFC franchises.
Net Revenue by Product Revenue and Service and Other Revenue
Our Net Revenue by Product revenue and Service and other revenue for fiscal years 2018 and 2017 was asfollows (in millions):
Year Ended March 31,
2018 2017 $ Change % Change
Net revenue:Product . . . . . . . . . . . . . . . . . . . . . . . . . . . . . . . . . . . . . . . . . . . . . . . . . . $2,586 $2,640 $ (54) (2)%Service and other . . . . . . . . . . . . . . . . . . . . . . . . . . . . . . . . . . . . . . . . . . 2,564 2,205 359 16%
Total net revenue . . . . . . . . . . . . . . . . . . . . . . . . . . . . . . . . . . . . . . . . $5,150 $4,845 $305 6%
Product Revenue
For fiscal year 2018, Product net revenue was $2,586 million, primarily driven by FIFA 18, Battlefield 1, andFIFA 17. Product net revenue decreased $54 million, or 2 percent, as compared to fiscal year 2017. This decreasewas driven by a $450 million decrease primarily from the Star Wars, Battlefield, and UFC franchises. Thisdecrease was partially offset by a $396 million increase primarily from the Mass Effect, The Sims, and Need forSpeed franchises.
Service and Other Revenue
For fiscal year 2018, Service and other net revenue was $2,564 million, primarily driven by FIFA Ultimate Team,Star Wars: Galaxy of Heroes, and Battlefield 1 Premium. Service and other net revenue for fiscal year 2018increased $359 million, or 16 percent, as compared to fiscal year 2017. This increase was driven by a$538 million increase primarily from FIFA Ultimate Team and Battlefield 1 Premium, partially offset by a$179 million decrease primarily from Need for Speed 2015 and the Plants vs. Zombies franchise.
Supplemental Net Revenue by Type
As we continue to evolve our business and more of our products are delivered to consumers digitally, we place agreater emphasis and focus on assessing our business performance through a review of net revenue by type.
33
Our net revenue by type for fiscal years 2018 and 2017 was as follows (in millions):
Year Ended March 31,
2018 2017 $ Change % Change
Full game downloads . . . . . . . . . . . . . . . . . . . . . . . . . . . . . . . . . . . . . . . $ 707 $ 659 48 7%Live services(a) . . . . . . . . . . . . . . . . . . . . . . . . . . . . . . . . . . . . . . . . . . . . 2,083 1,589 494 31%Mobile . . . . . . . . . . . . . . . . . . . . . . . . . . . . . . . . . . . . . . . . . . . . . . . . . . 660 626 34 5%
Total Digital . . . . . . . . . . . . . . . . . . . . . . . . . . . . . . . . . . . . . . . . . . . . . . . . $3,450 $2,874 $ 576 20%
Packaged goods and other . . . . . . . . . . . . . . . . . . . . . . . . . . . . . . . . . . . . . $1,700 $1,971 (271) (14)%
Net revenue . . . . . . . . . . . . . . . . . . . . . . . . . . . . . . . . . . . . . . . . . . . . $5,150 $4,845 $ 305 6%
(a) Live services net revenue is comprised of net revenue previously presented as “Extra content” and“Subscription, advertising, and other” through the fourth quarter of fiscal 2017.
Digital Net Revenue
Digital net revenue includes full game downloads, live services, and mobile revenue. Digital net revenue includesgame software distributed through our direct-to-consumer PC platform Origin, distributed wirelessly throughmobile carriers, or licensed to our third-party publishing partners who distribute our games digitally.
For fiscal year 2018, digital net revenue was $3,450 million primarily driven by our digital business, particularlycontinued success with live services, including Ultimate Team and live services associated with Battlefield 1.Digital net revenue for fiscal year 2018 increased $576 million, or 20 percent, as compared to fiscal year 2017.This increase was due to (1) a $48 million or 7 percent increase in full-game download net revenue primarilydriven by FIFA 18 and Mass Effect: Andromeda, partially offset by Battlefield 1 and Star Wars Battlefront, (2) a$494 million or 31 percent increase in live services net revenue primarily driven by our Ultimate Team gamemode and Battlefield 1 Premium, (3) a $34 million or 5 percent increase in mobile net revenue primarily drivenby Star Wars: Galaxy of Heroes and FIFA Mobile.
Packaged Goods and Other Net Revenue
Packaged goods and other net revenue includes revenue from software that is distributed physically. Thisincludes (1) net revenue from game software distributed physically through traditional channels such as brick andmortar retailers, and (2) our software licensing revenue from third parties (for example, makers of consoleplatforms, personal computers or computer accessories) who include certain of our products for sale with theirproducts (“OEM bundles”).
For fiscal year 2018, packaged goods and other net revenue was $1,700 million, primarily driven by FIFA 18,FIFA 17, and Battlefield 1. Packaged goods and other net revenue for fiscal year 2018 decreased $271 million, or14 percent, as compared to fiscal year 2017, primarily driven by consumers increasingly purchasing our gamesdigitally, as opposed to purchasing physical discs. This decrease was driven by a $400 million decrease in netrevenue primarily from the Star Wars, Plants vs. Zombies, and UFC franchises. This decrease was partially offsetby a $129 million increase primarily from the Mass Effect and Battlefield franchises.
Cost of Revenue
Cost of revenue for fiscal years 2018 and 2017 was as follows (in millions):
March 31,2018
% ofRelated
Net RevenueMarch 31,
2017
% ofRelated
Net Revenue%
Change
Change as a% of RelatedNet Revenue
Cost of revenue:Product . . . . . . . . . . . . . . . . . . . . . . . . . $ 822 31.8% $ 893 33.8% (8)% (2.0)%Service and other . . . . . . . . . . . . . . . . . 455 17.7% 405 18.4% 12% (0.7)%
Total cost of revenue . . . . . . . . . . . . $1,277 24.8% $1,298 26.8% (2)% (2.0)%
34
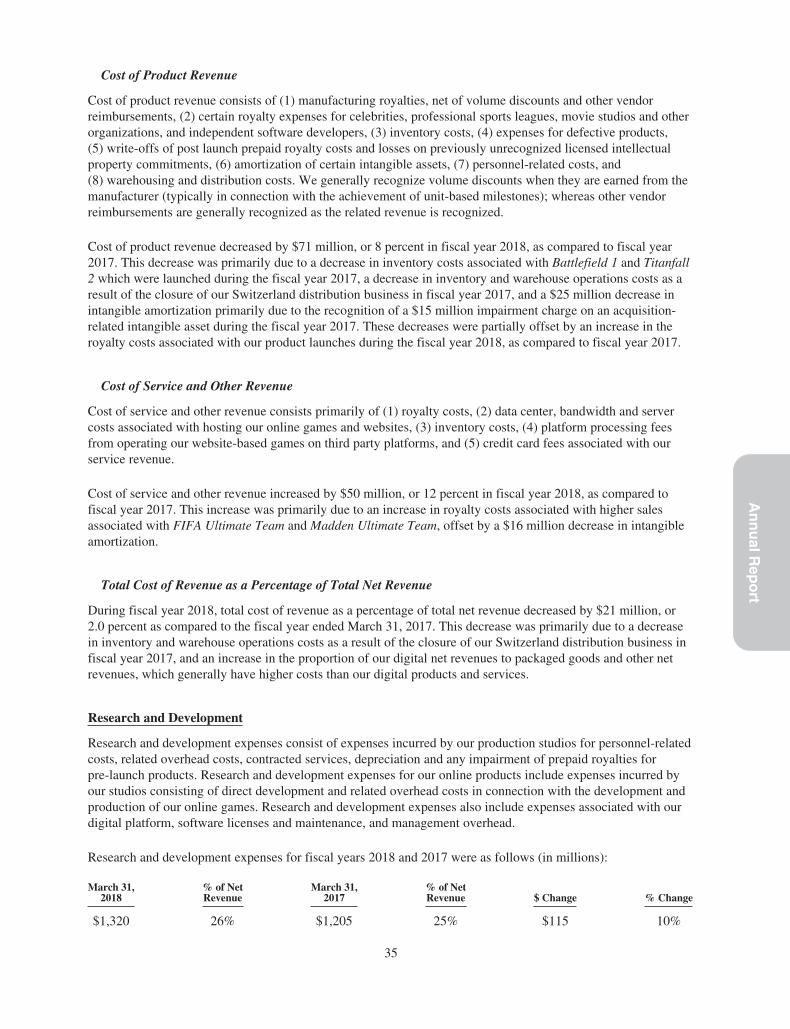
An
nu
alRep
ort
Cost of Product Revenue
Cost of product revenue consists of (1) manufacturing royalties, net of volume discounts and other vendorreimbursements, (2) certain royalty expenses for celebrities, professional sports leagues, movie studios and otherorganizations, and independent software developers, (3) inventory costs, (4) expenses for defective products,(5) write-offs of post launch prepaid royalty costs and losses on previously unrecognized licensed intellectualproperty commitments, (6) amortization of certain intangible assets, (7) personnel-related costs, and(8) warehousing and distribution costs. We generally recognize volume discounts when they are earned from themanufacturer (typically in connection with the achievement of unit-based milestones); whereas other vendorreimbursements are generally recognized as the related revenue is recognized.
Cost of product revenue decreased by $71 million, or 8 percent in fiscal year 2018, as compared to fiscal year2017. This decrease was primarily due to a decrease in inventory costs associated with Battlefield 1 and Titanfall2 which were launched during the fiscal year 2017, a decrease in inventory and warehouse operations costs as aresult of the closure of our Switzerland distribution business in fiscal year 2017, and a $25 million decrease inintangible amortization primarily due to the recognition of a $15 million impairment charge on an acquisition-related intangible asset during the fiscal year 2017. These decreases were partially offset by an increase in theroyalty costs associated with our product launches during the fiscal year 2018, as compared to fiscal year 2017.
Cost of Service and Other Revenue
Cost of service and other revenue consists primarily of (1) royalty costs, (2) data center, bandwidth and servercosts associated with hosting our online games and websites, (3) inventory costs, (4) platform processing feesfrom operating our website-based games on third party platforms, and (5) credit card fees associated with ourservice revenue.
Cost of service and other revenue increased by $50 million, or 12 percent in fiscal year 2018, as compared tofiscal year 2017. This increase was primarily due to an increase in royalty costs associated with higher salesassociated with FIFA Ultimate Team and Madden Ultimate Team, offset by a $16 million decrease in intangibleamortization.
Total Cost of Revenue as a Percentage of Total Net Revenue
During fiscal year 2018, total cost of revenue as a percentage of total net revenue decreased by $21 million, or2.0 percent as compared to the fiscal year ended March 31, 2017. This decrease was primarily due to a decreasein inventory and warehouse operations costs as a result of the closure of our Switzerland distribution business infiscal year 2017, and an increase in the proportion of our digital net revenues to packaged goods and other netrevenues, which generally have higher costs than our digital products and services.
Research and Development
Research and development expenses consist of expenses incurred by our production studios for personnel-relatedcosts, related overhead costs, contracted services, depreciation and any impairment of prepaid royalties forpre-launch products. Research and development expenses for our online products include expenses incurred byour studios consisting of direct development and related overhead costs in connection with the development andproduction of our online games. Research and development expenses also include expenses associated with ourdigital platform, software licenses and maintenance, and management overhead.
Research and development expenses for fiscal years 2018 and 2017 were as follows (in millions):
March 31,2018
% of NetRevenue
March 31,2017
% of NetRevenue $ Change % Change
$1,320 26% $1,205 25% $115 10%
35

Research and development expenses increased by $115 million, or 10 percent, in fiscal year 2018, as comparedto fiscal year 2017. This $115 million increase was primarily due to a (1) a $78 million increase in personnel-related costs primarily resulting from an increase in headcount and an increase in salary costs, (2) a $37 millionincrease in stock-based compensation primarily resulting from an increase in equity award issuances toemployees, and (3) a $21 million increase in facilities-related costs. These increases were partially offset by a$32 million decrease primarily due to a loss on a royalty-based commitment and impairment on a royalty basedasset during fiscal year 2017.
Marketing and Sales
Marketing and sales expenses consist of personnel-related costs, related overhead costs, advertising, marketingand promotional expenses, net of qualified advertising cost reimbursements from third parties.
Marketing and sales expenses for fiscal years 2018 and 2017 were as follows (in millions):
March 31,2018
% of NetRevenue
March 31,2017
% of NetRevenue $ Change % Change
$641 12% $673 14% $(32) (5)%
Marketing and sales expenses decreased by $32 million, or 5 percent, in fiscal year 2018, as compared to fiscalyear 2017. This $32 million decrease was primarily due to a decrease in advertising and promotional spendingassociated with our 2018 game launches as compared to our fiscal 2017 game launches, particularly Battlefield 1and Titanfall 2, which were launched during fiscal 2017.
General and Administrative
General and administrative expenses consist of personnel and related expenses of executive and administrativestaff, corporate functions such as finance, legal, human resources, and information technology, related overheadcosts, fees for professional services such as legal and accounting, and allowances for doubtful accounts.
General and administrative expenses for fiscal years 2018 and 2017 were as follows (in millions):
March 31,2018
% of NetRevenue
March 31,2017
% of NetRevenue $ Change % Change
$469 9% $439 9% $30 7%
General and administrative expenses increased by $30 million, or 7 percent, in fiscal year 2018, as compared tofiscal year 2017. This $30 million increase was primarily due to (1) a $20 million increase in contracted servicesprimarily due to higher legal expenses, (2) a $13 million increase in personnel-related costs primarily resultingfrom an increase in headcount, and (3) an $8 million increase in stock-based compensation. These increases werepartially offset by an $8 million decrease in facility-related costs.
Income Taxes
Provision for income taxes for fiscal years 2018 and 2017 was as follows (in millions):
March 31,2018
EffectiveTaxRate
March 31,2017
EffectiveTax Rate
$406 28.0% $243 20.1%
Our effective tax rate for the year ended March 31, 2018 was 28.0 percent as compared 20.1 percent for the sameperiod in fiscal year 2017. Our effective tax rate and resulting provision for income taxes for the fiscal yearended March 31, 2018 was significantly impacted by the U.S. Tax Act. The U.S. Tax Act significantly revisedthe U.S. corporate income tax system by, among other things, lowering the U.S. corporate income tax rate to21 percent, generally implementing a territorial tax system and imposing the Transition Tax. These impacts wereoffset by earnings realized in countries that have lower statutory tax rates and the recognition of excess taxbenefits from stock-based compensation.
36

An
nu
alRep
ort
Our effective tax rates for fiscal year 2019 and future periods will continue to depend on a variety of factors,including changes in our business such as acquisitions and intercompany transactions, changes in ourinternational structure, changes in the geographic location of business functions or assets, changes in thegeographic mix of income, changes in or termination of our agreements with tax authorities, applicableaccounting rules, applicable tax laws and regulations, rulings and interpretations thereof, developments in taxaudit and other matters, and variations in our annual pre-tax income or loss. We anticipate that the impact ofexcess tax benefits and tax deficiencies may result in significant fluctuations to our effective tax rate in thefuture.
Reasonable estimates of the impacts of the U.S. Tax Act are provided in accordance with SEC guidance thatallows for a measurement period of up to one year after the enactment date of the U.S. Tax Act to finalize therecording of the related tax impacts. We expect to complete the accounting under the U.S. Tax Act as soon aspracticable, but in no event later than one year from the enactment date of the U.S. Tax Act.
We recorded a provisional tax expense of $235 million related to the U.S. Tax Act for the year ended March 31,2018, $192 million of which relates to the Transition Tax. During the three months ended March 31, 2018, weadjusted the provisional amount initially recorded for the Transition Tax by recognizing an additional$41 million charge. We also recorded immaterial adjustments to certain other tax items. These adjustments werebased on our further analysis of the U.S. Tax Act and certain changes to current year earnings estimates andassertions. These amounts remain provisional. The final calculation of taxes attributable to the U.S. Tax Act maydiffer from our estimates, potentially materially, due to, among other things, changes in interpretations of theU.S. Tax Act, our further analysis of the U.S. Tax Act, or any updates or changes to estimates that we haveutilized to calculate the transition impacts.
The U.S. Tax Act creates new U.S. taxes on foreign earnings. Our provision for income taxes for the year endedMarch 31, 2018 provisionally does not reflect any deferred tax impacts of the U.S. taxes on foreign earnings.Because of the complexity of the rules regarding the new tax on foreign earnings, we are continuing to evaluatethis accounting policy election.
Comparison of Fiscal Year 2017 to Fiscal Year 2016
Net Revenue
For fiscal year 2017, net revenue was $4,845 million and increased $449 million, or 10 percent, as compared tofiscal year 2016. This increase was driven by an $809 million increase in revenue primarily from the Star Wars,Battlefield, and FIFA franchises. This increase was partially offset by a $360 million decrease in revenueprimarily from the Dragon Age, The Sims, and NHL franchises, and The Simpsons Tapped Out.
Net Revenue by Product Revenue and Service and Other Revenue
Our Net Revenue by Product revenue and Service and other revenue for fiscal years 2017 and 2016 was asfollows (in millions):
Year Ended March 31,
2017 2016 $ Change % Change
Net revenue:
Product . . . . . . . . . . . . . . . . . . . . . . . . . . . . . . . . . . . . . . . . . . . . . . . . . . $2,640 $2,497 $143 6%
Service and other . . . . . . . . . . . . . . . . . . . . . . . . . . . . . . . . . . . . . . . . . . 2,205 1,899 306 16%
Total net revenue . . . . . . . . . . . . . . . . . . . . . . . . . . . . . . . . . . . . . . . . $4,845 $4,396 $449 10%
Product Revenue
For fiscal year 2017, Product net revenue was $2,640 million, primarily driven by FIFA 17, Battlefield 1, andStar Wars Battlefront. Product net revenue increased $143 million, or 6 percent, as compared to fiscal year 2016.This increase was driven by a $526 million increase primarily from the Battlefield and Star Wars franchises, and
37

Titanfall 2. This increase was partially offset by a $383 million decrease primarily from the Dragon Age, FIFA,The Sims, and Need for Speed franchises.
Service and Other Revenue
For fiscal year 2017, Service and other net revenue was $2,205 million, primarily driven by FIFA Ultimate Team,Star Wars: Galaxy of Heroes, and Need for Speed 2015. Service and other net revenue for fiscal year 2017increased $306 million, or 16 percent, as compared to fiscal year 2016. This increase was driven by a$404 million increase primarily from FIFA Ultimate Team and the Star Wars and Need for Speed franchises.This increase was partially offset by a $98 million decrease primarily from The Simpsons Tapped Out, Titanfall,The Sims FreePlay, and Battlefield 4 Premium.
Supplemental Net Revenue by Composition
Our net revenue by composition for fiscal years 2017 and 2016 was as follows (in millions):
Year Ended March 31,
2017 2016 $ Change % Change
Full game downloads . . . . . . . . . . . . . . . . . . . . . . . . . . . . . . . . . . . . . . . $ 659 $ 465 $194 42%Live services . . . . . . . . . . . . . . . . . . . . . . . . . . . . . . . . . . . . . . . . . . . . . 1,589 1,400 189 14%Mobile . . . . . . . . . . . . . . . . . . . . . . . . . . . . . . . . . . . . . . . . . . . . . . . . . . 626 544 82 15%
Total Digital . . . . . . . . . . . . . . . . . . . . . . . . . . . . . . . . . . . . . . . . . . . . . . . . $2,874 $2,409 $465 19%
Packaged goods and other . . . . . . . . . . . . . . . . . . . . . . . . . . . . . . . . . . . . . $1,971 $1,987 $ (16) (1)%
Net revenue . . . . . . . . . . . . . . . . . . . . . . . . . . . . . . . . . . . . . . . . . . . . $4,845 $4,396 $449 10%
Digital Net Revenue
For fiscal year 2017, digital net revenue was $2,874 million primarily driven by FIFA Ultimate Team, FIFAOnline 3 in Asia, Battlefield 1, and Star Wars: Galaxy of Heroes. Digital net revenue for fiscal year 2017increased $465 million, or 19 percent, as compared to fiscal year 2016. This increase is due to (1) a $194 millionor 42 percent increase in full-game download net revenue primarily driven by Battlefield 1 and FIFA 17, partiallyoffset by Battlefield Hardline, (2) a $189 million or 14 percent increase in live services net revenue primarilydriven by our Ultimate Team game mode and Star Wars Battlefront, and (3) an $82 million or 15 percentincrease in mobile net revenue primarily driven by Star Wars: Galaxy of Heroes.
Packaged Goods and Other Net Revenue
For fiscal year 2017, packaged goods and other net revenue was $1,971 million, primarily driven by FIFA 17,FIFA 16, Star Wars Battlefront, and Battlefield 1. Packaged goods and other net revenue for fiscal year 2017decreased $16 million, or 1 percent, as compared to fiscal year 2016.
Cost of Revenue
Cost of revenue for fiscal years 2017 and 2016 was as follows (in millions):
March 31,2017
% ofRelated
Net RevenueMarch 31,
2016
% ofRelated
Net Revenue % Change
Change as a% of RelatedNet Revenue
Cost of revenue:Product . . . . . . . . . . . . . . . . . . . . . . . $ 893 33.8% $ 938 37.6% (4.8)% (3.8)%Service and other . . . . . . . . . . . . . . . 405 18.4% 416 21.9% (2.6)% (3.5)%
Total cost of revenue . . . . . . . . . . $1,298 26.8% $1,354 30.8% (4.1)% (4.0)%
38

An
nu
alRep
ort
Cost of Product Revenue
Cost of product revenue decreased by $45 million, or 4.8 percent in fiscal year 2017, as compared to fiscal year2016. This decrease was driven primarily by a reduction in licensing costs as a result of a change in mix of ourtitles (i.e. Star Wars Battlefront was a fiscal 2016 title that had royalties associated with it while Battlefield 1 wasa fiscal 2017 title that does not bear royalties). This was partially offset by the recognition of a $15 millionimpairment charge on an acquisition-related intangible asset, as well an increase in royalty costs associated withFIFA 17 and Titanfall 2.
Cost of Service and Other Revenue
Cost of service and other revenue decreased by $11 million, or 2.6 percent in fiscal year 2017, as compared tofiscal year 2016. The decrease was primarily due to a decrease in inventory costs due to the launch of Need forSpeed 2015 during fiscal year 2016 without a comparable service game launch during fiscal year 2017, partiallyoffset by the recognition of a $10 million impairment charge on a royalty-based asset, and an increase in royaltycosts associated with FIFA Ultimate Team and Star Wars: Galaxy of Heroes during fiscal year 2017.
Total Cost of Revenue as a Percentage of Total Net Revenue
During fiscal year 2017, total cost of revenue as a percentage of total net revenue decreased by 4.0 percent ascompared to the fiscal year ended March 31, 2016. This decrease was primarily due to an increase in theproportion of our digital net revenues to packaged goods and other net revenues, as well as lower royaltiesexpense associated with our current year title mix as compared to fiscal year 2016.
Research and Development
Research and development expenses for fiscal years 2017 and 2016 were as follows (in millions):
March 31,2017
% of NetRevenue
March 31,2016
% of NetRevenue $ Change % Change
$1,205 25% $1,109 25% $96 9%
Research and development expenses increased by $96 million, or 9 percent, in fiscal year 2017, as compared tofiscal year 2016. This $96 million increase was primarily due to a (1) $41 million increase in contracted servicesprimarily driven by an increase in development advances to third-party developers associated with the Star Warsfranchise, (2) an aggregate $32 million pre-launch loss on previously unrecognized minimum royalty-basedcommitments and impairment on royalty-based assets, and (3) a $23 million increase in personnel-related costsprimarily resulting from an increase in headcount. These increases were partially offset by the quarter endedJune 30, 2016 containing 13 weeks of personnel costs as compared to 14 weeks in the prior fiscal year, as well asa reduction in losses of $10 million from our cash flow hedging program in fiscal 2017 as compared to fiscal2016. We use hedges to protect against currency exchange rate movements in our research and developmentexpenses.
Marketing and Sales
Marketing and sales expenses for fiscal years 2017 and 2016 were as follows (in millions):
March 31,2017
% of NetRevenue
March 31,2016
% of NetRevenue $ Change % Change
$673 14% $622 14% $51 8%
Marketing and sales expenses increased by $51 million, or 8 percent, in fiscal year 2017, as compared to fiscalyear 2016. This $51 million increase was driven by higher advertising expenses associated with our fiscal year2017 game launches, primarily Battlefield 1 and Titanfall 2, as compared to advertising expenses associated withour fiscal year 2016 game launches.
39

General and Administrative
General and administrative expenses for fiscal years 2017 and 2016 were as follows (in millions):
March 31,2017
% of NetRevenue
March 31,2016
% of NetRevenue $ Change % Change
$439 9% $406 9% $33 8%
General and administrative expenses increased by $33 million, or 8 percent, in fiscal year 2017, as compared tofiscal year 2016. This $33 million increase was primarily due to (1) a $12 million increase in facility-relatedexpense primarily due to office expansions, (2) a $7 million increase in contracted services primarily due tohigher legal expenses, and (3) a $6 million increase in personnel-related costs resulting from an increase inheadcount.
Income Taxes
Provision for (benefit from) income taxes for fiscal years 2017 and 2016 was as follows (in millions):
March 31,2017
EffectiveTaxRate
March 31,2016
EffectiveTax Rate
$243 20.1% $(279) (31.8)%
Our effective tax rate for fiscal year 2017 was 20.1 percent. Our effective tax rate for the fiscal year 2017 differsfrom the statutory rate of 35.0 percent primarily due to non-U.S. profits subject to a reduced or zero tax rates.The effective tax rate for fiscal year 2017 differs from fiscal year 2016 primarily due to the reversal of asignificant portion of our deferred tax valuation allowance recorded in fiscal year 2016. Excluding the impact ofthe reversal of the valuation allowance, our effective tax rate for fiscal year 2016 would have been 19.8 percent,which differs from the statutory rate of 35.0 percent primarily due to non-U.S. profits subject to a reduced or zerotax rates.
In the fourth quarter of fiscal year 2016, we realized significant U.S. pre-tax income for both the fourth quarterand the fiscal year ended March 31, 2016. As a result, we released the valuation allowance against all of the U.S.federal deferred tax assets and a portion of the U.S. state deferred tax assets during the fourth quarter of fiscalyear 2016. Accordingly, we recorded a $453 million income tax benefit in fiscal year 2016 for the reversal of asignificant portion of our deferred tax valuation allowance.
40
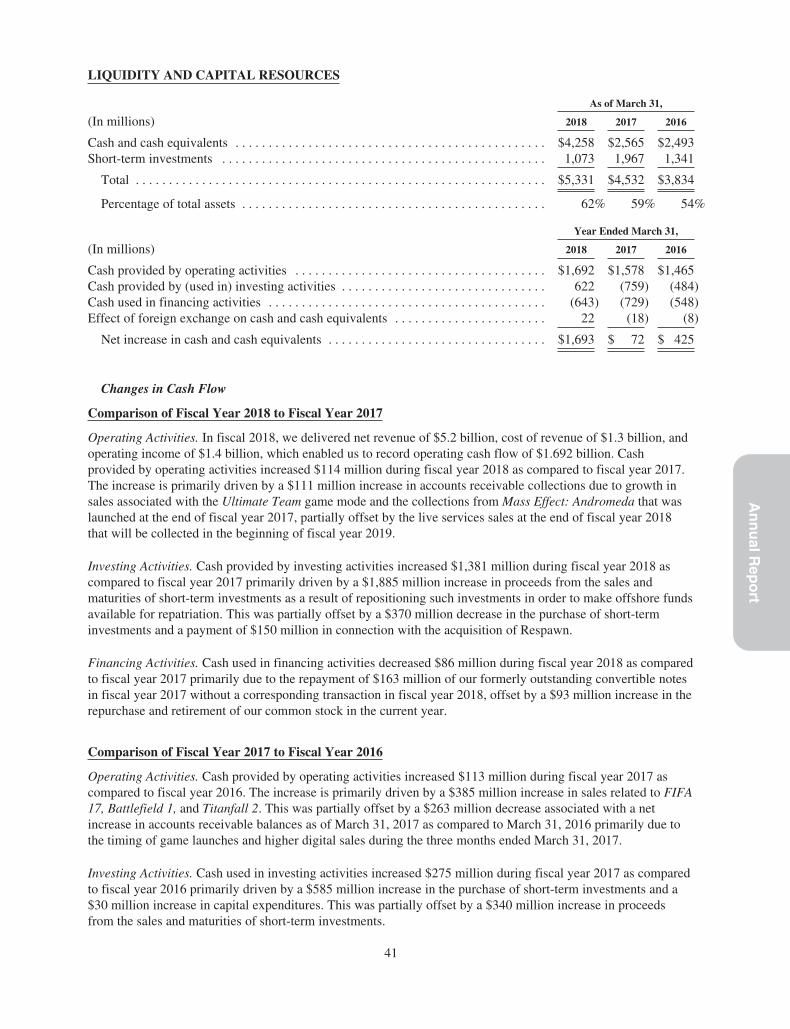
An
nu
alRep
ort
LIQUIDITY AND CAPITAL RESOURCES
As of March 31,
(In millions) 2018 2017 2016
Cash and cash equivalents . . . . . . . . . . . . . . . . . . . . . . . . . . . . . . . . . . . . . . . . . . . . . . . $4,258 $2,565 $2,493Short-term investments . . . . . . . . . . . . . . . . . . . . . . . . . . . . . . . . . . . . . . . . . . . . . . . . . 1,073 1,967 1,341
Total . . . . . . . . . . . . . . . . . . . . . . . . . . . . . . . . . . . . . . . . . . . . . . . . . . . . . . . . . . . . . . $5,331 $4,532 $3,834
Percentage of total assets . . . . . . . . . . . . . . . . . . . . . . . . . . . . . . . . . . . . . . . . . . . . . . 62% 59% 54%
Year Ended March 31,
(In millions) 2018 2017 2016
Cash provided by operating activities . . . . . . . . . . . . . . . . . . . . . . . . . . . . . . . . . . . . . . $1,692 $1,578 $1,465Cash provided by (used in) investing activities . . . . . . . . . . . . . . . . . . . . . . . . . . . . . . . 622 (759) (484)Cash used in financing activities . . . . . . . . . . . . . . . . . . . . . . . . . . . . . . . . . . . . . . . . . . (643) (729) (548)Effect of foreign exchange on cash and cash equivalents . . . . . . . . . . . . . . . . . . . . . . . 22 (18) (8)
Net increase in cash and cash equivalents . . . . . . . . . . . . . . . . . . . . . . . . . . . . . . . . . $1,693 $ 72 $ 425
Changes in Cash Flow
Comparison of Fiscal Year 2018 to Fiscal Year 2017
Operating Activities. In fiscal 2018, we delivered net revenue of $5.2 billion, cost of revenue of $1.3 billion, andoperating income of $1.4 billion, which enabled us to record operating cash flow of $1.692 billion. Cashprovided by operating activities increased $114 million during fiscal year 2018 as compared to fiscal year 2017.The increase is primarily driven by a $111 million increase in accounts receivable collections due to growth insales associated with the Ultimate Team game mode and the collections from Mass Effect: Andromeda that waslaunched at the end of fiscal year 2017, partially offset by the live services sales at the end of fiscal year 2018that will be collected in the beginning of fiscal year 2019.
Investing Activities. Cash provided by investing activities increased $1,381 million during fiscal year 2018 ascompared to fiscal year 2017 primarily driven by a $1,885 million increase in proceeds from the sales andmaturities of short-term investments as a result of repositioning such investments in order to make offshore fundsavailable for repatriation. This was partially offset by a $370 million decrease in the purchase of short-terminvestments and a payment of $150 million in connection with the acquisition of Respawn.
Financing Activities. Cash used in financing activities decreased $86 million during fiscal year 2018 as comparedto fiscal year 2017 primarily due to the repayment of $163 million of our formerly outstanding convertible notesin fiscal year 2017 without a corresponding transaction in fiscal year 2018, offset by a $93 million increase in therepurchase and retirement of our common stock in the current year.
Comparison of Fiscal Year 2017 to Fiscal Year 2016
Operating Activities. Cash provided by operating activities increased $113 million during fiscal year 2017 ascompared to fiscal year 2016. The increase is primarily driven by a $385 million increase in sales related to FIFA17, Battlefield 1, and Titanfall 2. This was partially offset by a $263 million decrease associated with a netincrease in accounts receivable balances as of March 31, 2017 as compared to March 31, 2016 primarily due tothe timing of game launches and higher digital sales during the three months ended March 31, 2017.
Investing Activities. Cash used in investing activities increased $275 million during fiscal year 2017 as comparedto fiscal year 2016 primarily driven by a $585 million increase in the purchase of short-term investments and a$30 million increase in capital expenditures. This was partially offset by a $340 million increase in proceedsfrom the sales and maturities of short-term investments.
41

Financing Activities. Cash used in financing activities increased $181 million during fiscal year 2017 ascompared to fiscal year 2016 primarily due to the issuance of Senior Notes for $989 million offset by therepurchases of our common stock for $510 million, both of which occurred during fiscal 2016. Also, we had a$35 million decrease in proceeds from the exercise of stock options and a $26 million decrease in taxes paid forshares withheld from employees, which were offset by a $307 million decrease in repayments related to ourConvertible Notes during fiscal year 2017 as compared to fiscal year 2016.
Short-term Investments
Due to our mix of fixed and variable rate securities, our short-term investment portfolio is susceptible to changesin short-term interest rates. As of March 31, 2018, our short-term investments had gross unrealized losses of$9 million, or less than 1 percent of the total in short-term investments, and gross unrealized gains of less than$1 million, or less than 1 percent of the total in short-term investments. From time to time, we may liquidatesome or all of our short-term investments to fund operational needs or other activities, such as capitalexpenditures, business acquisitions or stock repurchase programs.
Senior Notes
In February 2016, we issued $600 million aggregate principal amount of the 2021 Notes and $400 millionaggregate principal amount of the 2026 Notes. We used the net proceeds of $989 million for general corporatepurposes, including the payment of our formerly outstanding convertible notes and repurchases of our commonstock. The effective interest rate is 3.94% for the 2021 Notes and 4.97% for the 2026 Notes. Interest is payablesemiannually in arrears, on March 1 and September 1 of each year. See Note 11 — Financing Arrangements tothe Consolidated Financial Statements in this Form 10-K as it relates to our Senior Notes, which is incorporatedby reference into this Item 7.
Credit Facility
In March 2015, we entered into a $500 million senior unsecured revolving credit facility with a syndicate ofbanks. As of March 31, 2018, no amounts were outstanding under the credit facility. See Note 11 — FinancingArrangements to the Consolidated Financial Statements in this Form 10-K as it relates to our credit facility,which is incorporated by reference into this Item 7.
Financial Condition
We believe that our cash, cash equivalents, short-term investments, cash generated from operations and availablefinancing facilities will be sufficient to meet our operating requirements for at least the next 12 months, includingworking capital requirements, capital expenditures, debt repayment obligations, stock repurchases, andpotentially, future acquisitions, or strategic investments. We may choose at any time to raise additional capital torepay debt, strengthen our financial position, facilitate expansion, repurchase our stock, pursue strategicacquisitions and investments, and/or to take advantage of business opportunities as they arise. There can be noassurance, however, that such additional capital will be available to us on favorable terms, if at all, or that it willnot result in substantial dilution to our existing stockholders.
As of March 31, 2018, approximately $3.7 billion of our cash, cash equivalents, and short-term investments weredomiciled in foreign tax jurisdictions. As a result of the U.S. Tax Act, which generally implemented a territorialtax system, a substantial portion of this amount is available for repatriation.
In May 2018, a Special Committee of our Board of Directors, on behalf of the full Board of Directors, authorizeda program to repurchase up to $2.4 billion of our common stock. This stock repurchase program supersedes andreplaces the May 2017 program described below, and expires on May 31, 2020. Under this program, we maypurchase stock in the open market or through privately-negotiated transactions in accordance with applicablesecurities laws, including pursuant to pre-arranged stock trading plans. The timing and actual amount of the stockrepurchases will depend on several factors including price, capital availability, regulatory requirements,
42
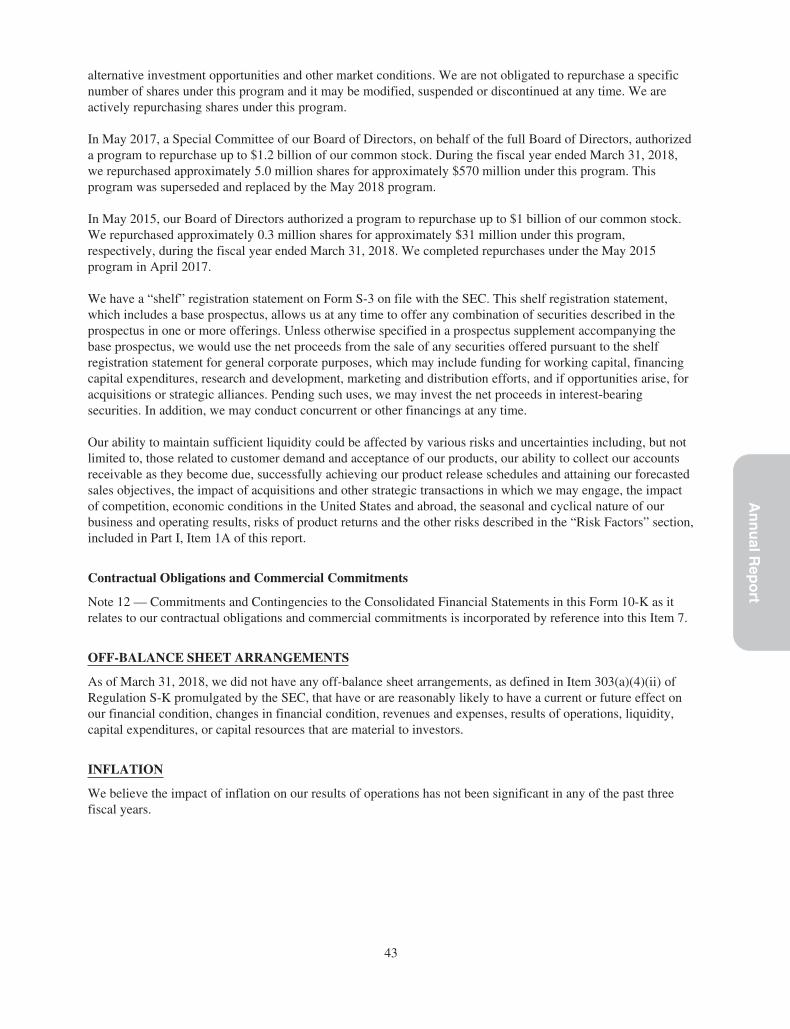
An
nu
alRep
ort
alternative investment opportunities and other market conditions. We are not obligated to repurchase a specificnumber of shares under this program and it may be modified, suspended or discontinued at any time. We areactively repurchasing shares under this program.
In May 2017, a Special Committee of our Board of Directors, on behalf of the full Board of Directors, authorizeda program to repurchase up to $1.2 billion of our common stock. During the fiscal year ended March 31, 2018,we repurchased approximately 5.0 million shares for approximately $570 million under this program. Thisprogram was superseded and replaced by the May 2018 program.
In May 2015, our Board of Directors authorized a program to repurchase up to $1 billion of our common stock.We repurchased approximately 0.3 million shares for approximately $31 million under this program,respectively, during the fiscal year ended March 31, 2018. We completed repurchases under the May 2015program in April 2017.
We have a “shelf” registration statement on Form S-3 on file with the SEC. This shelf registration statement,which includes a base prospectus, allows us at any time to offer any combination of securities described in theprospectus in one or more offerings. Unless otherwise specified in a prospectus supplement accompanying thebase prospectus, we would use the net proceeds from the sale of any securities offered pursuant to the shelfregistration statement for general corporate purposes, which may include funding for working capital, financingcapital expenditures, research and development, marketing and distribution efforts, and if opportunities arise, foracquisitions or strategic alliances. Pending such uses, we may invest the net proceeds in interest-bearingsecurities. In addition, we may conduct concurrent or other financings at any time.
Our ability to maintain sufficient liquidity could be affected by various risks and uncertainties including, but notlimited to, those related to customer demand and acceptance of our products, our ability to collect our accountsreceivable as they become due, successfully achieving our product release schedules and attaining our forecastedsales objectives, the impact of acquisitions and other strategic transactions in which we may engage, the impactof competition, economic conditions in the United States and abroad, the seasonal and cyclical nature of ourbusiness and operating results, risks of product returns and the other risks described in the “Risk Factors” section,included in Part I, Item 1A of this report.
Contractual Obligations and Commercial Commitments
Note 12 — Commitments and Contingencies to the Consolidated Financial Statements in this Form 10-K as itrelates to our contractual obligations and commercial commitments is incorporated by reference into this Item 7.
OFF-BALANCE SHEET ARRANGEMENTS
As of March 31, 2018, we did not have any off-balance sheet arrangements, as defined in Item 303(a)(4)(ii) ofRegulation S-K promulgated by the SEC, that have or are reasonably likely to have a current or future effect onour financial condition, changes in financial condition, revenues and expenses, results of operations, liquidity,capital expenditures, or capital resources that are material to investors.
INFLATION
We believe the impact of inflation on our results of operations has not been significant in any of the past threefiscal years.
43
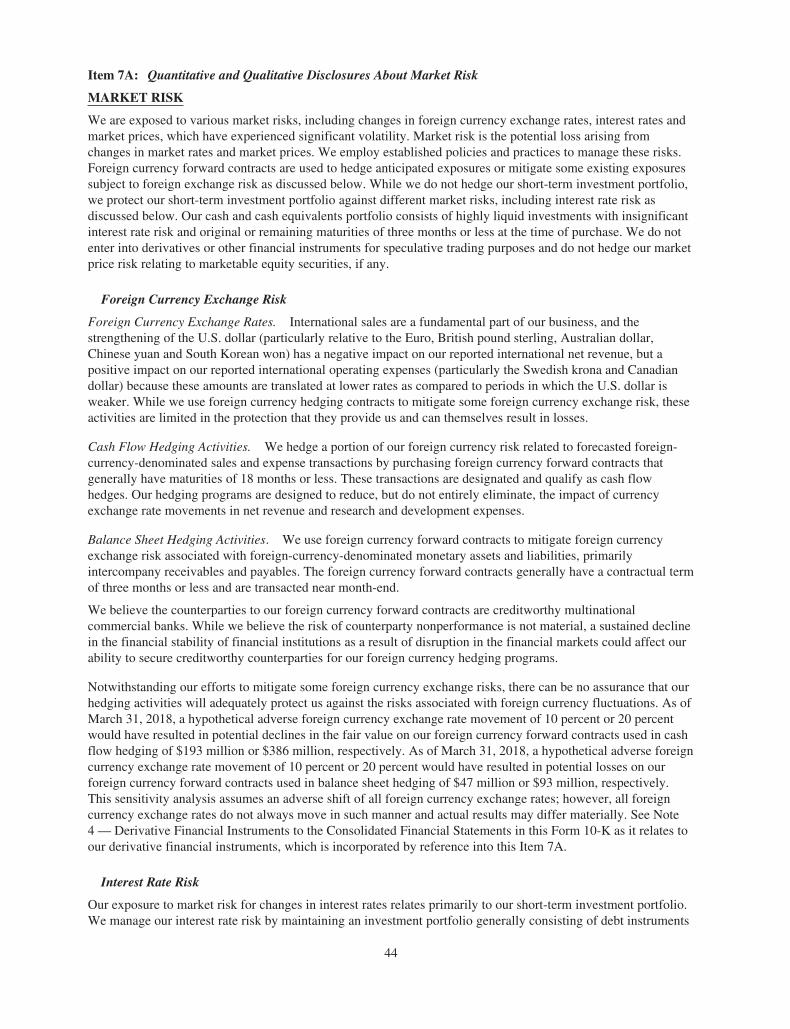
Item 7A: Quantitative and Qualitative Disclosures About Market Risk
MARKET RISK
We are exposed to various market risks, including changes in foreign currency exchange rates, interest rates andmarket prices, which have experienced significant volatility. Market risk is the potential loss arising fromchanges in market rates and market prices. We employ established policies and practices to manage these risks.Foreign currency forward contracts are used to hedge anticipated exposures or mitigate some existing exposuressubject to foreign exchange risk as discussed below. While we do not hedge our short-term investment portfolio,we protect our short-term investment portfolio against different market risks, including interest rate risk asdiscussed below. Our cash and cash equivalents portfolio consists of highly liquid investments with insignificantinterest rate risk and original or remaining maturities of three months or less at the time of purchase. We do notenter into derivatives or other financial instruments for speculative trading purposes and do not hedge our marketprice risk relating to marketable equity securities, if any.
Foreign Currency Exchange Risk
Foreign Currency Exchange Rates. International sales are a fundamental part of our business, and thestrengthening of the U.S. dollar (particularly relative to the Euro, British pound sterling, Australian dollar,Chinese yuan and South Korean won) has a negative impact on our reported international net revenue, but apositive impact on our reported international operating expenses (particularly the Swedish krona and Canadiandollar) because these amounts are translated at lower rates as compared to periods in which the U.S. dollar isweaker. While we use foreign currency hedging contracts to mitigate some foreign currency exchange risk, theseactivities are limited in the protection that they provide us and can themselves result in losses.
Cash Flow Hedging Activities. We hedge a portion of our foreign currency risk related to forecasted foreign-currency-denominated sales and expense transactions by purchasing foreign currency forward contracts thatgenerally have maturities of 18 months or less. These transactions are designated and qualify as cash flowhedges. Our hedging programs are designed to reduce, but do not entirely eliminate, the impact of currencyexchange rate movements in net revenue and research and development expenses.
Balance Sheet Hedging Activities. We use foreign currency forward contracts to mitigate foreign currencyexchange risk associated with foreign-currency-denominated monetary assets and liabilities, primarilyintercompany receivables and payables. The foreign currency forward contracts generally have a contractual termof three months or less and are transacted near month-end.
We believe the counterparties to our foreign currency forward contracts are creditworthy multinationalcommercial banks. While we believe the risk of counterparty nonperformance is not material, a sustained declinein the financial stability of financial institutions as a result of disruption in the financial markets could affect ourability to secure creditworthy counterparties for our foreign currency hedging programs.
Notwithstanding our efforts to mitigate some foreign currency exchange risks, there can be no assurance that ourhedging activities will adequately protect us against the risks associated with foreign currency fluctuations. As ofMarch 31, 2018, a hypothetical adverse foreign currency exchange rate movement of 10 percent or 20 percentwould have resulted in potential declines in the fair value on our foreign currency forward contracts used in cashflow hedging of $193 million or $386 million, respectively. As of March 31, 2018, a hypothetical adverse foreigncurrency exchange rate movement of 10 percent or 20 percent would have resulted in potential losses on ourforeign currency forward contracts used in balance sheet hedging of $47 million or $93 million, respectively.This sensitivity analysis assumes an adverse shift of all foreign currency exchange rates; however, all foreigncurrency exchange rates do not always move in such manner and actual results may differ materially. See Note4 — Derivative Financial Instruments to the Consolidated Financial Statements in this Form 10-K as it relates toour derivative financial instruments, which is incorporated by reference into this Item 7A.
Interest Rate Risk
Our exposure to market risk for changes in interest rates relates primarily to our short-term investment portfolio.We manage our interest rate risk by maintaining an investment portfolio generally consisting of debt instruments
44

An
nu
alRep
ort
of high credit quality and relatively short maturities. However, because short-term investments mature relativelyquickly and, if reinvested, are invested at the then-current market rates, interest income on a portfolio consistingof short-term investments is subject to market fluctuations to a greater extent than a portfolio of longer terminvestments. Additionally, the contractual terms of the investments do not permit the issuer to call, prepay orotherwise settle the investments at prices less than the stated par value. Our investments are held for purposesother than trading. We do not use derivative financial instruments in our short-term investment portfolio.
As of March 31, 2018, our short-term investments were classified as available-for-sale securities and,consequently, were recorded at fair value with unrealized gains or losses resulting from changes in fair valuereported as a separate component of accumulated other comprehensive income (loss), net of tax, in stockholders’equity.
Notwithstanding our efforts to manage interest rate risks, there can be no assurance that we will be adequatelyprotected against risks associated with interest rate fluctuations. Fluctuations in interest rates could have asignificant impact on the fair value of our investment portfolio. The following table presents the hypotheticalchanges in the fair value of our short-term investment portfolio as of March 31, 2018, arising from potentialchanges in interest rates. The modeling technique estimates the change in fair value from immediate hypotheticalparallel shifts in the yield curve of plus or minus 50 basis points (“BPS”), 100 BPS, and 150 BPS.
Valuation of SecuritiesGiven an Interest Rate Decrease
of X Basis Points
Fair Valueas of
March 31,2018
Valuation of Securities Givenan Interest Rate Increase of
X Basis Points
(In millions) (150 BPS) (100 BPS) (50 BPS) 50 BPS 100 BPS 150 BPS
Corporate bonds . . . . . . . . . . . . . . . . . . . . $ 634 $ 631 $ 627 $ 624 $ 621 $ 617 $ 614U.S. Treasury securities . . . . . . . . . . . . . . 213 212 211 210 209 208 206U.S. agency securities . . . . . . . . . . . . . . . 80 79 79 78 78 77 77Commercial paper . . . . . . . . . . . . . . . . . . 109 109 109 109 109 108 108Foreign government securities . . . . . . . . 53 53 53 52 52 51 51
Total short-term investments . . . . . . . . $1,089 $1,084 $1,079 $1,073 $1,069 $1,061 $1,056
45

Item 8: Financial Statements and Supplementary Data
Index to Consolidated Financial Statements
Page
Consolidated Financial Statements of Electronic Arts Inc. and Subsidiaries:
Consolidated Balance Sheets as of March 31, 2018 and 2017 . . . . . . . . . . . . . . . . . . . . . . . . . . . . . . . . . . . 47
Consolidated Statements of Operations for the Years Ended March 31, 2018, 2017 and 2016 . . . . . . . . . 48
Consolidated Statements of Comprehensive Income for the Years Ended March 31, 2018, 2017 and2016 . . . . . . . . . . . . . . . . . . . . . . . . . . . . . . . . . . . . . . . . . . . . . . . . . . . . . . . . . . . . . . . . . . . . . . . . . . . . . 49
Consolidated Statements of Stockholders’ Equity for the Years Ended March 31, 2018, 2017 and2016 . . . . . . . . . . . . . . . . . . . . . . . . . . . . . . . . . . . . . . . . . . . . . . . . . . . . . . . . . . . . . . . . . . . . . . . . . . . . . 50
Consolidated Statements of Cash Flows for the Years Ended March 31, 2018, 2017 and 2016 . . . . . . . . . 51
Notes to Consolidated Financial Statements . . . . . . . . . . . . . . . . . . . . . . . . . . . . . . . . . . . . . . . . . . . . . . . . 52
Report of Independent Registered Public Accounting Firm . . . . . . . . . . . . . . . . . . . . . . . . . . . . . . . . . . . . 89
Financial Statement Schedule:
The following financial statement schedule of Electronic Arts Inc. and Subsidiaries for the years endedMarch 31, 2018, 2017 and 2016 is filed as part of this report and should be read in conjunction withthe Consolidated Financial Statements of Electronic Arts Inc. and Subsidiaries:
Schedule II — Valuation and Qualifying Accounts . . . . . . . . . . . . . . . . . . . . . . . . . . . . . . . . . . . . . . . . . 94
Other financial statement schedules have been omitted because the information called for in them is not requiredor has already been included in either the Consolidated Financial Statements or the Notes thereto.
46

An
nu
alRep
ort
ELECTRONIC ARTS INC. AND SUBSIDIARIES
CONSOLIDATED BALANCE SHEETS
(In millions, except par value data)March 31,
2018March 31,
2017
ASSETSCurrent assets:
Cash and cash equivalents . . . . . . . . . . . . . . . . . . . . . . . . . . . . . . . . . . . . . . . . . . . . . . . . . . $4,258 $2,565Short-term investments . . . . . . . . . . . . . . . . . . . . . . . . . . . . . . . . . . . . . . . . . . . . . . . . . . . . 1,073 1,967Receivables, net of allowances of $165 and $145, respectively . . . . . . . . . . . . . . . . . . . . . 385 359Other current assets . . . . . . . . . . . . . . . . . . . . . . . . . . . . . . . . . . . . . . . . . . . . . . . . . . . . . . . 288 308
Total current assets . . . . . . . . . . . . . . . . . . . . . . . . . . . . . . . . . . . . . . . . . . . . . . . . . . . . . 6,004 5,199
Property and equipment, net . . . . . . . . . . . . . . . . . . . . . . . . . . . . . . . . . . . . . . . . . . . . . . . . . . 453 434Goodwill . . . . . . . . . . . . . . . . . . . . . . . . . . . . . . . . . . . . . . . . . . . . . . . . . . . . . . . . . . . . . . . . . 1,883 1,707Acquisition-related intangibles, net . . . . . . . . . . . . . . . . . . . . . . . . . . . . . . . . . . . . . . . . . . . . 71 8Deferred income taxes, net . . . . . . . . . . . . . . . . . . . . . . . . . . . . . . . . . . . . . . . . . . . . . . . . . . . 84 286Other assets . . . . . . . . . . . . . . . . . . . . . . . . . . . . . . . . . . . . . . . . . . . . . . . . . . . . . . . . . . . . . . . 89 84
TOTAL ASSETS . . . . . . . . . . . . . . . . . . . . . . . . . . . . . . . . . . . . . . . . . . . . . . . . . . . . . . . . $8,584 $7,718
LIABILITIES AND STOCKHOLDERS’ EQUITY
Current liabilities:Accounts payable . . . . . . . . . . . . . . . . . . . . . . . . . . . . . . . . . . . . . . . . . . . . . . . . . . . . . . . . $ 48 $ 87Accrued and other current liabilities . . . . . . . . . . . . . . . . . . . . . . . . . . . . . . . . . . . . . . . . . . 821 789Deferred net revenue (online-enabled games) . . . . . . . . . . . . . . . . . . . . . . . . . . . . . . . . . . 1,622 1,539
Total current liabilities . . . . . . . . . . . . . . . . . . . . . . . . . . . . . . . . . . . . . . . . . . . . . . . . . . 2,491 2,415
Senior notes, net . . . . . . . . . . . . . . . . . . . . . . . . . . . . . . . . . . . . . . . . . . . . . . . . . . . . . . . . . . . 992 990Income tax obligations . . . . . . . . . . . . . . . . . . . . . . . . . . . . . . . . . . . . . . . . . . . . . . . . . . . . . . 250 104Deferred income taxes, net . . . . . . . . . . . . . . . . . . . . . . . . . . . . . . . . . . . . . . . . . . . . . . . . . . . 1 1Other liabilities . . . . . . . . . . . . . . . . . . . . . . . . . . . . . . . . . . . . . . . . . . . . . . . . . . . . . . . . . . . . 255 148
Total liabilities . . . . . . . . . . . . . . . . . . . . . . . . . . . . . . . . . . . . . . . . . . . . . . . . . . . . . . . . 3,989 3,658
Commitments and contingencies (See Note 12)
Stockholders’ equity:Preferred stock, $0.01 par value. 10 shares authorized . . . . . . . . . . . . . . . . . . . . . . . . . . . . — —Common stock, $0.01 par value. 1,000 shares authorized; 306 and 308 shares issued and
outstanding, respectively . . . . . . . . . . . . . . . . . . . . . . . . . . . . . . . . . . . . . . . . . . . . . . . . . 3 3Additional paid-in capital . . . . . . . . . . . . . . . . . . . . . . . . . . . . . . . . . . . . . . . . . . . . . . . . . . 657 1,049Retained earnings . . . . . . . . . . . . . . . . . . . . . . . . . . . . . . . . . . . . . . . . . . . . . . . . . . . . . . . . 4,062 3,027Accumulated other comprehensive loss . . . . . . . . . . . . . . . . . . . . . . . . . . . . . . . . . . . . . . . (127) (19)
Total stockholders’ equity . . . . . . . . . . . . . . . . . . . . . . . . . . . . . . . . . . . . . . . . . . . . . . . . 4,595 4,060
TOTAL LIABILITIES AND STOCKHOLDERS’ EQUITY . . . . . . . . . . . . . . . . . . . . $8,584 $7,718
See accompanying Notes to Consolidated Financial Statements.
47

ELECTRONIC ARTS INC. AND SUBSIDIARIES
CONSOLIDATED STATEMENTS OF OPERATIONS
Year Ended March 31,
(In millions, except per share data) 2018 2017 2016
Net revenue:Product . . . . . . . . . . . . . . . . . . . . . . . . . . . . . . . . . . . . . . . . . . . . . . . . . . . . . . . . . . . . $2,586 $2,640 $2,497Service and other . . . . . . . . . . . . . . . . . . . . . . . . . . . . . . . . . . . . . . . . . . . . . . . . . . . . 2,564 2,205 1,899
Total net revenue . . . . . . . . . . . . . . . . . . . . . . . . . . . . . . . . . . . . . . . . . . . . . . . . . . 5,150 4,845 4,396
Cost of revenue:Product . . . . . . . . . . . . . . . . . . . . . . . . . . . . . . . . . . . . . . . . . . . . . . . . . . . . . . . . . . . . 822 893 938Service and other . . . . . . . . . . . . . . . . . . . . . . . . . . . . . . . . . . . . . . . . . . . . . . . . . . . . 455 405 416
Total cost of revenue . . . . . . . . . . . . . . . . . . . . . . . . . . . . . . . . . . . . . . . . . . . . . . . 1,277 1,298 1,354
Gross profit . . . . . . . . . . . . . . . . . . . . . . . . . . . . . . . . . . . . . . . . . . . . . . . . . . . . . . . . . 3,873 3,547 3,042
Operating expenses:Research and development . . . . . . . . . . . . . . . . . . . . . . . . . . . . . . . . . . . . . . . . . . . . . 1,320 1,205 1,109Marketing and sales . . . . . . . . . . . . . . . . . . . . . . . . . . . . . . . . . . . . . . . . . . . . . . . . . . 641 673 622General and administrative . . . . . . . . . . . . . . . . . . . . . . . . . . . . . . . . . . . . . . . . . . . . 469 439 406Amortization of intangibles . . . . . . . . . . . . . . . . . . . . . . . . . . . . . . . . . . . . . . . . . . . . 9 6 7
Total operating expenses . . . . . . . . . . . . . . . . . . . . . . . . . . . . . . . . . . . . . . . . . . 2,439 2,323 2,144
Operating income . . . . . . . . . . . . . . . . . . . . . . . . . . . . . . . . . . . . . . . . . . . . . . . . . . 1,434 1,224 898Interest and other income (expense), net . . . . . . . . . . . . . . . . . . . . . . . . . . . . . . . . . . . . 15 (14) (21)
Income before provision for (benefit from) income taxes . . . . . . . . . . . . . . . . . . . . . . . 1,449 1,210 877Provision for (benefit from) income taxes . . . . . . . . . . . . . . . . . . . . . . . . . . . . . . . . . . . 406 243 (279)
Net income . . . . . . . . . . . . . . . . . . . . . . . . . . . . . . . . . . . . . . . . . . . . . . . . . . . . . . . . . $1,043 $ 967 $1,156
Earnings per share:Basic . . . . . . . . . . . . . . . . . . . . . . . . . . . . . . . . . . . . . . . . . . . . . . . . . . . . . . . . . . . . . . $ 3.39 $ 3.19 $ 3.73Diluted . . . . . . . . . . . . . . . . . . . . . . . . . . . . . . . . . . . . . . . . . . . . . . . . . . . . . . . . . . . . $ 3.34 $ 3.08 $ 3.50
Number of shares used in computation:Basic . . . . . . . . . . . . . . . . . . . . . . . . . . . . . . . . . . . . . . . . . . . . . . . . . . . . . . . . . . . . . . 308 303 310Diluted . . . . . . . . . . . . . . . . . . . . . . . . . . . . . . . . . . . . . . . . . . . . . . . . . . . . . . . . . . . . 312 314 330
See accompanying Notes to Consolidated Financial Statements.
48
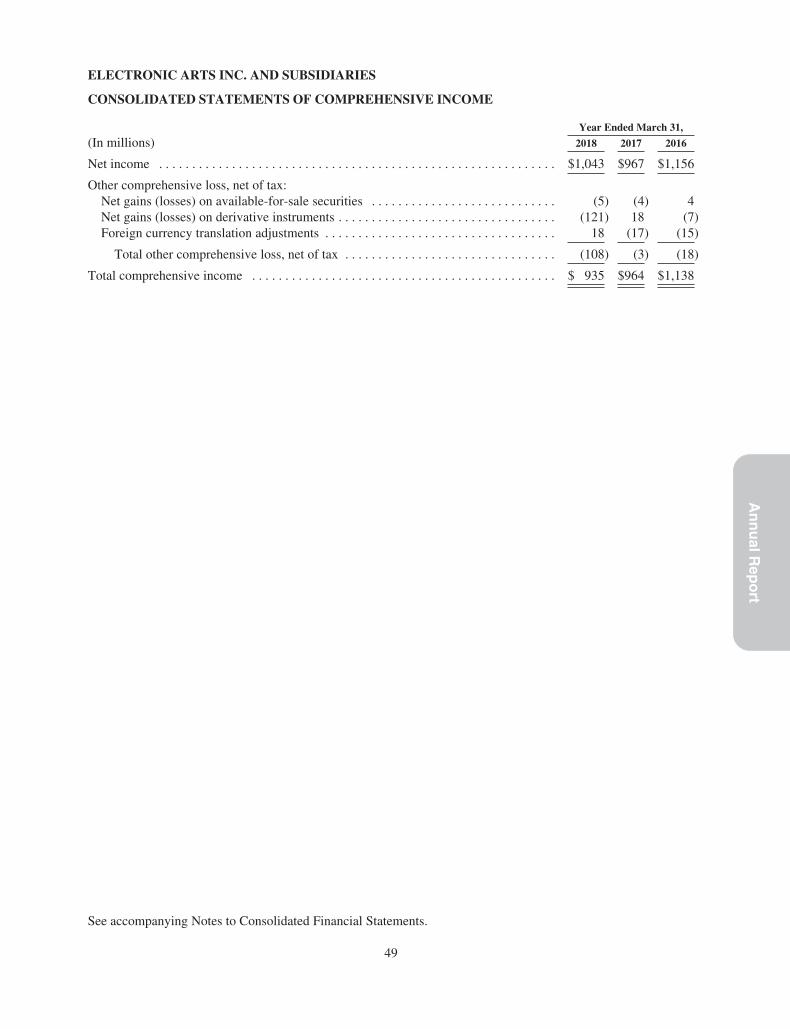
An
nu
alRep
ort
ELECTRONIC ARTS INC. AND SUBSIDIARIES
CONSOLIDATED STATEMENTS OF COMPREHENSIVE INCOME
Year Ended March 31,
(In millions) 2018 2017 2016
Net income . . . . . . . . . . . . . . . . . . . . . . . . . . . . . . . . . . . . . . . . . . . . . . . . . . . . . . . . . . . . $1,043 $967 $1,156
Other comprehensive loss, net of tax:Net gains (losses) on available-for-sale securities . . . . . . . . . . . . . . . . . . . . . . . . . . . . (5) (4) 4Net gains (losses) on derivative instruments . . . . . . . . . . . . . . . . . . . . . . . . . . . . . . . . . (121) 18 (7)Foreign currency translation adjustments . . . . . . . . . . . . . . . . . . . . . . . . . . . . . . . . . . . 18 (17) (15)
Total other comprehensive loss, net of tax . . . . . . . . . . . . . . . . . . . . . . . . . . . . . . . . (108) (3) (18)
Total comprehensive income . . . . . . . . . . . . . . . . . . . . . . . . . . . . . . . . . . . . . . . . . . . . . . $ 935 $964 $1,138
See accompanying Notes to Consolidated Financial Statements.
49

ELECTRONIC ARTS INC. AND SUBSIDIARIES
CONSOLIDATED STATEMENTS OF STOCKHOLDERS’ EQUITY
(In millions, share data in thousands)
Common Stock AdditionalPaid-inCapital
RetainedEarnings
AccumulatedOther
ComprehensiveIncome (Loss)
TotalStockholders’
EquityShares Amount
Balances as of March 31, 2015 . . . . . . . 309,681 $ 3 $ 2,127 $ 904 $ 2 $ 3,036Total comprehensive income (loss) . . . — — — 1,156 (18) 1,138Issuance of common stock . . . . . . . . . . 6,645 — (49) — — (49)Reclassification of equity component
of convertible notes . . . . . . . . . . . . . — — 29 — — 29Settlement of convertible notes . . . . . . 7,823 — (1) — — (1)Exercise of convertible note hedge . . . (7,823) — — — — —Repurchase and retirement of common
stock . . . . . . . . . . . . . . . . . . . . . . . . . (15,724) — (1,018) — — (1,018)Stock-based compensation . . . . . . . . . . — — 178 — — 178Tax benefit from stock-based
compensation . . . . . . . . . . . . . . . . . . — — 83 — — 83
Balances as of March 31, 2016 . . . . . . . 300,602 3 1,349 2,060 (16) 3,396Total comprehensive income (loss) . . . — — — 967 (3) 964Issuance of common stock . . . . . . . . . . 4,626 — (55) — — (55)Reclassification of equity component
of convertible notes . . . . . . . . . . . . . — — 2 — — 2Settlement of convertible notes . . . . . . 2,917 — — — — —Exercise of convertible note hedge . . . (2,917) — — — — —Repurchase and retirement of common
stock . . . . . . . . . . . . . . . . . . . . . . . . . (6,506) — (508) — — (508)Settlement of warrants . . . . . . . . . . . . . 9,645 — — — — —Stock-based compensation . . . . . . . . . . — — 196 — — 196Tax benefit from stock-based
compensation . . . . . . . . . . . . . . . . . . — — 65 — — 65
Balances as of March 31, 2017 . . . . . . . 308,367 3 1,049 3,027 (19) 4,060Cumulative-effect adjustment from the
adoption of ASU 2016-09 . . . . . . . . — — 9 (8) — 1Total comprehensive income (loss) . . . — — — 1,043 (108) 935Issuance of common stock . . . . . . . . . . 3,332 — (42) — — (42)Repurchase and retirement of common
stock . . . . . . . . . . . . . . . . . . . . . . . . . (5,329) — (601) — — (601)Stock-based compensation . . . . . . . . . . — — 242 — — 242
Balances as of March 31, 2018 . . . . . . . 306,370 $ 3 $ 657 $4,062 $(127) $ 4,595
See accompanying Notes to Consolidated Financial Statements.
50

An
nu
alRep
ort
ELECTRONIC ARTS INC. AND SUBSIDIARIES
CONSOLIDATED STATEMENTS OF CASH FLOWS
Year Ended March 31,
(In millions) 2018 2017 2016
OPERATING ACTIVITIESNet income . . . . . . . . . . . . . . . . . . . . . . . . . . . . . . . . . . . . . . . . . . . . . . . . . . . . . . . $ 1,043 $ 967 $ 1,156Adjustments to reconcile net income to net cash provided by operating
activities:Depreciation, amortization and accretion . . . . . . . . . . . . . . . . . . . . . . . . . . . . . 136 172 197Stock-based compensation . . . . . . . . . . . . . . . . . . . . . . . . . . . . . . . . . . . . . . . . . 242 196 178Loss on conversion of convertible notes . . . . . . . . . . . . . . . . . . . . . . . . . . . . . . — — 10Change in assets and liabilities:
Receivables, net . . . . . . . . . . . . . . . . . . . . . . . . . . . . . . . . . . . . . . . . . . . . . . . (25) (136) 127Other assets . . . . . . . . . . . . . . . . . . . . . . . . . . . . . . . . . . . . . . . . . . . . . . . . . . 10 3 22Accounts payable . . . . . . . . . . . . . . . . . . . . . . . . . . . . . . . . . . . . . . . . . . . . . . (44) 5 13Accrued and other liabilities . . . . . . . . . . . . . . . . . . . . . . . . . . . . . . . . . . . . . 43 190 (10)Deferred income taxes, net . . . . . . . . . . . . . . . . . . . . . . . . . . . . . . . . . . . . . . . 204 100 (403)Deferred net revenue (online-enabled games) . . . . . . . . . . . . . . . . . . . . . . . . 83 81 175
Net cash provided by operating activities . . . . . . . . . . . . . . . . . . . . . . . . . 1,692 1,578 1,465
INVESTING ACTIVITIESCapital expenditures . . . . . . . . . . . . . . . . . . . . . . . . . . . . . . . . . . . . . . . . . . . . . . . . (107) (123) (93)Proceeds from maturities and sales of short-term investments . . . . . . . . . . . . . . . 3,166 1,281 941Purchase of short-term investments . . . . . . . . . . . . . . . . . . . . . . . . . . . . . . . . . . . . (2,287) (1,917) (1,332)Acquisition, net of cash acquired . . . . . . . . . . . . . . . . . . . . . . . . . . . . . . . . . . . . . . (150) — —
Net cash provided by (used in) investing activities . . . . . . . . . . . . . . . . . . 622 (759) (484)
FINANCING ACTIVITIESProceeds from issuance of senior notes, net of issuance costs . . . . . . . . . . . . . . . . — — 989Payment of convertible notes . . . . . . . . . . . . . . . . . . . . . . . . . . . . . . . . . . . . . . . . . — (163) (470)Proceeds from issuance of common stock . . . . . . . . . . . . . . . . . . . . . . . . . . . . . . . 78 72 107Cash paid to taxing authorities for shares withheld from employees . . . . . . . . . . (120) (130) (156)Repurchase and retirement of common stock . . . . . . . . . . . . . . . . . . . . . . . . . . . . (601) (508) (1,018)
Net cash used in financing activities . . . . . . . . . . . . . . . . . . . . . . . . . . . . . (643) (729) (548)
Effect of foreign exchange on cash and cash equivalents . . . . . . . . . . . . . . . . . . . . . 22 (18) (8)
Increase in cash and cash equivalents . . . . . . . . . . . . . . . . . . . . . . . . . . . . . . . . . . . . 1,693 72 425Beginning cash and cash equivalents . . . . . . . . . . . . . . . . . . . . . . . . . . . . . . . . . . . . . 2,565 2,493 2,068
Ending cash and cash equivalents . . . . . . . . . . . . . . . . . . . . . . . . . . . . . . . . . . . . . . . $ 4,258 $ 2,565 $ 2,493
Supplemental cash flow information:Cash paid during the year for income taxes, net . . . . . . . . . . . . . . . . . . . . . . . . . . . . $ 57 $ 51 $ 35
Cash paid during the year for interest . . . . . . . . . . . . . . . . . . . . . . . . . . . . . . . . . . . . $ 42 $ 43 $ 4
See accompanying Notes to Consolidated Financial Statements.
51

ELECTRONIC ARTS INC. AND SUBSIDIARIES
NOTES TO CONSOLIDATED FINANCIAL STATEMENTS
(1) DESCRIPTION OF BUSINESS AND SUMMARY OF SIGNIFICANT ACCOUNTING POLICIES
We are a global leader in digital interactive entertainment, with a mission to inspire the world to play. Wedevelop, market, publish and distribute games, content and services that can be played on a variety of platformsincluding game consoles, PCs, mobile phones and tablets. In our games and services, we use brands that weeither wholly own (such as Battlefield, Mass Effect, Need for Speed, The Sims, Plants v. Zombies and Titanfall)or license from others (such as FIFA, Madden NFL and Star Wars). We develop and publish games and servicesacross diverse genres such as sports, first-person shooter, action, role-playing and simulation.
A summary of our significant accounting policies applied in the preparation of our Consolidated FinancialStatements follows:
Consolidation
The accompanying Consolidated Financial Statements include the accounts of Electronic Arts Inc. and itswholly-owned subsidiaries. Intercompany balances and transactions have been eliminated in consolidation.
Fiscal Year
Our fiscal year is reported on a 52- or 53-week period that ends on the Saturday nearest March 31. Our results ofoperations for the fiscal year ended March 31, 2018 and 2017 contained 52 weeks each and ended on March 31,2018 and April 1, 2017, respectively. Our results of operations for the fiscal year ended March 31, 2016contained 53 weeks and ended on April 2, 2016. For simplicity of disclosure, all fiscal periods are referred to asending on a calendar month end.
Reclassifications
Certain prior year amounts were reclassified to conform to current year presentation.
Use of Estimates
The preparation of consolidated financial statements in conformity with accounting principles generally acceptedin the United States (“U.S. GAAP”) requires us to make estimates and assumptions that affect the amountsreported in our consolidated financial statements and the accompanying notes. Such estimates include salesreturns and allowances, provisions for doubtful accounts, accrued liabilities, offering periods for deferred netrevenue, multiple-element arrangements, income taxes, losses on royalty commitments, estimates regarding therecoverability of prepaid royalties, inventories, long-lived assets, assets acquired and liabilities assumed inbusiness combinations, certain estimates related to the measurement and recognition of costs resulting from ourstock-based payment awards, unrecognized tax benefits, deferred income tax assets and associated valuationallowances, as well as estimates used in our goodwill, intangibles and short-term investment impairment tests.These estimates generally involve complex issues and require us to make judgments, involve analysis ofhistorical and future trends, can require extended periods of time to resolve, and are subject to change fromperiod to period. In all cases, actual results could differ materially from our estimates.
Cash, Cash Equivalents, and Short-Term Investments
Cash equivalents consist of highly liquid investments with insignificant interest rate risk and original orremaining maturities of three months or less at the time of purchase.
Short-term investments consist of securities with original or remaining maturities of greater than three months atthe time of purchase, and are accounted for as available-for-sale securities and are recorded at fair value. Cash,cash equivalents and short-term investments are available for use in current operations or other activities such ascapital expenditures, business combinations and share repurchases.
52
An
nu
alRep
ort
Unrealized gains and losses on our short-term investments are recorded as a component of accumulated othercomprehensive income (loss) in stockholders’ equity, net of tax, until either (1) the security is sold, (2) thesecurity has matured, or (3) we determine that the fair value of the security has declined below its adjusted costbasis and the decline is other-than-temporary. Realized gains and losses on our short-term investments arecalculated based on the specific identification method and are reclassified from accumulated othercomprehensive income (loss) to interest and other income (expense), net. Determining whether a decline in fairvalue is other-than-temporary requires management judgment based on the specific facts and circumstances ofeach security. The ultimate value realized on these securities is subject to market price volatility until they aresold.
Our short-term investments are evaluated for impairment quarterly. We consider various factors in determiningwhether we should recognize an impairment charge, including the credit quality of the issuer, the duration thatthe fair value has been less than the adjusted cost basis, severity of the impairment, reason for the decline invalue and potential recovery period, the financial condition and near-term prospects of the investees, our intent tosell and ability to hold the investment for a period of time sufficient to allow for any anticipated recovery inmarket value, and any contractual terms impacting the prepayment or settlement process. If we conclude that aninvestment is other-than-temporarily impaired, we recognize an impairment charge at that time in ourConsolidated Statements of Operations. Based on our evaluation, we did not consider any of our investments tobe other-than-temporarily impaired as of March 31, 2018 and 2017.
Inventories
Inventories consist of materials (including manufacturing royalties paid to console manufacturers), labor andfreight-in and are stated at the lower of cost (using the weighted average costing method) or net realizable value.We regularly review inventory quantities on-hand. We write down inventory based on excess or obsoleteinventories determined primarily by future anticipated demand for our products. Inventory write-downs aremeasured as the difference between the cost of the inventory and market value, based upon assumptions aboutfuture demand that are inherently difficult to assess. At the point of a loss recognition, a new, lower cost basis forthat inventory is established, and subsequent changes in facts and circumstances do not result in the restoration orincrease in that newly established basis. Inventories are included in other current assets in the ConsolidatedBalance Sheets.
Property and Equipment, Net
Property and equipment, net, are stated at cost. Depreciation is calculated using the straight-line method over thefollowing useful lives:
Buildings . . . . . . . . . . . . . . . . . . . . . . . . . . . . . . . . . . . . . 20 to 25 years
Computer equipment and software . . . . . . . . . . . . . . . . . 3 to 6 years
Equipment, furniture and fixtures, and other . . . . . . . . . . 3 to 5 years
Leasehold improvements . . . . . . . . . . . . . . . . . . . . . . . . . Lesser of the lease term or the estimated useful livesof the improvements, generally 1 to 10 years
We capitalize costs associated with internal-use software development once a project has reached the applicationdevelopment stage. Such capitalized costs include external direct costs utilized in developing or obtaining thesoftware, and payroll and payroll-related expenses for employees who are directly associated with thedevelopment of the software. Capitalization of such costs begins when the preliminary project stage is completeand ceases at the point in which the project is substantially complete and is ready for its intended purpose. Oncethe internal-use software is ready for its intended use, the assets are depreciated on a straight-line basis over eachasset’s estimated useful life, which is generally three years. The net book value of capitalized costs associatedwith internal-use software was $35 million and $41 million as of March 31, 2018 and 2017, respectively.
53

Acquisition-Related Intangibles and Other Long-Lived Assets
We record acquisition-related intangible assets, such as developed and core technology, in connection withbusiness combinations. We amortize the cost of acquisition-related intangible assets that have finite useful liveson a straight-line basis over the lesser of their estimated useful lives or the agreement terms, currently from oneto nine years. We evaluate acquisition-related intangibles and other long-lived assets for impairment wheneverevents or changes in circumstances indicate that the carrying amount of an asset may not be recoverable.Recoverability of assets is measured by a comparison of the carrying amount of an asset to future undiscountednet cash flows expected to be generated by the asset group. This includes assumptions about future prospects forthe business that the asset relates to and typically involves computations of the estimated future cash flows to begenerated by these businesses. Based on these judgments and assumptions, we determine whether we need totake an impairment charge to reduce the value of the asset stated on our Consolidated Balance Sheets to reflectits estimated fair value. When we consider such assets to be impaired, the amount of impairment we recognize ismeasured by the amount by which the carrying amount of the asset exceeds its fair value.
Goodwill Impairment
In assessing impairment on our goodwill, we first analyze qualitative factors to determine whether it is morelikely than not that the fair value of a reporting unit is less than its carrying amount as a basis for determiningwhether it is necessary to perform a goodwill impairment test. The qualitative factors we assess include long-term prospects of our performance, share price trends and market capitalization, and Company specific events. Ifwe conclude it is more likely than not that the fair value of a reporting unit exceeds its carrying amount, we donot need to perform an impairment test. If based on that assessment, we believe it is more likely than not that thefair value of the reporting unit is less than its carrying value we will measure goodwill for impairment byapplying fair value-based tests at the reporting unit level. Reporting units are determined by the components ofoperating segments that constitute a business for which (1) discrete financial information is available,(2) segment management regularly reviews the operating results of that component, and (3) whether thecomponent has dissimilar economic characteristics to other components. As of March 31, 2018, we have onlyone reportable segment, which represents our only operating segment.
Revenue Recognition, Sales Returns and Allowances, and Bad Debt Reserves
We derive revenue principally from sales of interactive software games, and related content and services ongame consoles, PCs, mobile phones and tablets. We evaluate revenue recognition based on the criteria set forth inFASB Accounting Standards Codification (“ASC”) 605, Revenue Recognition and ASC 985-605, Software:Revenue Recognition. We classify our revenue as either product revenue or service and other revenue.
Product revenue. Our product revenue includes revenue associated with the sale of software games or relatedproduct content or updates, whether delivered digitally (e.g., full-game downloads, extra-content) or via aphysical disc (e.g., packaged goods), and licensing of game software to third-parties. Product revenue alsoincludes revenue from mobile full game downloads that do not require our hosting support (e.g., premium mobilegames) in order to utilize the game or related content (i.e. can be played with or without an Internet connection),and sales of tangible products such as hardware, peripherals, or collectors’ items.
Service and other revenue. Our service revenue includes revenue recognized from time-based subscriptions,games, content or updates that requires our hosting support in order to utilize the game or related content (i.e.,can only be played with an Internet connection). This includes (1) entitlements to content that are accessedthrough hosting services (e.g., microtransactions for Internet-based, social network and free-to-download mobilegames), (2) massively multi-player online (“MMO”) games (both software game and subscription sales), (3)subscriptions for our Battlefield Premium, EA and Origin Access, and Pogo-branded online game services, and(4) allocated service revenue from sales of software games with a service of online activities (e.g., onlineplayability). Our other revenue includes advertising and non-software licensing revenue.
With respect to the allocated service revenue from sales of software games with a service of online activities(“online services”) mentioned above, our allocation of proceeds between product and service revenue for
54

An
nu
alRep
ort
presentation purposes is based on management’s best estimate of the selling price of the online services with theresidual value allocated to product revenue. Our estimate of the selling price of the online services are comprisedof several factors including, but not limited to, prior selling prices for the online services, prices chargedseparately by other third-party vendors for similar service offerings, and a cost-plus-margin approach. We reviewthe estimated selling price of the online services on a regular basis and use this methodology consistently toallocate revenue between product and service for software game sales with online services.
We evaluate and recognize revenue when all four of the following criteria are met:
• Evidence of an arrangement. Evidence of an agreement with the customer that reflects the terms andconditions to deliver the related products or services must be present.
• Fixed or determinable fee. If a portion of the arrangement fee is not fixed or determinable, werecognize revenue as the amount becomes fixed or determinable.
• Collection is deemed probable. Collection is deemed probable if we expect the customer to be able topay amounts under the arrangement as those amounts become due. If we determine that collection isnot probable as the amounts become due, we generally conclude that collection becomes probable uponcash collection.
• Delivery. For packaged goods, delivery is considered to occur when a product is shipped and the risk ofloss and rewards of ownership have transferred to the customer. For digital downloads, delivery isconsidered to occur when the software is made available to the customer for download. For servicesand other, delivery is generally considered to occur as the service is delivered, which is determinedbased on the underlying service obligation. If there is significant uncertainty of acceptance, revenue isrecognized once acceptance is reasonably assured.
Online-Enabled Games
The majority of our software games and related content have online connectivity whereby a consumer may beable to download unspecified content or updates on a when-and-if-available basis (“unspecified updates”) for usewith the original game software. In addition, we may also offer a service of online activities (e.g., onlineplayability) without a separate fee. U.S. GAAP requires us to account for the consumer’s right to receiveunspecified updates or the service of online activities for no additional fee as a “bundled” sale, ormultiple-element arrangement.
We have an established historical pattern of providing unspecified updates (e.g., player roster updates to MaddenNFL 18) to online-enabled games and related content at no additional charge to the consumer. Because we do nothave vendor-specific objective evidence of fair value (“VSOE”) for these unspecified updates, we are required bycurrent U.S. GAAP to recognize as revenue the entire sales price of these online-enabled games and relatedcontent over the period we expect to offer the unspecified updates to the consumer (“estimated offering period”).
Other Multiple-Element Arrangements
In some of our multiple-element arrangements, we sell non-software products with software and/or software-related offerings. These non-software products are generally music soundtracks, peripherals or ancillarycollectors’ items, such as figurines and comic books. Revenue for these arrangements is allocated to eachseparate unit of accounting for each deliverable using the relative selling prices of each deliverable in thearrangement based on the selling price hierarchy described below. If the arrangement contains more than onesoftware deliverable, the arrangement consideration is allocated to the software deliverables as a group and thenallocated to each software deliverable.
We determine the selling price for a non-software product deliverable based on the following selling pricehierarchy: VSOE (i.e., the price we charge when the non-software product is sold separately) if available, third-party evidence (“TPE”) of fair value (i.e., the price charged by others for similar non-software products) if VSOEis not available, or our best estimate of selling price (“BESP”) if neither VSOE nor TPE is available.
55
Determining the BESP is a subjective process that is based on multiple factors including, but not limited to,recent selling prices and related discounts, market conditions, customer classes, sales channels and other factors.Provided the other three revenue recognition criteria other than delivery have been met, we recognize revenueupon delivery to the customer as we have no further obligations.
Principal Agent Considerations
We evaluate sales of our interactive software games, extra-content, and services from our subscription offeringsvia third party storefronts, including digital channel storefronts from Microsoft, Sony, Apple, and Google, inorder to determine whether or not we are acting as the primary obligor in the sale to the end consumer, which weconsider in determining if revenue should be reported gross or net of fees retained by the storefront. Keyindicators that we evaluate in determining gross versus net treatment include but are not limited to the following:
• The party responsible for delivery/fulfillment of the product or service to the end consumer
• The party responsible for the billing, collection of fees and refunds to the end consumer
• The storefront and Terms of Sale that govern the end consumer’s purchase of the product or service
• The party that sets the pricing with the end consumer and has credit risk
Based on evaluation of the above indicators, we have determined that generally the third party is considered theprimary obligor to end consumers for the sale of our interactive software games. We therefore report revenuerelated to these arrangements net of the fees retained by the storefront.
Sales Returns and Allowances and Bad Debt Reserves
We reduce revenue for estimated future returns and price protection which may occur with our distributors andretailers (“channel partners”). Price protection represents our practice to provide our channel partners with acredit allowance to lower their wholesale price on a particular product that they have not resold to endconsumers. The amount of the price protection is generally the difference between the old wholesale price andthe new reduced wholesale price. In certain countries for our PC and console packaged goods software products,we also have a practice of allowing channel partners to return older software products in the channel in exchangefor a credit allowance. As a general practice, we do not give cash refunds.
We determine our allowance for doubtful accounts by evaluating the following: customer creditworthiness,current economic trends, historical experience, age of current accounts receivable balances, and changes infinancial condition or payment terms of our customers. Significant management judgment is required to estimateour allowance for doubtful accounts in any accounting period. The amount and timing of our bad debt expenseand cash collection could change significantly as a result of a change in any of the evaluation factors mentionedabove.
Taxes Collected from Customers and Remitted to Governmental Authorities
Taxes assessed by a government authority that are both imposed on and concurrent with specific revenuetransactions between us and our customers are presented on a net basis in our Consolidated Statements ofOperations.
Concentration of Credit Risk, Significant Customers, and Platform Partners
We extend credit to various digital resellers and channel partners. Collection of trade receivables may be affectedby changes in economic or other industry conditions and may, accordingly, impact our overall credit risk.Although we generally do not require collateral, we perform ongoing credit evaluations of our customers andmaintain reserves for potential credit losses. Invoices are aged based on contractual terms with our customers.The provision for doubtful accounts is recorded as a charge to general and administrative expense when apotential loss is identified. Losses are written off against the allowance when the receivable is determined to be
56
An
nu
alRep
ort
uncollectible. At March 31, 2018, we had three customers who accounted for approximately 39 percent,21 percent, and 10 percent of our consolidated gross receivables, respectively. At March 31, 2017, we had threecustomers who accounted for 27 percent, 22 percent, and 11 percent of our consolidated gross receivables,respectively.
A majority of our sales are made via digital resellers and channel partners. During the fiscal years 2018, 2017,and 2016, approximately 67 percent, 64 percent, and 62 percent, respectively, of our net revenue was derivedfrom our top ten customers. Though our products and services are available to consumers through a variety ofretailers, digital resellers and directly through us, the concentration of our sales in one, or a few, large customerscould lead to a short-term disruption in our sales if one or more digital resellers and channel partners significantlyreduced their purchases or ceased to carry our products and services, and could make us more vulnerable tocollection risk if one or more of these large customers became unable to pay for our products or declaredbankruptcy.
Currently, a majority of our revenue is derived through sales of products and services playable on hardwareconsoles from Sony and Microsoft. For the fiscal years ended March 31, 2018, 2017 and 2016, our net revenuefor products and services on Sony’s PlayStation 3 and 4, and Microsoft’s Xbox 360 and One consoles (combinedacross all four platforms) was 70 percent, 70 percent, and 67 percent, respectively. These platform partners havesignificant influence over the products and services that we offer on their platforms. Our agreements with Sonyand Microsoft typically give significant control to them over the approval, manufacturing and distribution of ourproducts and services that are distributed through their platform, which could, in certain circumstances, leave usunable to get our products and services approved, manufactured or distributed to customers.
Short-term investments are placed with high quality financial institutions or in short-duration, investment-gradesecurities. We limit the amount of credit exposure in any one financial institution or type of investmentinstrument.
Royalties and Licenses
Royalty-based obligations with content licensors and distribution affiliates are either paid in advance andcapitalized as prepaid royalties or are accrued as incurred and subsequently paid. These royalty-based obligationsare generally expensed to cost of revenue generally at the greater of the contractual rate or an effective royaltyrate based on the total projected net revenue for contracts with guaranteed minimums. Prepayments made tothinly capitalized independent software developers and co-publishing affiliates are generally made in connectionwith the development of a particular product, and therefore, we are generally subject to development risk prior tothe release of the product. Accordingly, payments that are due prior to completion of a product are generallyexpensed to research and development over the development period as the services are incurred. Payments dueafter completion of the product (primarily royalty-based in nature) are generally expensed as cost of revenue.
Our contracts with some licensors include minimum guaranteed royalty payments, which are initially recorded asan asset and as a liability at the contractual amount when no performance remains with the licensor. Whenperformance remains with the licensor, we record guarantee payments as an asset when actually paid and as aliability when incurred, rather than recording the asset and liability upon execution of the contract.
Each quarter, we also evaluate the expected future realization of our royalty-based assets, as well as anyunrecognized minimum commitments not yet paid to determine amounts we deem unlikely to be realized throughproduct and service sales. Any impairments or losses determined before the launch of a product are generallycharged to research and development expense. Impairments or losses determined post-launch are charged to costof revenue. We evaluate long-lived royalty-based assets for impairment using undiscounted cash flows whenimpairment indicators exist. If impairment exists, then the assets are written down to fair value. Unrecognizedminimum royalty-based commitments are accounted for as executory contracts, and therefore, any losses onthese commitments are recognized when the underlying intellectual property is abandoned (i.e., cease use) or thecontractual rights to use the intellectual property are terminated.
57
Advertising Costs
We generally expense advertising costs as incurred, except for production costs associated with mediacampaigns, which are recognized as prepaid assets (to the extent paid in advance) and expensed at the first run ofthe advertisement. Cooperative advertising costs are recognized when incurred and are classified as marketingand sales expense if there is a separate identifiable benefit for which we can reasonably estimate the fair value ofthe benefit identified. Otherwise, they are classified as a reduction of revenue and are generally accrued whenrevenue is recognized. We then reimburse the channel partner when qualifying claims are submitted.
We are also reimbursed by our vendors for certain advertising costs incurred by us that benefit our vendors. Suchamounts are recognized as a reduction of marketing and sales expense if the advertising (1) is specific to thevendor, (2) represents an identifiable benefit to us, and (3) represents an incremental cost to us. Otherwise,vendor reimbursements are recognized as a reduction of the cost incurred with the same vendor. Vendorreimbursements of advertising costs of $45 million, $53 million, and $51 million reduced marketing and salesexpense for the fiscal years ended March 31, 2018, 2017 and 2016, respectively. For the fiscal years endedMarch 31, 2018, 2017 and 2016, advertising expense, net of vendor reimbursements, totaled approximately$261 million, $281 million, and $240 million, respectively.
Software Development Costs
Research and development costs, which consist primarily of software development costs, are expensed asincurred. We are required to capitalize software development costs incurred for computer software to be sold,leased or otherwise marketed after technological feasibility of the software is established or for developmentcosts that have alternative future uses. Under our current practice of developing new games, the technologicalfeasibility of the underlying software is not established until substantially all product development and testing iscomplete, which generally includes the development of a working model. Software development costs that havebeen capitalized to date have been insignificant.
Foreign Currency Translation
Generally, the functional currency for our foreign operating subsidiaries is its local currency. Assets andliabilities of foreign operations are translated into U.S. dollars using month-end exchange rates, and revenue andexpenses are translated into U.S. dollars using average exchange rates. The effects of foreign currency translationadjustments are included as a component of accumulated other comprehensive income (loss) in stockholders’equity.
Foreign currency transaction gains and losses are a result of the effect of exchange rate changes on transactionsdenominated in currencies other than the functional currency. Net foreign currency transaction gains (losses) of$18 million, $(40) million, and $(14) million for the fiscal years ended March 31, 2018, 2017 and 2016,respectively, are included in interest and other income (expense), net, in our Consolidated Statements ofOperations. These net foreign currency transaction gains (losses) are partially offset by net gains (losses) on ourforeign currency forward contracts of $(16) million, $46 million, and $15 million for the fiscal years endedMarch 31, 2018, 2017 and 2016, respectively. See Note 4 for additional information on our foreign currencyforward contracts.
Income Taxes
We recognize deferred tax assets and liabilities for both the expected impact of differences between the financialstatement amount and the tax basis of assets and liabilities and for the expected future tax benefit to be derivedfrom tax losses and tax credit carryforwards. We record a valuation allowance against deferred tax assets when itis considered more likely than not that all or a portion of our deferred tax assets will not be realized. In makingthis determination, we are required to give significant weight to evidence that can be objectively verified. It isgenerally difficult to conclude that a valuation allowance is not needed when there is significant negativeevidence, such as cumulative losses in recent years. Forecasts of future taxable income are considered to be lessobjective than past results. Therefore, cumulative losses weigh heavily in the overall assessment.
58
An
nu
alRep
ort
In addition to considering forecasts of future taxable income, we are also required to evaluate and quantify otherpossible sources of taxable income in order to assess the realization of our deferred tax assets, namely thereversal of existing deferred tax liabilities, the carry back of losses and credits as allowed under current tax law,and the implementation of tax planning strategies. Evaluating and quantifying these amounts involves significantjudgments. Each source of income must be evaluated based on all positive and negative evidence; this evaluationinvolves assumptions about future activity. Certain taxable temporary differences that are not expected to reverseduring the carry forward periods permitted by tax law cannot be considered as a source of future taxable incomethat may be available to realize the benefit of deferred tax assets.
Recently Adopted Accounting Standards
In March 2016, the FASB issued ASU 2016-09, Compensation — Stock Compensation (Topic 718):Improvements to Employee Share-Based Payment Accounting, related to simplifications of employee share-basedpayment accounting. This pronouncement eliminated the APIC pool concept and requires that excess tax benefitsand tax deficiencies be recorded in the income statement when awards are settled. As a result, reflected excesstax benefits of $43 million for the fiscal year ended March 31, 2018 in the Consolidated Statement of Income asa component of the provision for income taxes, whereas for the fiscal year ended March 31, 2017, they wererecognized in additional paid-in-capital in the Consolidated Balance Sheets. The pronouncement also addressedsimplifications related to statement of cash flows classification, accounting for forfeitures, and minimumstatutory tax withholding requirements. We adopted ASU 2016-09 at the beginning of fiscal year 2018. Uponadoption of ASU 2016-09, excess tax benefits and tax deficiencies from employee share-based award activity arereflected in the Consolidated Statements of Income as a component of the provision for income taxes, whereasthey previously were recognized in additional paid-in-capital. We now account for forfeitures as they occur,rather than estimate expected forfeitures. The adoption resulted in a cumulative-effect adjustment of $8 million,net of tax, decrease to retained earnings as a result of the change in recognition for forfeitures. The adoption ofASU 2016-09 also resulted in two changes to our cash flow presentation, which we applied retrospectively forcomparability. Excess tax benefits are now presented as operating activities rather than financing activities, andcash payments to tax authorities in connection with shares withheld to meet statutory tax withholdingrequirements are now presented as a financing activity. The net increase to our reported net cash provided byoperating activities and corresponding increase to cash used in financing activities resulting from the adoption ofASU 2016-09 for the fiscal years ended March 31, 2017 and 2016, and for comparability, the fiscal year endedMarch 31, 2018, are as follows:
Year Ended March 31,
(In millions): 2018 2017 2016
Excess tax benefits from stock-based compensation . . . . . . . . . . . . . . . . . . . . . . . . . . . . . . . $ 43 $ 65 $ 86Cash paid to taxing authorities for shares withheld from employees . . . . . . . . . . . . . . . . . . . 120 130 156
Increase to net cash provided by operating activities and net cash used in financingactivities . . . . . . . . . . . . . . . . . . . . . . . . . . . . . . . . . . . . . . . . . . . . . . . . . . . . . . . . . . . . . $163 $195 $242
In May 2017, the FASB issued ASU 2017-09, Compensation — Stock Compensation (Topic 718): Scope ofModification Accounting, which clarified when to account for a change to the terms or conditions of ashare-based payment award as a modification. Modification accounting is required only if the fair value, thevesting conditions, or the classification of the award (as equity or liability) changes as a result of the change interms or condition. We early adopted ASU 2017-09 in the first quarter of fiscal year 2018. The adoption did nothave an impact on our Consolidated Financial Statements.
In January 2017, the FASB issued ASU 2017-04, Intangibles — Goodwill and Other (Topic 350). The standardsimplifies the goodwill impairment test. This update removes Step 2 of the goodwill impairment test, whichrequires a hypothetical purchase price allocation. A goodwill impairment will now be the amount by which areporting unit’s carrying value exceeds its fair value, however, the loss recognized should not exceed the totalamount of goodwill allocated to that reporting unit. We early adopted ASU 2017-04 during the fourth quarter offiscal year 2018. The adoption did not have an impact on our Consolidated Financial Statements.
59

Impact of Recently Issued Accounting Standards
In May 2014, the FASB issued ASU 2014-09, Revenue from Contracts with Customers (Topic 606), (the “NewRevenue Standard”), which will replace existing guidance under U.S. GAAP, including industry-specificrequirements, and will provide companies with a single principles-based revenue recognition model forrecognizing revenue from contracts with customers. The core principle of the New Revenue Standard is that acompany should recognize the amount of revenue to which it expects to be entitled for the transfer of promisedgoods or services to customers. In addition, the FASB has issued several amendments to the New RevenueStandard, including principal versus agent considerations, clarifications on identification of performanceobligations, and accounting for licenses of intellectual property.
The New Revenue Standard is effective for us beginning in the first quarter of fiscal year 2019. We are adoptingthe New Revenue Standard using the modified retrospective method, which recognizes the cumulative effect ofinitially applying the New Revenue Standard as an adjustment to retained earnings at the adoption date. We haveconcluded on several key accounting assessments related to the New Revenue Standard.
The New Revenue Standard will have a significant impact on our Consolidated Financial Statements and relateddisclosures as it relates to the accounting for substantially all of our transactions with multiple elements or“bundled” arrangements. For example, for sales of online-enabled games, as currently reported we do not havevendor-specific objective evidence of fair value (“VSOE”) for unspecified future updates, and thus, revenue fromthe entire sales price is recognized ratably over the estimated offering period. However, under the New RevenueStandard, the VSOE requirement for undelivered elements is eliminated, allowing us to essentially “break-apart”our online-enabled games and account for the various promised goods or services identified as separateperformance obligations.
For example, for the sale of an online-enabled game, we usually have multiple distinct performance obligationssuch as software, future update rights, and an online service. The software performance obligation represents theinitial game delivered digitally or via physical disc. The future update rights performance obligation may includesoftware patches or updates, maintenance, and/or additional free content to be delivered in the future. And lastly,the online service performance obligation consists of providing the customer with a service of online activities(e.g., online playability). Under current software revenue recognition rules, we recognize as revenue the entiresales price over the estimated offering period. However, under the New Revenue Standard, we currently estimatethat a significant portion of the sales price will be allocated to the software performance obligation andrecognized upon delivery, and the remaining portion will be allocated to the future update rights and the onlineservice performance obligations and recognized ratably over the estimated offering period. As a result, we expecta significant portion of our annual revenue, and thereby annual profit, will shift from the first and fourth fiscalquarters to the second and third fiscal quarters which is historically when a significant portion of our annualbookings and software deliveries have been made.
The adoption of the New Revenue Standard will also change how we present mobile revenue. Currently, mobileplatform fees retained by third-party application storefronts such as the Apple App Store and Google Play, arereported on a net basis within net revenue. Upon adoption, we will report mobile platform fees within cost ofrevenue. As a result, both mobile revenue and cost of revenue will increase by the amount of the mobile platformfees. This change will also decrease our gross margin percentage but will not have a material impact on ourannual total gross profit or profitability.
In addition, both portions of sales price allocated to future update rights and online services will be classified asservice revenue under the New Revenue Standard (currently, future update rights are generally presented asproduct revenue). Therefore, upon adoption, an increased portion of our sales from online-enabled games will bepresented as service revenue than is currently reported today. Also, upon adoption of the New Revenue Standard,a substantial majority of our sales returns and price protection reserves will be classified as liabilities (currently,these allowances are classified as contra-assets within receivables on our Consolidated Balance Sheets).Additionally, the adoption of the New Revenue Standard requires us to modify our systems, processes, andinternal controls, including the internal controls over financial reporting, to reflect the changes to the way inwhich we recognize revenue.
60
An
nu
alRep
ort
We expect the net cumulative effect adjustment upon adoption to result in an increase to retained earnings in therange of $550 million to $650 million, net of tax. The finalized impact to our consolidated financial statementswill be included in our Form 10-Q for the first quarter of fiscal year 2019. We will continue to monitor additionalchanges, modifications, clarifications or interpretations of the New Revenue Standard, which may impact currentexpectations. It is possible that during the first quarter of fiscal year 2019, we could identify items that result inadditional material changes to our Consolidated Financial Statements.
In January 2016, the FASB issued ASU 2016-01, Financial Instruments (Topic 825-10), which requires that mostequity investments be measured at fair value, with subsequent changes in fair value recognized in net income.The ASU also impacts financial liabilities under the fair value option and the presentation and disclosurerequirements for financial instruments. The requirements will be effective for us beginning in the first quarter offiscal year 2019. We do not expect the adoption to have a material impact on our Consolidated FinancialStatements.
In March 2016, the FASB issued ASU 2016-04, Liabilities — Extinguishments of Liabilities (Subtopic 405-20):Recognition of Breakage for Certain Prepaid Stored-Value Products. The amendments in the ASU are designedto provide guidance and eliminate diversity in the accounting for derecognition of prepaid stored-value productliabilities. Typically, a prepaid stored-value product liability is to be derecognized when it is probable that asignificant reversal of the recognized breakage amount will not subsequently occur. This is when the likelihoodof the product holder exercising its remaining rights becomes remote. This estimate shall be updated at the end ofeach period. The amendments in this ASU are effective for us beginning in the first quarter of fiscal year 2019.Early adoption is permitted. We do not expect the adoption to have a material impact on our ConsolidatedFinancial Statements.
In August 2016, the FASB issued ASU 2016-15, Statement of Cash Flows (Topic 230): Classification of CertainCash Receipts and Cash Payments. This update is intended to reduce the existing diversity in practice in howcertain transactions are classified in the statement of cash flows. This update is effective for us beginning in thefirst quarter of fiscal year 2019. Early adoption is permitted, provided that all of the amendments are adopted inthe same period. We do not expect the adoption to have a material impact on our Consolidated FinancialStatements.
In November 2016, the FASB issued ASU 2016-18, Statement of Cash Flows (Topic 230): Restricted Cash (aconsensus of the FASB Emerging Issues Task Force), which requires amounts generally described as restrictedcash and restricted cash equivalents be included with cash and cash equivalents when reconciling thebeginning-of-period and end-of-period total amounts shown in the statement of cash flows. This update iseffective for us beginning in the first quarter of fiscal year 2019. Early adoption is permitted. We do not expectthe adoption to have a material impact on our Consolidated Financial Statements.
In February 2016, the FASB issued ASU 2016-02, Leases (Topic 842). The FASB issued this standard toincrease transparency and comparability among organizations by recognizing lease assets and lease liabilities onthe balance sheet and disclosing key information about leasing arrangements. We anticipate adopting thisstandard beginning in the first quarter of fiscal year 2020, when the updated guidance is effective for us. We arecurrently evaluating the impact of this new standard on our Consolidated Financial Statements and relateddisclosures.
In August 2017, the FASB issued ASU 2017-12, Derivatives and Hedging (Topic 815): Targeted Improvementsto Accounting for Hedging Activities. This update is intended to make more financial and nonfinancial hedgingstrategies eligible for hedge accounting. It also amends the presentation and disclosure requirements and changeshow companies assess effectiveness. This update is effective for us beginning in the first quarter of fiscal year2020. Early adoption is permitted. We are currently evaluating the timing of adoption and impact of this newstandard on our Consolidated Financial Statements and related disclosures.
In February 2018, the FASB issued ASU 2018-02, Income Statement-Reporting Comprehensive Income (Topic220): Reclassification of Certain Tax Effects from Accumulated Other Comprehensive Income. This update gives
61

the option to reclassify to retained earnings tax effects related to items in accumulated other comprehensiveincome that the FASB refers to as having been stranded in accumulated other comprehensive income as a resultof the U.S. Tax Act. This update is effective for fiscal years beginning after December 15, 2018, and interimperiods within those fiscal years. Early adoption is permitted. We are currently evaluating the impact of this newstandard on our Consolidated Financial Statements.
In June 2016, the FASB issued ASU 2016-13, Financial Instruments — Credit Losses (Topic 326). The standardchanges the methodology for measuring credit losses on financial instruments and the timing of when such lossesare recorded. ASU 2016-13 is effective for us beginning in the first quarter of fiscal year 2021. Early adoption ispermitted beginning in the first quarter of fiscal year 2020. We are currently evaluating the timing of adoptionand impact of this new standard on our Consolidated Financial Statements and related disclosures.
(2) FAIR VALUE MEASUREMENTS
There are various valuation techniques used to estimate fair value, the primary one being the price that would bereceived from selling an asset or paid to transfer a liability in an orderly transaction between market participantsat the measurement date. When determining fair value, we consider the principal or most advantageous market inwhich we would transact and consider assumptions that market participants would use when pricing the asset orliability. We measure certain financial and nonfinancial assets and liabilities at fair value on a recurring andnonrecurring basis.
Fair Value Hierarchy
The three levels of inputs that may be used to measure fair value are as follows:
• Level 1. Quoted prices in active markets for identical assets or liabilities.
• Level 2. Observable inputs other than quoted prices included within Level 1, such as quoted prices forsimilar assets or liabilities, quoted prices in markets with insufficient volume or infrequent transactions(less active markets), or model-derived valuations in which all significant inputs are observable or can bederived principally from or corroborated with observable market data for substantially the full term of theassets or liabilities.
• Level 3. Unobservable inputs to the valuation methodology that are significant to the measurement of thefair value of assets or liabilities.
62

An
nu
alRep
ort
Assets and Liabilities Measured at Fair Value on a Recurring Basis
As of March 31, 2018 and 2017, our assets and liabilities that were measured and recorded at fair value on arecurring basis were as follows (in millions):
Fair Value Measurements at ReportingDate Using
As ofMarch 31,
2018
QuotedPrices inActive
Markets forIdenticalFinancial
Instruments
SignificantOther
ObservableInputs
SignificantUnobservable
Inputs
(Level 1) (Level 2) (Level 3) Balance Sheet Classification
AssetsBank and time deposits . . . . . . . . . . . . . . . . $ 286 $ 286 $ — $ — Cash equivalentsMoney market funds . . . . . . . . . . . . . . . . . . 1,876 1,876 — — Cash equivalentsAvailable-for-sale securities:
Corporate bonds . . . . . . . . . . . . . . . . . . . . 624 — 624 — Short-term investmentsU.S. Treasury securities . . . . . . . . . . . . . . 210 210 — — Short-term investmentsU.S. agency securities . . . . . . . . . . . . . . . 78 — 78 — Short-term investmentsCommercial paper . . . . . . . . . . . . . . . . . . 150 — 150 — Short-term investments and
cash equivalentsForeign government securities . . . . . . . . . 52 — 52 — Short-term investmentsCertificates of Deposit . . . . . . . . . . . . . . . 2 — 2 — Cash equivalents
Foreign currency derivatives . . . . . . . . . . . . 4 — 4 — Other current assets andother assets
Deferred compensation plan assets(a) . . . . . . 10 10 — — Other assets
Total assets at fair value . . . . . . . . . . . . . . $3,292 $2,382 $910 $ —
LiabilitiesContingent consideration(b) . . . . . . . . . . . . . $ 122 $ — $ — $122 Other LiabilitiesForeign currency derivatives . . . . . . . . . . . . 56 — 56 — Accrued and other current
liabilities and otherliabilities
Deferred compensation plan liabilities(a) . . . 11 11 — — Other liabilities
Total liabilities at fair value . . . . . . . . . . . $ 189 $ 11 $ 56 $122
Fair Value Measurements Using SignificantUnobservable Inputs (Level 3)
ContingentConsideration
Balance as of March 31, 2017 . . . . . . . . . . . . . . . . . . . . . . . . . . . . . . . . . . . $ —Additions . . . . . . . . . . . . . . . . . . . . . . . . . . . . . . . . . . . . . . . . . . . . . . . . . 122Change in fair value . . . . . . . . . . . . . . . . . . . . . . . . . . . . . . . . . . . . . . . . . —
Balance as of March 31, 2018 . . . . . . . . . . . . . . . . . . . . . . . . . . . . . . . . . . . $122
63

Fair Value Measurements at ReportingDate Using
As ofMarch 31,
2017
QuotedPrices inActive
Markets forIdenticalFinancial
Instruments
SignificantOther
ObservableInputs
SignificantUnobservable
Inputs
(Level 1) (Level 2) (Level 3) Balance Sheet Classification
AssetsBank and time deposits . . . . . . . . . . . . . . . . $ 233 $ 233 $ — $— Cash equivalentsMoney market funds . . . . . . . . . . . . . . . . . . 405 405 — — Cash equivalentsAvailable-for-sale securities:
Corporate bonds . . . . . . . . . . . . . . . . . . . . 963 — 963 — Short-term investments andcash equivalents
U.S. Treasury securities . . . . . . . . . . . . . . 460 460 — — Short-term investments andcash equivalents
U.S. agency securities . . . . . . . . . . . . . . . 172 — 172 — Short-term investments andcash equivalents
Commercial paper . . . . . . . . . . . . . . . . . . 270 — 270 — Short-term investments andcash equivalents
Foreign government securities . . . . . . . . . 113 — 113 — Short-term investmentsAsset-backed securities . . . . . . . . . . . . . . 135 — 135 — Short-term investments
Foreign currency derivatives . . . . . . . . . . . . 19 — 19 — Other current assets andother assets
Deferred compensation plan assets(a) . . . . . . 8 8 — — Other assets
Total assets at fair value . . . . . . . . . . . . . $2,778 $1,106 $1,672 $—
LiabilitiesForeign currency derivatives . . . . . . . . . . . . 8 — 8 — Accrued and other current
liabilities and otherliabilities
Deferred compensation plan liabilities(a) . . . 9 9 — — Other liabilities
Total liabilities at fair value . . . . . . . . . . . $ 17 $ 9 $ 8 $—
(a) The Deferred Compensation Plan assets consist of various mutual funds. See Note 14 for additionalinformation regarding our Deferred Compensation Plan.
(b) The contingent consideration represents the estimated fair value of the additional variable cashconsideration payable in connection with our acquisition of Respawn Entertainment, LLC (“Respawn”) thatis contingent upon the achievement of certain performance milestones. We estimated fair value using aprobability-weighted income approach combined with a real options methodology and applied a discountrate that appropriately captures the risk associated with the obligation. The discount rates used ranged from3.25 percent to 3.56 percent. See Note 6 for additional information regarding the Respawn acquisition.
(3) FINANCIAL INSTRUMENTS
Cash and Cash Equivalents
As of March 31, 2018 and 2017, our cash and cash equivalents were $4,258 million and $2,565 million,respectively. Cash equivalents were valued using quoted market prices or other readily available marketinformation.
64

An
nu
alRep
ort
Short-Term Investments
Short-term investments consisted of the following as of March 31, 2018 and 2017 (in millions):
As of March 31, 2018 As of March 31, 2017
Cost orAmortized
Cost
Gross Unrealized FairValue
Cost orAmortized
Cost
Gross Unrealized FairValueGains Losses Gains Losses
Corporate bonds . . . . . . . . . . . . . . . . $ 629 $— $ (5) $ 624 $ 944 $— $ (1) $ 943
U.S. Treasury securities . . . . . . . . . . 212 — (2) 210 414 — (1) 413
U.S. agency securities . . . . . . . . . . . . 79 — (1) 78 152 — (1) 151
Commercial paper . . . . . . . . . . . . . . . 109 — — 109 212 — — 212
Foreign government securities . . . . . 53 — (1) 52 113 — — 113
Asset-backed securities . . . . . . . . . . . — — — — 135 — — 135
Short-term investments . . . . . . . . . $1,082 $— $ (9) $1,073 $1,970 $— $ (3) $1,967
The following table summarizes the amortized cost and fair value of our short-term investments, classified bystated maturity as of March 31, 2018 and 2017 (in millions):
As of March 31, 2018 As of March 31, 2017
AmortizedCost
FairValue
AmortizedCost
FairValue
Short-term investments
Due within 1 year . . . . . . . . . . . . . . . . . . . . . . . . . . . . . . . . . . . . . . . . . $ 521 $ 520 $1,237 $1,236
Due 1 year through 5 years . . . . . . . . . . . . . . . . . . . . . . . . . . . . . . . . . 561 553 721 719
Due after 5 years . . . . . . . . . . . . . . . . . . . . . . . . . . . . . . . . . . . . . . . . . — — 12 12
Short-term investments . . . . . . . . . . . . . . . . . . . . . . . . . . . . . . . . . . $1,082 $1,073 $1,970 $1,967
(4) DERIVATIVE FINANCIAL INSTRUMENTS
The assets or liabilities associated with our derivative instruments and hedging activities are recorded at fairvalue in other current assets/other assets, or accrued and other current liabilities/other liabilities, respectively, onour Consolidated Balance Sheets. As discussed below, the accounting for gains and losses resulting from changesin fair value depends on the use of the derivative instrument and whether it is designated and qualifies for hedgeaccounting.
We transact business in various foreign currencies and have significant international sales and expensesdenominated in foreign currencies, subjecting us to foreign currency risk. We purchase foreign currency forwardcontracts, generally with maturities of 18 months or less, to reduce the volatility of cash flows primarily relatedto forecasted revenue and expenses denominated in certain foreign currencies. Our cash flow risks are primarilyrelated to fluctuations in the Euro, British pound sterling, Canadian dollar, Swedish krona, Australian dollar,Chinese yuan and South Korean won. In addition, we utilize foreign currency forward contracts to mitigateforeign currency exchange risk associated with foreign-currency-denominated monetary assets and liabilities,primarily intercompany receivables and payables. The foreign currency forward contracts not designated ashedging instruments generally have a contractual term of approximately three months or less and are transactednear month-end. We do not use foreign currency forward contracts for speculative trading purposes.
Cash Flow Hedging Activities
Certain of our forward contracts are designated and qualify as cash flow hedges. The effectiveness of the cashflow hedge contracts, including time value, is assessed monthly using regression analysis, as well as other timingand probability criteria. To qualify for hedge accounting treatment, all hedging relationships are formally
65

documented at the inception of the hedges and must be highly effective in offsetting changes to future cash flowson hedged transactions. The derivative assets or liabilities associated with our hedging activities are recorded atfair value in other current assets/other assets, or accrued and other current liabilities/other liabilities, respectively,on our Consolidated Balance Sheets. The effective portion of gains or losses resulting from changes in the fairvalue of these hedges is initially reported, net of tax, as a component of accumulated other comprehensiveincome (loss) in stockholders’ equity. The gross amount of the effective portion of gains or losses resulting fromchanges in the fair value of these hedges is subsequently reclassified into net revenue or research anddevelopment expenses, as appropriate, in the period when the forecasted transaction is recognized in ourConsolidated Statements of Operations. In the event that the gains or losses in accumulated other comprehensiveincome (loss) are deemed to be ineffective, the ineffective portion of gains or losses resulting from changes infair value, if any, is reclassified to interest and other income (expense), net, in our Consolidated Statements ofOperations. In the event that the underlying forecasted transactions do not occur, or it becomes remote that theywill occur, within the defined hedge period, the gains or losses on the related cash flow hedges are reclassifiedfrom accumulated other comprehensive income (loss) to interest and other income (expense), net, in ourConsolidated Statements of Operations.
Total gross notional amounts and fair values for currency derivatives with cash flow hedge accountingdesignation are as follows (in millions):
As of March 31, 2018 As of March 31, 2017
NotionalAmount
Fair Value NotionalAmount
Fair Value
Asset Liability Asset Liability
Forward contracts to purchase . . . . . . . . . . . . . . . . . . . . . . . . $ 329 $2 $ 4 $185 $— $5Forward contracts to sell . . . . . . . . . . . . . . . . . . . . . . . . . . . . $1,575 $1 $48 $840 $19 $3
The net impact of the effective portion of gains and losses from our cash flow hedging activities in ourConsolidated Statements of Operations was a loss of $5 million for the fiscal year ended March 31, 2018 and again of $36 million and $12 million for the fiscal years ended March 31, 2017 and 2016, respectively.
During fiscal years ended March 31, 2018, 2017 and 2016, we reclassified an immaterial amount of theineffective portion of gains or losses resulting from changes in fair value into interest and other income(expense), net.
The amount excluded from the assessment of hedge effectiveness was a gain of $10 million during fiscal yearended March 31, 2018. The amount excluded from the assessment of hedge effectiveness during fiscal yearsended fiscal years ended March 31, 2017 and 2016 and recognized in interest and other income (expense), net,was immaterial.
Balance Sheet Hedging Activities
Our foreign currency forward contracts that are not designated as hedging instruments are accounted for asderivatives whereby the fair value of the contracts are reported as other current assets or accrued and othercurrent liabilities on our Consolidated Balance Sheets, and gains and losses resulting from changes in the fairvalue are reported in interest and other income (expense), net, in our Consolidated Statements of Operations. Thegains and losses on these foreign currency forward contracts generally offset the gains and losses in theunderlying foreign-currency-denominated monetary assets and liabilities, which are also reported in interest andother income (expense), net, in our Consolidated Statements of Operations.
Total gross notional amounts and fair values for currency derivatives that are not designated as hedginginstruments are accounted for as follows (in millions):
As of March 31, 2018 As of March 31, 2017
NotionalAmount
Fair Value NotionalAmount
Fair Value
Asset Liability Asset Liability
Forward contracts to purchase . . . . . . . . . . . . . . . . . . . . . . . . $210 $ 1 $1 $ 87 $— $—Forward contracts to sell . . . . . . . . . . . . . . . . . . . . . . . . . . . . $257 $— $3 $166 $— $—
66
An
nu
alRep
ort
The effect of foreign currency forward contracts not designated as hedging instruments in our ConsolidatedStatements of Operations for the fiscal years ended March 31, 2018, 2017 and 2016, was as follows (in millions):
Statement of OperationsClassification
Amount of Gain (Loss) Recognized in theStatement of Operations
Year Ended March 31,
2018 2017 2016
Foreign currency forward contracts notdesignated as hedging instruments . . . . . . . .
Interest and other income(expense), net
$(26) $43 $16
(5) ACCUMULATED OTHER COMPREHENSIVE INCOME (LOSS)
The changes in accumulated other comprehensive income (loss) by component, net of tax, for the fiscal yearsended March 31, 2018, 2017 and 2016 are as follows (in millions):
Unrealized NetGains (Losses) onAvailable-for-Sale
Securities
Unrealized NetGains (Losses) on
DerivativeInstruments
Foreign CurrencyTranslationAdjustments Total
Balances as of March 31, 2015 . . . . . . . . . . . . . . . . . $ (3) $ 21 $(16) $ 2
Other comprehensive income (loss) beforereclassifications . . . . . . . . . . . . . . . . . . . . . . . . 4 5 (15) (6)
Amounts reclassified from accumulated othercomprehensive income (loss) . . . . . . . . . . . . . . — (12) — (12)
Total other comprehensive income (loss), net oftax . . . . . . . . . . . . . . . . . . . . . . . . . . . . . . . . . . . . . 4 (7) (15) (18)
Balances as of March 31, 2016 . . . . . . . . . . . . . . . . . $ 1 $ 14 $(31) $ (16)
Other comprehensive income (loss) beforereclassifications . . . . . . . . . . . . . . . . . . . . . . . . (3) 54 (17) 34
Amounts reclassified from accumulated othercomprehensive income (loss) . . . . . . . . . . . . . . (1) (36) — (37)
Total other comprehensive income (loss), net oftax . . . . . . . . . . . . . . . . . . . . . . . . . . . . . . . . . . . . . (4) 18 (17) (3)
Balances as of March 31, 2017 . . . . . . . . . . . . . . . . . $ (3) $ 32 $(48) $ (19)
Other comprehensive income (loss) beforereclassifications . . . . . . . . . . . . . . . . . . . . . . . . (9) (126) 28 (107)
Amounts reclassified from accumulated othercomprehensive income (loss) . . . . . . . . . . . . . . 4 5 (10) (1)
Total other comprehensive income (loss), net oftax . . . . . . . . . . . . . . . . . . . . . . . . . . . . . . . . . . . . . (5) (121) 18 (108)
Balances as of March 31, 2018 . . . . . . . . . . . . . . . . . $ (8) $ (89) $(30) $(127)
67
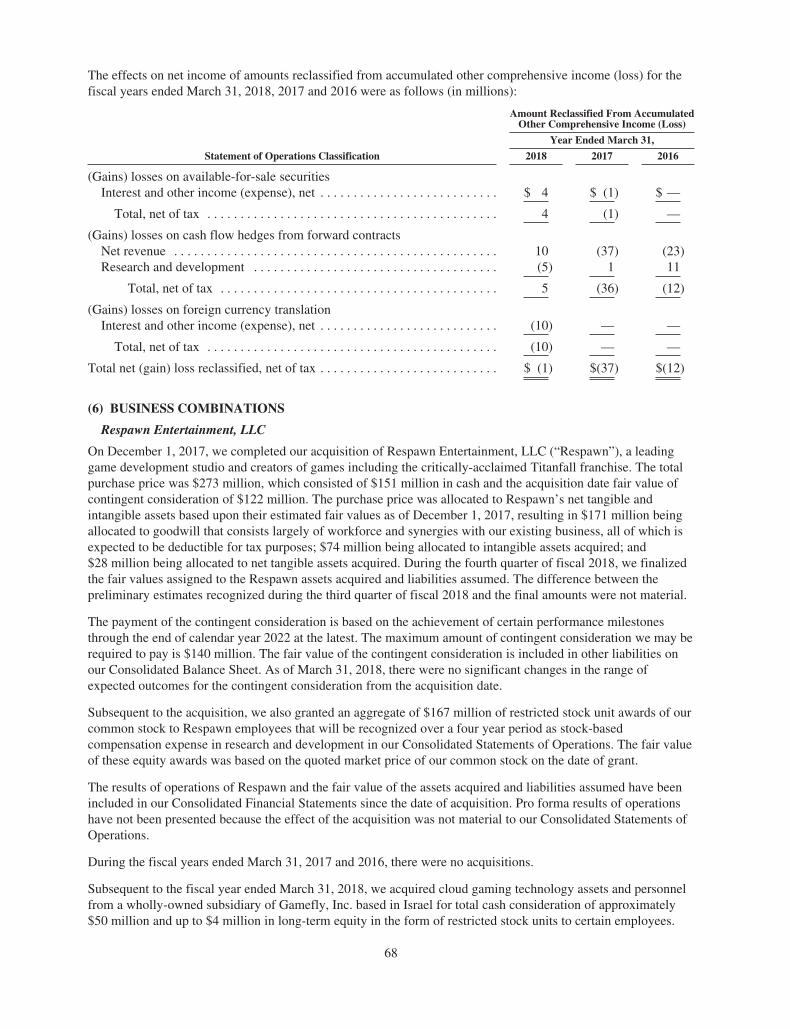
The effects on net income of amounts reclassified from accumulated other comprehensive income (loss) for thefiscal years ended March 31, 2018, 2017 and 2016 were as follows (in millions):
Statement of Operations Classification
Amount Reclassified From AccumulatedOther Comprehensive Income (Loss)
Year Ended March 31,
2018 2017 2016
(Gains) losses on available-for-sale securitiesInterest and other income (expense), net . . . . . . . . . . . . . . . . . . . . . . . . . . . $ 4 $ (1) $ —
Total, net of tax . . . . . . . . . . . . . . . . . . . . . . . . . . . . . . . . . . . . . . . . . . . . 4 (1) —
(Gains) losses on cash flow hedges from forward contractsNet revenue . . . . . . . . . . . . . . . . . . . . . . . . . . . . . . . . . . . . . . . . . . . . . . . . . 10 (37) (23)Research and development . . . . . . . . . . . . . . . . . . . . . . . . . . . . . . . . . . . . . (5) 1 11
Total, net of tax . . . . . . . . . . . . . . . . . . . . . . . . . . . . . . . . . . . . . . . . . . 5 (36) (12)
(Gains) losses on foreign currency translationInterest and other income (expense), net . . . . . . . . . . . . . . . . . . . . . . . . . . . (10) — —
Total, net of tax . . . . . . . . . . . . . . . . . . . . . . . . . . . . . . . . . . . . . . . . . . . . (10) — —
Total net (gain) loss reclassified, net of tax . . . . . . . . . . . . . . . . . . . . . . . . . . . $ (1) $(37) $(12)
(6) BUSINESS COMBINATIONS
Respawn Entertainment, LLC
On December 1, 2017, we completed our acquisition of Respawn Entertainment, LLC (“Respawn”), a leadinggame development studio and creators of games including the critically-acclaimed Titanfall franchise. The totalpurchase price was $273 million, which consisted of $151 million in cash and the acquisition date fair value ofcontingent consideration of $122 million. The purchase price was allocated to Respawn’s net tangible andintangible assets based upon their estimated fair values as of December 1, 2017, resulting in $171 million beingallocated to goodwill that consists largely of workforce and synergies with our existing business, all of which isexpected to be deductible for tax purposes; $74 million being allocated to intangible assets acquired; and$28 million being allocated to net tangible assets acquired. During the fourth quarter of fiscal 2018, we finalizedthe fair values assigned to the Respawn assets acquired and liabilities assumed. The difference between thepreliminary estimates recognized during the third quarter of fiscal 2018 and the final amounts were not material.
The payment of the contingent consideration is based on the achievement of certain performance milestonesthrough the end of calendar year 2022 at the latest. The maximum amount of contingent consideration we may berequired to pay is $140 million. The fair value of the contingent consideration is included in other liabilities onour Consolidated Balance Sheet. As of March 31, 2018, there were no significant changes in the range ofexpected outcomes for the contingent consideration from the acquisition date.
Subsequent to the acquisition, we also granted an aggregate of $167 million of restricted stock unit awards of ourcommon stock to Respawn employees that will be recognized over a four year period as stock-basedcompensation expense in research and development in our Consolidated Statements of Operations. The fair valueof these equity awards was based on the quoted market price of our common stock on the date of grant.
The results of operations of Respawn and the fair value of the assets acquired and liabilities assumed have beenincluded in our Consolidated Financial Statements since the date of acquisition. Pro forma results of operationshave not been presented because the effect of the acquisition was not material to our Consolidated Statements ofOperations.
During the fiscal years ended March 31, 2017 and 2016, there were no acquisitions.
Subsequent to the fiscal year ended March 31, 2018, we acquired cloud gaming technology assets and personnelfrom a wholly-owned subsidiary of Gamefly, Inc. based in Israel for total cash consideration of approximately$50 million and up to $4 million in long-term equity in the form of restricted stock units to certain employees.
68

An
nu
alRep
ort
(7) GOODWILL AND ACQUISITION-RELATED INTANGIBLES, NET
The changes in the carrying amount of goodwill for the fiscal year ended March 31, 2018 are as follows (inmillions):
As ofMarch 31, 2017 Activity
Effects of ForeignCurrency
TranslationAs of
March 31, 2018
Goodwill . . . . . . . . . . . . . . . . . . . . . . . . . . . . . . . . . . . . $2,075 $171 $ 5 $2,251Accumulated impairment . . . . . . . . . . . . . . . . . . . . . . . (368) — — (368)
Total . . . . . . . . . . . . . . . . . . . . . . . . . . . . . . . . . . . . . . $1,707 $171 $ 5 $1,883
The changes in the carrying amount of goodwill for the fiscal year ended March 31, 2017 are as follows (inmillions):
As ofMarch 31, 2016 Activity
Effects of ForeignCurrency
TranslationAs of
March 31, 2017
Goodwill . . . . . . . . . . . . . . . . . . . . . . . . . . . . . . . . . . . . $2,078 $— $ (3) $2,075Accumulated impairment . . . . . . . . . . . . . . . . . . . . . . . (368) — — (368)
Total . . . . . . . . . . . . . . . . . . . . . . . . . . . . . . . . . . . . . . $1,710 $— $ (3) $1,707
Goodwill represents the excess of the purchase price over the fair value of the underlying acquired net tangibleand intangible assets.
Acquisition-related intangibles, consisted of the following (in millions):
As of March 31, 2018 As of March 31, 2017
GrossCarryingAmount
AccumulatedAmortization
Acquisition-Related
Intangibles, Net
GrossCarryingAmount
AccumulatedAmortization
Acquisition-Related
Intangibles, Net
Developed and core technology . . . . . . . . . . $417 $(414) $ 3 $412 $(412) $—
Trade names and trademarks . . . . . . . . . . . . . 161 (107) 54 106 (98) 8
Registered user base and other intangibles . . 5 (5) — 5 (5) —
Carrier contracts and related . . . . . . . . . . . . . 85 (85) — 85 (85) —
In-process research and development . . . . . . 14 — 14 — — —
Total . . . . . . . . . . . . . . . . . . . . . . . . . . . . . . $682 $(611) $71 $608 $(600) $ 8
The fair value of acquisition-related intangible assets acquired in the Respawn acquisition was $74 million, ofwhich $55 million was allocated to trade names and trademarks, $14 million was allocated to in-process researchand development, and $5 million was allocated to developed and core technology. In-process research anddevelopment assets are considered indefinite-lived until complete. Excluding the in-process research anddevelopment assets, the weighted-average useful life of the Respawn acquired intangible assets wasapproximately 4.7 years.
Amortization of intangibles for the fiscal years ended March 31, 2018, 2017 and 2016 are classified in theConsolidated Statement of Operations as follows (in millions):
Year Ended March 31,
2018 2017 2016
Cost of service and other . . . . . . . . . . . . . . . . . . . . . . . . . . . . . . . . . . . . . . . . . . . . . $— $16 $33Cost of product . . . . . . . . . . . . . . . . . . . . . . . . . . . . . . . . . . . . . . . . . . . . . . . . . . . . . 2 27 14Operating expenses . . . . . . . . . . . . . . . . . . . . . . . . . . . . . . . . . . . . . . . . . . . . . . . . . . 9 6 7
Total . . . . . . . . . . . . . . . . . . . . . . . . . . . . . . . . . . . . . . . . . . . . . . . . . . . . . . . . . . . $11 $49 $54
69

There were no impairment charges for acquisition-related intangible assets during fiscal years 2018 and 2016.During fiscal year 2017, we determined that the carrying value of one of our acquisition-related intangible assetswas not recoverable. The acquisition-related intangible asset was measured using Level 3 inputs and was writtendown to a fair value of zero. We recognized an impairment charge of $15 million in cost of product revenue inour Consolidated Statements of Operations.
Finite-lived acquisition-related intangible assets are amortized using the straight-line method over the lesser oftheir estimated useful lives or the agreement terms, currently from 1 to 9 years. As of March 31, 2018 and 2017,the weighted-average remaining useful life for acquisition-related intangible assets was approximately 4.3 yearsand 1.4 years, respectively.
As of March 31, 2018, future amortization of finite-lived acquisition-related intangibles that will be recorded inthe Consolidated Statement of Operations is estimated as follows (in millions):
Fiscal Year Ending March 31,
2019 . . . . . . . . . . . . . . . . . . . . . . . . . . . . . . . . . . . . . . . . . . . . . . . . . . . . . . . . . . . . . . . . . . . . . . . . . . . . . . . . . . $16
2020 . . . . . . . . . . . . . . . . . . . . . . . . . . . . . . . . . . . . . . . . . . . . . . . . . . . . . . . . . . . . . . . . . . . . . . . . . . . . . . . . . . 11
2021 . . . . . . . . . . . . . . . . . . . . . . . . . . . . . . . . . . . . . . . . . . . . . . . . . . . . . . . . . . . . . . . . . . . . . . . . . . . . . . . . . . 11
2022 . . . . . . . . . . . . . . . . . . . . . . . . . . . . . . . . . . . . . . . . . . . . . . . . . . . . . . . . . . . . . . . . . . . . . . . . . . . . . . . . . . 11
2023 . . . . . . . . . . . . . . . . . . . . . . . . . . . . . . . . . . . . . . . . . . . . . . . . . . . . . . . . . . . . . . . . . . . . . . . . . . . . . . . . . . 8
Thereafter . . . . . . . . . . . . . . . . . . . . . . . . . . . . . . . . . . . . . . . . . . . . . . . . . . . . . . . . . . . . . . . . . . . . . . . . . . . . . —
Total . . . . . . . . . . . . . . . . . . . . . . . . . . . . . . . . . . . . . . . . . . . . . . . . . . . . . . . . . . . . . . . . . . . . . . . . . . . . . . . $57
(8) ROYALTIES AND LICENSES
Our royalty expenses consist of payments to (1) content licensors, (2) independent software developers, and(3) co-publishing and distribution affiliates. License royalties consist of payments made to celebrities,professional sports organizations, movie studios and other organizations for our use of their trademarks,copyrights, personal publicity rights, content and/or other intellectual property. Royalty payments to independentsoftware developers are payments for the development of intellectual property related to our games.Co-publishing and distribution royalties are payments made to third parties for the delivery of products.
During fiscal years 2018 and 2016, we did not recognize any material losses or impairment charges on royalty-based assets or royalty-based commitments. During fiscal year 2017, we determined that the carrying value ofcertain of our royalty-based assets and certain previously unrecognized minimum royalty-based commitmentswere not recoverable. We recognized impairment charges of $23 million on the assets and a loss of $19 millionon the commitments. Of the total $42 million loss, $10 million was included in cost of service revenue and$32 million was included in research and development expenses in our Consolidated Statements of Operations.
The current and long-term portions of prepaid royalties and minimum guaranteed royalty-related assets, includedin other current assets and other assets, consisted of (in millions):
As of March 31,
2018 2017
Other current assets . . . . . . . . . . . . . . . . . . . . . . . . . . . . . . . . . . . . . . . . . . . . . . . . . . . . . . . . . . $ 68 $ 79Other assets . . . . . . . . . . . . . . . . . . . . . . . . . . . . . . . . . . . . . . . . . . . . . . . . . . . . . . . . . . . . . . . . 34 39
Royalty-related assets . . . . . . . . . . . . . . . . . . . . . . . . . . . . . . . . . . . . . . . . . . . . . . . . . . . . . . $102 $118
At any given time, depending on the timing of our payments to our co-publishing and/or distribution affiliates,content licensors, and/or independent software developers, we classify any recognized unpaid royalty amounts
70

An
nu
alRep
ort
due to these parties as accrued liabilities. The current and long-term portions of accrued royalties, included inaccrued and other current liabilities and other liabilities, consisted of (in millions):
As of March 31,
2018 2017
Accrued royalties . . . . . . . . . . . . . . . . . . . . . . . . . . . . . . . . . . . . . . . . . . . . . . . . . . . . . . . . . . . . $171 $165Other liabilities . . . . . . . . . . . . . . . . . . . . . . . . . . . . . . . . . . . . . . . . . . . . . . . . . . . . . . . . . . . . . 74 97
Royalty-related liabilities . . . . . . . . . . . . . . . . . . . . . . . . . . . . . . . . . . . . . . . . . . . . . . . . . . . $245 $262
As of March 31, 2018, we were committed to pay approximately $899 million to content licensors, independentsoftware developers, and co-publishing and/or distribution affiliates, but performance remained with thecounterparty (i.e., delivery of the product or content or other factors) and such commitments were therefore notrecorded in our Consolidated Financial Statements. See Note 12 for further information on our developer andlicensor commitments.
(9) BALANCE SHEET DETAILS
Property and Equipment, Net
Property and equipment, net, as of March 31, 2018 and 2017 consisted of (in millions):
As of March 31,
2018 2017
Computer, equipment and software . . . . . . . . . . . . . . . . . . . . . . . . . . . . . . . . . . . . . . . . . . . . . . . $ 744 $ 723Buildings . . . . . . . . . . . . . . . . . . . . . . . . . . . . . . . . . . . . . . . . . . . . . . . . . . . . . . . . . . . . . . . . . . . . 336 316Leasehold improvements . . . . . . . . . . . . . . . . . . . . . . . . . . . . . . . . . . . . . . . . . . . . . . . . . . . . . . . . 139 126Equipment, furniture and fixtures, and other . . . . . . . . . . . . . . . . . . . . . . . . . . . . . . . . . . . . . . . . 84 82Land . . . . . . . . . . . . . . . . . . . . . . . . . . . . . . . . . . . . . . . . . . . . . . . . . . . . . . . . . . . . . . . . . . . . . . . . 66 61Construction in progress . . . . . . . . . . . . . . . . . . . . . . . . . . . . . . . . . . . . . . . . . . . . . . . . . . . . . . . . 7 7
1,376 1,315Less: accumulated depreciation . . . . . . . . . . . . . . . . . . . . . . . . . . . . . . . . . . . . . . . . . . . . . . . . . . (923) (881)
Property and equipment, net . . . . . . . . . . . . . . . . . . . . . . . . . . . . . . . . . . . . . . . . . . . . . . . . . . . $ 453 $ 434
Depreciation expense associated with property and equipment was $120 million, $115 million and $119 millionfor the fiscal years ended March 31, 2018, 2017 and 2016, respectively.
Accrued and Other Current Liabilities
Accrued and other current liabilities as of March 31, 2018 and 2017 consisted of (in millions):
As of March 31,
2018 2017
Accrued compensation and benefits . . . . . . . . . . . . . . . . . . . . . . . . . . . . . . . . . . . . . . . . . . . . . $282 $267Other accrued expenses . . . . . . . . . . . . . . . . . . . . . . . . . . . . . . . . . . . . . . . . . . . . . . . . . . . . . . . 260 210Accrued royalties . . . . . . . . . . . . . . . . . . . . . . . . . . . . . . . . . . . . . . . . . . . . . . . . . . . . . . . . . . . . 171 165Deferred net revenue (other) . . . . . . . . . . . . . . . . . . . . . . . . . . . . . . . . . . . . . . . . . . . . . . . . . . . 108 147
Accrued and other current liabilities . . . . . . . . . . . . . . . . . . . . . . . . . . . . . . . . . . . . . . . . . . . $821 $789
Deferred net revenue (other) includes the deferral of subscription revenue, advertising revenue, licensingarrangements, and other revenue for which revenue recognition criteria has not been met.
71

Deferred Net Revenue (Online-Enabled Games)
Deferred net revenue (online-enabled games) was $1,622 million and $1,539 million as of March 31, 2018 and2017, respectively. Deferred net revenue (online-enabled games) generally includes the unrecognized revenuefrom bundled sales of online-enabled games for which we do not have VSOE for the obligation to provideunspecified updates. We recognize revenue from the sale of online-enabled games for which we do not havevendor-specific objective evidence of fair value (“VSOE”) for the unspecified updates on a straight-line basis,generally over an estimated nine-month period beginning in the month after shipment for physical games soldthrough retail and an estimated six-month period for digitally-distributed games. However, we expense the costof revenue related to these transactions generally during the period in which the product is delivered (rather thanon a deferred basis).
(10) INCOME TAXES
The components of our income before provision for (benefit from) income taxes for the fiscal years endedMarch 31, 2018, 2017 and 2016 are as follows (in millions):
Year Ended March 31,
2018 2017 2016
Domestic . . . . . . . . . . . . . . . . . . . . . . . . . . . . . . . . . . . . . . . . . . . . . . . . . . . . . . . . . . $ 440 $ 382 $133Foreign . . . . . . . . . . . . . . . . . . . . . . . . . . . . . . . . . . . . . . . . . . . . . . . . . . . . . . . . . . . 1,009 828 744
Income before provision for (benefit from) income taxes . . . . . . . . . . . . . . . . . . $1,449 $1,210 $877
Provision for (benefit from) income taxes for the fiscal years ended March 31, 2018, 2017 and 2016 consisted of(in millions):
Current Deferred Total
Year Ended March 31, 2018Federal . . . . . . . . . . . . . . . . . . . . . . . . . . . . . . . . . . . . . . . . . . . . . . . . . . . . . . . . . . . . $138 $ 197 $ 335State . . . . . . . . . . . . . . . . . . . . . . . . . . . . . . . . . . . . . . . . . . . . . . . . . . . . . . . . . . . . . . 4 9 13Foreign . . . . . . . . . . . . . . . . . . . . . . . . . . . . . . . . . . . . . . . . . . . . . . . . . . . . . . . . . . . . 61 (3) 58
$203 $ 203 $ 406
Year Ended March 31, 2017Federal . . . . . . . . . . . . . . . . . . . . . . . . . . . . . . . . . . . . . . . . . . . . . . . . . . . . . . . . . . . . $ 86 $ 96 $ 182State . . . . . . . . . . . . . . . . . . . . . . . . . . . . . . . . . . . . . . . . . . . . . . . . . . . . . . . . . . . . . . 3 9 12Foreign . . . . . . . . . . . . . . . . . . . . . . . . . . . . . . . . . . . . . . . . . . . . . . . . . . . . . . . . . . . . 51 (2) 49
$140 $ 103 $ 243
Year Ended March 31, 2016Federal . . . . . . . . . . . . . . . . . . . . . . . . . . . . . . . . . . . . . . . . . . . . . . . . . . . . . . . . . . . . $ 69 $(376) $(307)State . . . . . . . . . . . . . . . . . . . . . . . . . . . . . . . . . . . . . . . . . . . . . . . . . . . . . . . . . . . . . . 5 (14) (9)Foreign . . . . . . . . . . . . . . . . . . . . . . . . . . . . . . . . . . . . . . . . . . . . . . . . . . . . . . . . . . . . 36 1 37
$110 $(389) $(279)
Our effective tax rate and resulting provision for income taxes for the year ended March 31, 2018 wassignificantly impacted by the U.S. Tax Cuts and Jobs Act (the “U.S. Tax Act”), enacted on December 22, 2017.The U.S. Tax Act significantly revised the U.S. corporate income tax system by, among other things, loweringU.S. corporate income tax rate to 21 percent, generally implementing a territorial tax system and imposing aone-time transition tax on the deemed repatriation of undistributed earnings of foreign subsidiaries (the“Transition Tax”).
Reasonable estimates of the impacts of the U.S. Tax Act are provided in accordance with SEC guidance thatallows for a measurement period of up to one year after the enactment date of the U.S. Tax Act to finalize the
72

An
nu
alRep
ort
recording of the related tax impacts. We expect to complete the accounting under the U.S. Tax Act as soon aspracticable, but in no event later than one year from the enactment date of the U.S. Tax Act.
We recorded a provisional tax expense of $235 million related to the U.S. Tax Act for the year ended March 31,2018, $192 million of which relates to the Transition Tax. During the three months ended March 31, 2018, weadjusted the provisional amount initially recorded for the Transition Tax by recognizing an additional$41 million charge. We also recorded immaterial adjustments to certain other tax items. These adjustments werebased on our further analysis of the U.S. Tax Act and certain changes to current year earnings estimates andassertions. These amounts remain provisional. The final calculation of taxes attributable to the U.S. Tax Act maydiffer from our estimates, potentially materially, due to, among other things, changes in interpretations of theU.S. Tax Act, our further analysis of the U.S. Tax Act, or any updates or changes to estimates that we haveutilized to calculate the transition impacts.
The U.S. Tax Act creates new U.S. taxes on foreign earnings. Our provision for income taxes for the year endedMarch 31, 2018 provisionally does not reflect any deferred tax impacts of the U.S. taxes on foreign earnings.Because of the complexity of the rules regarding the new tax on foreign earnings, we are continuing to evaluatethis accounting policy election.
Upon adoption of ASU 2016-09 at the beginning of fiscal year 2018, we reflected excess tax benefits of $43million for the year ended March 31, 2018 in the Consolidated Statement of Income as a component of theprovision for income taxes. For fiscal years 2017 and 2016, excess tax benefits of $65 million and $83 million,respectively, were recognized in additional paid-in-capital in the Condensed Consolidated Balance Sheets.
The differences between the statutory tax expense rate and our effective tax expense (benefit) rate, expressed as apercentage of income before provision for (benefit from) income taxes, for the fiscal years ended March 31,2018, 2017 and 2016 were as follows:
Year Ended March 31,
2018 2017 2016
Statutory federal tax expense rate . . . . . . . . . . . . . . . . . . . . . . . . . . . . . . . . . . . . . . . 31.5% 35.0% 35.0%State taxes, net of federal benefit . . . . . . . . . . . . . . . . . . . . . . . . . . . . . . . . . . . . . . . 0.8% 1.0% 0.5%Differences between statutory rate and foreign effective tax rate . . . . . . . . . . . . . . (19.1)% (19.3)% (22.1)%Valuation allowance . . . . . . . . . . . . . . . . . . . . . . . . . . . . . . . . . . . . . . . . . . . . . . . . . —% —% (51.7)%Tax reform . . . . . . . . . . . . . . . . . . . . . . . . . . . . . . . . . . . . . . . . . . . . . . . . . . . . . . . . 16.2% —% —%Excess tax benefit . . . . . . . . . . . . . . . . . . . . . . . . . . . . . . . . . . . . . . . . . . . . . . . . . . . (3.0)% —% —%Research and development credits . . . . . . . . . . . . . . . . . . . . . . . . . . . . . . . . . . . . . . (1.4)% (0.7)% (0.6)%Unremitted earnings of foreign subsidiaries . . . . . . . . . . . . . . . . . . . . . . . . . . . . . . . —% 2.2% 4.9%Non-deductible stock-based compensation . . . . . . . . . . . . . . . . . . . . . . . . . . . . . . . 2.7% 2.3% 3.1%Other . . . . . . . . . . . . . . . . . . . . . . . . . . . . . . . . . . . . . . . . . . . . . . . . . . . . . . . . . . . . . 0.3% (0.4)% (0.9)%
Effective tax expense (benefit) rate . . . . . . . . . . . . . . . . . . . . . . . . . . . . . . . . . . . 28.0% 20.1% (31.8)%
We generated income in lower tax jurisdictions primarily related to our European and Asia Pacific businessesthat are headquartered in Switzerland.
In the fourth quarter of fiscal year 2016, we realized significant U.S. pre-tax income for both the fourth quarterand the fiscal year ended March 31, 2016. As a result, we released the valuation allowance against all of the U.S.federal deferred tax assets and a portion of the U.S. state deferred tax assets during the fourth quarter of fiscalyear 2016.
Prior to the U.S. Tax Act, a substantial majority of undistributed earnings of our foreign subsidiaries wereconsidered to be indefinitely reinvested. The U.S. Tax Act included a mandatory one-time tax on accumulatedearnings of foreign subsidiaries, and as a result, substantially all previously unremitted earnings for which noU.S. deferred tax liability had been accrued have now been subject to U.S. tax.
73

The components of net deferred tax assets, as of March 31, 2018 and 2017 consisted of (in millions):
As of March 31,
2018 2017
Deferred tax assets:Accruals, reserves and other expenses . . . . . . . . . . . . . . . . . . . . . . . . . . . . . . . . . . . . . . . . . $ 81 $ 151Tax credit carryforwards . . . . . . . . . . . . . . . . . . . . . . . . . . . . . . . . . . . . . . . . . . . . . . . . . . . . 121 276Stock-based compensation . . . . . . . . . . . . . . . . . . . . . . . . . . . . . . . . . . . . . . . . . . . . . . . . . . 24 37Net operating loss & capital loss carryforwards . . . . . . . . . . . . . . . . . . . . . . . . . . . . . . . . . . 23 25
Total . . . . . . . . . . . . . . . . . . . . . . . . . . . . . . . . . . . . . . . . . . . . . . . . . . . . . . . . . . . . . . . . . . 249 489Valuation allowance . . . . . . . . . . . . . . . . . . . . . . . . . . . . . . . . . . . . . . . . . . . . . . . . . . . . . . . (138) (114)
Deferred tax assets, net of valuation allowance . . . . . . . . . . . . . . . . . . . . . . . . . . . . . . . . 111 375
Deferred tax liabilities:Amortization and depreciation . . . . . . . . . . . . . . . . . . . . . . . . . . . . . . . . . . . . . . . . . . . . . . . (27) (19)Unremitted earnings of foreign subsidiaries . . . . . . . . . . . . . . . . . . . . . . . . . . . . . . . . . . . . . — (70)Prepaids and other liabilities . . . . . . . . . . . . . . . . . . . . . . . . . . . . . . . . . . . . . . . . . . . . . . . . . (2) (1)
Total . . . . . . . . . . . . . . . . . . . . . . . . . . . . . . . . . . . . . . . . . . . . . . . . . . . . . . . . . . . . . . . . . . (29) (90)
Deferred tax assets, net of valuation allowance and deferred tax liabilities . . . . . . . . . . . $ 82 $ 285
As of March 31, 2018, we maintained a valuation allowance of $138 million, primarily related to certain U.S.state deferred tax assets and foreign capital loss carryovers, due to uncertainty about the future realization ofthese assets. In determining the amount of deferred tax assets that are more likely than not to be realized, weevaluated the potential to realize the assets through the utilization of tax loss and credit carrybacks, the reversalof existing taxable temporary differences, future taxable income exclusive of the reversal of existing taxabletemporary differences, and certain tax planning strategies.
As of March 31, 2018, we have state net operating loss carry forwards of approximately $639 million of whichapproximately $10 million is attributable to various acquired companies. These carryforwards, if not fullyrealized, will begin to expire in 2019. We also have U.S. federal, California and Canada tax credit carryforwardsof $8 million, $107 million and $6 million, respectively. The U.S. federal tax credit carryforwards will begin toexpire in 2027. The California and Canada tax credit carryforwards can be carried forward indefinitely.
74

An
nu
alRep
ort
The total unrecognized tax benefits as of March 31, 2018, 2017 and 2016 were $457 million, $389 million and$331 million, respectively. A reconciliation of the beginning and ending balance of unrecognized tax benefits issummarized as follows (in millions):
Balance as of March 31, 2015 . . . . . . . . . . . . . . . . . . . . . . . . . . . . . . . . . . . . . . . . . . . . . . . . . . . . . . . . . . . . . $254Increases in unrecognized tax benefits related to prior year tax positions . . . . . . . . . . . . . . . . . . . . . . . . . 33Decreases in unrecognized tax benefits related to prior year tax positions . . . . . . . . . . . . . . . . . . . . . . . . (4)Increases in unrecognized tax benefits related to current year tax positions . . . . . . . . . . . . . . . . . . . . . . . 63Decreases in unrecognized tax benefits related to settlements with taxing authorities . . . . . . . . . . . . . . . (10)Reductions in unrecognized tax benefits due to lapse of applicable statute of limitations . . . . . . . . . . . . . (4)Changes in unrecognized tax benefits due to foreign currency translation . . . . . . . . . . . . . . . . . . . . . . . . (1)
Balance as of March 31, 2016 . . . . . . . . . . . . . . . . . . . . . . . . . . . . . . . . . . . . . . . . . . . . . . . . . . . . . . . . . . . . . 331
Increases in unrecognized tax benefits related to prior year tax positions . . . . . . . . . . . . . . . . . . . . . . . . . 3Decreases in unrecognized tax benefits related to prior year tax positions . . . . . . . . . . . . . . . . . . . . . . . . (3)Increases in unrecognized tax benefits related to current year tax positions . . . . . . . . . . . . . . . . . . . . . . . 64Decreases in unrecognized tax benefits related to settlements with taxing authorities . . . . . . . . . . . . . . . —Reductions in unrecognized tax benefits due to lapse of applicable statute of limitations . . . . . . . . . . . . . (3)Changes in unrecognized tax benefits due to foreign currency translation . . . . . . . . . . . . . . . . . . . . . . . . (3)
Balance as of March 31, 2017 . . . . . . . . . . . . . . . . . . . . . . . . . . . . . . . . . . . . . . . . . . . . . . . . . . . . . . . . . . . . . 389
Increases in unrecognized tax benefits related to prior year tax positions . . . . . . . . . . . . . . . . . . . . . . . . . 10Decreases in unrecognized tax benefits related to prior year tax positions . . . . . . . . . . . . . . . . . . . . . . . . (12)Increases in unrecognized tax benefits related to current year tax positions . . . . . . . . . . . . . . . . . . . . . . . 75Decreases in unrecognized tax benefits related to settlements with taxing authorities . . . . . . . . . . . . . . . (7)Reductions in unrecognized tax benefits due to lapse of applicable statute of limitations . . . . . . . . . . . . . (2)Changes in unrecognized tax benefits due to foreign currency translation . . . . . . . . . . . . . . . . . . . . . . . . 4
Balance as of March 31, 2018 . . . . . . . . . . . . . . . . . . . . . . . . . . . . . . . . . . . . . . . . . . . . . . . . . . . . . . . . . . . . . $457
As of March 31, 2018, approximately $248 million of the unrecognized tax benefits would affect our effectivetax rate.
Interest and penalties related to estimated obligations for tax positions taken in our tax returns are recognized inincome tax expense in our Consolidated Statements of Operations. The combined amount of accrued interest andpenalties related to tax positions taken on our tax returns and included in non-current other liabilities wasapproximately $18 million as of March 31, 2018 and $14 million as of March 31, 2017.
We file income tax returns in the United States, including various state and local jurisdictions. Our subsidiariesfile tax returns in various foreign jurisdictions, including Canada, France, Germany, Switzerland and the UnitedKingdom. The IRS is currently examining our returns for fiscal years 2009 through 2011, and we remain subjectto income tax examination by the IRS for fiscal years after 2014.
We are also currently under income tax examination in the United Kingdom for fiscal years 2010 through 2015,Spain for fiscal years 2014 through 2015, and India for fiscal years 2009 through 2013. We remain subject toincome tax examination for several other jurisdictions including in Germany for fiscal years after 2012, Francefor fiscal years after 2016, the United Kingdom for fiscal years after 2015, Canada for fiscal year after 2010, andSwitzerland for fiscal years after 2008.
The timing of the resolution of income tax examinations is highly uncertain, and the amounts ultimately paid, ifany, upon resolution of the issues raised by the taxing authorities may differ materially from the amounts accruedfor each year. Although potential resolution of uncertain tax positions involves multiple tax periods andjurisdictions, it is reasonably possible that a reduction of up to $60 million of unrecognized tax benefits mayoccur within the next 12 months, some of which, depending on the nature of the settlement or expiration ofstatutes of limitations, may affect the Company’s income tax provision and therefore benefit the resulting
75
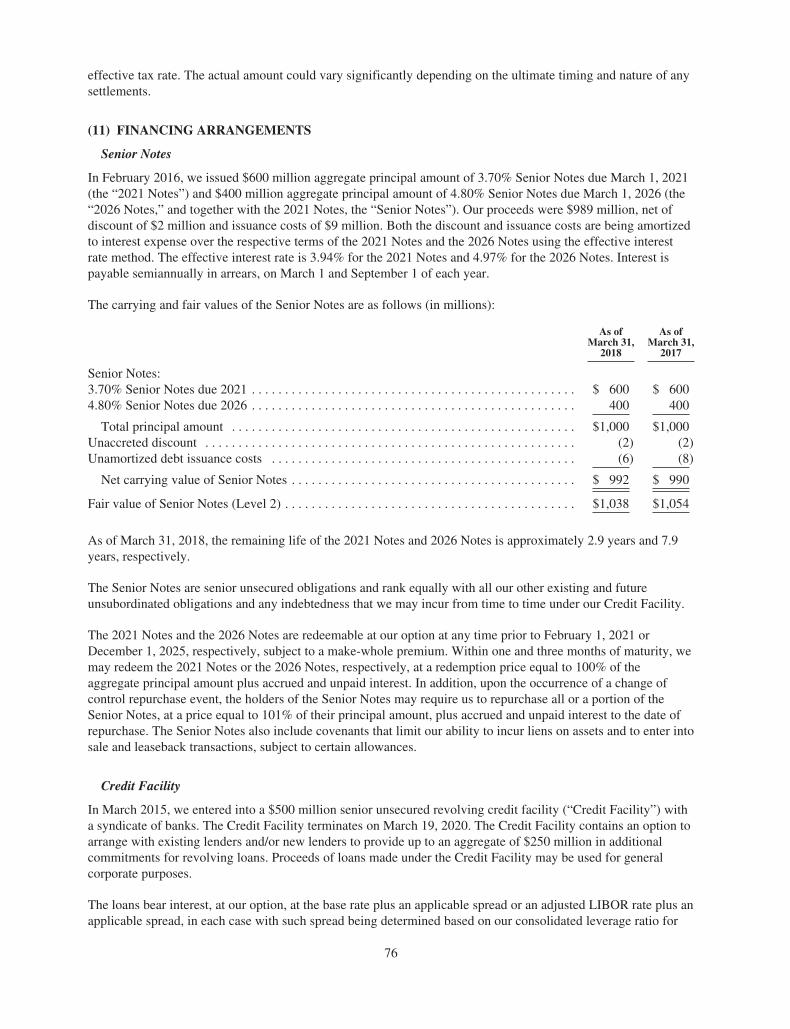
effective tax rate. The actual amount could vary significantly depending on the ultimate timing and nature of anysettlements.
(11) FINANCING ARRANGEMENTS
Senior Notes
In February 2016, we issued $600 million aggregate principal amount of 3.70% Senior Notes due March 1, 2021(the “2021 Notes”) and $400 million aggregate principal amount of 4.80% Senior Notes due March 1, 2026 (the“2026 Notes,” and together with the 2021 Notes, the “Senior Notes”). Our proceeds were $989 million, net ofdiscount of $2 million and issuance costs of $9 million. Both the discount and issuance costs are being amortizedto interest expense over the respective terms of the 2021 Notes and the 2026 Notes using the effective interestrate method. The effective interest rate is 3.94% for the 2021 Notes and 4.97% for the 2026 Notes. Interest ispayable semiannually in arrears, on March 1 and September 1 of each year.
The carrying and fair values of the Senior Notes are as follows (in millions):
As ofMarch 31,
2018
As ofMarch 31,
2017
Senior Notes:3.70% Senior Notes due 2021 . . . . . . . . . . . . . . . . . . . . . . . . . . . . . . . . . . . . . . . . . . . . . . . . . $ 600 $ 6004.80% Senior Notes due 2026 . . . . . . . . . . . . . . . . . . . . . . . . . . . . . . . . . . . . . . . . . . . . . . . . . 400 400
Total principal amount . . . . . . . . . . . . . . . . . . . . . . . . . . . . . . . . . . . . . . . . . . . . . . . . . . . . $1,000 $1,000Unaccreted discount . . . . . . . . . . . . . . . . . . . . . . . . . . . . . . . . . . . . . . . . . . . . . . . . . . . . . . . . (2) (2)Unamortized debt issuance costs . . . . . . . . . . . . . . . . . . . . . . . . . . . . . . . . . . . . . . . . . . . . . . (6) (8)
Net carrying value of Senior Notes . . . . . . . . . . . . . . . . . . . . . . . . . . . . . . . . . . . . . . . . . . . $ 992 $ 990
Fair value of Senior Notes (Level 2) . . . . . . . . . . . . . . . . . . . . . . . . . . . . . . . . . . . . . . . . . . . . $1,038 $1,054
As of March 31, 2018, the remaining life of the 2021 Notes and 2026 Notes is approximately 2.9 years and 7.9years, respectively.
The Senior Notes are senior unsecured obligations and rank equally with all our other existing and futureunsubordinated obligations and any indebtedness that we may incur from time to time under our Credit Facility.
The 2021 Notes and the 2026 Notes are redeemable at our option at any time prior to February 1, 2021 orDecember 1, 2025, respectively, subject to a make-whole premium. Within one and three months of maturity, wemay redeem the 2021 Notes or the 2026 Notes, respectively, at a redemption price equal to 100% of theaggregate principal amount plus accrued and unpaid interest. In addition, upon the occurrence of a change ofcontrol repurchase event, the holders of the Senior Notes may require us to repurchase all or a portion of theSenior Notes, at a price equal to 101% of their principal amount, plus accrued and unpaid interest to the date ofrepurchase. The Senior Notes also include covenants that limit our ability to incur liens on assets and to enter intosale and leaseback transactions, subject to certain allowances.
Credit Facility
In March 2015, we entered into a $500 million senior unsecured revolving credit facility (“Credit Facility”) witha syndicate of banks. The Credit Facility terminates on March 19, 2020. The Credit Facility contains an option toarrange with existing lenders and/or new lenders to provide up to an aggregate of $250 million in additionalcommitments for revolving loans. Proceeds of loans made under the Credit Facility may be used for generalcorporate purposes.
The loans bear interest, at our option, at the base rate plus an applicable spread or an adjusted LIBOR rate plus anapplicable spread, in each case with such spread being determined based on our consolidated leverage ratio for
76

An
nu
alRep
ort
the preceding fiscal quarter. We are also obligated to pay other customary fees for a credit facility of this size andtype. Interest is due and payable in arrears quarterly for loans bearing interest at the base rate and at the end of aninterest period (or at each three month interval in the case of loans with interest periods greater than threemonths) in the case of loans bearing interest at the adjusted LIBOR rate. Principal, together with all accrued andunpaid interest, is due and payable on March 19, 2020.The credit agreement contains customary affirmative and negative covenants, including covenants that limit orrestrict our ability to, among other things, incur subsidiary indebtedness, grant liens, dispose of all orsubstantially all assets and pay dividends or make distributions, in each case subject to customary exceptions fora credit facility of this size and type. We are also required to maintain compliance with a capitalization ratio andmaintain a minimum level of total liquidity.
The credit agreement contains customary events of default, including among others, non-payment defaults,covenant defaults, cross-defaults to material indebtedness, bankruptcy and insolvency defaults, materialjudgment defaults and a change of control default, in each case, subject to customary exceptions for a creditfacility of this size and type. The occurrence of an event of default could result in the acceleration of theobligations under the credit facility, an obligation by any guarantors to repay the obligations in full and anincrease in the applicable interest rate.
As of March 31, 2018 and 2017, no amounts were outstanding under the Credit Facility. $2 million of debtissuance costs that were paid in connection with obtaining this credit facility are being amortized to interestexpense over the 5-year term of the Credit Facility.
Interest Expense
The following table summarizes our interest expense recognized for fiscal years 2018, 2017, and 2016 that isincluded in interest and other income (expense), net on our Consolidated Statements of Operations (in millions):
Year EndedMarch 31,
2018 2017 2016
Amortization of debt discount . . . . . . . . . . . . . . . . . . . . . . . . . . . . . . . . . . . . . . . . . . . . . . . . . . — (2) (17)Amortization of debt issuance costs . . . . . . . . . . . . . . . . . . . . . . . . . . . . . . . . . . . . . . . . . . . . . (2) (2) (3)Coupon interest expense . . . . . . . . . . . . . . . . . . . . . . . . . . . . . . . . . . . . . . . . . . . . . . . . . . . . . . (42) (42) (7)Other interest expense . . . . . . . . . . . . . . . . . . . . . . . . . . . . . . . . . . . . . . . . . . . . . . . . . . . . . . . . — (1) (1)
Total interest expense . . . . . . . . . . . . . . . . . . . . . . . . . . . . . . . . . . . . . . . . . . . . . . . . . . . . . . $(44) $(47) $(28)
(12) COMMITMENTS AND CONTINGENCIES
Lease Commitments
As of March 31, 2018, we leased certain facilities, furniture and equipment under non-cancelable operating leaseagreements. We were required to pay property taxes, insurance and normal maintenance costs for certain of thesefacilities and any increases over the base year of these expenses on the remainder of our facilities.
Development, Celebrity, League and Content Licenses: Payments and Commitments
The products we produce in our studios are designed and created by our employee designers, artists, softwareprogrammers and by non-employee software developers (“independent artists” or “third-party developers”). Wetypically advance development funds to the independent artists and third-party developers during development ofour games, usually in installment payments made upon the completion of specified development milestones.Contractually, these payments are generally considered advances against subsequent royalties on the sales of theproducts. These terms are set forth in written agreements entered into with the independent artists and third-partydevelopers.
77

In addition, we have certain celebrity, league and content license contracts that contain minimum guaranteepayments and marketing commitments that may not be dependent on any deliverables. Celebrities andorganizations with whom we have contracts include, but are not limited to: FIFA (Fédération Internationale deFootball Association), FIFPRO Foundation, FAPL (Football Association Premier League Limited), and DFLDeutsche Fußball Liga E.V. (German Soccer League) (professional soccer); National Basketball Association(professional basketball); National Hockey League and NHL Players’ Association (professional hockey);National Football League Properties and PLAYERS Inc. (professional football); William Morris EndeavorEntertainment LLC (professional mixed martial arts); ESPN (content in EA SPORTS games); Disney Interactive(Star Wars); and Fox Digital Entertainment, Inc. (The Simpsons). These developer and content licensecommitments represent the sum of (1) the cash payments due under non-royalty-bearing licenses and servicesagreements and (2) the minimum guaranteed payments and advances against royalties due under royalty-bearinglicenses and services agreements, the majority of which are conditional upon performance by the counterparty.These minimum guarantee payments and any related marketing commitments are included in the table below.
The following table summarizes our minimum contractual obligations as of March 31, 2018 (in millions):
Fiscal Year Ending March 31,
Total 2019 2020 2021 2022 2023 Thereafter
Unrecognized commitmentsDeveloper/licensor commitments . . . . . . . . . . . . . . $ 899 $174 $227 $ 206 $211 $ 80 $ 1Marketing commitments . . . . . . . . . . . . . . . . . . . . . 358 89 87 79 75 28 —Operating leases . . . . . . . . . . . . . . . . . . . . . . . . . . . 240 40 40 40 33 26 61Senior Notes interest . . . . . . . . . . . . . . . . . . . . . . . . 217 38 41 41 20 19 58Other purchase obligations . . . . . . . . . . . . . . . . . . . 110 32 35 14 9 6 14
Total unrecognized commitments . . . . . . . . . . . 1,824 373 430 380 348 159 134
Recognized commitmentsSenior Notes principal and interest . . . . . . . . . . . . . 1,003 3 — 600 — — 400Transition Tax . . . . . . . . . . . . . . . . . . . . . . . . . . . . 50 5 4 4 4 4 29Licensing and lease obligations . . . . . . . . . . . . . . . 102 24 25 26 27 — —
Total recognized commitments . . . . . . . . . . . . . 1,155 32 29 630 31 4 429
Total Commitments . . . . . . . . . . . . . . . . . . . . . . $2,979 $405 $459 $1,010 $379 $163 $563
The unrecognized amounts represented in the table above reflect our minimum cash obligations for the respectivefiscal years, but do not necessarily represent the periods in which they will be recognized and expensed in ourConsolidated Financial Statements.
In addition, the amounts in the table above are presented based on the dates the amounts are contractually due asof March 31, 2018; however, certain payment obligations may be accelerated depending on the performance ofour operating results. Furthermore, up to $32 million of the unrecognized amounts in the table above may bepayable, at the licensor’s election, in shares of our common stock, subject to a $10 million maximum during anyfiscal year. The number of shares to be issued will be based on their fair market value at the time of issuance.
In addition to what is included in the table above, as of March 31, 2018, we had a liability for unrecognized taxbenefits and an accrual for the payment of related interest totaling $205 million, of which we are unable to makea reasonably reliable estimate of when cash settlement with a taxing authority will occur.
In addition to what is included in the table above, as of March 31, 2018, we may be required to pay up to $140million of cash consideration in connection with the Respawn acquisition based on the achievement of certainperformance milestones through the end of calendar year 2022. As of March 31, 2018, we have recorded $122million of contingent consideration on our Consolidated Balance Sheet representing the estimated fair value.
Total rent expense for our operating leases was $92 million, $91 million and $89 million for the fiscal yearsended March 31, 2018, 2017 and 2016, respectively.
78

An
nu
alRep
ort
Legal Proceedings
On July 29, 2010, Michael Davis, a former NFL running back, filed a putative class action in the United StatesDistrict Court for the Northern District of California against the Company, alleging that certain past versions ofMadden NFL included the images of certain retired NFL players without their permission. In March 2012, thetrial court denied the Company’s request to dismiss the complaint on First Amendment grounds. In January 2015,that trial court decision was affirmed by the Ninth Circuit Court of Appeals and the case was remanded back tothe United States District Court for the Northern District of California, where the case is pending.
We are also subject to claims and litigation arising in the ordinary course of business. We do not believe that anyliability from any reasonably foreseeable disposition of such claims and litigation, individually or in theaggregate, would have a material adverse effect on our Consolidated Financial Statements.
(13) PREFERRED STOCK
As of March 31, 2018 and 2017, we had 10,000,000 shares of preferred stock authorized but unissued. The rights,preferences, and restrictions of the preferred stock may be designated by our Board of Directors without furtheraction by our stockholders.
(14) STOCK-BASED COMPENSATION AND EMPLOYEE BENEFIT PLANS
Valuation Assumptions
We estimate the fair value of stock-based awards on the date of grant. We recognize compensation costs forstock-based awards to employees based on the grant-date fair value using a straight-line approach over theservice period for which such awards are expected to vest.
The determination of the fair value of market-based restricted stock units, stock options and ESPP purchaserights is affected by assumptions regarding subjective and complex variables. Generally, our assumptions arebased on historical information and judgment is required to determine if historical trends may be indicators offuture outcomes. We determine the fair value of our stock-based awards as follows:
• Restricted Stock Units and Performance-Based Restricted Stock Units. The fair value of restricted stockunits and performance-based restricted stock units (other than market-based restricted stock units) isdetermined based on the quoted market price of our common stock on the date of grant.
• Market-Based Restricted Stock Units. Market-based restricted stock units consist of grants ofperformance-based restricted stock units to certain members of executive management that vestcontingent upon the achievement of pre-determined market and service conditions (referred to hereinas “market-based restricted stock units”). The fair value of our market-based restricted stock units isdetermined using a Monte-Carlo simulation model. Key assumptions for the Monte-Carlo simulationmodel are the risk-free interest rate, expected volatility, expected dividends and correlation coefficient.
• Stock Options and Employee Stock Purchase Plan. The fair value of stock options and stock purchaserights granted pursuant to our equity incentive plans and our 2000 Employee Stock Purchase Plan, asamended (“ESPP”), respectively, is determined using the Black-Scholes valuation model based on themultiple-award valuation method. Key assumptions of the Black-Scholes valuation model are the risk-free interest rate, expected volatility, expected term and expected dividends. The risk-free interest rateis based on U.S. Treasury yields in effect at the time of grant for the expected term of the option.Expected volatility is based on a combination of historical stock price volatility and implied volatilityof publicly-traded options on our common stock. Expected term is determined based on historicalexercise behavior, post-vesting termination patterns, options outstanding and future expected exercisebehavior.
There were an insignificant number of stock options granted during fiscal years 2018 and 2017.
79

The estimated assumptions used in the Black-Scholes valuation model to value our ESPP purchase rights were asfollows:
ESPP Purchase Rights
Year Ended March 31,
2018 2017 2016
Risk-free interest rate . . . . . . . . . . . . . . . . . . . . . . . . . . . . . . . . . . 1.1 - 2.0% 0.5 - 0.8% 0.3 - 0.6%Expected volatility . . . . . . . . . . . . . . . . . . . . . . . . . . . . . . . . . . . . 28 - 30% 25 - 32% 32 - 36%Weighted-average volatility . . . . . . . . . . . . . . . . . . . . . . . . . . . . . 29% 27% 33%Expected term . . . . . . . . . . . . . . . . . . . . . . . . . . . . . . . . . . . . . . . . 6 - 12 months 6 - 12 months 6 - 12 monthsExpected dividends . . . . . . . . . . . . . . . . . . . . . . . . . . . . . . . . . . . . None None None
The assumptions used in the Monte-Carlo simulation model to value our market-based restricted stock units wereas follows:
Year Ended March 31,
2018 2017 2016
Risk-free interest rate . . . . . . . . . . . . . . . . . . . . . . . . . . . . . . . . . . . . . . . . . . . . . . . . . 1.5 - 1.6% 0.8% 1.0%Expected volatility . . . . . . . . . . . . . . . . . . . . . . . . . . . . . . . . . . . . . . . . . . . . . . . . . . . 17 - 46% 16 - 57% 14 - 53%Weighted-average volatility . . . . . . . . . . . . . . . . . . . . . . . . . . . . . . . . . . . . . . . . . . . . 28% 29% 26%Expected dividends . . . . . . . . . . . . . . . . . . . . . . . . . . . . . . . . . . . . . . . . . . . . . . . . . . . None None None
Stock-Based Compensation Expense
Employee stock-based compensation expense recognized during the fiscal years ended March 31, 2017 and 2016was calculated based on awards ultimately expected to vest and was reduced for estimated forfeitures. Weadopted ASU 2016-09 at the beginning of fiscal year 2018 and elected to account for forfeitures as they occur.The adoption resulted in a cumulative-effect adjustment of $8 million, net of tax, decrease to retained earnings.
The following table summarizes stock-based compensation expense resulting from stock options, restricted stockunits, market-based restricted stock units, performance-based restricted stock units, and the ESPP purchase rightsincluded in our Consolidated Statements of Operations (in millions):
Year Ended March 31,
2018 2017 2016
Cost of revenue . . . . . . . . . . . . . . . . . . . . . . . . . . . . . . . . . . . . . . . . . . . . . . . . . . . . . . . . . . . . $ 3 $ 3 $ 2Research and development . . . . . . . . . . . . . . . . . . . . . . . . . . . . . . . . . . . . . . . . . . . . . . . . . . . 146 109 103Marketing and sales . . . . . . . . . . . . . . . . . . . . . . . . . . . . . . . . . . . . . . . . . . . . . . . . . . . . . . . . . 32 31 24General and administrative . . . . . . . . . . . . . . . . . . . . . . . . . . . . . . . . . . . . . . . . . . . . . . . . . . . 61 53 49
Stock-based compensation expense . . . . . . . . . . . . . . . . . . . . . . . . . . . . . . . . . . . . . . . . . . . . $242 $196 $178
During the fiscal years ended March 31, 2018, 2017 and 2016, we recognized $29 million, $43 million and$38 million, respectively, of deferred income tax benefit related to our stock-based compensation expense.
As of March 31, 2018, our total unrecognized compensation cost related to restricted stock units, market-basedrestricted stock units, and performance-based restricted stock units was $504 million and is expected to berecognized over a weighted-average service period of 2.2 years. Of the $504 million of unrecognizedcompensation cost, $418 million relates to restricted stock units, $49 million relates to market-based restrictedstock units, and $37 million relates to performance-based restricted stock units at a 104 percent average vestingtarget. As of March 31, 2018, there were no unrecognized compensation cost related to stock options as theywere fully vested.
80

An
nu
alRep
ort
Summary of Plans and Plan Activity
Equity Incentive Plans
Our 2000 Equity Incentive Plan, as amended, (the “Equity Plan”) allows us to grant options to purchase ourcommon stock and to grant restricted stock, restricted stock units and stock appreciation rights to our employees,officers, and directors. Pursuant to the Equity Plan, incentive stock options may be granted to employees andofficers and non-qualified options may be granted to employees, officers, and directors, at not less than100 percent of the fair market value on the date of grant.
Approximately 17.7 million options or 12.3 million restricted stock units were available for grant under ourEquity Plan as of March 31, 2018.
Stock Options
Options granted under the Equity Plan generally expire ten years from the date of grant and generally vestaccording to one of the following schedules:
• 35 month vesting with 1/3 vesting after 11, 23 and 35 months;
• Three-year vesting with 1/3 vesting at the end of each year;
• 50 month vesting with 24% of the shares vesting after 12 months and 2% vesting monthly over thefollowing 38 months.
The following table summarizes our stock option activity for the fiscal year ended March 31, 2018:
Options(in thousands)
Weighted-Average
Exercise Prices
Weighted-Average
RemainingContractual
Term (in years)
AggregateIntrinsic Value
(in millions)
Outstanding as of March 31, 2017 . . . . . . . . . . . . . . 2,377 $ 33.35Granted . . . . . . . . . . . . . . . . . . . . . . . . . . . . . . . . . 5 113.39Exercised . . . . . . . . . . . . . . . . . . . . . . . . . . . . . . . . (764) 40.30Forfeited, cancelled or expired . . . . . . . . . . . . . . . (3) 41.71
Outstanding as of March 31, 2018 . . . . . . . . . . . . . . 1,615 $ 30.28 5.44 $147
Vested and expected to vest . . . . . . . . . . . . . . . . . . . 1,615 $ 30.28 5.44 $147
Exercisable as of March 31, 2018 . . . . . . . . . . . . . . . 1,615 $ 30.28 5.44 $147
The aggregate intrinsic value represents the total pre-tax intrinsic value based on our closing stock price as ofMarch 31, 2018, which would have been received by the option holders had all the option holders exercised theiroptions as of that date. The total intrinsic values of stock options exercised during fiscal years 2018, 2017, and2016 were $43 million, $39 million and $38 million, respectively. We issue new common stock from ourauthorized shares upon the exercise of stock options.
The following table summarizes outstanding and exercisable stock options as of March 31, 2018:
Options Outstanding Options Exercisable
Range ofExercise Prices
Numberof Shares
(in thousands)
Weighted-Average
RemainingContractual
Term (in years)
Weighted-AverageExercisePrices
PotentialDilution
Numberof Shares
(in thousands)
Weighted-AverageExercisePrices
PotentialDilution
$11.53-$22.42 119 1.41 $19.80 —% 119 $19.80 0.1%26.25-26.25 750 5.59 26.25 0.3% 750 26.25 0.2%33.60-47.06 746 5.94 36.01 0.2% 746 36.01 0.2%
$11.53-$47.06 1,615 5.44 $30.28 0.5% 1,615 $30.28 0.5%
81

Potential dilution is computed by dividing the options in the related range of exercise prices by 306 millionshares of common stock, which were issued and outstanding as of March 31, 2018.
Restricted Stock Units
We grant restricted stock units under our Equity Plan to employees worldwide. Restricted stock units areunfunded, unsecured rights to receive common stock upon the satisfaction of certain vesting criteria. Uponvesting, a number of shares of common stock equivalent the number of restricted stock units is typically issuednet of required tax withholding requirements, if any. Restricted stock units are subject to forfeiture and transferrestrictions. Vesting for restricted stock units is based on the holders’ continued employment with us througheach applicable vest date. If the vesting conditions are not met, unvested restricted stock units will be forfeited.
Generally, our restricted stock units vest according to one of the following vesting schedules:
• One-year vesting with 100% cliff vesting at the end of one year;
• 35 month vesting with 1/3 vesting after 11, 23 and 35 months;
• Three-year vesting with 1/3 vesting at the end of each year;
• Four-year vesting with 1/2 and 1/2 vesting after 24 and 48 months or;
• Four-year vesting with 1/4 vesting at the end of each year.
Each restricted stock unit granted reduces the number of shares available for grant by 1.43 shares under ourEquity Plan. The following table summarizes our restricted stock units activity, excluding market-basedrestricted stock unit activity which is discussed below, for the fiscal year ended March 31, 2018:
RestrictedStock Units
(in thousands)
Weighted-Average Grant
Date Fair Values
Outstanding as of March 31, 2017 . . . . . . . . . . . . . . . . . . . . . . . . . . . . . . . . . . . . . . 5,153 $ 65.03Granted . . . . . . . . . . . . . . . . . . . . . . . . . . . . . . . . . . . . . . . . . . . . . . . . . . . . . . . . . 3,841 110.05Vested . . . . . . . . . . . . . . . . . . . . . . . . . . . . . . . . . . . . . . . . . . . . . . . . . . . . . . . . . . (2,581) 59.49Forfeited or cancelled . . . . . . . . . . . . . . . . . . . . . . . . . . . . . . . . . . . . . . . . . . . . . . (465) 80.97
Outstanding as of March 31, 2018 . . . . . . . . . . . . . . . . . . . . . . . . . . . . . . . . . . . . . . 5,948 $ 94.57
The grant date fair value of restricted stock units is based on the quoted market price of our common stock on thedate of grant. The weighted-average grant date fair values of restricted stock units granted during fiscal years2018, 2017, and 2016 were $110.05, $76.60 and $64.40 respectively. The fair values of restricted stock units thatvested during fiscal years 2018, 2017, and 2016 were $289 million, $320 million and $372 million, respectively.
Performance-Based Restricted Stock Units
Our performance-based restricted stock units cliff vest after a four-year performance period contingent upon theachievement of pre-determined performance-based milestones based on our non-GAAP net revenue and free cashflow as well as service conditions. If these performance-based milestones are not met but service conditions aremet, the performance-based restricted stock units will not vest, in which case any compensation expense we haverecognized to date will be reversed. Each quarter, we update our assessment of the probability that thenon-GAAP net revenue and free cash flow performance milestones will be achieved. We amortize the fair valuesof performance-based restricted stock units over the requisite service period. The performance-based restrictedstock units contain threshold, target and maximum milestones for each of non-GAAP net revenue and free cashflow. The number of shares of common stock to be issued at vesting will range from zero percent to 200 percentof the target number of performance-based restricted stock units attributable to each performance-basedmilestone based on the company’s performance as compared to these threshold, target and maximumperformance-based milestones. Each performance-based milestone is weighted evenly where 50 percent of thetotal performance-based restricted stock units that vest will be determined based on non-GAAP net revenue andthe other 50 percent will be determined based on free cash flow. The number of shares that vest based on eachperformance-based milestone is independent from the other.
82

An
nu
alRep
ort
The following table summarizes our performance-based restricted stock unit activity, presented with themaximum number of shares that could potentially vest, for the fiscal year ended March 31, 2018:
Performance-Based Restricted
Stock Units(in thousands)
Weighted-Average GrantDate Fair Value
Outstanding as of March 31, 2017 . . . . . . . . . . . . . . . . . . . . . . . . . . . . . . . . . . . . . — $ —Granted . . . . . . . . . . . . . . . . . . . . . . . . . . . . . . . . . . . . . . . . . . . . . . . . . . . . . . . . 796 110.51Forfeited or cancelled . . . . . . . . . . . . . . . . . . . . . . . . . . . . . . . . . . . . . . . . . . . . . — —
Outstanding as of March 31, 2018 . . . . . . . . . . . . . . . . . . . . . . . . . . . . . . . . . . . . . 796 $110.51
Market-Based Restricted Stock Units
Our market-based restricted stock units vest contingent upon the achievement of pre-determined market andservice conditions. If these market conditions are not met but service conditions are met, the market-basedrestricted stock units will not vest; however, any compensation expense we have recognized to date will not bereversed. The number of shares of common stock to be issued at vesting will range from zero percent to200 percent of the target number of market-based restricted stock units based on our total stockholder return(“TSR”) relative to the performance of companies in the NASDAQ-100 Index for each measurement period, overeither a one-year, two-year cumulative and three-year cumulative period, or over a two year and four-yearcumulative period.
The following table summarizes our market-based restricted stock unit activity, presented with the maximumnumber of shares that could potentially vest, for the year ended March 31, 2018:
Market-BasedRestricted Stock
Units(in thousands)
Weighted-Average GrantDate Fair Value
Outstanding as of March 31, 2017 . . . . . . . . . . . . . . . . . . . . . . . . . . . . . . . . . . . . . 1,282 $ 87.37Granted . . . . . . . . . . . . . . . . . . . . . . . . . . . . . . . . . . . . . . . . . . . . . . . . . . . . . . . . 706 140.93Vested . . . . . . . . . . . . . . . . . . . . . . . . . . . . . . . . . . . . . . . . . . . . . . . . . . . . . . . . . (430) 76.27Forfeited or cancelled . . . . . . . . . . . . . . . . . . . . . . . . . . . . . . . . . . . . . . . . . . . . . (216) 91.88
Outstanding as of March 31, 2018 . . . . . . . . . . . . . . . . . . . . . . . . . . . . . . . . . . . . . 1,342 $118.35
The weighted-average grant date fair values of market-based restricted stock units granted during fiscal years2018, 2017, and 2016 were $140.93, $98.04, and $79.81, respectively. The fair values of market-based restrictedstock units that vested during fiscal years 2018, 2017, and 2016 were $48 million, $42 million, and $47 million,respectively.
ESPP
Pursuant to our ESPP, eligible employees may authorize payroll deductions of between 2 percent and 10 percentof their compensation to purchase shares of common stock at 85 percent of the lower of the market price of ourcommon stock on the date of commencement of the applicable offering period or on the last day of eachsix-month purchase period.
The following table summarizes our ESPP activity for fiscal years ended March 31, 2018, 2017 and 2016:
SharesIssued
(in millions)
Exercise Pricesfor Purchase
Rights
Weighted-AverageFair Values of
Purchase Rights
Fiscal Year 2016 . . . . . . . . . . . . . . . . . . . . . . . . . . . . . . . . . . . . . 0.9 $32.16 - $54.78 $12.97Fiscal Year 2017 . . . . . . . . . . . . . . . . . . . . . . . . . . . . . . . . . . . . . 0.7 $54.60 - $67.56 $17.93Fiscal Year 2018 . . . . . . . . . . . . . . . . . . . . . . . . . . . . . . . . . . . . . 0.6 $67.56 - $99.82 $21.57
83

The fair values were estimated on the date of grant using the Black-Scholes valuation model. We issue newcommon stock out of the ESPP’s pool of authorized shares. As of March 31, 2018, 6.8 million shares wereavailable for grant under our ESPP.
Deferred Compensation Plan
We have a Deferred Compensation Plan (“DCP”) for the benefit of a select group of management or highlycompensated employees and directors, which is unfunded and intended to be a plan that is not qualified withinthe meaning of section 401(a) of the Internal Revenue Code. The DCP permits the deferral of the annual basesalary and/or director cash compensation up to a maximum amount. The deferrals are held in a separate trust,which has been established by us to administer the DCP. The trust is a grantor trust and the specific terms of thetrust agreement provide that the assets of the trust are available to satisfy the claims of general creditors in theevent of our insolvency. The assets held by the trust are classified as trading securities and are held at fair valueon our Consolidated Balance Sheets. The assets and liabilities of the DCP are presented in other assets and otherliabilities on our Consolidated Balance Sheets, respectively, with changes in the fair value of the assets and in thedeferred compensation liability recognized as compensation expense. The estimated fair value of the assets was$10 million and $8 million as of March 31, 2018 and 2017, respectively. As of March 31, 2018 and 2017,$11 million and $9 million were recorded, respectively, to recognize undistributed deferred compensation due toemployees.
401(k) Plan, Registered Retirement Savings Plan and ITP Plan
We have a 401(k) plan covering substantially all of our U.S. employees, a Registered Retirement Savings Plancovering substantially all of our Canadian employees, and an ITP pension plan covering substantially all ourSwedish employees. These plans permit us to make discretionary contributions to employees’ accounts based onour financial performance. We contributed an aggregate of $31 million, $28 million and $27 million to theseplans in fiscal years 2018, 2017, and 2016, respectively.
Stock Repurchase Program
In May 2014, a Special Committee of our Board of Directors, on behalf of the full Board of Directors, authorizeda two-year program to repurchase up to $750 million of our common stock. We have repurchased approximately9.2 million shares for approximately $394 million under this program. This program was superseded andreplaced by the stock repurchase program approved in May 2015.
In May 2015, our Board of Directors authorized a two-year program to repurchase up to $1 billion of ourcommon stock. We repurchased approximately 0.3 million, 6.5 million and 6.9 million shares for approximately$31 million, $508 million and $461 million under this program, respectively, during the fiscal years endedMarch 31, 2018, 2017 and 2016. We completed repurchases under the May 2015 program in April 2017.
In February 2016, our Board of Directors authorized a $500 million stock repurchase program. This program wasincremental to the two-year $1 billion stock repurchase program announced in May 2015. During the quarterended March 31, 2016, we completed repurchases of approximately 7.8 million shares for approximately$500 million under the February 2016 program.
In May 2017, a Special Committee of our Board of Directors, on behalf of the full Board of Directors, authorizeda program to repurchase up to $1.2 billion of our common stock. During the fiscal year ended March 31, 2018,we repurchased approximately 5.0 million shares for approximately $570 million under this program. Thisprogram was superseded and replaced by a new stock repurchase program approved in May 2018.
In May 2018, a Special Committee of our Board of Directors, on behalf of the full Board of Directors, authorizeda program to repurchase up to $2.4 billion of our common stock. This stock repurchase program supersedes andreplaces the May 2017 program, and expires on May 31, 2020. Under this program, we may purchase stock in theopen market or through privately-negotiated transactions in accordance with applicable securities laws, including
84
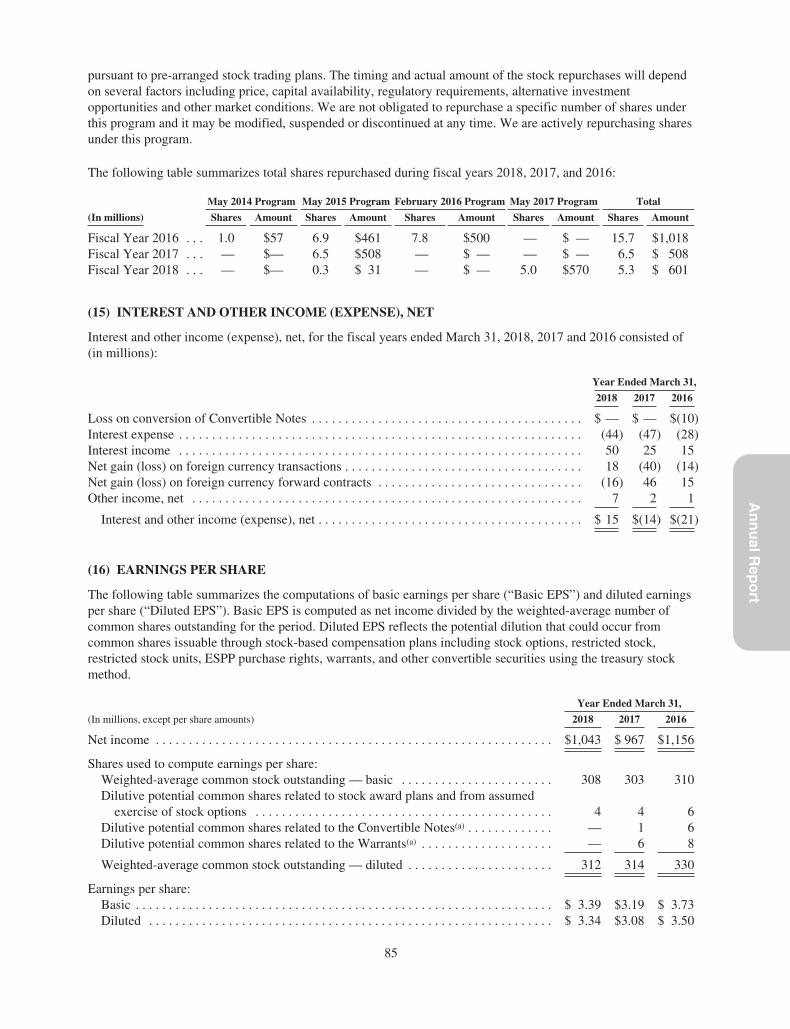
An
nu
alRep
ort
pursuant to pre-arranged stock trading plans. The timing and actual amount of the stock repurchases will dependon several factors including price, capital availability, regulatory requirements, alternative investmentopportunities and other market conditions. We are not obligated to repurchase a specific number of shares underthis program and it may be modified, suspended or discontinued at any time. We are actively repurchasing sharesunder this program.
The following table summarizes total shares repurchased during fiscal years 2018, 2017, and 2016:
May 2014 Program May 2015 Program February 2016 Program May 2017 Program Total
(In millions) Shares Amount Shares Amount Shares Amount Shares Amount Shares Amount
Fiscal Year 2016 . . . 1.0 $57 6.9 $461 7.8 $500 — $ — 15.7 $1,018Fiscal Year 2017 . . . — $— 6.5 $508 — $ — — $ — 6.5 $ 508Fiscal Year 2018 . . . — $— 0.3 $ 31 — $ — 5.0 $570 5.3 $ 601
(15) INTEREST AND OTHER INCOME (EXPENSE), NET
Interest and other income (expense), net, for the fiscal years ended March 31, 2018, 2017 and 2016 consisted of(in millions):
Year Ended March 31,
2018 2017 2016
Loss on conversion of Convertible Notes . . . . . . . . . . . . . . . . . . . . . . . . . . . . . . . . . . . . . . . . . $ — $ — $(10)Interest expense . . . . . . . . . . . . . . . . . . . . . . . . . . . . . . . . . . . . . . . . . . . . . . . . . . . . . . . . . . . . . (44) (47) (28)Interest income . . . . . . . . . . . . . . . . . . . . . . . . . . . . . . . . . . . . . . . . . . . . . . . . . . . . . . . . . . . . . 50 25 15Net gain (loss) on foreign currency transactions . . . . . . . . . . . . . . . . . . . . . . . . . . . . . . . . . . . . 18 (40) (14)Net gain (loss) on foreign currency forward contracts . . . . . . . . . . . . . . . . . . . . . . . . . . . . . . . (16) 46 15Other income, net . . . . . . . . . . . . . . . . . . . . . . . . . . . . . . . . . . . . . . . . . . . . . . . . . . . . . . . . . . . 7 2 1
Interest and other income (expense), net . . . . . . . . . . . . . . . . . . . . . . . . . . . . . . . . . . . . . . . . $ 15 $(14) $(21)
(16) EARNINGS PER SHARE
The following table summarizes the computations of basic earnings per share (“Basic EPS”) and diluted earningsper share (“Diluted EPS”). Basic EPS is computed as net income divided by the weighted-average number ofcommon shares outstanding for the period. Diluted EPS reflects the potential dilution that could occur fromcommon shares issuable through stock-based compensation plans including stock options, restricted stock,restricted stock units, ESPP purchase rights, warrants, and other convertible securities using the treasury stockmethod.
Year Ended March 31,
(In millions, except per share amounts) 2018 2017 2016
Net income . . . . . . . . . . . . . . . . . . . . . . . . . . . . . . . . . . . . . . . . . . . . . . . . . . . . . . . . . . . . $1,043 $ 967 $1,156
Shares used to compute earnings per share:Weighted-average common stock outstanding — basic . . . . . . . . . . . . . . . . . . . . . . . 308 303 310Dilutive potential common shares related to stock award plans and from assumed
exercise of stock options . . . . . . . . . . . . . . . . . . . . . . . . . . . . . . . . . . . . . . . . . . . . . 4 4 6Dilutive potential common shares related to the Convertible Notes(a) . . . . . . . . . . . . . — 1 6Dilutive potential common shares related to the Warrants(a) . . . . . . . . . . . . . . . . . . . . — 6 8
Weighted-average common stock outstanding — diluted . . . . . . . . . . . . . . . . . . . . . . 312 314 330
Earnings per share:Basic . . . . . . . . . . . . . . . . . . . . . . . . . . . . . . . . . . . . . . . . . . . . . . . . . . . . . . . . . . . . . . . $ 3.39 $3.19 $ 3.73Diluted . . . . . . . . . . . . . . . . . . . . . . . . . . . . . . . . . . . . . . . . . . . . . . . . . . . . . . . . . . . . . $ 3.34 $3.08 $ 3.50
85

(a) See Note 10 — Financing Arrangements in our Annual Report on Form 10-K for the fiscal year endedMarch 31, 2017, for additional information regarding the potential dilutive shares related to our ConvertibleNotes and Warrants. The Convertible Notes matured on July 15, 2016 and the Warrants expired onJanuary 12, 2017.
For the fiscal years ended March 31, 2018, 2017 and 2016, an immaterial amount of restricted stock units andmarket-based restricted stock units were excluded from the treasury stock method computation of diluted sharesas their inclusion would have had an antidilutive effect. Our performance-based restricted stock units, which areconsidered contingently issuable shares, are also excluded from the treasury stock method computation becausethe related performance-based milestones were not achieved as of the end of the reporting period.
(17) SEGMENT INFORMATION
Our reporting segment is based upon: our internal organizational structure; the manner in which our operationsare managed; the criteria used by our Chief Executive Officer, our Chief Operating Decision Maker (“CODM”),to evaluate segment performance; the availability of separate financial information; and overall materialityconsiderations. Our CODM currently reviews total company operating results to assess overall performance andallocate resources. As of March 31, 2018, we have only one reportable segment, which represents our onlyoperating segment.
Information about our total net revenue by type and by platform for the fiscal years ended March 31, 2018, 2017and 2016 is presented below (in millions):
Year Ended March 31,
2018 2017 2016
Digital . . . . . . . . . . . . . . . . . . . . . . . . . . . . . . . . . . . . . . . . . . . . . . . . . . . . . . . . . . . . . . . $3,450 $2,874 $2,409Packaged goods and other . . . . . . . . . . . . . . . . . . . . . . . . . . . . . . . . . . . . . . . . . . . . . . . 1,700 1,971 1,987
Net revenue . . . . . . . . . . . . . . . . . . . . . . . . . . . . . . . . . . . . . . . . . . . . . . . . . . . . . . . . $5,150 $4,845 $4,396
Digital net revenue includes full-game downloads, live services, and mobile revenue. Digital net revenueincludes game software distributed through our direct-to-consumer PC platform Origin, distributed wirelesslythrough mobile carriers, or licensed to our third-party publishing partners who distribute our games digitally.
Packaged goods and other net revenue includes revenue from software that is sold physically. This includes(1) net revenue from game software sold physically through traditional channels such as brick and mortarretailers, and (2) our software licensing revenue from third parties (for example, makers of console platforms,personal computers or computer accessories) who include certain of our products for sale with their products(“OEM bundles”). Other revenue includes our non-software licensing revenue.
Year Ended March 31,
2018 2017 2016
Platform net revenueXbox One, PlayStation 4, Switch . . . . . . . . . . . . . . . . . . . . . . . . . . . . . . . . . . . . . . . . $3,495 $3,056 $2,183Other consoles . . . . . . . . . . . . . . . . . . . . . . . . . . . . . . . . . . . . . . . . . . . . . . . . . . . . . . 140 334 759
Total consoles . . . . . . . . . . . . . . . . . . . . . . . . . . . . . . . . . . . . . . . . . . . . . . . . . . . . . 3,635 3,390 2,942PC / Browser . . . . . . . . . . . . . . . . . . . . . . . . . . . . . . . . . . . . . . . . . . . . . . . . . . . . . . . 827 773 814Mobile . . . . . . . . . . . . . . . . . . . . . . . . . . . . . . . . . . . . . . . . . . . . . . . . . . . . . . . . . . . . 672 627 548Other . . . . . . . . . . . . . . . . . . . . . . . . . . . . . . . . . . . . . . . . . . . . . . . . . . . . . . . . . . . . . . 16 55 92
Net revenue . . . . . . . . . . . . . . . . . . . . . . . . . . . . . . . . . . . . . . . . . . . . . . . . . . . . . . $5,150 $4,845 $4,396
86

An
nu
alRep
ort
Information about our operations in North America and internationally as of and for the fiscal years endedMarch 31, 2018, 2017 and 2016 is presented below (in millions):
Year Ended March 31,
2018 2017 2016
Net revenue from unaffiliated customersNorth America . . . . . . . . . . . . . . . . . . . . . . . . . . . . . . . . . . . . . . . . . . . . . . . . . . . . . . $2,090 $2,119 $1,907International . . . . . . . . . . . . . . . . . . . . . . . . . . . . . . . . . . . . . . . . . . . . . . . . . . . . . . . . 3,060 2,726 2,489
Total . . . . . . . . . . . . . . . . . . . . . . . . . . . . . . . . . . . . . . . . . . . . . . . . . . . . . . . . . . . . $5,150 $4,845 $4,396
As of March 31,
2018 2017
Long-lived assetsNorth America . . . . . . . . . . . . . . . . . . . . . . . . . . . . . . . . . . . . . . . . . . . . . . . . . . . . . . . . . . . . . . . $376 $369International . . . . . . . . . . . . . . . . . . . . . . . . . . . . . . . . . . . . . . . . . . . . . . . . . . . . . . . . . . . . . . . . . 77 65
Total . . . . . . . . . . . . . . . . . . . . . . . . . . . . . . . . . . . . . . . . . . . . . . . . . . . . . . . . . . . . . . . . . . . . . $453 $434
We attribute net revenue from external customers to individual countries based on the location of the legal entitythat sells the products and/or services. Note that revenue attributed to the legal entity that makes the sale is oftennot the country where the consumer resides. For example, revenue generated by our Swiss legal entities includesdigital revenue from consumers who reside outside of Switzerland, including consumers who reside outside ofEurope. Revenue generated by our Swiss legal entities during fiscal years 2018, 2017, and 2016 represents$2,272 million, $1,886 million and $1,643 million or 44 percent, 39 percent and 37 percent of our total netrevenue, respectively. Revenue generated in the United States represents over 99 percent of our total NorthAmerica net revenue. There were no other countries with net revenue greater than 10 percent.
In fiscal year 2018, our direct sales to Sony and Microsoft represented approximately 27 percent and 16 percentof total net revenue, respectively. In fiscal year 2017, our direct sales to Sony and Microsoft representedapproximately 19 percent and 17 percent of total net revenue, respectively. In fiscal 2016, our direct sales toSony and Microsoft represented approximately 16 percent and 14 percent of total net revenue, respectively.
87

(18) QUARTERLY FINANCIAL AND MARKET INFORMATION (UNAUDITED)
Quarter Ended YearEnded(In millions, except per share data) June 30 September 30 December 31 March 31
Fiscal 2018 ConsolidatedNet revenue . . . . . . . . . . . . . . . . . . . . . . . . . . . . . . . . . $ 1,449 $ 959 $ 1,160 $ 1,582 $ 5,150Gross profit . . . . . . . . . . . . . . . . . . . . . . . . . . . . . . . . . 1,295 570 659 1,349 3,873Operating income (loss) . . . . . . . . . . . . . . . . . . . . . . . 743 (41) (21) 753 1,434Net income (loss) . . . . . . . . . . . . . . . . . . . . . . . . . . . . . 644 (22) (186)(a) 607(a) 1,043
Common StockEarnings (loss) per share — Basic . . . . . . . . . . . . . . . $ 2.08 $ (0.07) $ (0.60) $ 1.98 $ 3.39Earnings (loss) per share — Diluted . . . . . . . . . . . . . . $ 2.06 $ (0.07) $ (0.60) $ 1.95 $ 3.34Common stock price per share
High . . . . . . . . . . . . . . . . . . . . . . . . . . . . . . . . . . . . . $115.37 $121.97 $120.09 $129.12 $129.12Low . . . . . . . . . . . . . . . . . . . . . . . . . . . . . . . . . . . . . $ 88.40 $105.42 $100.83 $107.19 $ 88.40
Fiscal 2017 ConsolidatedNet revenue . . . . . . . . . . . . . . . . . . . . . . . . . . . . . . . . . $ 1,271 $ 898 $ 1,149 $ 1,527 $ 4,845Gross profit . . . . . . . . . . . . . . . . . . . . . . . . . . . . . . . . . 1,092 497 633 1,325 3,547Operating income (loss) . . . . . . . . . . . . . . . . . . . . . . . 560 (49) (4) 717 1,224Net income (loss) . . . . . . . . . . . . . . . . . . . . . . . . . . . . . 440 (38) (1) 566 967
Common StockEarnings (loss) per share — Basic . . . . . . . . . . . . . . . $ 1.46 $ (0.13) $ (0.00) $ 1.84 $ 3.19Earnings (loss) per share — Diluted . . . . . . . . . . . . . . $ 1.40 $ (0.13) $ (0.00) $ 1.81 $ 3.08Common stock price per share
High . . . . . . . . . . . . . . . . . . . . . . . . . . . . . . . . . . . . . $ 77.25 $ 85.40 $ 85.56 $ 91.51 $ 91.51Low . . . . . . . . . . . . . . . . . . . . . . . . . . . . . . . . . . . . . $ 61.85 $ 75.38 $ 75.58 $ 78.64 $ 61.85
(a) During the quarters ended December 31, 2017 and March 31, 2018, EA recognized a provisional taxexpense due to the application of the U.S. Tax Act, enacted on December 22, 2017.
Our common stock is traded on the NASDAQ Global Select Market under the symbol “EA”. The prices for thecommon stock in the table above represent the high and low closing sales prices as reported on the NASDAQGlobal Select Market.
88
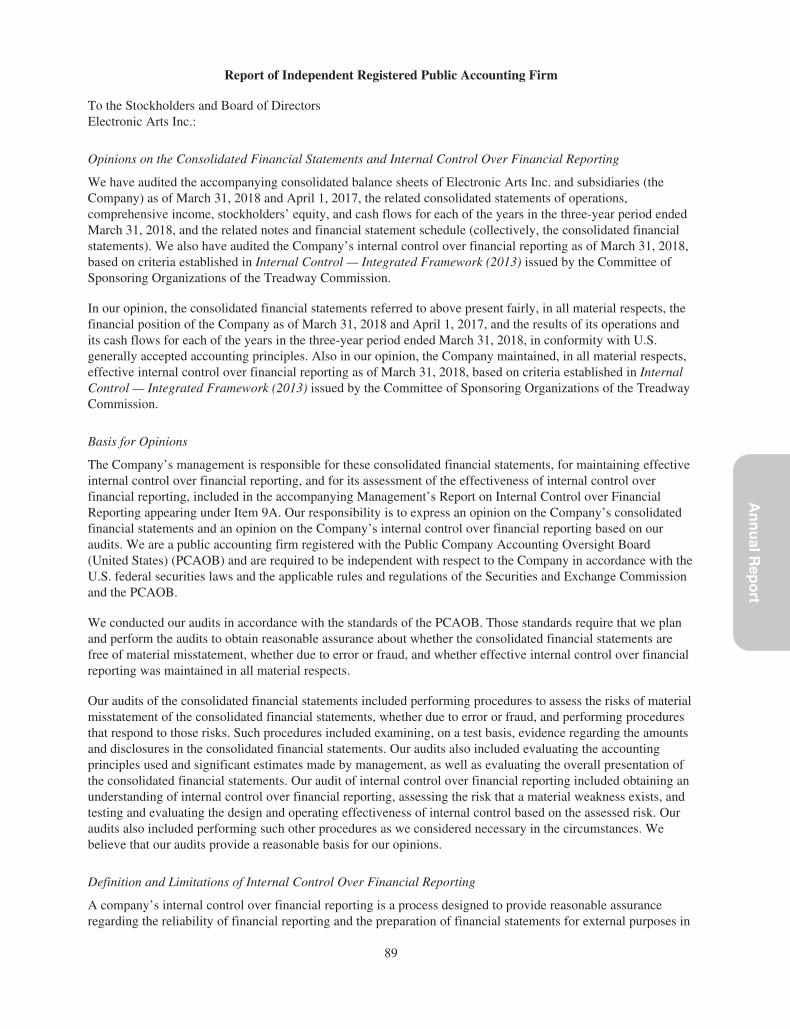
An
nu
alRep
ort
Report of Independent Registered Public Accounting Firm
To the Stockholders and Board of DirectorsElectronic Arts Inc.:
Opinions on the Consolidated Financial Statements and Internal Control Over Financial Reporting
We have audited the accompanying consolidated balance sheets of Electronic Arts Inc. and subsidiaries (theCompany) as of March 31, 2018 and April 1, 2017, the related consolidated statements of operations,comprehensive income, stockholders’ equity, and cash flows for each of the years in the three-year period endedMarch 31, 2018, and the related notes and financial statement schedule (collectively, the consolidated financialstatements). We also have audited the Company’s internal control over financial reporting as of March 31, 2018,based on criteria established in Internal Control — Integrated Framework (2013) issued by the Committee ofSponsoring Organizations of the Treadway Commission.
In our opinion, the consolidated financial statements referred to above present fairly, in all material respects, thefinancial position of the Company as of March 31, 2018 and April 1, 2017, and the results of its operations andits cash flows for each of the years in the three-year period ended March 31, 2018, in conformity with U.S.generally accepted accounting principles. Also in our opinion, the Company maintained, in all material respects,effective internal control over financial reporting as of March 31, 2018, based on criteria established in InternalControl — Integrated Framework (2013) issued by the Committee of Sponsoring Organizations of the TreadwayCommission.
Basis for Opinions
The Company’s management is responsible for these consolidated financial statements, for maintaining effectiveinternal control over financial reporting, and for its assessment of the effectiveness of internal control overfinancial reporting, included in the accompanying Management’s Report on Internal Control over FinancialReporting appearing under Item 9A. Our responsibility is to express an opinion on the Company’s consolidatedfinancial statements and an opinion on the Company’s internal control over financial reporting based on ouraudits. We are a public accounting firm registered with the Public Company Accounting Oversight Board(United States) (PCAOB) and are required to be independent with respect to the Company in accordance with theU.S. federal securities laws and the applicable rules and regulations of the Securities and Exchange Commissionand the PCAOB.
We conducted our audits in accordance with the standards of the PCAOB. Those standards require that we planand perform the audits to obtain reasonable assurance about whether the consolidated financial statements arefree of material misstatement, whether due to error or fraud, and whether effective internal control over financialreporting was maintained in all material respects.
Our audits of the consolidated financial statements included performing procedures to assess the risks of materialmisstatement of the consolidated financial statements, whether due to error or fraud, and performing proceduresthat respond to those risks. Such procedures included examining, on a test basis, evidence regarding the amountsand disclosures in the consolidated financial statements. Our audits also included evaluating the accountingprinciples used and significant estimates made by management, as well as evaluating the overall presentation ofthe consolidated financial statements. Our audit of internal control over financial reporting included obtaining anunderstanding of internal control over financial reporting, assessing the risk that a material weakness exists, andtesting and evaluating the design and operating effectiveness of internal control based on the assessed risk. Ouraudits also included performing such other procedures as we considered necessary in the circumstances. Webelieve that our audits provide a reasonable basis for our opinions.
Definition and Limitations of Internal Control Over Financial Reporting
A company’s internal control over financial reporting is a process designed to provide reasonable assuranceregarding the reliability of financial reporting and the preparation of financial statements for external purposes in
89

accordance with generally accepted accounting principles. A company’s internal control over financial reportingincludes those policies and procedures that (1) pertain to the maintenance of records that, in reasonable detail,accurately and fairly reflect the transactions and dispositions of the assets of the company; (2) provide reasonableassurance that transactions are recorded as necessary to permit preparation of financial statements in accordancewith generally accepted accounting principles, and that receipts and expenditures of the company are being madeonly in accordance with authorizations of management and directors of the company; and (3) provide reasonableassurance regarding prevention or timely detection of unauthorized acquisition, use, or disposition of thecompany’s assets that could have a material effect on the financial statements.
Because of its inherent limitations, internal control over financial reporting may not prevent or detectmisstatements. Also, projections of any evaluation of effectiveness to future periods are subject to the risk thatcontrols may become inadequate because of changes in conditions, or that the degree of compliance with thepolicies or procedures may deteriorate.
/s/ KPMG LLP
We have served as the Company’s auditor since 1987.
Santa Clara, CaliforniaMay 23, 2018
90
An
nu
alRep
ort
Item 9: Changes in and Disagreements with Accountants on Accounting and Financial Disclosure
Not applicable.
Item 9A: Controls and Procedures
Definition and Limitations of Disclosure Controls
Our disclosure controls and procedures (as defined in Rules 13a-15(e) and 15d-15(e) under the Exchange Act)are controls and other procedures that are designed to ensure that information required to be disclosed in ourreports filed under the Exchange Act, such as this report, is recorded, processed, summarized and reported withinthe time periods specified in the SEC’s rules and forms. Disclosure controls and procedures are also designed toensure that such information is accumulated and communicated to our management, including the ChiefExecutive Officer and Chief Financial Officer, as appropriate to allow timely decisions regarding requireddisclosure. Our management evaluates these controls and procedures on an ongoing basis.
There are inherent limitations to the effectiveness of any system of disclosure controls and procedures. Theselimitations include the possibility of human error, the circumvention or overriding of the controls and proceduresand reasonable resource constraints. In addition, because we have designed our system of controls based oncertain assumptions, which we believe are reasonable, about the likelihood of future events, our system ofcontrols may not achieve its desired purpose under all possible future conditions. Accordingly, our disclosurecontrols and procedures provide reasonable assurance, but not absolute assurance, of achieving their objectives.
Evaluation of Disclosure Controls and Procedures
Our Chief Executive Officer and our Chief Financial Officer, after evaluating the effectiveness of our disclosurecontrols and procedures, believe that as of the end of the period covered by this report, our disclosure controlsand procedures were effective in providing the requisite reasonable assurance that material information requiredto be disclosed in the reports that we file or submit under the Exchange Act is recorded, processed, summarizedand reported within the time periods specified in the SEC’s rules and forms, and is accumulated andcommunicated to our management, including our Chief Executive Officer and Chief Financial Officer, asappropriate to allow timely decisions regarding the required disclosure.
Management’s Report on Internal Control over Financial Reporting
Our management is responsible for establishing and maintaining adequate internal control over financialreporting, as defined in Rules 13a-15(f) and 15d-15(f) under the Exchange Act.
Our internal control over financial reporting is designed to provide reasonable, but not absolute, assuranceregarding the reliability of financial reporting and the preparation of financial statements in accordance withgenerally accepted accounting principles. There are inherent limitations to the effectiveness of any system ofinternal control over financial reporting. These limitations include the possibility of human error, thecircumvention or overriding of the system and reasonable resource constraints. Because of its inherentlimitations, our internal control over financial reporting may not prevent or detect misstatements. Projections ofany evaluation of effectiveness to future periods are subject to the risks that controls may become inadequatebecause of changes in conditions, or that the degree of compliance with our policies or procedures maydeteriorate.
Our management assessed the effectiveness of our internal control over financial reporting as of the end of ourmost recently completed fiscal year. In making its assessment, management used the criteria set forth in InternalControl-Integrated Framework (2013), issued by the Committee of Sponsoring Organizations of the TreadwayCommission (COSO). Based on this assessment, our management believes that, as of the end of our mostrecently completed fiscal year, our internal control over financial reporting was effective.
KPMG LLP, our independent registered public accounting firm, has issued an auditors’ report on theeffectiveness of our internal control over financial reporting. That report appears on page 89.
91

Changes in Internal Control over Financial Reporting
There has been no change in our internal controls over financial reporting identified in connection with ourevaluation that occurred during the fiscal quarter ended March 31, 2018 that has materially affected, or isreasonably likely to materially affect, our internal control over financial reporting.
Item 9B: Other Information
None.
92
An
nu
alRep
ort
PART III
Item 10: Directors, Executive Officers and Corporate Governance
The information required by Item 10, other than the information regarding executive officers, which is includedin Part I, Item 1 of this report, is incorporated herein by reference to the information to be included in our 2018Proxy under the heading “Board of Directors & Corporate Governance.” The information regarding compliancewith Section 16(a) of the Exchange Act is incorporated herein by reference to the information to be included inthe 2018 Proxy under the sub-heading “Section 16(a) Beneficial Ownership Reporting Compliance.”
Item 11: Executive Compensation
The information required by Item 11 is incorporated herein by reference to the information to be included in the2018 Proxy under the headings “Director Compensation and Stock Ownership Guidelines” and “CompensationDiscussion and Analysis” and “Executive Compensation” and the subheadings “Committee Report on ExecutiveCompensation” and “Compensation Committee Interlocks and Insider Participation.”
Item 12: Security Ownership of Certain Beneficial Owners and Management and Related StockholderMatters
The information required by Item 12 is incorporated herein by reference to the information to be included in the2018 Proxy under the heading “Security Ownership of Certain Beneficial Owners and Management” and thesubheading “Equity Compensation Plan Information.”
Item 13: Certain Relationships and Related Transactions, and Director Independence
The information required by Item 13 is incorporated herein by reference to the information to be included in the2018 Proxy under the subheadings “Director Independence,” “Related Person Transaction Policy” and “CertainRelationships and Related Person Transactions.”
Item 14: Principal Accounting Fees and Services
The information required by Item 14 is incorporated herein by reference to the information to be included inProposal 3 of the 2018 Proxy under the sub-headings “Fees of Independent Auditors” and “Pre-approvalProcedures.”
PART IV
Item 15: Exhibits, Financial Statement Schedules
(a) Documents filed as part of this report
1. Financial Statements: See Index to Consolidated Financial Statements under Item 8 on Page 46 of this report.
2. Financial Statement Schedule: See Schedule II on Page 94 of this report.
3. Exhibits: The exhibits listed in the accompanying index to exhibits on Page 95 are filed or incorporated byreference as part of this report.
93
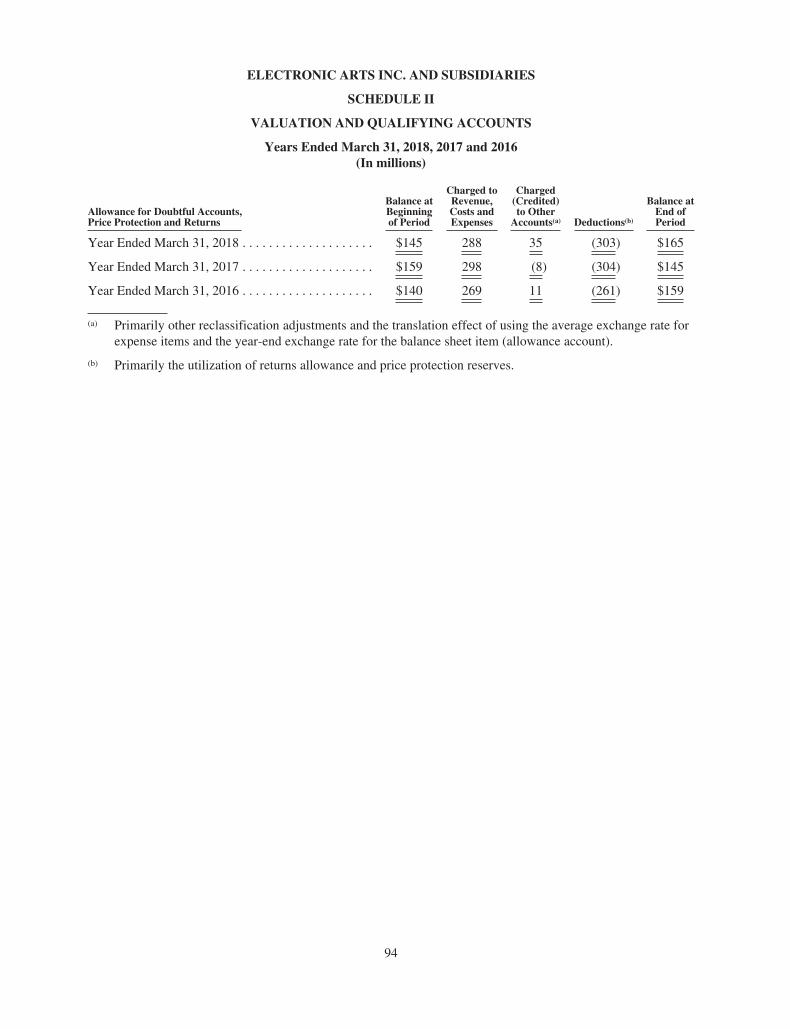
ELECTRONIC ARTS INC. AND SUBSIDIARIES
SCHEDULE II
VALUATION AND QUALIFYING ACCOUNTS
Years Ended March 31, 2018, 2017 and 2016(In millions)
Allowance for Doubtful Accounts,Price Protection and Returns
Balance atBeginningof Period
Charged toRevenue,Costs andExpenses
Charged(Credited)to Other
Accounts(a) Deductions(b)
Balance atEnd ofPeriod
Year Ended March 31, 2018 . . . . . . . . . . . . . . . . . . . . $145 288 35 (303) $165
Year Ended March 31, 2017 . . . . . . . . . . . . . . . . . . . . $159 298 (8) (304) $145
Year Ended March 31, 2016 . . . . . . . . . . . . . . . . . . . . $140 269 11 (261) $159
(a) Primarily other reclassification adjustments and the translation effect of using the average exchange rate forexpense items and the year-end exchange rate for the balance sheet item (allowance account).
(b) Primarily the utilization of returns allowance and price protection reserves.
94
An
nu
alRep
ort
ELECTRONIC ARTS INC.
2018 FORM 10-K ANNUAL REPORT
EXHIBIT INDEX
Incorporated by Reference FiledHerewithNumber Exhibit Title Form File No. Filing Date
3.01 Amended and Restated Certificate of Incorporation 10-Q 000-17948 11/3/2004
3.02 Amended and Restated Bylaws 8-K/A 000-17948 5/27/2016
4.01 Specimen Certificate of Registrant’s Common Stock 10-Q 000-17948 2/6/2018
4.02 Indenture, dated as of February 24, 2016 by andbetween Electronic Arts Inc. and U.S. Bank NationalAssociation, as Trustee
8-K 000-17948 2/24/2016
4.03 First Supplemental Indenture, dated as ofFebruary 24, 2016, between Electronic Arts Inc. andU.S. Bank National Association, as Trustee
8-K 000-17948 2/24/2016
10.01* Form of Indemnity Agreement with Directors 10-K 000-17948 6/4/2004
10.02* Electronic Arts Inc. Executive Bonus Plan 8-K 000-17948 5/18/2018
10.03* Electronic Arts Inc. Deferred Compensation Plan 10-Q 000-17948 8/6/2007
10.04* Electronic Arts Inc. Change in Control Plan 8-K 000-17948 5/18/2018
10.05* First Amendment to the Electronic Arts DeferredCompensation Plan, as amended and restated
10-K 000-17948 5/22/2009
10.06* EA Bonus Plan 8-K 000-17948 5/18/2018
10.07* Form of 2016 Performance-Based Restricted StockUnit Agreement
8-K 000-17948 5/23/2016
10.08* Form of 2017 Performance-Based Restricted StockUnit Agreement
8-K 000-17948 5/22/2017
10.09* Form of 2018 Performance-Based Restricted StockUnit Agreement
8-K 000-17948 5/18/2018
10.10* Form of 2017 Performance-Based IncrementalRestricted Stock Unit Agreement
8-K 000-17948 6/7/2017
10.11* Form of 2017 Supplemental Performance-BasedRestricted Stock Unit Agreement
8-K 000-17948 6/7/2017
10.12* Form of Restricted Stock Unit Award Agreement forOutside Directors
10-Q 000-17948 11/7/2017
10.13* 2000 Equity Incentive Plan, as amended, and relateddocuments
8-K 000-17948 8/1/2016
10.14* 2000 Employee Stock Purchase Plan, as amended 8-K 000-17948 8/1/2016
10.15* Offer Letter for Employment at Electronic Arts Inc.to Andrew Wilson, dated September 15, 2013
8-K 000-17948 9/17/2013
10.16* Offer Letter for Employment at Electronic Arts Inc.to Blake Jorgensen, dated July 25, 2012
8-K 000-17948 7/31/2012
95

Incorporated by Reference FiledHerewithNumber Exhibit Title Form File No. Filing Date
10.17* Offer Letter for Employment at Electronic Arts Inc.to Ken Moss, dated June 6, 2014
10-Q 000-17948 8/5/2014
10.18* Offer Letter for Employment at Electronic Arts Inc.to Chris Bruzzo, dated July 21, 2014
10-Q 000-17948 11/4/2014
10.19* Offer Letter for Employment at Electronic Arts Inc.to Mala Singh, dated August 27, 2016
10-Q 000-17948 11/8/2016
10.20* Employment Agreement for Patrick Söderlund, datedSeptember 17, 2013
10-Q 000-17948 11/5/2013
10.21 Lease Agreement between ASP WT, L.L.C.(“Landlord”) and Tiburon Entertainment, Inc. forspace at Summit Park I, dated June 15, 2004
10-Q 000-17948 8/3/2004
10.22 First Amendment to Lease, dated December 13,2005, by and between Liberty Property LimitedPartnership, a Pennsylvania limited partnership andElectronic Arts —Tiburon, a Florida corporation f/k/a Tiburon Entertainment, Inc.
10-Q 000-17948 2/8/2006
10.23 Second Amendment to Lease, dated May 8, 2009, byand between Liberty Property Limited Partnership, aPennsylvania limited partnership and ElectronicArts —Tiburon, a Florida corporation f/k/a TiburonEntertainment, Inc.
10-Q 000-17948 8/10/2009
10.24 Third Amendment to Lease, dated December 24,2009, by and between Liberty Property LimitedPartnership, a Pennsylvania limited partnership andElectronic Arts —Tiburon, a Florida corporation f/k/a Tiburon Entertainment, Inc.
10-Q 000-17948 2/9/2010
10.25 Fourth Amendment to Lease, dated May 16, 2014, byand between Liberty Property Limited Partnership, aPennsylvania limited partnership and ElectronicArts —Tiburon, a Florida corporation f/k/a TiburonEntertainment, Inc.
10-K 000-17948 5/21/2014
10.26** First Amended North American Territory Rider tothe Global PlayStation®3 Format Licensed PublisherAgreement, dated September 11, 2008, by andbetween Electronic Arts Inc. and Sony ComputerEntertainment America Inc.
10-Q 000-17948 11/10/2009
10.27** Sony Computer Entertainment Europe LimitedRegional Rider to the Global PlayStation®3 FormatLicensed Publisher Agreement, dated December 17,2008, by and between EA International (Studio andPublishing) Limited and Sony ComputerEntertainment Europe Limited
10-Q 000-17948 11/10/2009
10.28** Global PlayStation®3 Format Licensed PublisherAgreement, dated September 11, 2008, by andbetween Electronic Arts Inc. and Sony ComputerEntertainment America Inc.
10-Q/A 000-17948 4/30/2010
96
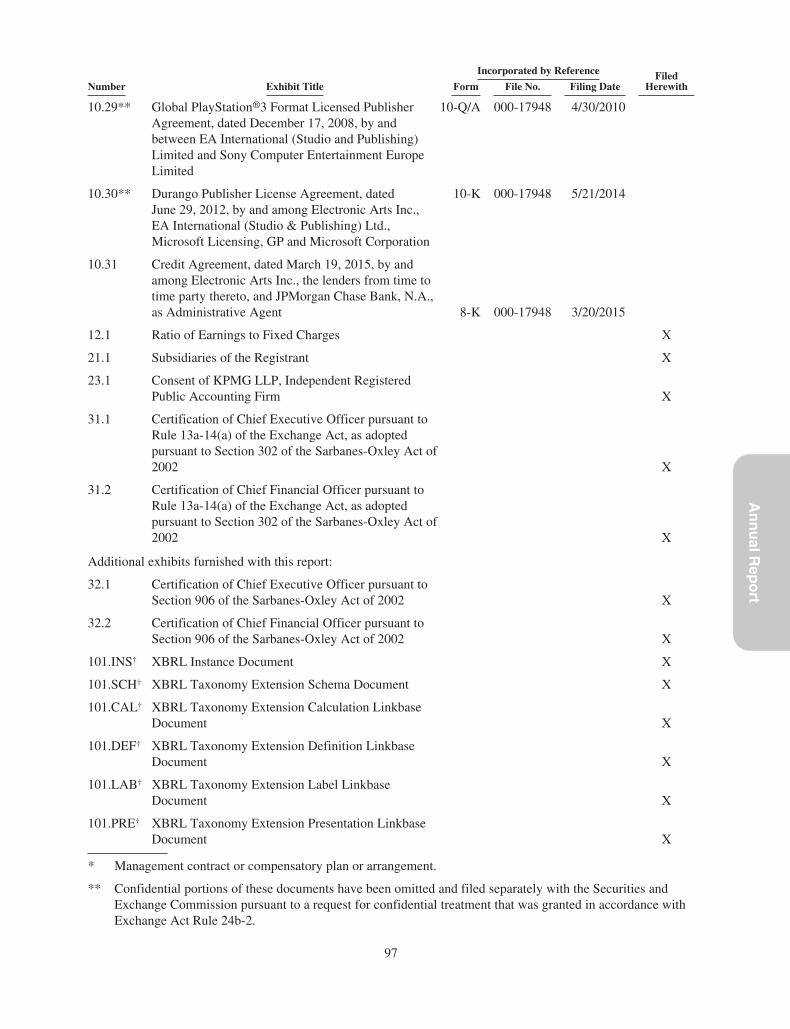
An
nu
alRep
ort
Incorporated by Reference FiledHerewithNumber Exhibit Title Form File No. Filing Date
10.29** Global PlayStation®3 Format Licensed PublisherAgreement, dated December 17, 2008, by andbetween EA International (Studio and Publishing)Limited and Sony Computer Entertainment EuropeLimited
10-Q/A 000-17948 4/30/2010
10.30** Durango Publisher License Agreement, datedJune 29, 2012, by and among Electronic Arts Inc.,EA International (Studio & Publishing) Ltd.,Microsoft Licensing, GP and Microsoft Corporation
10-K 000-17948 5/21/2014
10.31 Credit Agreement, dated March 19, 2015, by andamong Electronic Arts Inc., the lenders from time totime party thereto, and JPMorgan Chase Bank, N.A.,as Administrative Agent 8-K 000-17948 3/20/2015
12.1 Ratio of Earnings to Fixed Charges X
21.1 Subsidiaries of the Registrant X
23.1 Consent of KPMG LLP, Independent RegisteredPublic Accounting Firm X
31.1 Certification of Chief Executive Officer pursuant toRule 13a-14(a) of the Exchange Act, as adoptedpursuant to Section 302 of the Sarbanes-Oxley Act of2002 X
31.2 Certification of Chief Financial Officer pursuant toRule 13a-14(a) of the Exchange Act, as adoptedpursuant to Section 302 of the Sarbanes-Oxley Act of2002 X
Additional exhibits furnished with this report:
32.1 Certification of Chief Executive Officer pursuant toSection 906 of the Sarbanes-Oxley Act of 2002 X
32.2 Certification of Chief Financial Officer pursuant toSection 906 of the Sarbanes-Oxley Act of 2002 X
101.INS† XBRL Instance Document X
101.SCH† XBRL Taxonomy Extension Schema Document X
101.CAL† XBRL Taxonomy Extension Calculation LinkbaseDocument X
101.DEF† XBRL Taxonomy Extension Definition LinkbaseDocument X
101.LAB† XBRL Taxonomy Extension Label LinkbaseDocument X
101.PRE† XBRL Taxonomy Extension Presentation LinkbaseDocument X
* Management contract or compensatory plan or arrangement.
** Confidential portions of these documents have been omitted and filed separately with the Securities andExchange Commission pursuant to a request for confidential treatment that was granted in accordance withExchange Act Rule 24b-2.
97

† Attached as Exhibit 101 to this Annual Report on Form 10-K for the year ended March 31, 2017 are thefollowing formatted in eXtensible Business Reporting Language (“XBRL”): (1) Consolidated BalanceSheets, (2) Consolidated Statements of Operations, (3) Consolidated Statements of Comprehensive Income(Loss), (4) Consolidated Statements of Stockholders’ Equity, (5) Consolidated Statements of Cash Flows,and (6) Notes to Consolidated Financial Statements.
98

An
nu
alRep
ort
SIGNATURES
Pursuant to the requirements of Section 13 or 15(d) of the Securities Exchange Act of 1934, the Registrant hasduly caused this report to be signed on its behalf by the undersigned, thereunto duly authorized.
ELECTRONIC ARTS INC.
By: /s/ Andrew Wilson
Andrew WilsonChief Executive OfficerDate: May 23, 2018
Pursuant to the requirements of the Securities Exchange Act of 1934, this report has been signed below by thefollowing persons on behalf of the Registrant and in the capacities indicated and on the 23rd of May 2018.
Name Title
/s/ Andrew Wilson Chief Executive OfficerAndrew Wilson
/s/ Blake Jorgensen Chief Operating Officer andBlake Jorgensen Chief Financial Officer
/s/ Kenneth A. Barker Chief Accounting OfficerKenneth A. Barker (Principal Accounting Officer)
Directors:
/s/ Lawrence F. Probst III Chairman of the BoardLawrence F. Probst III
/s/ Leonard S. Coleman DirectorLeonard S. Coleman
/s/ Jay C. Hoag DirectorJay C. Hoag
/s/ Jeffrey T. Huber DirectorJeffrey T. Huber
/s/ Vivek Paul DirectorVivek Paul
/s/ Talbott Roche DirectorTalbott Roche
/s/ Richard A. Simonson DirectorRichard A. Simonson
/s/ Luis A. Ubiñas DirectorLuis A. Ubiñas
/s/ Heidi Ueberroth DirectorHeidi Ueberroth
/s/ Denise F. Warren DirectorDenise F. Warren
/s/ Andrew Wilson DirectorAndrew Wilson
99

Electronic Arts Inc.
209 Redwood Shores ParkwayRedwood City, CA 94065
(650) 628-1500www.ea.com
Investor Relations(650) 628-0406
http://investor.ea.com