electromagnetic control of fluid flow in the mold
TRANSCRIPT

ANNUAL REPORT 2007Meeting date: June 12, 2007
Kevin Cukierski (M.S. Student) &Brian G. Thomas
Department of Mechanical Science and EngineeringUniversity of Illinois at Urbana-Champaign
Electromagnetic Control of Fluid Flow in the Mold
University of Illinois at Urbana-Champaign • Metals Processing Simulation Lab • K. Cukierski 2
The Continuous Casting Process
B.G. Thomas. “Overview of the Continuous Casting Process”

University of Illinois at Urbana-Champaign • Metals Processing Simulation Lab • K. Cukierski 3
•Improve control of fluid flow in the mold•Stabilize meniscus velocity•Maintain a uniform mold level•Reduce fluctuations in meniscus profile•Reduce particle capture (i.e. bubbles, powder)
•Improve internal microstructure•Control superheat•Discourage columnar grain formation•Reduce centerline segregation
Why Add Electromagnetics?
AC Electromagnetic Stirrer
DC Electromagnetic Brake
•Two main types of electromagnetics•Electromagnetic stirrers
•Use constantly varying AC current•Electromagnetic brakes
•Use constant DC current•Focus of this project
Hackl et al, ABB Automation Technologies
Trippelsdorf et al, International Scientific Colloquium,
University of Illinois at Urbana-Champaign • Metals Processing Simulation Lab • K. Cukierski 4
Project Outline
•Objective
•Discover how and why an electromagnetic brake affects steel flow in the continuous casting mold
•Three phases to the project
•Experimental (in collaboration with Nucor Steel Decatur)
•EMBr measurement, nail board samples, and oscillation mark photos
•Computational Modeling
•Solve 3D Navier-Stokes Equations with FLUENT for flow in Nucor nozzle and mold with/without EMBr with 3 submergence depths
•Validation
•Compare computational results with experimental measurements

University of Illinois at Urbana-Champaign • Metals Processing Simulation Lab • K. Cukierski 5
Project Outline
•Objective
•Discover how and why an electromagnetic brake affects steel flow in the continuous casting mold
•Three phases to the project
•Experimental (in collaboration with Nucor Steel Decatur)
•EMBr measurement, nail board samples, and oscillation mark photos
•Computational Modeling
•Solve 3D Navier-Stokes Equations with FLUENT for flow in Nucor nozzle and mold with/without EMBr with 3 submergence depths
•Validation
•Compare computational results with experimental measurements
University of Illinois at Urbana-Champaign • Metals Processing Simulation Lab • K. Cukierski 6
EMBr Measurements•Rather than guess at the behavior and magnitude of the magnetic field, Nucor allowed exact measurements of the field used in their casters to be obtained
•A Gauss meter was used to conduct the measurements
•Note that the magnetic field was assumed constant throughout the thickness of the mold (~2% variation in field over 90mm thickness)
30 Data Points
16 D
ata
Poi
nts

University of Illinois at Urbana-Champaign • Metals Processing Simulation Lab • K. Cukierski 7
Example EMBr Measurement –0.39T Set Point
Colored by Magnitude of Applied Field (T)
Narrow F
ace
Narrow F
ace
SEN
•For optimal braking efficiency, the applied magnetic fields on each mold half should be equal in magnitude and opposite in direction
University of Illinois at Urbana-Champaign • Metals Processing Simulation Lab • K. Cukierski 8
Nail Board Samples
Rietow, 2007

University of Illinois at Urbana-Champaign • Metals Processing Simulation Lab • K. Cukierski 9
Oscillation Mark Photos
•Slab crops were sandblasted, and oscillation marks were outlined to increase visibility
•The oscillation marks represent the meniscus profile, and will be compared with computational results for validation
University of Illinois at Urbana-Champaign • Metals Processing Simulation Lab • K. Cukierski 10
Project Outline
•Objective
•Discover how and why an electromagnetic brake affects steel flow in the continuous casting mold
•Three phases to the project
•Experimental (in collaboration with Nucor Steel Decatur)
•EMBr measurement, nail board samples, and oscillation mark photos
•Computational Modeling
•Solve 3D Navier-Stokes Equations with FLUENT for flow in Nucor nozzle and mold with/without EMBr with 3 submergence depths
•Validation
•Compare computational results with experimental measurements

University of Illinois at Urbana-Champaign • Metals Processing Simulation Lab • K. Cukierski 11
Electromagnetic Force Calculation
( )
o
j V
V
B
BBB B
j
B
F
b
F
= +
= ×
= ×
= × ×
B
j
F V
=> Applied + induced magnetic field (T)B
=> Velocity (m/s)V2=> Current density (A/m )j
3=> Lorentz Force (kg/m )F
•Magnetic induction method
•Flow of steel through an applied magnetic field will generate an induced magnetic field which, when coupled with the applied magnetic field, induces a force which opposes the flow
Coupled Equations Variables
University of Illinois at Urbana-Champaign • Metals Processing Simulation Lab • K. Cukierski 12
FLUENT Model Validation
Material Properties:ρ=1.355E+04 kg/m3
μ=1.55825E-03 kg/m-sσ=1.05E+06 (Ω-m)-1
Boundary Conditions:Vin=1.16141 m/skin=5.99E-05 m2/s2
εin=7.529E-05 m2/s3
Pgage, outlet= 0Bo= 1.3483 T
0.304m
0.04
m
0.20m 0.20m
•Test case provided by Dr. M.J. Cho and M. Moreau
(Cho)
•FLUENT Simulation Results
•Domain centerline velocity profile (above) and vectors of Lorentz force (below) for the magnetic induction method compare well with previous results
Cho, Moreau
(Cho)
Electric Potential Method
Magnetic Induction Method
Lorentz Force

University of Illinois at Urbana-Champaign • Metals Processing Simulation Lab • K. Cukierski 13
R12.5
Nozzle Simulation
350
400
540
115
80
A A
110
R12.5
Section A-A
2577
45
°
35•All simulations solve the 3D Navier-Stokes equations in FLUENT using the standard model for turbulent fluid flow
•Fully-developed velocity profile specified at the inlet, and Pgage= 0 specified at the outlet ports
•Working fluid taken to be steel with the following properties:
•ρ= 7000 kg/m3
•µ = 0.006 kg/m-s
•σ = 714,000 (Ω-m)-1
k ε−
University of Illinois at Urbana-Champaign • Metals Processing Simulation Lab • K. Cukierski 14
Nozzle Mesh
•A structured, hexahedral mesh of ~200,000 “brick”cells was used for the nozzle simulation
•The full nozzle was meshed and simulated
•To reduce computational complexity, the nozzle was simulated separately from the mold
Top View
Bottom View
Isometric Port View
Front View

University of Illinois at Urbana-Champaign • Metals Processing Simulation Lab • K. Cukierski 15
Mold Simulations687
667
2500
45
24
SEN Depth
(varies, see below)
129
25
•Casting speed: 3.3m/min
•Shell profile calculated using CON1D and incorporated into mold cavity geometry
•Symmetry assumed: ¼ of mold is simulated
•Inlet conditions: Taken from nozzle right port velocity and turbulence parameters
•Outlet condition: Pgage= 0
•Solidification model: Mass and momentum sinks extract fluid through solidifying shell boundaries (from Bret Rietow, MS Thesis, 2007)
•3 SEN Depths:
250mm (shallow)300mm (validation case)350mm (deep)
University of Illinois at Urbana-Champaign • Metals Processing Simulation Lab • K. Cukierski 16
Mold Mesh•A structured, hexahedral mesh of ~50,000 “brick” cells was used for the mold simulations
•Taking advantage of symmetry planes reduced computing time from 30 hours (full mold) to 5 hours (1/4 mold) without the EMBr, and from 48 hours (full mold) to 12 hours (1/4 mold) with the EMBr

University of Illinois at Urbana-Champaign • Metals Processing Simulation Lab • K. Cukierski 17
Nozzle Flow – Velocity Contours
Slice through center of nozzle “wide face”
Slice through center of nozzle “narrow face”
View into right port
University of Illinois at Urbana-Champaign • Metals Processing Simulation Lab • K. Cukierski 18
Nozzle Flow – Velocity Vectors
Slice through center of nozzle “wide face”
Isometric right port view

University of Illinois at Urbana-Champaign • Metals Processing Simulation Lab • K. Cukierski 19
Applied and Induced Magnetic Fields –250mm SEN Depth
Applied Magnetic Field (from Nucor measurement)
Induced Magnetic Field (40x smaller than applied field)
Note: These and all subsequent contours, streamlines, and vectors shown on slices through wide face center
University of Illinois at Urbana-Champaign • Metals Processing Simulation Lab • K. Cukierski 20
Streamlines – 250mm SEN Depth
No EMBr EMBr

University of Illinois at Urbana-Champaign • Metals Processing Simulation Lab • K. Cukierski 21
Mold Flow – 250mm SEN Depth
No EMBr – Jet impinges 490mm below meniscus
EMBr – Jet impinges 660mm below meniscus
•Note: Inner box represents area with an average field strength of 0.3T. Outer box represents approximate extents of magnetic field.
University of Illinois at Urbana-Champaign • Metals Processing Simulation Lab • K. Cukierski 22
Effect of Induced Force and Applied Field on Mold Flow – 250mm SEN Depth
Flow without EMBr Flow with EMBr, colored by applied field
Flow with EMBr, colored by induced force

University of Illinois at Urbana-Champaign • Metals Processing Simulation Lab • K. Cukierski 23
Effect of Applied Field and Velocity on Induced Force – 250mm SEN Depth
Induced force vectors colored by magnitude
Induced force vectors colored by applied field
Induced force vectors colored by velocity
University of Illinois at Urbana-Champaign • Metals Processing Simulation Lab • K. Cukierski 24
Meniscus Velocity and Meniscus Profile
Comparisons – 250mm SEN Depth
Comparison of velocity magnitude measured 10mm below top surface centerline
Comparison of meniscus profiles calculated using the following equation:
*staticstatic
steel
P PMeniscus Heightgρ
−=
•Pressures measured along top surface centerline

University of Illinois at Urbana-Champaign • Metals Processing Simulation Lab • K. Cukierski 25
Applied Magnetic Field Induced Magnetic Field
Applied and Induced Magnetic Fields –300mm SEN Depth
University of Illinois at Urbana-Champaign • Metals Processing Simulation Lab • K. Cukierski 26
Streamlines – 300mm SEN Depth
No EMBr EMBr

University of Illinois at Urbana-Champaign • Metals Processing Simulation Lab • K. Cukierski 27
Mold Flow – 300mm SEN Depth
No EMBr – Jet impinges 560mm below meniscus
EMBr – Jet impinges 700mm below meniscus
•Note: Inner box represents area with an average field strength of 0.3T. Outer box represents approximate extents of magnetic field.
University of Illinois at Urbana-Champaign • Metals Processing Simulation Lab • K. Cukierski 28
Effect of Induced Force and Applied Field on Mold Flow – 300mm SEN Depth
Flow without EMBr Flow with EMBr, colored by applied field
Flow with EMBr, colored by induced force

University of Illinois at Urbana-Champaign • Metals Processing Simulation Lab • K. Cukierski 29
Effect of Applied Field and Velocity on Induced Force – 300mm SEN Depth
Induced force vectors colored by magnitude
Induced force vectors colored by applied field
Induced force vectors colored by velocity
University of Illinois at Urbana-Champaign • Metals Processing Simulation Lab • K. Cukierski 30
Comparison of velocity magnitude measured 10mm below top surface centerline
Comparison of meniscus profiles
Meniscus Velocity and Meniscus Profile Comparisons – 300mm SEN Depth

University of Illinois at Urbana-Champaign • Metals Processing Simulation Lab • K. Cukierski 31
Applied Magnetic Field Induced Magnetic Field
Applied and Induced Magnetic Fields –350mm SEN Depth
University of Illinois at Urbana-Champaign • Metals Processing Simulation Lab • K. Cukierski 32
Streamlines – 350mm SEN Depth
No EMBr EMBr
University of Illinois at Urbana-Champaign • Metals Processing Simulation Lab • K. Cukierski 33
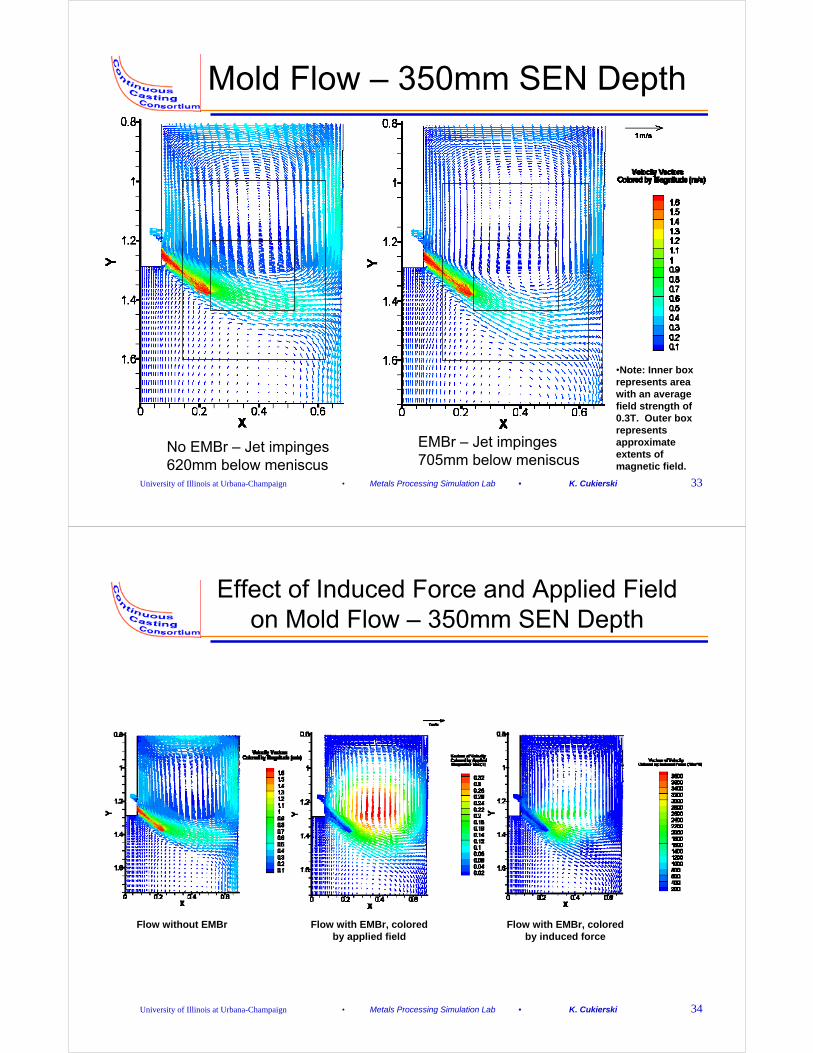
Mold Flow – 350mm SEN Depth
No EMBr – Jet impinges 620mm below meniscus
EMBr – Jet impinges 705mm below meniscus
•Note: Inner box represents area with an average field strength of 0.3T. Outer box represents approximate extents of magnetic field.
University of Illinois at Urbana-Champaign • Metals Processing Simulation Lab • K. Cukierski 34
Effect of Induced Force and Applied Field on Mold Flow – 350mm SEN Depth
Flow without EMBr Flow with EMBr, colored by applied field
Flow with EMBr, colored by induced force

University of Illinois at Urbana-Champaign • Metals Processing Simulation Lab • K. Cukierski 35
Effect of Applied Field and Velocity on Induced Force – 350mm SEN Depth
Induced force vectors colored by magnitude
Induced force vectors colored by applied field
Induced force vectors colored by velocity
University of Illinois at Urbana-Champaign • Metals Processing Simulation Lab • K. Cukierski 36
Meniscus Velocity and Meniscus Profile Comparisons – 350mm SEN Depth
Comparison of velocity magnitude measured 10mm below top surface centerline
Comparison of meniscus profiles

University of Illinois at Urbana-Champaign • Metals Processing Simulation Lab • K. Cukierski 37
Meniscus Velocities of All Simulations
University of Illinois at Urbana-Champaign • Metals Processing Simulation Lab • K. Cukierski 38
Trends in Meniscus Velocity

University of Illinois at Urbana-Champaign • Metals Processing Simulation Lab • K. Cukierski 39
Meniscus Profiles of All Simulations
University of Illinois at Urbana-Champaign • Metals Processing Simulation Lab • K. Cukierski 40
Trends in Standing Wave Height
Standing wave height = max meniscus profile height – min meniscus profile height

University of Illinois at Urbana-Champaign • Metals Processing Simulation Lab • K. Cukierski 41
Trends in Impingement Point
University of Illinois at Urbana-Champaign • Metals Processing Simulation Lab • K. Cukierski 42
Project Outline
•Objective
•Discover how and why an electromagnetic brake affects steel flow in the continuous casting mold
•Three phases to the project
•Experimental (in collaboration with Nucor Steel Decatur)
•EMBr measurement, nail board samples, and oscillation mark photos
•Computational Modeling
•Solve 3D Navier-Stokes Equations with FLUENT for flow in Nucor nozzle and mold with/without EMBr with 3 submergence depths
•Validation
•Compare computational results with experimental measurements

University of Illinois at Urbana-Champaign • Metals Processing Simulation Lab • K. Cukierski 43
Nail Board Validation Method
3mm
•Bret Rietow discovered an empirical relation correlating knob profile and nail diameter to flow velocity
•This method allows for quick and easy estimation of meniscus velocity from nail board test results
Rietow, 2007
University of Illinois at Urbana-Champaign • Metals Processing Simulation Lab • K. Cukierski 44
Nail Board and CFD Meniscus Velocity Comparison

University of Illinois at Urbana-Champaign • Metals Processing Simulation Lab • K. Cukierski 45
Comparison of Oscillation Marks to Calculated Meniscus Profile
University of Illinois at Urbana-Champaign • Metals Processing Simulation Lab • K. Cukierski 46
Summary
•Electromagnetics can be used in continuous casting to control the fluid flow pattern in the mold and to improve the internal microstructure of the finished product
•One nozzle flow and six mold flow simulations were performed to investigate the effects that the EMBr and SEN submergence depth have on fluid flow in the mold
•Applying EMBr causes:
•Reduced velocity at the meniscus and in the upper recirculation zone
•Deeper jet impingement
•Expanded upper recirculation zone
•Widening and upward shift of lower recirculation zone
•Smaller meniscus wave (2-4mm with EMBr vs. ~11mm with no EMBr at 3.3m/min)

University of Illinois at Urbana-Champaign • Metals Processing Simulation Lab • K. Cukierski 47
Summary
•Increasing SEN depth causes:
•EMBr off
•Decrease in meniscus velocity
•Deeper jet impingement
•Smaller meniscus wave
•EMBr on
•Increase in meniscus velocity
•Deeper jet impingement
•Larger meniscus wave
•Model predictions have been validated based on plant measurements
•Velocities from nail board tests closely match calculated meniscus velocities
•Oscillation mark profiles on strand roughly agree with calculated meniscus profile
University of Illinois at Urbana-Champaign • Metals Processing Simulation Lab • K. Cukierski 48
Acknowledgements
•Nucor Steel Decatur (Ron O’Malley)
•The Continuous Casting Consortium
•Fluent, Inc. (Ashwini Kumar)
•CCC Past and Present Graduate students (R. Chaudhary, S. Mahmood, M. Okelman, B. Rietow)
•Brian Thomas and Pratap Vanka