electricity statement of opportunities - energy · pdf fileaemo’s 2017 electricity...
TRANSCRIPT
ELECTRICITY STATEMENT OF OPPORTUNITIES
FOR THE NATIONAL ELECTRICITY MARKET
Published: September 2017
ELECTRICITY STATEMENT OF OPPORTUNITIES
Australian Energy Market Operator Ltd ABN 94 072 010 327 www.aemo.com.au [email protected]
NEW SOUTH WALES QUEENSLAND SOUTH AUSTRALIA VICTORIA AUSTRALIAN CAPITAL TERRITORY TASMANIA WESTERN AUSTRALIA
IMPORTANT NOTICE
Purpose
AEMO publishes the National Electricity Market Electricity Statement of Opportunities under clause
3.13.3(q) of the National Electricity Rules.
This publication has been prepared by AEMO using information available at 7 July 2017. Information
made available after this date may have been included in this publication where practical.
Disclaimer
This document or the information in it may be subsequently updated or amended. This document does
not constitute legal or business advice, and should not be relied on as a substitute for obtaining detailed
advice about the National Electricity Law, the National Electricity Rules, or any other applicable laws,
procedures or policies. AEMO has made every effort to ensure the quality of the information in this
document but cannot guarantee its accuracy or completeness.
Accordingly, to the maximum extent permitted by law, AEMO and its officers, employees and
consultants involved in the preparation of this document:
make no representation or warranty, express or implied, as to the currency, accuracy, reliability or
completeness of the information in this document; and
are not liable (whether by reason of negligence or otherwise) for any statements or representations
in this document, or any omissions from it, or for any use or reliance on the information in it.
Version control
Version Release date Changes
1 5/9/2017
© 2017 Australian Energy Market Operator Limited. The material in this publication may be used in
accordance with the copyright permissions on AEMO’s website.
ELECTRICITY STATEMENT OF OPPORTUNITIES
© AEMO 2017 1
EXECUTIVE SUMMARY
The radically changing dynamics of the power system are resulting in a tight supply-demand
balance in parts of the National Electricity Market (NEM). The overall responsiveness and
resilience of the system is at risk from increased vulnerability to climatic events, such as
extended periods of high temperatures, and the risk of loss of, or reduction in output of, major
generation units.
AEMO’s 2017 Electricity Statement of Opportunities (ESOO) modelling shows reserves have reduced
to the extent that there is a heightened risk of significant unserved energy (USE) 1 over the next 10
years, compared with recent levels.
AEMO’s analysis shows a heightened risk that the current NEM
reliability standard will not be met, and confirms that for peak
summer periods, targeted actions to provide additional firming
capability are necessary to reduce risks of supply interruptions.
Firming capability can be dispatched to maintain balance on the power
grid. It can include generation on the grid, storage, demand resources
behind the meter, flexible demand, or flexible network capability.
The highest forecast USE risk in the 10-year outlook is in 2017–18 in
South Australia and Victoria. This risk is being addressed by the
South Australian Government’s Energy Plan2 developing additional
diesel generation and battery storage, and AEMO pursuing supply
and demand response3 through the Reliability and Emergency
Reserve Trader (RERT)4 provisions.
From 2018–19 to 2021–22, progressively decreasing levels of
potential USE conditions are observed over the next four summers, due to increasing
renewable generation. New strategic reserves to deliver firming capability during this
period are recommended, given AEMO will not be able to engage long notice RERT as it is
doing for summer 2017–18.
The potential for USE and not meeting the current reliability standard is projected to then
increase in New South Wales and Victoria after Liddell Power Station closes (announced
as 2022).
Retirement of other coal generation in New South Wales after 2022, if not appropriately replaced
by firming capability, could significantly increase the risk of load shedding.
AEMO’s analysis shows that renewable generation can provide some support to maintain reliability
even without firming capability. However, if this renewable development was to lead to earlier retirement
of existing thermal generation, the risk of USE would increase without additional firming capability.
In Queensland and Tasmania, no material USE risk is expected in these regions across the 10-year
assessment period for the modelled scenarios.
Figure 1 summarises the range of forecast USE outcomes for each NEM region assessed to be at risk
across the 10-year period. In assessing the range of possible USE and potential for not meeting the
current reliability standard in the next 10 years, the 2017 ESOO has forecast a plausible range of
outcomes, considering the following key drivers:
1 See rule 3.9.3C of the National Electricity Rules for the full meaning of the term “unserved energy” in relation to the current reliability standard. 2 Government of South Australia. Our Energy Plan. See: http://ourenergyplan.sa.gov.au/. 3 Demand response, also called demand side participation, is where customers are paid to decrease load during actual or forecast supply shortfalls. 4 See: http://www.aemo.com.au/Electricity/National-Electricity-Market-NEM/Emergency-Management/RERT-panel-expressions-of-interest.
Unserved energy (USE) is the
amount of energy that cannot be
supplied to consumers, resulting in
involuntary load shedding (loss of
customer supply), because there is
not enough generation capacity,
demand side participation, or
network capability, to meet
demand.
The reliability standard specifies
expected USE should not exceed
0.0020% of consumption per
region in any financial year.

ELECTRICITY STATEMENT OF OPPORTUNITIES
© AEMO 2017 2
Effect of higher demand – the projected USE risks increase if maximum demands are higher than
forecast (for example due to higher usage and/or lower than projected uptake of energy efficiency
measures or rooftop PV).
Effect of renewable investment – the projected USE risk decreases if the modelling assumes
increased investment in renewable generation.
Figure 1 Range of USE outcomes linked with key drivers
In this figure:
Committed and Existing Generators shows USE if only existing generators and generation projects that meet AEMO’s commitment criteria were operating. Not all potential renewable generation required to meet State and Federal renewable energy targets and the Paris COP21 commitment has been developed in this scenario.
Dispersed Renewables shows USE if, as well as all existing generators and projects meeting AEMO’s commitment criteria, additional renewable generation was to be developed to deliver a national renewable generation outcome, leading to greater penetration than can be achieved if geographically concentrated.
High Demand shows the impact on USE if demand growth was in the upper range of expectations, assuming generation was developed according to the Dispersed Renewables pathway. The effect of higher demand on USE would be even greater if modelling assumed only Committed and Existing Generators.
There is a wide range of potential outcomes for South Australia and Victoria in 2017–18, and in New
South Wales and Victoria after 2022–23, where the supply-demand balance is tight.
Any material reduction in capacity over the peak summer months (for example, from slower than
projected renewable generation installation, lower than projected yield from wind, or reduced
capacity of thermal plant during high temperatures) could lead to significant supply shortfalls and
USE not meeting the current reliability standard.
Any material increases in demand over peak summer months could also reasonably lead to supply
shortfalls and potential for not meeting the current reliability standard.
The USE risks change each year as supply and demand conditions fluctuate. Uncertainty in all
NEM forecasts remains extremely high, so all estimates of reserve requirements must be regarded
as subject to progressive refinement.

ELECTRICITY STATEMENT OF OPPORTUNITIES
© AEMO 2017 3
There is a significant difference in USE forecasts in the later years of the 10-year outlook between the
Committed and Existing generation scenario and the additional renewable scenarios5, highlighting that
delays in the development of this future investment will keep USE risks heightened for longer.
AEMO, like every system operator in the world, targets a defined market reliability standard (99.998% in
the NEM) and cannot promise or deliver 100% supply reliability. There are a number of variable factors
that can, at any one time or simultaneously, have an adverse impact and are out of AEMO’s control,
such as major environmental events, bushfires, or floods, and unplanned asset faults and failures.
Managing risk through RERT and forward planning
The South Australian Energy Plan will help alleviate risks to consumer supply in South Australia by
acting to provide additional supplies to consumers at times of identified USE risks.
AEMO’s current actions to manage risks to reliability for the 2017–18 summer include exercising the
RERT process in Victoria and South Australia. This RERT response may be sourced from a
combination of additional supply capacity, energy storage, and demand response. AEMO’s joint
demand side participation (DSP) project with the Australian Renewable Energy Agency (ARENA) will be
a related trial to provide additional resources.
For further information about other initiatives underway to prepare for summer 2017–18, please see
AEMO’s June 2017 Energy Supply Outlook (ESO).6
5 AEMO modelled two renewable development pathways, Dispersed renewables and Concentrated renewables, described in Section 1.3. 6 AEMO. ESO, June 2017. Available at: https://www.aemo.com.au/Media-Centre/AEMO-Energy-Supply-Outlook.
ELECTRICITY STATEMENT OF OPPORTUNITIES
© AEMO 2017 4
CONTENTS
IMPORTANT NOTICE
EXECUTIVE SUMMARY
CHAPTER 1. INTRODUCTION 6
1.1 Purpose and scope 6
1.2 Measuring reliability using a planning standard 6
1.3 Scenario modelling 7
CHAPTER 2. GENERATION CAPACITY CHANGES 8
2.1 NEM generation changes and investment trends 8
2.2 Renewables pathways 9
CHAPTER 3. DEMAND FORECAST 12
3.1 Forecast update and approach 12
3.2 Forecasts scenarios and uncertainty 12
3.3 Forecast summary 14
CHAPTER 4. NEM-WIDE OUTLOOK 16
4.1 NEM supply adequacy 16
CHAPTER 5. REGIONAL OUTLOOK 22
5.1 New South Wales 22
5.2 Queensland 26
5.3 South Australia 28
5.4 Tasmania 33
5.5 Victoria 34
CHAPTER 6. LINKS TO SUPPORTING INFORMATION 40
APPENDIX A. DEMAND FORECAST DETAILS 41
A.1. Annual consumption – regional overview 41
A.2. Maximum demand – regional overview 42
MEASURES AND ABBREVIATIONS 46
Units of measure 46
Abbreviations 46
GLOSSARY 47
TABLES
Table 1 Modelled capacity changes of committed and existing plant (MW) by region since the 2016
ESOO 8
Table 2 Split of wind and solar capacity added in Concentrated renewables and Dispersed
renewables pathways 11
Table 3 Forecast regional maximum operational demand (10% POE), Neutral scenario (MW) 15
ELECTRICITY STATEMENT OF OPPORTUNITIES
© AEMO 2017 5
Table 4 Forecast regional maximum operational demand (50% POE), Neutral scenario (MW) 15
Table 5 Regional modelled generation in New South Wales by generation type (MW) 23
Table 6 New committed generation in New South Wales since the 2016 ESOO 23
Table 7 Regional modelled generation in Queensland by generation type (MW) 27
Table 8 New committed generation in Queensland since the 2016 ESOO 28
Table 9 Regional modelled generation in South Australia by generation type (MW) 30
Table 10 New committed generation in South Australia since the 2016 ESOO 30
Table 11 Regional modelled generation in Tasmania by generation type (MW) 34
Table 12 Regional modelled generation in Victoria by generation type (MW) 36
Table 13 New committed generation in Victoria since the 2016 ESOO 36
Table 14 Links to supporting AEMO planning information 40
Table 15 Annual operational consumption by NEM region – Neutral scenario (in GWh per year) 41
Table 16 Forecast operational maximum demand (10% POE, Summer) for New South Wales 42
FIGURES
Figure 1 Range of USE outcomes linked with key drivers 2
Figure 2 Additional cumulative builds in Concentrated renewables and Dispersed renewables
pathways 10
Figure 3 Forecast annual operational consumption and forecast uncertainty bands 13
Figure 4 NEM annual consumption by scenarios 14
Figure 5 Range of USE outcomes linked with key drivers and renewable pathways 17
Figure 6 Impact of extended unavailability of largest unit on USE outcomes 19
Figure 7 Expected USE in New South Wales with retirement of additional coal power station 20
Figure 8 Additional cumulative build under Concentrated renewables and Dispersed renewables
pathways – New South Wales 24
Figure 9 New South Wales supply adequacy 25
Figure 10 Expected USE in New South Wales with retirement of additional coal unit 26
Figure 11 Additional cumulative build under the Concentrated renewables and Dispersed renewables
pathways – Queensland 28
Figure 12 Additional cumulative build under the Concentrated renewables and Dispersed renewables
pathways – South Australia 31
Figure 13 South Australia supply adequacy 32
Figure 14 Risk of USE after extended unavailability of largest generator in South Australia 33
Figure 15 Additional cumulative build under the Concentrated renewables and Dispersed renewables
pathways – Victoria 37
Figure 16 Victorian supply adequacy 38
Figure 17 Risk of USE after extended unavailability of largest generator in Victoria 39
Figure 18 Forecast operational maximum demand (10% POE, Summer) for Queensland 43
Figure 19 Forecast operational maximum demand (10% POE, Summer) for South Australia 44
Figure 20 Forecast operational maximum demand (10% POE, Winter) for Tasmania 44
Figure 21 Forecast operational maximum demand (10% POE, Summer) for Victoria 45
ELECTRICITY STATEMENT OF OPPORTUNITIES
© AEMO 2017 6
CHAPTER 1. INTRODUCTION
1.1 Purpose and scope The Electricity Statement of Opportunities (ESOO) evaluates and compares committed electricity
supply information provided by industry with operational consumption and maximum demand forecasts,
to identify potential unserved energy (USE) in excess of the reliability standard over a 10-year outlook
period. AEMO performs this evaluation under a range of demand scenarios. The purpose of this study
is to provide information to market participants to help them make informed decisions concerning
investment potential in the National Electricity Market (NEM). The period covered by the current ESOO
is from 2017–18 to 2026–27.
Due to the increasing complexity of the power system, in recent years, AEMO has begun to expand the
ESOO analysis. The 2016 ESOO assessed announced retirements and also considered whether
Australia's COP21 commitment would lead to further potential generation withdrawals.7
The 2017 ESOO builds on the 2016 ESOO by modelling renewable generation builds to meet proposed
and existing renewable targets in the NEM. The 2017 ESOO also assesses potential generation outage
events that may challenge reliability of supply. This analysis is intended to complement the traditional
ESOO approach, to assess the extent to which short-term actions to address supply shortfalls may be
needed to complement market opportunities for increased generation.
1.2 Measuring reliability using a planning standard The current NEM reliability standard is set to ensure that sufficient supply resources exist to meet
99.998% of annual demand for electricity in each region. The standard therefore allows 0.002% of
energy demand to be unmet in a given region per financial year.8 The standard recognises that power
systems will from time to time reach extreme peaks, and that during these periods there may not be
sufficient resources to meet demand.
While additional generation can be acquired to meet these peaks, due to the costs involved almost all
jurisdictions recognise that there will be unusual circumstances of extremely high demand where there
needs to be tolerance for load shedding. In many jurisdictions, the ability to use demand response by
customers who have other options or are capable of temporarily reducing usage is viewed as a
dependable and cost effective alternative to involuntary load reductions. AEMO will also use voluntary
load reductions to help reduce or mitigate involuntary curtailments.
However, to date, demand response has not been prevalent in the NEM, which means that when there
are insufficient resources available, AEMO reduces customer load temporarily to avoid system security
challenges that can result in more extended loss of service.
The USE that contributes to the reliability standard excludes power system security incidents resulting
from multiple or non-credible generation and transmission events, network outages not associated with
inter-regional flows, or industrial action.
The reliability standard also represents a planning standard; within an operational timeframe, AEMO will
endeavour to manage the market to avoid USE with the resources available.
Forecasting reliability
To calculate the expected USE, AEMO uses a probabilistic approach, which calculates an average USE
over a number of demand outcomes (based on seven historical reference years) and random generator
outages. Generator outage rates are calculated based on historical performance data.
7 Australia’s commitment at the 21st Conference of Parties (COP21) in Paris in 2015, to reduce carbon emissions by 26% to 28% below 2005 levels
by 2030. 8 See rule 3.9.3C of the National Electricity Rules for the full meaning of the term “unserved energy” in relation to the current reliability standard.
ELECTRICITY STATEMENT OF OPPORTUNITIES
© AEMO 2017 7
Since the release of the 2016 ESOO, scrutiny of and debate about reliability of supply has increased.
This report does not comment on the ongoing appropriateness of the reliability standard in its current
form, but recognises that there is an increasing need to plan for future market conditions beyond the
expected, to prudently manage risk in the interest of consumers.9
1.3 Scenario modelling For the 2017 ESOO, AEMO has increased the number of scenarios modelled, to capture a broad range
of possibilities that could occur in the NEM in the next 10 years. The 2017 ESOO scenarios consider
three distinct factors, described below.
Demand forecast assumptions
The 2017 ESOO builds on the traditional Neutral, Strong, and Weak demand forecast scenarios
representing different economic growth and consumer sentiment outlooks. The forecasts used are
presented in Chapter 3 and are updated from AEMO’s 2017 Electricity Forecasting Insights forecasts
published in June 2017.
In this assessment, maximum demand forecasts use 10% and 50% Probability of Exceedance (POE)10
based on up-to-date information, including the demand conditions experienced in the 2017 February
heatwaves, to stress test the supply adequacy assessments.
The DSP forecasts used in the 2017 ESOO are sourced from AEMO’s 2017 Electricity Forecasting
Insights.11
Generation assumptions
Three paths for renewable generation builds in the NEM have been modelled in the 2017 ESOO:
Committed and existing generation – This scenario incorporates all existing generation in the
NEM and new generation that meet AEMO’s commitment criteria. Advice on commitments and
retirements is based on current industry advice.12
Concentrated renewables – This scenario assumes potential additional development after 2020
are geographically concentrated particularly in Victoria, driven by the Victorian Renewable Energy
Target (VRET).
Dispersed renewables – This scenario assumes developments are driven by national targets that
deliver a more even geographic spread of renewable generation across the NEM, leading to a
greater penetration of renewables than is achieved if they are geographically concentrated.
Section 2.1 has more detail on what recently announced renewable energy policy details, actions,
plans, and auctions have been considered in these scenarios, given the timing of AEMO’s modelling.
Extended outage and early retirement contingency events
The 2017 ESOO investigates the adequacy and readiness of supply resources by quantifying risks
under a range of contingency scenarios.
In this assessment, AEMO has focused on potential supply disruptions to existing dispatchable
generation, and the adequacy of the system to deliver electricity reliably to consumers under these
unlikely but possible events.
9 AEMC Reliability Panel. Review of the RERT Guidelines – Final Report, 15 December 2016. Available at:
http://www.aemc.gov.au/getattachment/3b4ce6d1-fc0a-4954-be43-62a1300e6e73/Final-report.aspx. 10 Probability of Exceedance (POE) means the probability, as a percentage, that a maximum demand forecast will be met or exceeded (for example,
due to weather conditions). For example, a 10% POE forecast is expected to be met or exceeded, on average, only one year in 10, so considers more extreme weather than a 50% POE forecast, which is expected to be met or exceeded, on average, one year in two.
11 AEMO. Available at: http://www.aemo.com.au/Electricity/National-Electricity-Market-NEM/Planning-and-forecasting/Electricity-Forecasting-Insights.
12 AEMO’s commitment criteria for generation are published in each regional spreadsheet on its Generation Information web page: https://www.aemo.com.au/Electricity/National-Electricity-Market-NEM/Planning-and-forecasting/Generation-information.
ELECTRICITY STATEMENT OF OPPORTUNITIES
© AEMO 2017 8
CHAPTER 2. GENERATION CAPACITY CHANGES
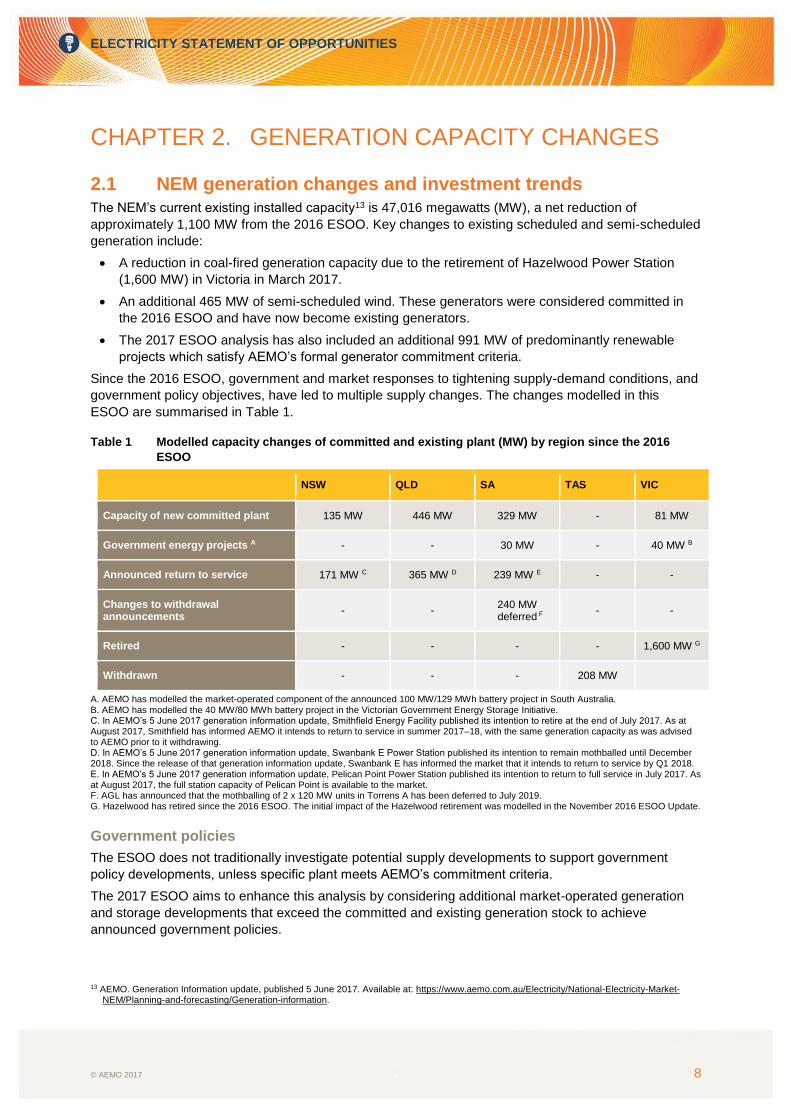
2.1 NEM generation changes and investment trends The NEM’s current existing installed capacity13 is 47,016 megawatts (MW), a net reduction of
approximately 1,100 MW from the 2016 ESOO. Key changes to existing scheduled and semi-scheduled
generation include:
A reduction in coal-fired generation capacity due to the retirement of Hazelwood Power Station
(1,600 MW) in Victoria in March 2017.
An additional 465 MW of semi-scheduled wind. These generators were considered committed in
the 2016 ESOO and have now become existing generators.
The 2017 ESOO analysis has also included an additional 991 MW of predominantly renewable
projects which satisfy AEMO’s formal generator commitment criteria.
Since the 2016 ESOO, government and market responses to tightening supply-demand conditions, and
government policy objectives, have led to multiple supply changes. The changes modelled in this
ESOO are summarised in Table 1.
Table 1 Modelled capacity changes of committed and existing plant (MW) by region since the 2016
ESOO
NSW QLD SA TAS VIC
Capacity of new committed plant 135 MW 446 MW 329 MW - 81 MW
Government energy projects A - - 30 MW - 40 MW B
Announced return to service 171 MW C 365 MW D 239 MW E - -
Changes to withdrawal announcements
- - 240 MW
deferred F - -
Retired - - - - 1,600 MW G
Withdrawn - - - 208 MW
A. AEMO has modelled the market-operated component of the announced 100 MW/129 MWh battery project in South Australia. B. AEMO has modelled the 40 MW/80 MWh battery project in the Victorian Government Energy Storage Initiative. C. In AEMO’s 5 June 2017 generation information update, Smithfield Energy Facility published its intention to retire at the end of July 2017. As at August 2017, Smithfield has informed AEMO it intends to return to service in summer 2017–18, with the same generation capacity as was advised to AEMO prior to it withdrawing. D. In AEMO’s 5 June 2017 generation information update, Swanbank E Power Station published its intention to remain mothballed until December 2018. Since the release of that generation information update, Swanbank E has informed the market that it intends to return to service by Q1 2018. E. In AEMO’s 5 June 2017 generation information update, Pelican Point Power Station published its intention to return to full service in July 2017. As at August 2017, the full station capacity of Pelican Point is available to the market. F. AGL has announced that the mothballing of 2 x 120 MW units in Torrens A has been deferred to July 2019. G. Hazelwood has retired since the 2016 ESOO. The initial impact of the Hazelwood retirement was modelled in the November 2016 ESOO Update.
Government policies
The ESOO does not traditionally investigate potential supply developments to support government
policy developments, unless specific plant meets AEMO’s commitment criteria.
The 2017 ESOO aims to enhance this analysis by considering additional market-operated generation
and storage developments that exceed the committed and existing generation stock to achieve
announced government policies.
13 AEMO. Generation Information update, published 5 June 2017. Available at: https://www.aemo.com.au/Electricity/National-Electricity-Market-
NEM/Planning-and-forecasting/Generation-information.
ELECTRICITY STATEMENT OF OPPORTUNITIES
© AEMO 2017 9
It has included these announced government initiatives, as noted in Table 1:
The Victorian Government’s Energy Storage Initiative’s battery.14
The market-operated component of the South Australian Energy Plan’s battery.15
Unfortunately, due to the information available during the ESOO modelling, the supply adequacy
assessments did not take into account:
Snowy Hydro 2.0.16
Powering Queensland Plan’s 100 MW battery.17
Powering Queensland Plan’s 300 MW of renewable generation.
South Australia’s power purchase agreement for 150 MW of solar thermal generation.
ElectraNet’s 30 MW battery in South Australia.18
The ESOO also does not include non-market operated developments, but rather aims to identify the
potential need for additional capacity to be procured either through market or government
developments or through AEMO’s Reliability and Emergency Reserve Trader (RERT) function.
Therefore the 2017 ESOO does not include:
The non-market component of the South Australian Energy Plan’s battery.19
South Australian Energy Plan’s 276 MW diesel generation.
The joint AEMO and Australian Renewable Energy Agency (ARENA) DSP project.20
2.2 Renewables pathways
At 1 July 2017, there were 21,721 MW of connection requests in train in the NEM21, comprising
10,678 MW for large-scale wind and 11,043 MW for large-scale solar. Some projects also nominate
additional storage capacity to be developed in combination.
In contrast to this significant amount of proposed capacity, only approximately 1,331 MW of scheduled
and semi-scheduled capacity currently meets AEMO’s commitment criteria and is included in the
Committed and Existing generation pathway outlined in Section 1.3.
Project development lead times are now sufficiently short for some renewable generation technologies
that it may be possible for generators not yet ‘committed’ to be operational within short timeframes.
AEMO’s traditional approach, to consider only generators that meet AEMO’s current commitment
criteria in the ESOO, may therefore need to be revised in the future.
In this ESOO, AEMO has assessed two alternative plausible renewable pathways that include capacity
built beyond AEMO's commitment criteria. The two pathways are summarised below.
Concentrated renewables pathway
The Concentrated renewables pathway’s goal is to deliver renewable capacity from the federal Large-
scale Renewable Energy Target (LRET) and the VRET only.
The LRET mandates that 33,000 gigawatt hours (GWh) be derived from eligible renewable
sources by 2020. The profile used in AEMO’s modelling meets the mandated target, plus
additional estimated demand for renewable energy, for instance driven by generators successful in
14 Victorian Government Media Statement, “Large Scale Energy Storage: An Investment In Jobs, Reliability And Affordability”, 14 March 2017.
Available at: http://www.premier.vic.gov.au/large-scale-energy-storage-an-investment-in-jobs-reliability-and-affordability/. 15 South Australian Government Energy Plan for Battery. Available at http://ourenergyplan.sa.gov.au/battery.html. 16 Snowy Hydro 2.0. Available at http://www.snowyhydro.com.au/our-scheme/snowy20/. 17 Queensland Government Powering Queensland Plan. Available at: https://www.dews.qld.gov.au/electricity/powering-queensland-plan. 18 ElectraNet’s Battery Storage Project: Available at: https://arena.gov.au/blog/southaustraliabattery/. 19 South Australian Government Energy Plan for Battery. Available at http://ourenergyplan.sa.gov.au/battery.html. 20 Joint ARENA and AEMO DSP Project. Available at: https://arena.gov.au/funding/programs/advancing-renewables-program/demandresponse/. 21 In addition, AEMO’s Generation Information updates present an outlook of existing, committed, advanced and proposed projects. These need not
have applied for connection, with a total of 23,698 MW currently ‘proposed’ in the NEM. AEMO. Generation Information update, published 5 June 2017. Available at: https://www.aemo.com.au/Electricity/National-Electricity-Market-NEM/Planning-and-forecasting/Generation-information.
ELECTRICITY STATEMENT OF OPPORTUNITIES
© AEMO 2017 10
the Australian Capital Territory (ACT) renewable energy target auctions, and by GreenPower
sales.
The VRET seeks to achieve 40% renewable energy in Victoria by 2025. The modelling assumed
close to 4,800 MW of wind and solar capacity build by 2026–27.22
Assuming achievement of the VRET, but no broader development across the NEM from 2021 onwards,
renewable generation capacity in this pathway becomes very concentrated in Victoria towards the end
of the 10-year horizon.
Dispersed renewables pathway
The Dispersed renewables pathway includes the LRET as above, but further assumes any additional
renewable capacity incentivised from 2021 onwards is driven through nationally set (or at least
co-ordinated) targets, rather than state-based schemes. No such national target currently exists.
For modelling purposes, this pathway targeted 45% renewables by 2029–30, a mid-point of the
proposed outcomes announced by the Queensland and Victorian governments.23
This pathway results in a more evenly dispersed geographic development of renewable generation
across the NEM regions, as well as greater overall penetration of renewable generation than in the
Concentrated renewables pathway, reaching 40% renewables across the NEM by 2026–27.
Comparison of pathways
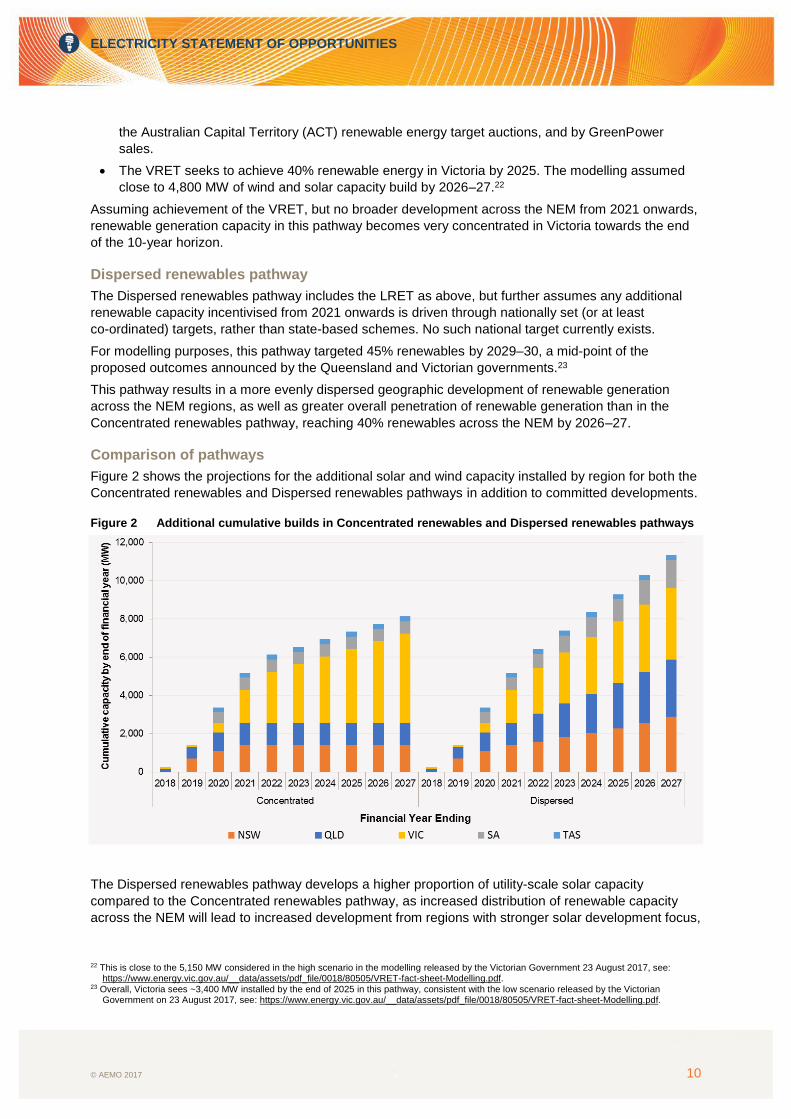
Figure 2 shows the projections for the additional solar and wind capacity installed by region for both the
Concentrated renewables and Dispersed renewables pathways in addition to committed developments.
Figure 2 Additional cumulative builds in Concentrated renewables and Dispersed renewables pathways
The Dispersed renewables pathway develops a higher proportion of utility-scale solar capacity
compared to the Concentrated renewables pathway, as increased distribution of renewable capacity
across the NEM will lead to increased development from regions with stronger solar development focus,
22 This is close to the 5,150 MW considered in the high scenario in the modelling released by the Victorian Government 23 August 2017, see:
https://www.energy.vic.gov.au/__data/assets/pdf_file/0018/80505/VRET-fact-sheet-Modelling.pdf. 23 Overall, Victoria sees ~3,400 MW installed by the end of 2025 in this pathway, consistent with the low scenario released by the Victorian
Government on 23 August 2017, see: https://www.energy.vic.gov.au/__data/assets/pdf_file/0018/80505/VRET-fact-sheet-Modelling.pdf.
ELECTRICITY STATEMENT OF OPPORTUNITIES
© AEMO 2017 11
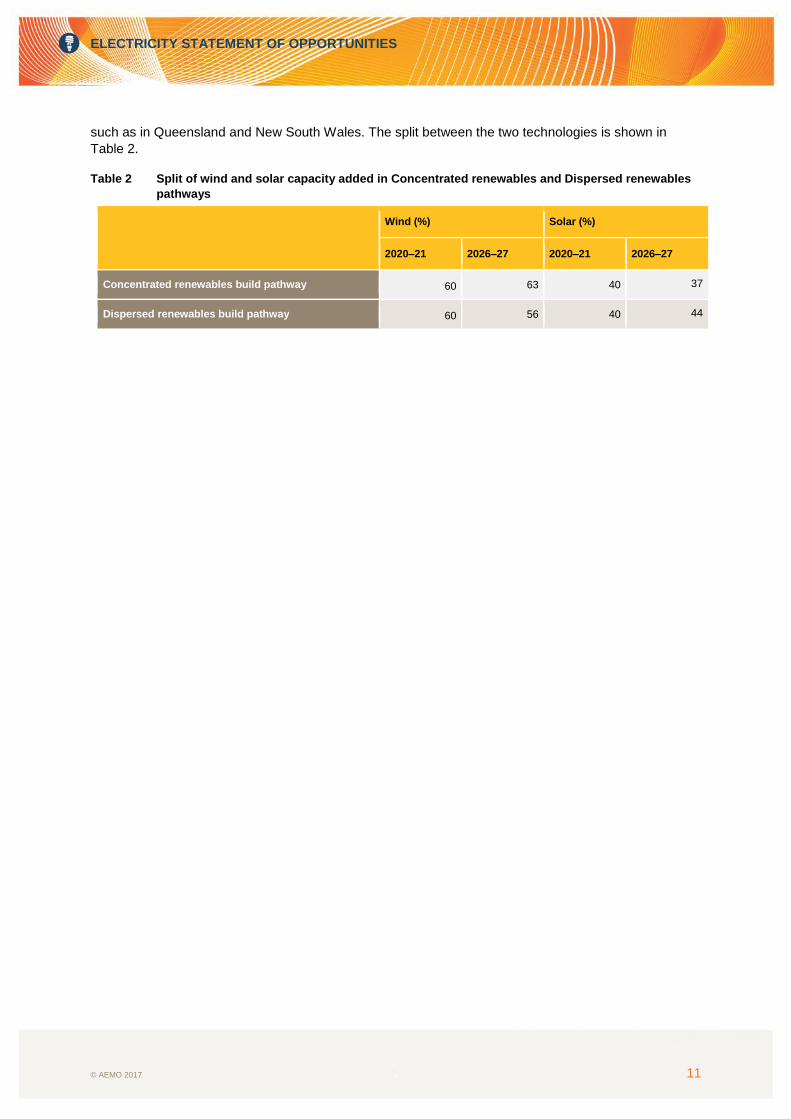
such as in Queensland and New South Wales. The split between the two technologies is shown in
Table 2.
Table 2 Split of wind and solar capacity added in Concentrated renewables and Dispersed renewables
pathways
Wind (%) Solar (%)
2020–21 2026–27 2020–21 2026–27
Concentrated renewables build pathway 60 63 40 37
Dispersed renewables build pathway 60 56 40 44
ELECTRICITY STATEMENT OF OPPORTUNITIES
© AEMO 2017 12
CHAPTER 3. DEMAND FORECAST
3.1 Forecast update and approach Rapid changes to energy technology, policy, the economic and societal drivers of consumption, the
increasing interrelation between the electricity and gas sectors, and the tight supply-demand balance in
both sectors have prompted a considerable increase in scrutiny on energy projections and risks.
AEMO is responding with more frequent forecast updates, including integrated energy system studies
that consider the dynamics between gas and electricity and supply and demand, including the projected
effect of international developments on an increasingly globally connected domestic gas market.
For this ESOO, AEMO has updated its forecasts for annual consumption and maximum demand, as
well as how these forecasts are used in supply adequacy analyses. This ESOO demand forecast differs
from both the forecasts AEMO published in the 2016 National Electricity Forecasting Report (NEFR),
which was used in the 2016 ESOO and June 2017 Energy Supply Outlook (ESO), and from AEMO’s
2017 Electricity Forecasting Insights published in June 2017.
Major updates in this ESOO demand forecast include:
Reviewing how energy prices may impact energy demand, and how this can be best accounted for
in modelling methods. Of particular concern to AEMO is how the demand forecasting system
should account for near-term supply-demand tightness, and the impact on shorter-term dynamics
on peak demand that may be less transparent to AEMO. This includes competition dynamics,
contractual terms in energy supply agreements, and operational responses to short-term
supply scarcity.
The findings of interviews with large industrial consumers in each region to update price response
assumptions, including short-term behavioural responses by industry and households as well as
long term structural responses via investments in energy efficiency and rooftop photovoltaic (PV).
Recalibrating annual consumption forecasts, to have the starting point reflect actual demand levels
observed in 2016–17. This accounts for more up-to-date information regarding major industrial
production shifts, including, for example, the long-term outage impacting the Portland Aluminium
smelter, as well as dynamics since January 2017 (which formed the basis of the 2017 Electricity
Forecasting Insights starting point).
3.2 Forecasts scenarios and uncertainty
Updated ESOO forecasts have been produced for three scenarios – Strong, Neutral, and Weak –
representing different futures with diverging outlooks for economic growth and consumer sentiments.
In recognition of a tight supply-demand balance over the next few years, affecting both the gas and
electricity sectors, AEMO has reviewed near-term demand dynamics forecast as a consequence of
changing energy prices. This has required a prudent treatment of forecast risk related to the timing and
extent of response to price changes. AEMO has limited visibility of price change response, because
data in the terms of bilateral contracts, and strategies employed by commercial operations of industry,
are not typically shared with AEMO.24
In response, AEMO has adjusted the Neutral and Strong scenario annual consumption and maximum
demand forecasts to account for this risk with a delayed and reduced response to price changes
incorporated.
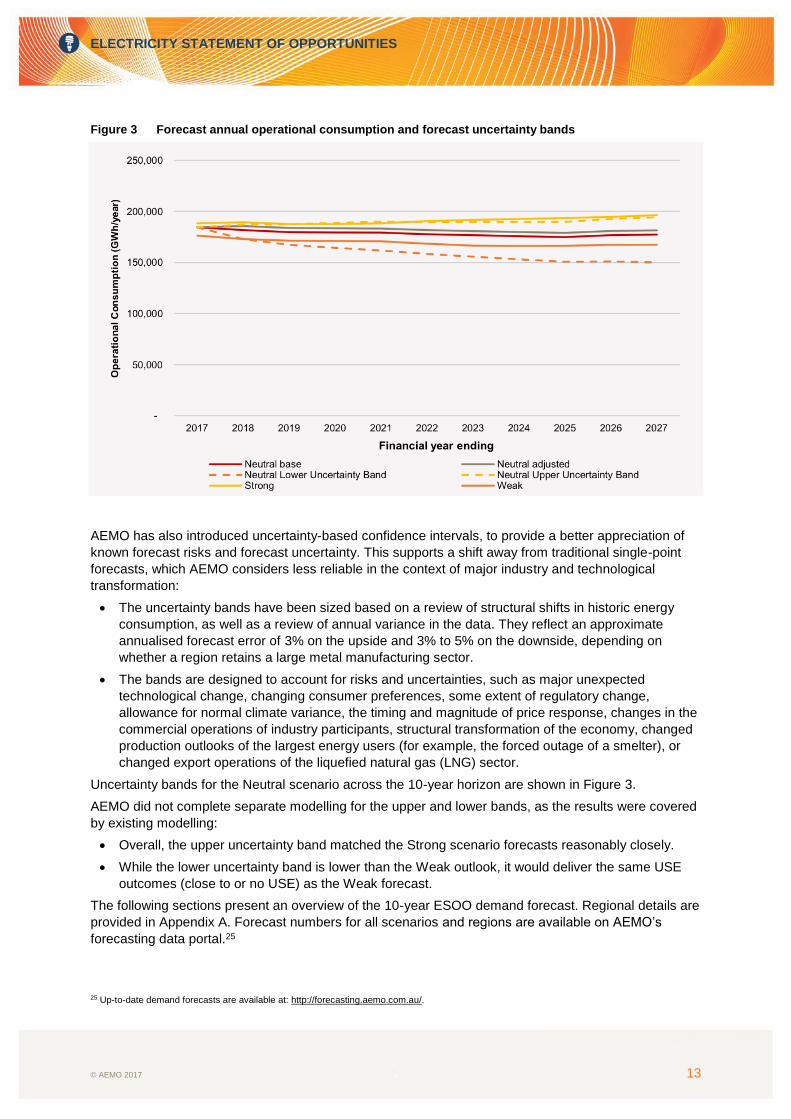
The size of the adjustment to the Neutral scenario forecasts is shown in Figure 3 as the difference
between the Neutral base forecast and Neutral adjusted forecasts. Throughout the ESOO, the Neutral
adjusted forecast shown has been used and referred to as ‘Neutral’.
24 The duration of energy supply contracts, for example, may delay price increases until the time of contract renewal.
ELECTRICITY STATEMENT OF OPPORTUNITIES
© AEMO 2017 13
Figure 3 Forecast annual operational consumption and forecast uncertainty bands
AEMO has also introduced uncertainty-based confidence intervals, to provide a better appreciation of
known forecast risks and forecast uncertainty. This supports a shift away from traditional single-point
forecasts, which AEMO considers less reliable in the context of major industry and technological
transformation:
The uncertainty bands have been sized based on a review of structural shifts in historic energy
consumption, as well as a review of annual variance in the data. They reflect an approximate
annualised forecast error of 3% on the upside and 3% to 5% on the downside, depending on
whether a region retains a large metal manufacturing sector.
The bands are designed to account for risks and uncertainties, such as major unexpected
technological change, changing consumer preferences, some extent of regulatory change,
allowance for normal climate variance, the timing and magnitude of price response, changes in the
commercial operations of industry participants, structural transformation of the economy, changed
production outlooks of the largest energy users (for example, the forced outage of a smelter), or
changed export operations of the liquefied natural gas (LNG) sector.
Uncertainty bands for the Neutral scenario across the 10-year horizon are shown in Figure 3.
AEMO did not complete separate modelling for the upper and lower bands, as the results were covered
by existing modelling:
Overall, the upper uncertainty band matched the Strong scenario forecasts reasonably closely.
While the lower uncertainty band is lower than the Weak outlook, it would deliver the same USE
outcomes (close to or no USE) as the Weak forecast.
The following sections present an overview of the 10-year ESOO demand forecast. Regional details are
provided in Appendix A. Forecast numbers for all scenarios and regions are available on AEMO’s
forecasting data portal.25
25 Up-to-date demand forecasts are available at: http://forecasting.aemo.com.au/.
ELECTRICITY STATEMENT OF OPPORTUNITIES
© AEMO 2017 14
3.3 Forecast summary
3.3.1 Annual consumption overview
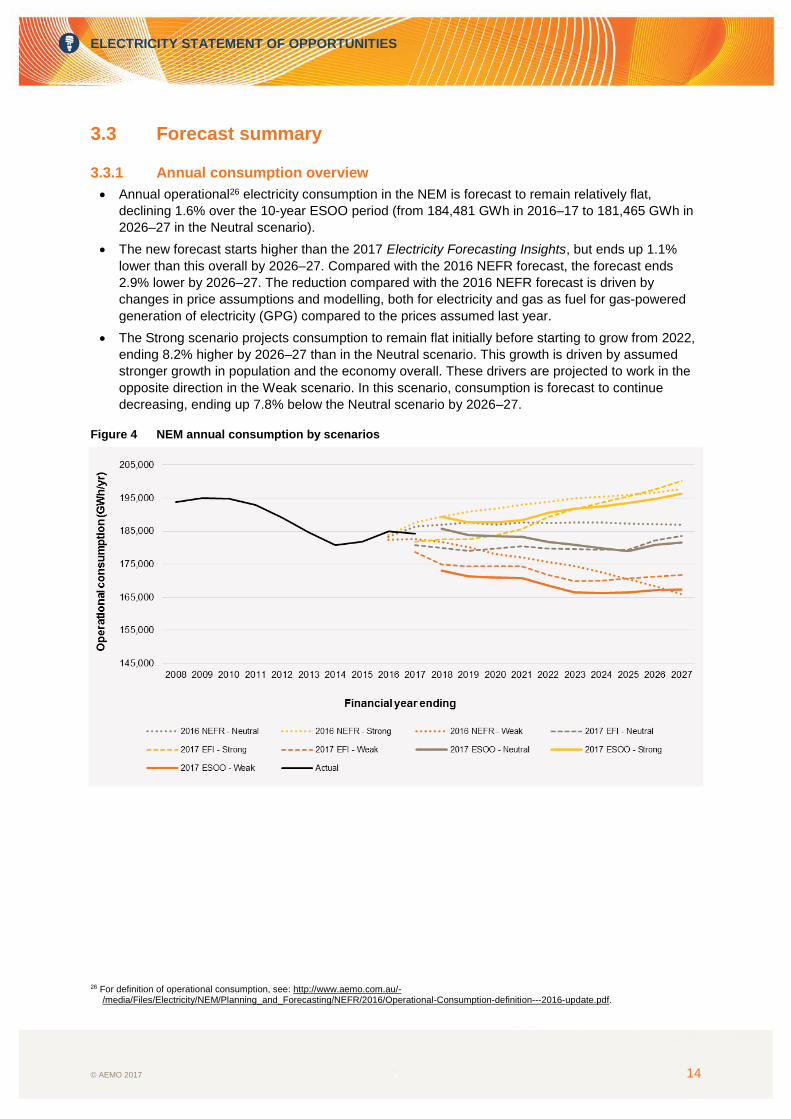
Annual operational26 electricity consumption in the NEM is forecast to remain relatively flat,
declining 1.6% over the 10-year ESOO period (from 184,481 GWh in 2016–17 to 181,465 GWh in
2026–27 in the Neutral scenario).
The new forecast starts higher than the 2017 Electricity Forecasting Insights, but ends up 1.1%
lower than this overall by 2026–27. Compared with the 2016 NEFR forecast, the forecast ends
2.9% lower by 2026–27. The reduction compared with the 2016 NEFR forecast is driven by
changes in price assumptions and modelling, both for electricity and gas as fuel for gas-powered
generation of electricity (GPG) compared to the prices assumed last year.
The Strong scenario projects consumption to remain flat initially before starting to grow from 2022,
ending 8.2% higher by 2026–27 than in the Neutral scenario. This growth is driven by assumed
stronger growth in population and the economy overall. These drivers are projected to work in the
opposite direction in the Weak scenario. In this scenario, consumption is forecast to continue
decreasing, ending up 7.8% below the Neutral scenario by 2026–27.
Figure 4 NEM annual consumption by scenarios
26 For definition of operational consumption, see: http://www.aemo.com.au/-
/media/Files/Electricity/NEM/Planning_and_Forecasting/NEFR/2016/Operational-Consumption-definition---2016-update.pdf.
ELECTRICITY STATEMENT OF OPPORTUNITIES
© AEMO 2017 15
3.3.2 Maximum demand overview
Forecast maximum operational demand:
Currently occurs, and is expected to continue occurring, in summer, driven by cooling load (in all
regions but Tasmania, where the peak is in winter, driven by heating load).
Is shifting to later in the day, when the contribution of rooftop PV is falling but temperatures remain
high (depending on the region and POE).
The updated maximum operational demand (10% POE) varies from previous forecasts:
Calibrated with latest observed maximum demand data, the new regional forecasts start slightly
lower than the 2016 NEFR forecasts in general. In New South Wales and South Australia, the
projected maximum demand is forecast to be higher by 2026–27, while the three other NEM
regions’ maximum demand forecasts remain below the 2016 NEFR forecasts throughout the
10-year outlook.
Compared to the 2017 Electricity Forecasting Insights, regional forecasts generally start at a
similar level. Queensland and Victoria follow similar trajectories, while forecast maximum
demands for New South Wales, South Australia, and Tasmania finish lower at the end of the
10-year horizon.
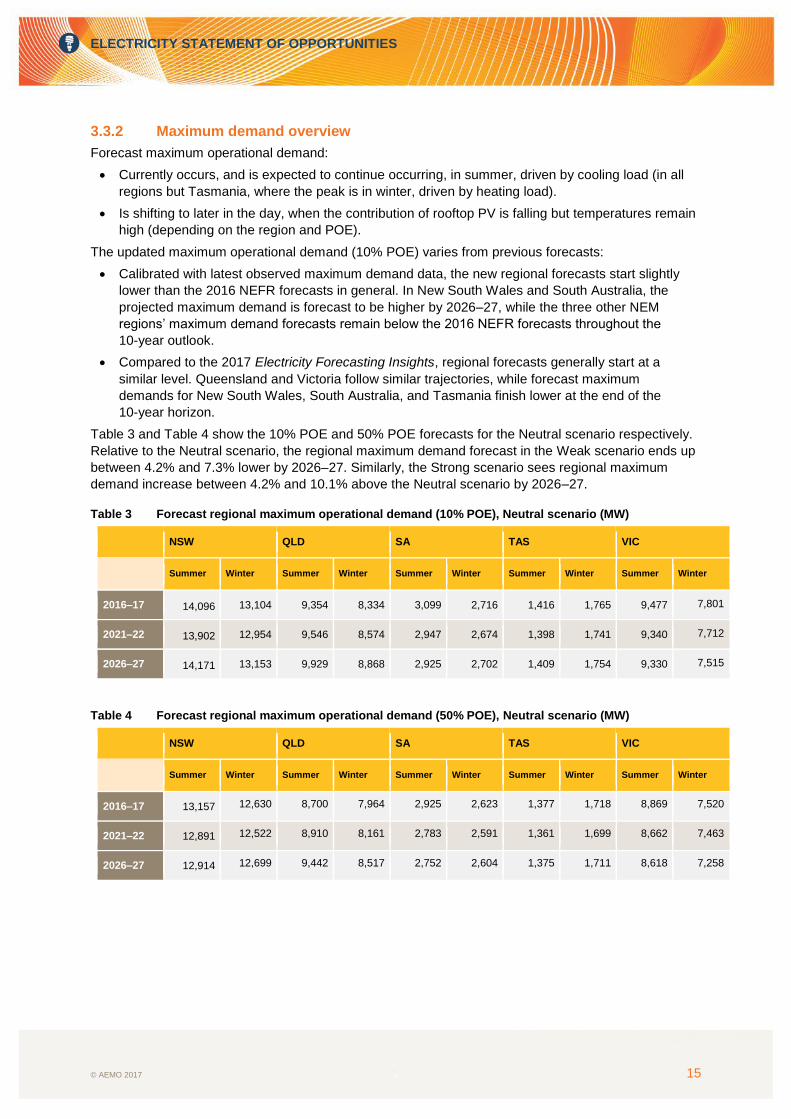
Table 3 and Table 4 show the 10% POE and 50% POE forecasts for the Neutral scenario respectively.
Relative to the Neutral scenario, the regional maximum demand forecast in the Weak scenario ends up
between 4.2% and 7.3% lower by 2026–27. Similarly, the Strong scenario sees regional maximum
demand increase between 4.2% and 10.1% above the Neutral scenario by 2026–27.
Table 3 Forecast regional maximum operational demand (10% POE), Neutral scenario (MW)
NSW QLD SA TAS VIC
Summer Winter Summer Winter Summer Winter Summer Winter Summer Winter
2016–17 14,096 13,104 9,354 8,334 3,099 2,716 1,416 1,765 9,477 7,801
2021–22 13,902 12,954 9,546 8,574 2,947 2,674 1,398 1,741 9,340 7,712
2026–27 14,171 13,153 9,929 8,868 2,925 2,702 1,409 1,754 9,330 7,515
Table 4 Forecast regional maximum operational demand (50% POE), Neutral scenario (MW)
NSW QLD SA TAS VIC
Summer Winter Summer Winter Summer Winter Summer Winter Summer Winter
2016–17 13,157 12,630 8,700 7,964 2,925 2,623 1,377 1,718 8,869 7,520
2021–22 12,891 12,522 8,910 8,161 2,783 2,591 1,361 1,699 8,662 7,463
2026–27 12,914 12,699 9,442 8,517 2,752 2,604 1,375 1,711 8,618 7,258
ELECTRICITY STATEMENT OF OPPORTUNITIES
© AEMO 2017 16
CHAPTER 4. NEM-WIDE OUTLOOK
The ESOO assesses the adequacy of existing and committed capacity, as well as new renewable
electricity supplies, to meet projected peak demands and consumption across the NEM.
Specifically, the ESOO identifies times of low reserve condition (LRC) when the NEM reliability standard
is expected to not be met. The reliability standard specifies that the level of expected USE should not
exceed 0.002% of consumption per region, in any financial year. USE exceeding the standard signals
opportunities for an efficiently operating market to adjust and respond with supply side and/or demand
responses (particularly firming capability).
This chapter of the ESOO reports on potential LRC points in each region under a range of expected
renewable build pathways, demand options, and significant generator unavailability scenarios.
4.1 NEM supply adequacy
The 2017 ESOO confirms that, without planned actions via the South Australian Energy Plan and RERT
provisions, there is a heightened risk of USE in South Australia and Victoria in peak summer periods,
with LRC under strong demand growth conditions this summer. These risks are being addressed
through the development of diesel generation in South Australia and the provision for RERT. The
analysis presented here excludes the impact of these developments, as the ESOO looks to assess the
opportunities above permanent generation reserve.
No other states have LRC points projected under the 10-year horizon, given the current committed
generator developments and retirements. The extended unavailability of a large thermal unit in either
South Australia or Victoria over the 2017–18 summer would increase projected USE significantly above
the reliability standard in both regions.
The USE risk is expected to ease from 2018–19 in South Australia and Victoria, as peak demand is
moderated by increasing rooftop PV uptake and energy efficiency, and additional large-scale renewable
generation enters the NEM.
The announced Liddell Power Station closure in 2022 is expected to materially increase the risks of
USE in New South Wales. The risk of USE in New South Wales is at its greatest in 2024–25, due to a
forecast increase in demand, while the risk in Victoria is highest (after this summer) in 2026–27. Any
additional retirements of other coal generation in New South Wales, without appropriate replacement of
firming capability, could significantly increase the risk of load shedding.
Figure 5 below summarises the range of forecast USE outcomes for each NEM region assessed to be
at risk over the forecast period. It does not show outcomes for Queensland or Tasmania, because no
material USE risk has been found in these regions across the 10-year assessment period across the
modelled scenarios.
In assessing the range of possible USE and potential for not meeting the current reliability standard in
the next 10 years, the 2017 ESOO has forecast a range of reasonable USE outcomes considering the
following key drivers:
Effect of higher demands – the projected USE risks increase if maximum demand forecasts are
higher (either through assumed higher temperature conditions or strong economic growth).
Effect of renewable investment – the projected USE risk increases if the modelling assumes
limited renewable investment. Three renewable investment pathways are modelled, given current
policy and investment uncertainty, including:
Committed and existing generation – in accordance with current industry advice, generation
operating now or that meets AEMO’s current commitment criteria.
Concentrated renewables – assumes potential additional development after 2020 is
geographically concentrated, particularly in Victoria, driven by the Victorian Renewable Energy
Target (VRET).
ELECTRICITY STATEMENT OF OPPORTUNITIES
© AEMO 2017 17
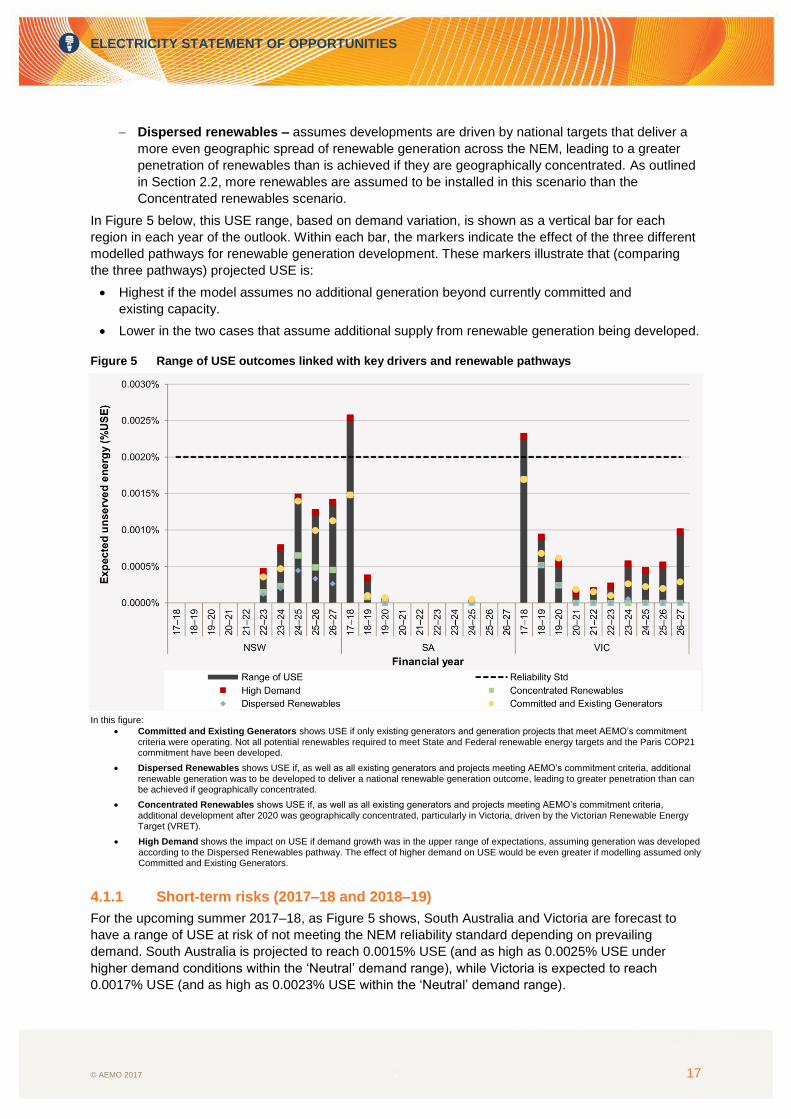
Dispersed renewables – assumes developments are driven by national targets that deliver a
more even geographic spread of renewable generation across the NEM, leading to a greater
penetration of renewables than is achieved if they are geographically concentrated. As outlined
in Section 2.2, more renewables are assumed to be installed in this scenario than the
Concentrated renewables scenario.
In Figure 5 below, this USE range, based on demand variation, is shown as a vertical bar for each
region in each year of the outlook. Within each bar, the markers indicate the effect of the three different
modelled pathways for renewable generation development. These markers illustrate that (comparing
the three pathways) projected USE is:
Highest if the model assumes no additional generation beyond currently committed and
existing capacity.
Lower in the two cases that assume additional supply from renewable generation being developed.
Figure 5 Range of USE outcomes linked with key drivers and renewable pathways
In this figure:
Committed and Existing Generators shows USE if only existing generators and generation projects that meet AEMO’s commitment criteria were operating. Not all potential renewables required to meet State and Federal renewable energy targets and the Paris COP21 commitment have been developed.
Dispersed Renewables shows USE if, as well as all existing generators and projects meeting AEMO’s commitment criteria, additional renewable generation was to be developed to deliver a national renewable generation outcome, leading to greater penetration than can be achieved if geographically concentrated.
Concentrated Renewables shows USE if, as well as all existing generators and projects meeting AEMO’s commitment criteria, additional development after 2020 was geographically concentrated, particularly in Victoria, driven by the Victorian Renewable Energy Target (VRET).
High Demand shows the impact on USE if demand growth was in the upper range of expectations, assuming generation was developed according to the Dispersed Renewables pathway. The effect of higher demand on USE would be even greater if modelling assumed only Committed and Existing Generators.
4.1.1 Short-term risks (2017–18 and 2018–19)
For the upcoming summer 2017–18, as Figure 5 shows, South Australia and Victoria are forecast to
have a range of USE at risk of not meeting the NEM reliability standard depending on prevailing
demand. South Australia is projected to reach 0.0015% USE (and as high as 0.0025% USE under
higher demand conditions within the ‘Neutral’ demand range), while Victoria is expected to reach
0.0017% USE (and as high as 0.0023% USE within the ‘Neutral’ demand range).
ELECTRICITY STATEMENT OF OPPORTUNITIES
© AEMO 2017 18
The balance of supply and demand in these two regions is sufficiently tight that there is a material risk
the reliability standard could be exceeded this summer without the actions currently planned through
the South Australian Energy Plan and the RERT.
Without these actions, in 2017–18:
In Victoria, the likelihood of a shortfall is between 39% and 43%. The average shortfall projected is
likely to be between 218 MW and 229 MW, but could reach 760 MW. If USE occurs, it is likely to
last for four to five hours.
In South Australia, the likelihood of a shortfall is between 26% and 33%. The average shortfall
projected is likely to be between 81 MW and 97 MW, but could reach 243 MW. If USE occurs, it is
likely to last for two to four hours.
From 2018–19, the risk of USE in these regions drops noticeably compared to the coming summer,
because a number of committed generation projects are due to be commissioned, while forecast
maximum demand is projected to reduce due to ongoing energy efficiency and installation of PV
systems by consumers.
Compared to the ESOO released in November 2016, the risk of USE from 2018–19 onwards has
reduced, based on changed modelling assumptions on generation fleet, such as more renewable
capacity and greater uptake of rooftop PV. Forecast maximum demand has also changed and is now
relatively flat compared with the November 2016 ESOO.
Thermal generation outage
Generators provide forecast availability (within a 24-hour recall period) of their generators via AEMO’s
Projected Assessment of System Adequacy (PASA)27 functions. These projections reflect changing
conditions and generator outage plans over the next two years, and are provided by generators more
frequently than the Generator Information surveys which inform the ESOO’s 10-year supply projections.
Currently, the Medium Term PASA (MT PASA) projects that some large thermal units in South Australia
will be unavailable during the coming 2017–18 summer, reducing the generator availability in South
Australia assumed in ESOO modelling by about 240 MW.28
The balance of supply and demand in Victoria and South Australia is sufficiently tight that the extended
unavailability of any further capacity, delays in connection of renewable generation, or failures in
generator fuel supplies over the peak summer months would likely lead to further supply shortfalls, well
above the reliability standard.
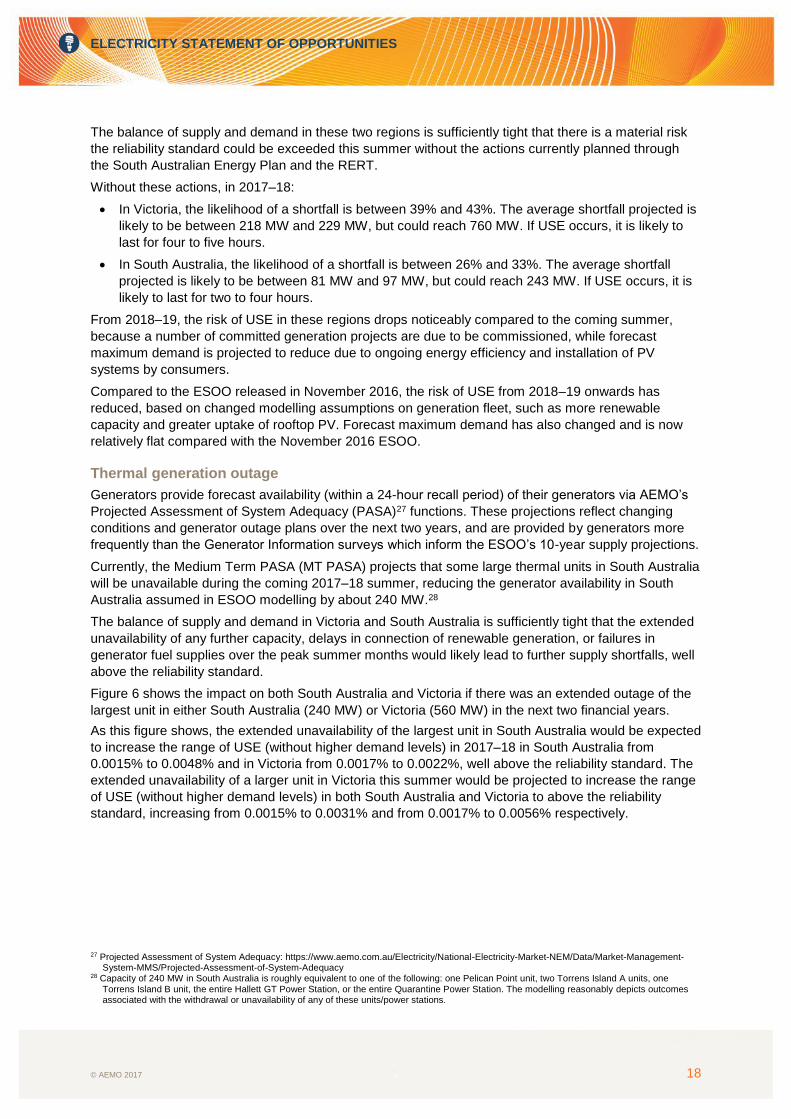
Figure 6 shows the impact on both South Australia and Victoria if there was an extended outage of the
largest unit in either South Australia (240 MW) or Victoria (560 MW) in the next two financial years.
As this figure shows, the extended unavailability of the largest unit in South Australia would be expected
to increase the range of USE (without higher demand levels) in 2017–18 in South Australia from
0.0015% to 0.0048% and in Victoria from 0.0017% to 0.0022%, well above the reliability standard. The
extended unavailability of a larger unit in Victoria this summer would be projected to increase the range
of USE (without higher demand levels) in both South Australia and Victoria to above the reliability
standard, increasing from 0.0015% to 0.0031% and from 0.0017% to 0.0056% respectively.
27 Projected Assessment of System Adequacy: https://www.aemo.com.au/Electricity/National-Electricity-Market-NEM/Data/Market-Management-
System-MMS/Projected-Assessment-of-System-Adequacy 28 Capacity of 240 MW in South Australia is roughly equivalent to one of the following: one Pelican Point unit, two Torrens Island A units, one
Torrens Island B unit, the entire Hallett GT Power Station, or the entire Quarantine Power Station. The modelling reasonably depicts outcomes associated with the withdrawal or unavailability of any of these units/power stations.
ELECTRICITY STATEMENT OF OPPORTUNITIES
© AEMO 2017 19
Figure 6 Impact of extended unavailability of largest unit on USE outcomes
In this figure:
Dispersed Renewables shows USE if, as well as all existing generators and projects meeting AEMO’s commitment criteria, additional
renewable generation was to be developed to deliver a national renewable generation outcome, leading to greater penetration than can be achieved if geographically concentrated.
SA Outage case refers to the impact of an extended outage of the largest unit (240 MW) in Victoria on top of the Dispersed Renewables
development. The effect of an outage on USE with only committed and existing generators or higher demand would be even greater.
VIC Outage case refers to the impact of an extended outage of the largest unit (560 MW) in Victoria on top of the Dispersed
Renewables developments. The effect of an extended outage on USE with only committed and existing generators or higher demand would be even greater.
There are a number of actions that the government sector and AEMO are taking in summer 2017–18 to
mitigate the risk of involuntary load shedding. Among these are the acquisition of emergency reserves
through long notice RERT and a demand response proof of concept with ARENA. Long notice RERT is
not available after the coming summer and AEMO is separately reviewing substitute mechanisms.
4.1.2 Longer-term risks (after 2022 Liddell retirement)
The risk of USE is projected to increase in New South Wales and Victoria after Liddell Power Station
closes (announced for 2022):
The greatest risk in New South Wales is predicted in 2024–25, reaching up to 0.0015% USE.
The likelihood is between 29% and 46% that USE will eventuate in New South Wales in 2024–25,
averaging from 224–290 MW and lasting from two to six hours (depending on supply and
demand variations).
The risk of USE also increases in Victoria, reaching up to 0.0010% USE by 2026–27.
The continued availability of all existing generation, in line with the announced expectations of
generators, is important to managing projected USE.
Forecast growth in renewable generation to meet state and federal policies, combined with a flat
consumption outlook in the NEM, is projected to result in reduced utilisation of thermal (coal and gas)
plants over the 10-year period.
Depending on generator bidding strategies, this will likely impact not only peaking and mid-merit GPG,
but potentially also low-cost coal generation. Any loss in production by these generators may lead to
lower overall market revenues, and potentially higher operating costs associated with the reduced
ELECTRICITY STATEMENT OF OPPORTUNITIES
© AEMO 2017 20
operation. Competitive influences on generator profitability could increase the risk of additional thermal
capacity exiting the market earlier than projected.
Loss of further thermal generation
AEMO has assessed the expected USE if the Liddell Power Station closure was not isolated, and found
that, if a second large power station in New South Wales was to close in 2022–23, there is a significant
risk of an LRC.
AEMO’s assessment shows that closures of additional generation capacity, if not replaced by firm
capacity or demand response, would increase the risks of the reliability standard not being met.
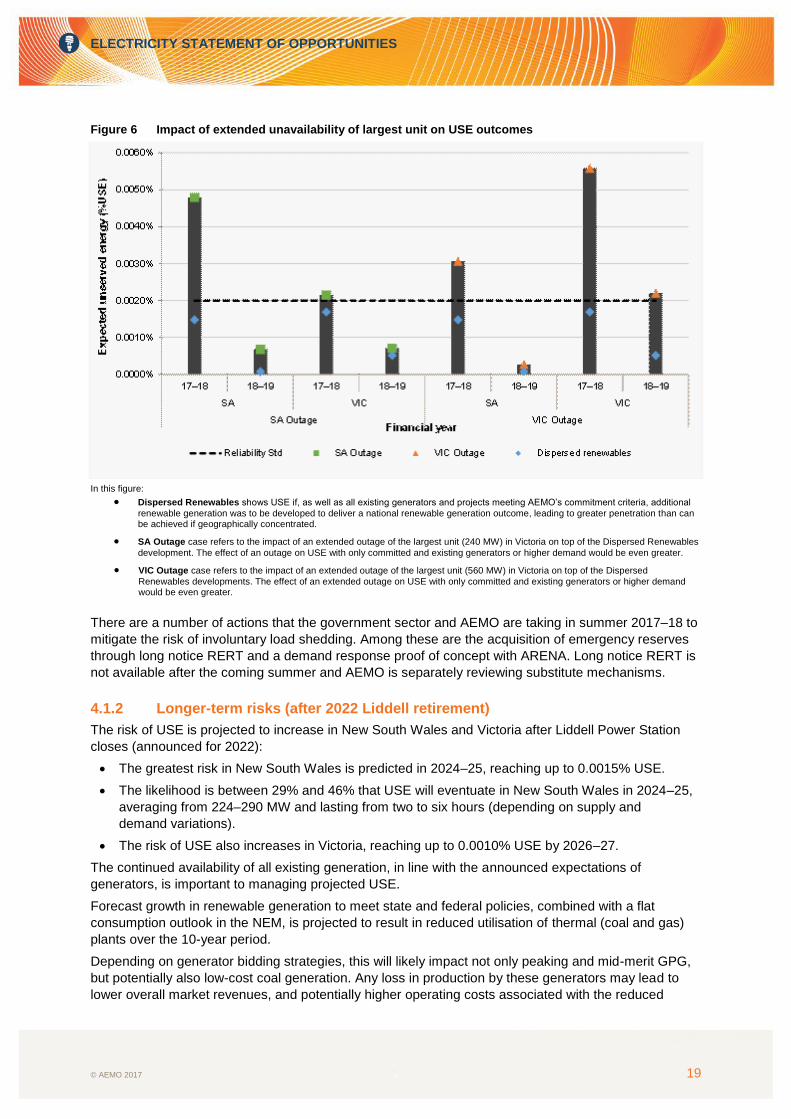
Figure 7 shows the impact on New South Wales USE forecasts of a further thermal power station
(assumed to be a 1,320 MW station in New South Wales) retiring a year after the expected 2022
retirement of Liddell. Without additional investments, this would be expected to lead to the reliability
standard being exceeded significantly in the region from that year onwards.
Figure 7 Expected USE in New South Wales with retirement of additional coal power station
In this figure:
Dispersed Renewables shows USE if, as well as all existing generators and projects meeting AEMO’s commitment criteria, additional
renewable generation was to be developed to deliver a national renewable generation outcome, leading to greater penetration than can be achieved if geographically concentrated.
NSW additional retirement investigates the potential impact of a further retirement of a major coal-fired power station in New South
Wales after the announced retirement of Liddell Power Station, without replacement firm capacity.
Loss of upstream facilities
Given the tight supply-demand balance, risks are heightened that failures in generator fuel supplies
could have significant consequences to electricity supplies.
For example, a failure at key gas processing facilities, such as Longford Gas Plant29, may impact on the
ability for GPG to operate when required. Longford is key to meeting daily gas demand for electricity
29 The Longford Gas Plant in Victoria, which processes gas from offshore gas fields in the Gippsland Basin, is a primary hub for gas distributed to
Australian Capital Territory & New South Wales (via the Eastern Gas Pipeline), Victoria and South Australia (via the Longford to Melbourne Pipeline) and to Tasmania (via the Tasmanian Gas Pipeline).

ELECTRICITY STATEMENT OF OPPORTUNITIES
© AEMO 2017 21
generation, as well as residential, commercial and industrial gas demands across eastern and south
eastern Australia. A multi-day outage at the plant would result in a shortage of gas across the region
and would require significant curtailment of gas loads until normal plant operations resumed. Depending
on the timing of any such failure, there is an increased likelihood of USE.
ELECTRICITY STATEMENT OF OPPORTUNITIES
© AEMO 2017 22
CHAPTER 5. REGIONAL OUTLOOK
This chapter provides a supply adequacy overview for each NEM region, including:
Overview of trends and projections.
Summary of generation changes and investment trends.
The supply-demand outlook, highlighting any LRC points and projected USE.
5.1 New South Wales
Overview
The 2017 ESOO projects:
The reliability standard would be met in New South Wales throughout the modelled period under
expected demand variation or renewable build pathways.
The risk of USE in New South Wales is greatest after the retirement of Liddell Power Station
(announced for 2022), reaching up to 0.0015% in 2024–25.
Loss of an additional major power station in New South Wales after Liddell withdraws could lead to
an LRC, unless sufficient additional firming capability is developed in time.
Generation changes and investment trends
Since the 2016 ESOO, no new generation withdrawals have been announced in New South Wales
and 135 MW of new solar generation has met AEMO’s commitment criteria, totalling 318 MW of
committed generation.
Additionally, the capacity of all new development projects proposed in New South Wales currently
totals 5,833 MW.30
The 2017 ESOO renewable pathways are informed by the current proposed generation alongside
federal and state renewable incentives:
The Concentrated renewables pathway assumes an additional 1,393 MW of renewables above
Committed and Existing generation.
The Dispersed renewables pathway assumes an additional 2,903 MW of renewables
above Committed and Existing generation.
Snowy Hydro 2.0 is not included in the 2017 ESOO due to a timetable informed by the current feasibility
study, aiming to be finalised by December 2017.31
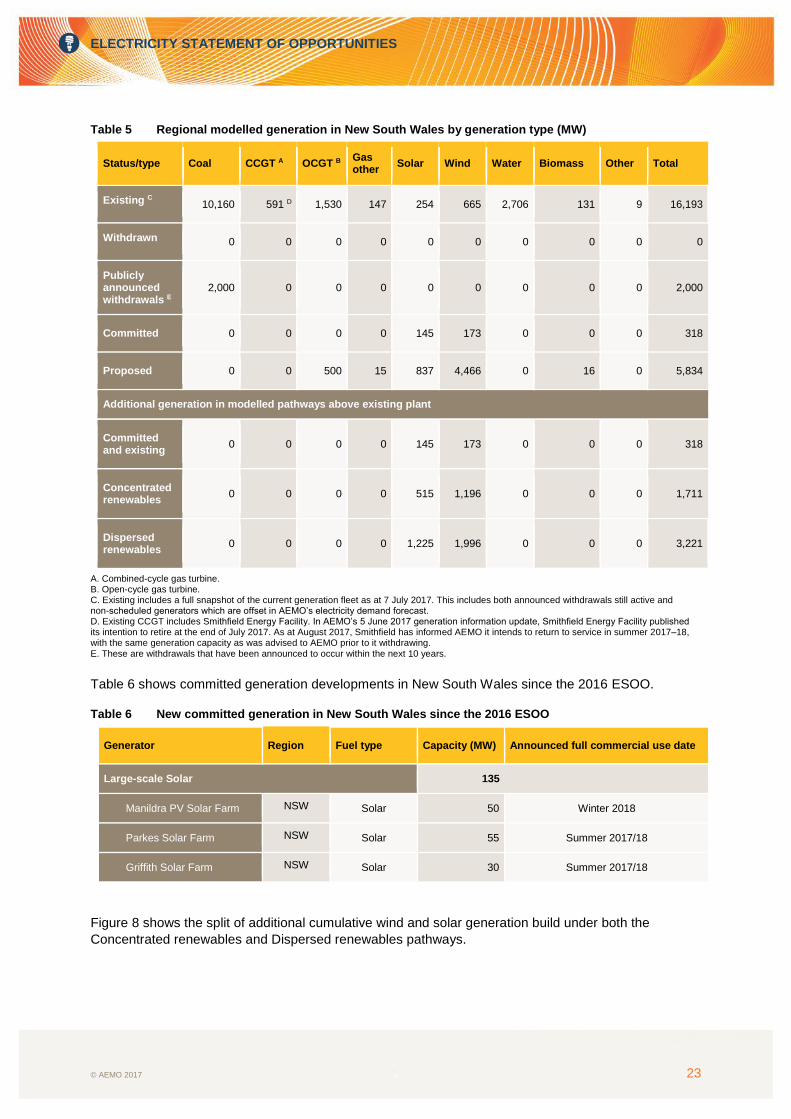
Table 5 shows modelled capacities in New South Wales by generation type, including additional
capacities assumed in the Committed and Existing, Concentrated renewables and Dispersed
renewables pathways over the 10-year horizon.
30 AEMO. Generation Information update, published 5 June 2017. Available at: https://www.aemo.com.au/Electricity/National-Electricity-Market-
NEM/Planning-and-forecasting/Generation-information. 31 Snowy Hydro 2.0 Frequently asked Questions. Available at http://www.snowyhydro.com.au/our-scheme/snowy20/snowy-2-0-faqs/.
ELECTRICITY STATEMENT OF OPPORTUNITIES
© AEMO 2017 23
Table 5 Regional modelled generation in New South Wales by generation type (MW)
Status/type Coal CCGT A OCGT B Gas other
Solar Wind Water Biomass Other Total
Existing C 10,160 591 D 1,530 147 254 665 2,706 131 9 16,193
Withdrawn 0 0 0 0 0 0 0 0 0 0
Publicly announced withdrawals E
2,000 0 0 0 0 0 0 0 0 2,000
Committed 0 0 0 0 145 173 0 0 0 318
Proposed 0 0 500 15 837 4,466 0 16 0 5,834
Additional generation in modelled pathways above existing plant
Committed and existing
0 0 0 0 145 173 0 0 0 318
Concentrated renewables
0 0 0 0 515 1,196 0 0 0 1,711
Dispersed renewables
0 0 0 0 1,225 1,996 0 0 0 3,221
A. Combined-cycle gas turbine. B. Open-cycle gas turbine. C. Existing includes a full snapshot of the current generation fleet as at 7 July 2017. This includes both announced withdrawals still active and non-scheduled generators which are offset in AEMO’s electricity demand forecast. D. Existing CCGT includes Smithfield Energy Facility. In AEMO’s 5 June 2017 generation information update, Smithfield Energy Facility published its intention to retire at the end of July 2017. As at August 2017, Smithfield has informed AEMO it intends to return to service in summer 2017–18, with the same generation capacity as was advised to AEMO prior to it withdrawing. E. These are withdrawals that have been announced to occur within the next 10 years.
Table 6 shows committed generation developments in New South Wales since the 2016 ESOO.
Table 6 New committed generation in New South Wales since the 2016 ESOO
Generator Region Fuel type Capacity (MW) Announced full commercial use date
Large-scale Solar 135
Manildra PV Solar Farm NSW Solar 50 Winter 2018
Parkes Solar Farm NSW Solar 55 Summer 2017/18
Griffith Solar Farm NSW Solar 30 Summer 2017/18
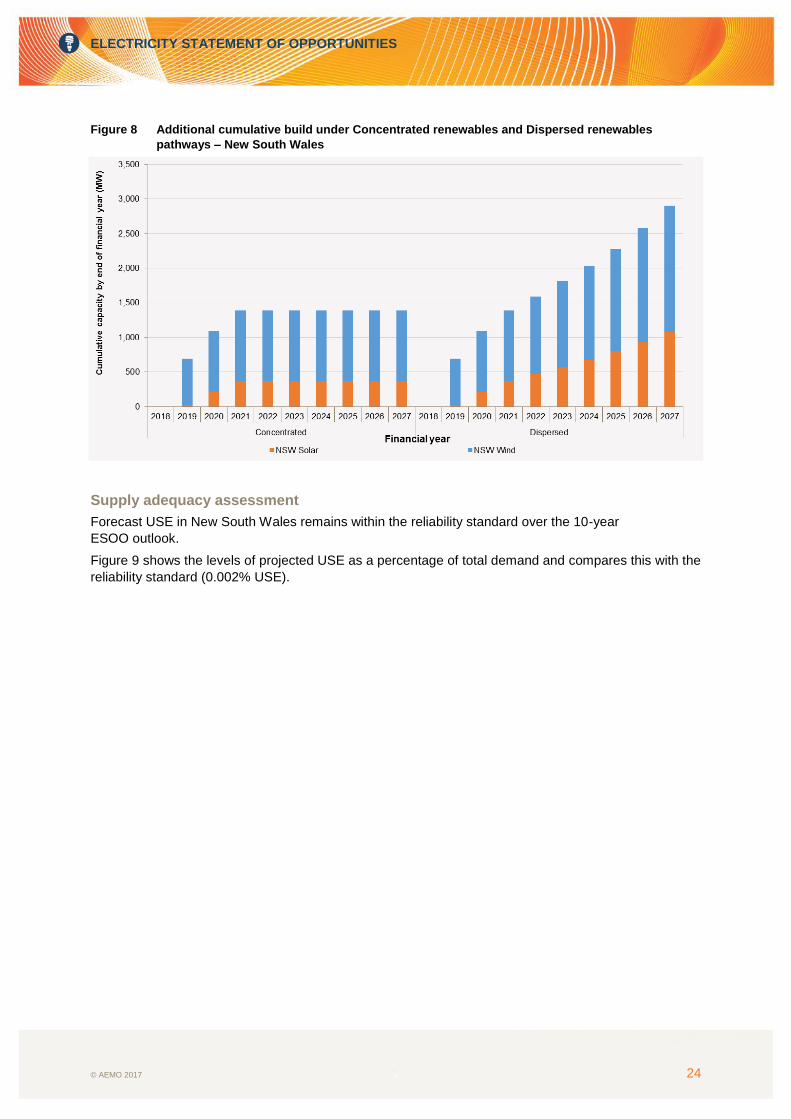
Figure 8 shows the split of additional cumulative wind and solar generation build under both the
Concentrated renewables and Dispersed renewables pathways.
ELECTRICITY STATEMENT OF OPPORTUNITIES
© AEMO 2017 24
Figure 8 Additional cumulative build under Concentrated renewables and Dispersed renewables
pathways – New South Wales
Supply adequacy assessment
Forecast USE in New South Wales remains within the reliability standard over the 10-year
ESOO outlook.
Figure 9 shows the levels of projected USE as a percentage of total demand and compares this with the
reliability standard (0.002% USE).

ELECTRICITY STATEMENT OF OPPORTUNITIES
© AEMO 2017 25
Figure 9 New South Wales supply adequacy
In this figure:
Committed and Existing Generators includes all existing generators and committed projects that meet AEMO’s commitment criteria.
Not all potential renewables required to meet State and Federal renewable energy targets and the Paris COP21 commitments are developed.
Dispersed Renewables shows USE if, as well as all existing generators and projects meeting AEMO’s commitment criteria, additional
renewable generation was to be developed to deliver a national renewable generation outcome, leading to greater penetration than can be achieved if geographically concentrated.
Concentrated Renewables shows USE if, as well all existing generators and committed projects that meet AEMO’s commitment
criteria, potential additional development after 2020 was geographically concentrated particularly in Victoria, driven by the Victorian Renewable Energy Target (VRET).
High Demand shows the impact on USE if demand growth was in the upper range of expectations, assuming generation was developed
according to the Dispersed Renewables pathway. The effect of higher demand on USE would be even greater if modelling assumed only Committed and Existing Generators.
USE is projected to be highest in 2024–25, where expected USE spans up to 0.0015%. The likelihood
of USE in 2024–25 ranges between 29% and 46% and could last from two to six hours, depending on
supply and demand conditions.
The increased risk of USE in New South Wales is driven by the retirement of Liddell Power Station
(announced to retire in 2022) and an increase in forecast maximum demand.
Forecast increases in appliance uptake, cooling load, and population put upward pressure on demand
throughout the 10-year period, but are offset by projected increases in installed rooftop PV, leading to
little net increase in demand until 2024. After 2024, the time of maximum demand is forecast to be
delayed until after sunset where the effect of PV on peak demand is forecast plateau. Without the PV
offset, increases in underlying demand leads to a net increase in forecast demand.32
Loss of further thermal generation
AEMO has assessed the likely expected USE if the Liddell Power Station closure was not isolated, and
another large power station in New South Wales (assumed to be 1,320 MW) was to retire alongside
Liddell Power Station in 2022–23.
32 AEMO. 2017 Energy Forecasting Insights. Available at: https://www.aemo.com.au/Electricity/National-Electricity-Market-NEM/Planning-and-
forecasting/Electricity-Forecasting-Insights/Summary-Forecasts/Maximum-and-minimum-demand.

ELECTRICITY STATEMENT OF OPPORTUNITIES
© AEMO 2017 26
Figure 11 shows that the closure of additional generation capacity, if not replaced by suitable firm
capacity or demand response, would increase the risks of an LRC with USE reaching up to 0.0054% in
2023–24 and increasing to a maximum of 0.0083% in 2024–25.
Without additional investments, this would be expected to lead to the reliability standard being exceed
significantly in the region from that year onwards.
Figure 10 Expected USE in New South Wales with retirement of additional coal unit
In this figure:
Dispersed Renewables includes all existing generators and committed projects that meet AEMO’s commitment criteria, as well as
potential additional renewable generation to deliver nationally coordinated renewable generation in line with currently announced state-based renewable targets.
NSW additional retirement investigates the potential impact of a further retirement of a major coal fired power station in New South
Wales after the announced retirement of Liddell Power Station, without replacement firm capacity.
5.2 Queensland
Overview
Under expected conditions, no LRC is projected in Queensland throughout the modelled period, with
the risk of USE being very low.
Generation changes and investment trends
Since the 2016 ESOO, no new generation withdrawals have been announced in Queensland and
committed generation has grown to include 44 MW of new renewables generation, increasing
committed generation to 463 MW.
Additionally, the capacity of all new development projects proposed in Queensland currently
totals 7,088 MW.
The 2017 ESOO renewable pathways are informed by the current proposed generation alongside
federal and state renewable incentives:

ELECTRICITY STATEMENT OF OPPORTUNITIES
© AEMO 2017 27
The Concentrated renewables pathway assumes an additional 1,173 MW of renewables above
Committed and existing generation.
The Dispersed renewables pathway assumes an additional 2,962 MW of renewables above
Committed and existing generation.
Table 7 shows the modelled capacities in Queensland by generation type, including the additional
capacities assumed in the Committed and existing, Concentrated renewables, and Dispersed
renewables pathway scenarios.
Table 7 Regional modelled generation in Queensland by generation type (MW)
Status/type Coal CCGT A OCGT B Gas other Solar Wind Water Biomass Other Total
Existing C 8,186 1,596D 1,895 208 20 12 664 367 1 12,949
Withdrawn -30 0 0 0 0 0 0 0 0 -30
Publicly announced withdrawals E
0 0 34 30 0 0 0 0 0 64
Committed F 0 0 0 0 278 181 4 0 0 463
Proposed 0 0 2,045 0 3,763 809 250 198 24 7,089
Additional generation in modelled pathways above existing plant
Committed and existing 0 0 0 0 265 181 0 0 0 446
Concentrated renewables 0 0 0 0 1,238 381 0 0 0 1,619
Dispersed renewables 0 0 0 0 2,431 977 0 0 0 3,408
A. Combined-cycle gas turbine. B. Open-cycle gas turbine. C. Existing includes a full snapshot of the current generation fleet as at 7 July 2017. This includes both announced withdrawals still active and non-scheduled generators which are offset in AEMO’s electricity demand forecast. D. Existing CCGT includes Swanbank E, which has informed the market it intends to return to service by Q1 2018. E. These are withdrawals that have been announced to occur within the next 10 years. F. Queensland’s committed projects include non-scheduled generators. Non-scheduled generators are offset in the electricity demand forecast and are not included in the generation build pathways.
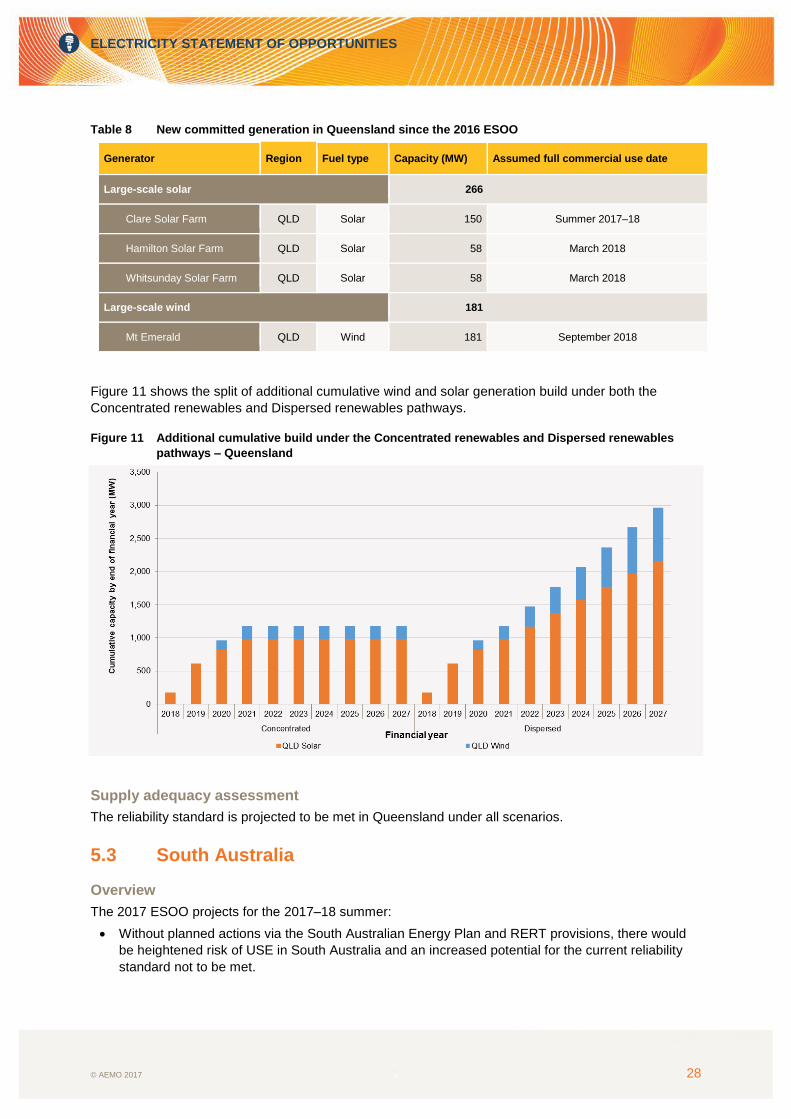
Table 8 shows committed generation developments in Queensland since the 2016 ESOO.
ELECTRICITY STATEMENT OF OPPORTUNITIES
© AEMO 2017 28
Table 8 New committed generation in Queensland since the 2016 ESOO
Generator Region Fuel type Capacity (MW) Assumed full commercial use date
Large-scale solar 266
Clare Solar Farm QLD Solar 150 Summer 2017–18
Hamilton Solar Farm QLD Solar 58 March 2018
Whitsunday Solar Farm QLD Solar 58 March 2018
Large-scale wind 181
Mt Emerald QLD Wind 181 September 2018
Figure 11 shows the split of additional cumulative wind and solar generation build under both the
Concentrated renewables and Dispersed renewables pathways.
Figure 11 Additional cumulative build under the Concentrated renewables and Dispersed renewables
pathways – Queensland
Supply adequacy assessment
The reliability standard is projected to be met in Queensland under all scenarios.
5.3 South Australia
Overview
The 2017 ESOO projects for the 2017–18 summer:
Without planned actions via the South Australian Energy Plan and RERT provisions, there would
be heightened risk of USE in South Australia and an increased potential for the current reliability
standard not to be met.
ELECTRICITY STATEMENT OF OPPORTUNITIES
© AEMO 2017 29
There is a 26% to 33% likelihood of USE occurring in South Australia, resulting in an expected
USE in the range between 0.0015% and 0.0025%, and in an LRC under strong demand growth.
If South Australia was to lose equivalent capacity to its largest generating unit (240 MW)
this summer:
The range of USE in South Australia could be up to 0.0048% (136 MW for four to five hours per
year) and result in an LRC.
The likelihood of USE occurring would increase to a maximum of 41%.
Generation changes and investment trends
Since the 2016 ESOO, no new generation withdrawals have been announced in South Australia and
220 MW of new solar generation and 109 MW of new wind generation has met AEMO’s commitment
criteria, totalling 329 MW of new committed generation.
Additionally, the capacity of all new development projects proposed in South Australia currently totals
5,285 MW.
From the South Australian Energy Plan, the 2017 ESOO modelling has:
Included the reliability portion of the 129 megawatt hours (MWh)/100 MW battery (120 MWh/
30 MW) for summer 2017–18.33
Not included the impact of temporary diesel generation in South Australia, and its subsequent
planned conversion to a state-owned gas generator,34 as the ESOO looks to assess the
opportunities above permanent generation reserve.
The 2017 ESOO has also not included ElectraNet’s 30 MW battery.35
The renewable pathways are informed by the current proposed generation alongside federal and state
renewable incentives:
The Concentrated renewables pathway assumes an additional 657 MW of renewables above
Committed and existing generation.
The Dispersed renewables pathway assumes an additional 1,437 MW of renewables above
Committed and existing generation.
Table 9 shows the modelled capacities in South Australia by generation type, including the
additional capacity built in the Committed and existing, Concentrated renewables, and Dispersed
renewables pathways.
33 The configuration of the battery storage project under development by the South Australian government, partnered with Tesla and Neoen, is
subject to change.
34 Available at: http://ourenergyplan.sa.gov.au/gas-power-plant.html. 35 ElectraNet’s Battery Storage Project: Available at: https://arena.gov.au/blog/southaustraliabattery/.

ELECTRICITY STATEMENT OF OPPORTUNITIES
© AEMO 2017 30
Table 9 Regional modelled generation in South Australia by generation type (MW)
Status/type Coal CCGT A OCGT B Gas other
Solar Wind Water Biomass Other Total
Existing C 0 658D 915 1,280 0 1,595 3 18 129 4,598
Withdrawn 0 0 0 0 0 0 0 0 0 0
Publicly announced withdrawals E
0 0 0 0 0 0 0 0 0 0
Committed 0 0 0 0 220 211 F 0 0 0 431
Proposed 0 460 320 0 1,295 2,966 200 15 29 5,285
Additional generation in modelled pathways above existing plant
Committed and existing 0 0 0 0 220 211 0 0 0 431
Concentrated renewables 0 0 0 0 465 623 0 0 0 1,088
Dispersed renewables 0 0 0 0 845 1,023 0 0 0 1,868
A. Combined-cycle gas turbine. B. Open-cycle gas turbine. C. Existing includes a full snapshot of the current generation fleet as at 7 July 2017. This includes both announced withdrawals still active and non-scheduled generators which are offset in AEMO’s electricity demand forecast. D. Existing CCGT includes the full capacity of Pelican Point. E. These are withdrawals that have been announced to occur within the next 10 years. F. This includes Hornsdale 2, which has since commenced commercial operation.
Table 10 shows all committed renewable generation developments since the 2016 ESOO.
Table 10 New committed generation in South Australia since the 2016 ESOO
Generator Region Fuel type Capacity (MW) Assumed full commercial use date
Large-scale solar 220
Bungala One SA Solar 110 August 2018
Bungala Two SA Solar 110 Summer 2018–19
Large-scale wind 109
Hornsdale Wind Farm Stage 3 SA Wind 109 Summer 2017–18
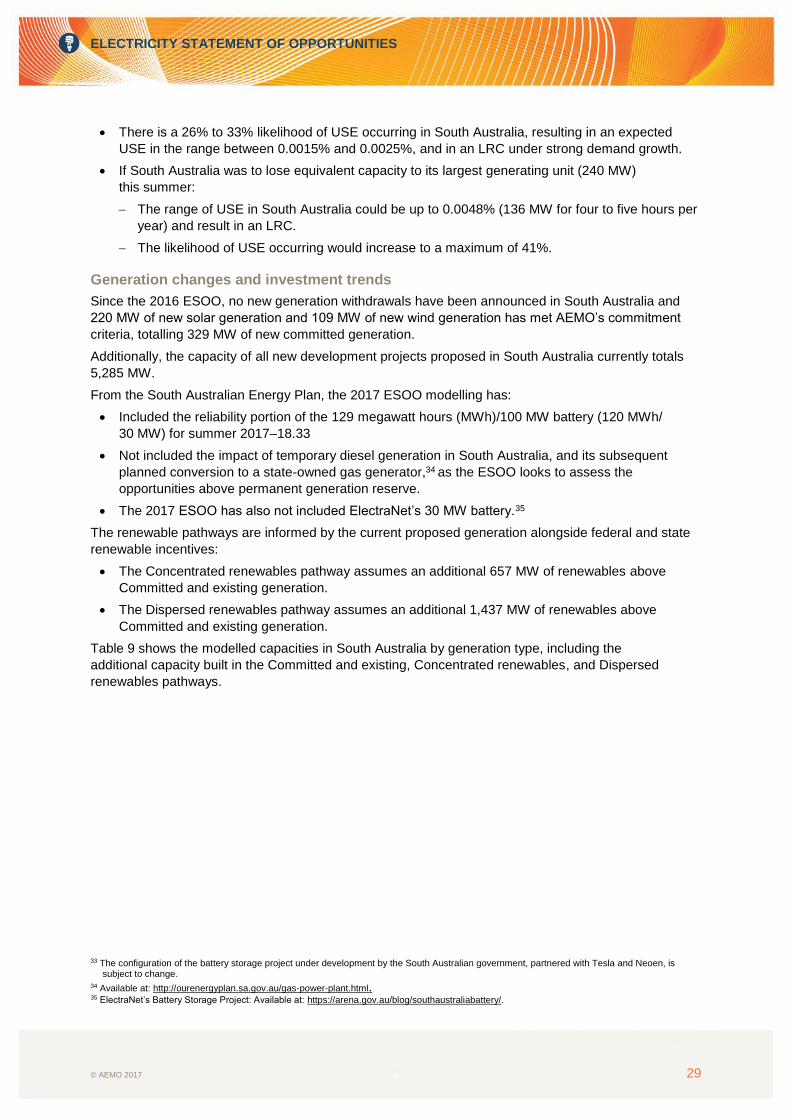
Figure 12 shows the split of additional cumulative wind and solar generation build under both the
Concentrated renewables and Dispersed renewables pathways.
ELECTRICITY STATEMENT OF OPPORTUNITIES
© AEMO 2017 31
Figure 12 Additional cumulative build under the Concentrated renewables and Dispersed renewables
pathways – South Australia
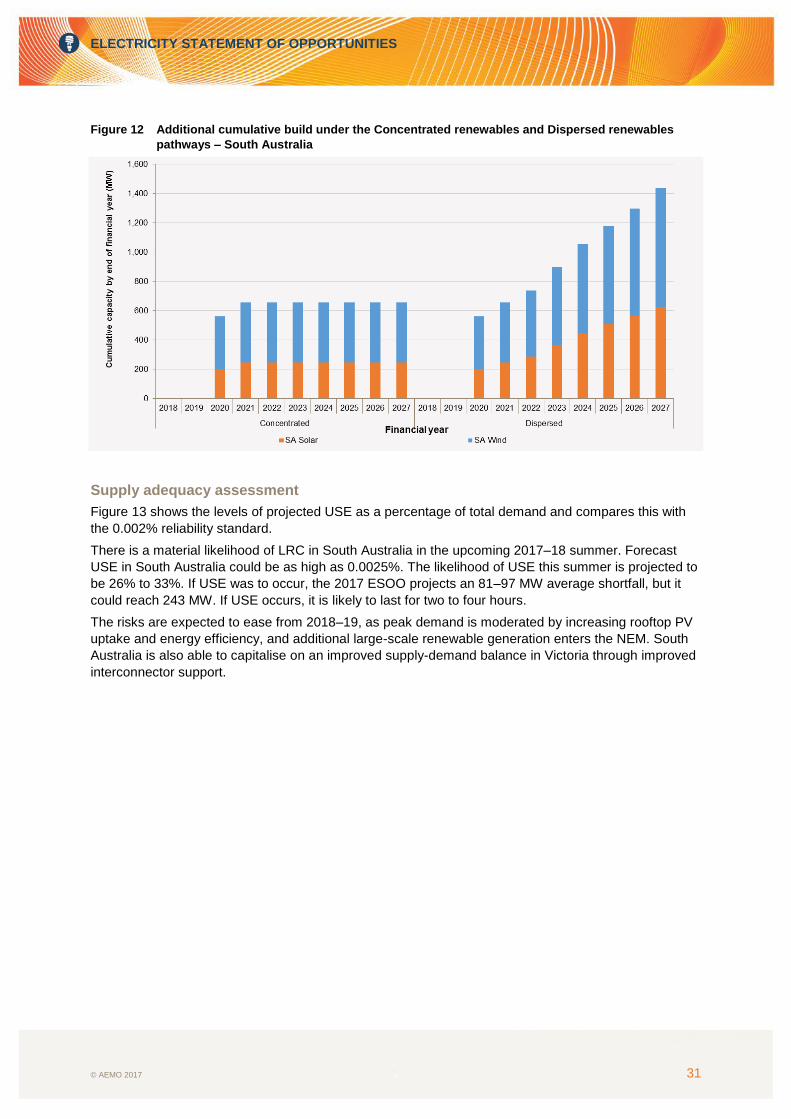
Supply adequacy assessment
Figure 13 shows the levels of projected USE as a percentage of total demand and compares this with
the 0.002% reliability standard.
There is a material likelihood of LRC in South Australia in the upcoming 2017–18 summer. Forecast
USE in South Australia could be as high as 0.0025%. The likelihood of USE this summer is projected to
be 26% to 33%. If USE was to occur, the 2017 ESOO projects an 81–97 MW average shortfall, but it
could reach 243 MW. If USE occurs, it is likely to last for two to four hours.
The risks are expected to ease from 2018–19, as peak demand is moderated by increasing rooftop PV
uptake and energy efficiency, and additional large-scale renewable generation enters the NEM. South
Australia is also able to capitalise on an improved supply-demand balance in Victoria through improved
interconnector support.
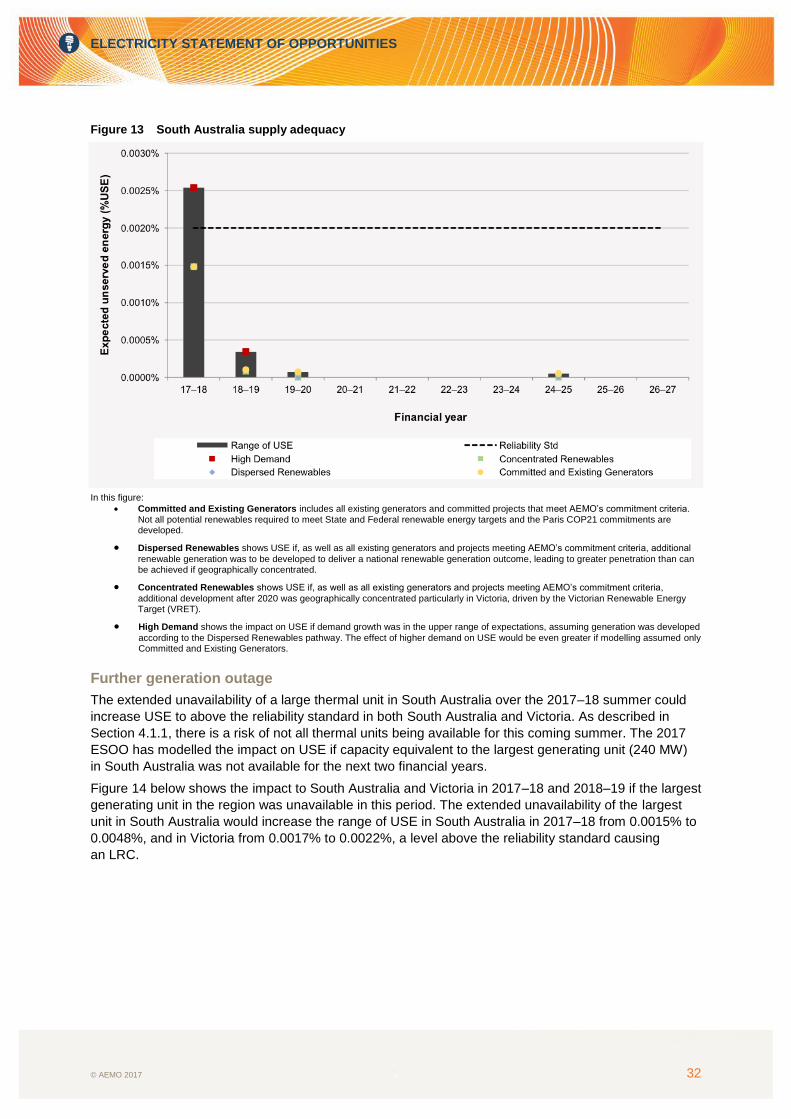
ELECTRICITY STATEMENT OF OPPORTUNITIES
© AEMO 2017 32
Figure 13 South Australia supply adequacy
In this figure:
Committed and Existing Generators includes all existing generators and committed projects that meet AEMO’s commitment criteria. Not all potential renewables required to meet State and Federal renewable energy targets and the Paris COP21 commitments are developed.
Dispersed Renewables shows USE if, as well as all existing generators and projects meeting AEMO’s commitment criteria, additional
renewable generation was to be developed to deliver a national renewable generation outcome, leading to greater penetration than can be achieved if geographically concentrated.
Concentrated Renewables shows USE if, as well as all existing generators and projects meeting AEMO’s commitment criteria,
additional development after 2020 was geographically concentrated particularly in Victoria, driven by the Victorian Renewable Energy Target (VRET).
High Demand shows the impact on USE if demand growth was in the upper range of expectations, assuming generation was developed
according to the Dispersed Renewables pathway. The effect of higher demand on USE would be even greater if modelling assumed only Committed and Existing Generators.
Further generation outage
The extended unavailability of a large thermal unit in South Australia over the 2017–18 summer could
increase USE to above the reliability standard in both South Australia and Victoria. As described in
Section 4.1.1, there is a risk of not all thermal units being available for this coming summer. The 2017
ESOO has modelled the impact on USE if capacity equivalent to the largest generating unit (240 MW)
in South Australia was not available for the next two financial years.
Figure 14 below shows the impact to South Australia and Victoria in 2017–18 and 2018–19 if the largest
generating unit in the region was unavailable in this period. The extended unavailability of the largest
unit in South Australia would increase the range of USE in South Australia in 2017–18 from 0.0015% to
0.0048%, and in Victoria from 0.0017% to 0.0022%, a level above the reliability standard causing
an LRC.
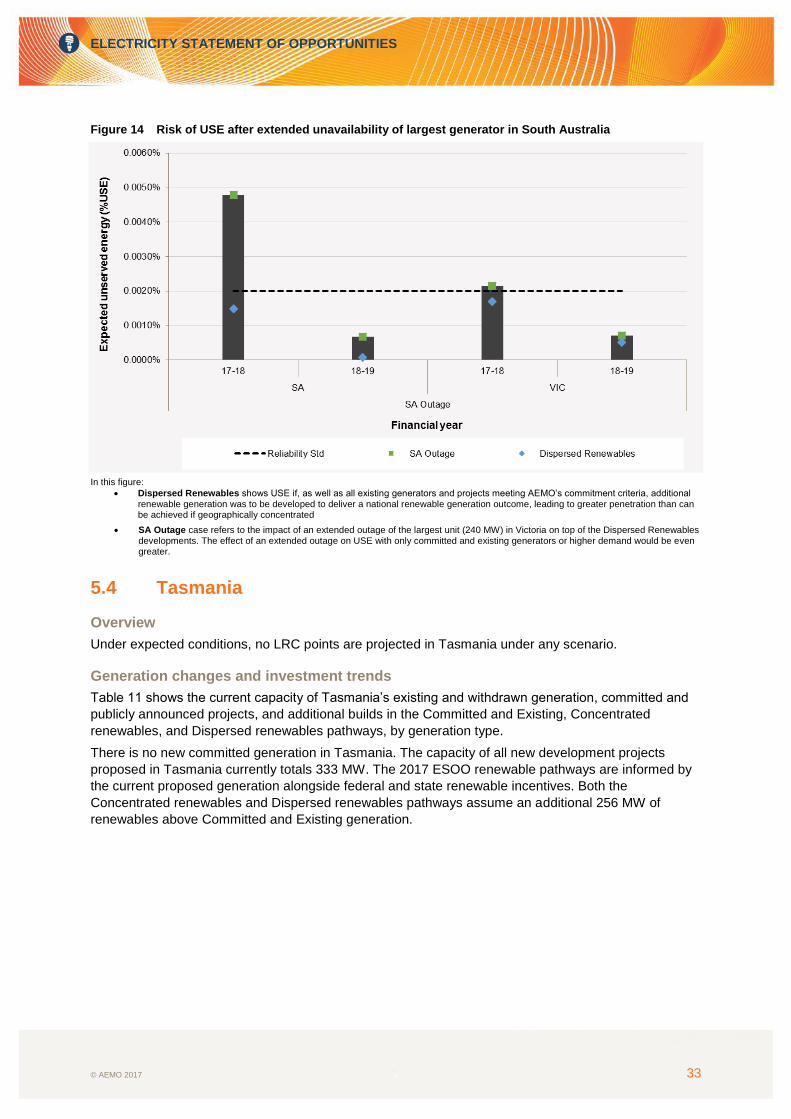
ELECTRICITY STATEMENT OF OPPORTUNITIES
© AEMO 2017 33
Figure 14 Risk of USE after extended unavailability of largest generator in South Australia
In this figure:
Dispersed Renewables shows USE if, as well as all existing generators and projects meeting AEMO’s commitment criteria, additional renewable generation was to be developed to deliver a national renewable generation outcome, leading to greater penetration than can be achieved if geographically concentrated
SA Outage case refers to the impact of an extended outage of the largest unit (240 MW) in Victoria on top of the Dispersed Renewables developments. The effect of an extended outage on USE with only committed and existing generators or higher demand would be even greater.
5.4 Tasmania
Overview
Under expected conditions, no LRC points are projected in Tasmania under any scenario.
Generation changes and investment trends
Table 11 shows the current capacity of Tasmania’s existing and withdrawn generation, committed and
publicly announced projects, and additional builds in the Committed and Existing, Concentrated
renewables, and Dispersed renewables pathways, by generation type.
There is no new committed generation in Tasmania. The capacity of all new development projects
proposed in Tasmania currently totals 333 MW. The 2017 ESOO renewable pathways are informed by
the current proposed generation alongside federal and state renewable incentives. Both the
Concentrated renewables and Dispersed renewables pathways assume an additional 256 MW of
renewables above Committed and Existing generation.
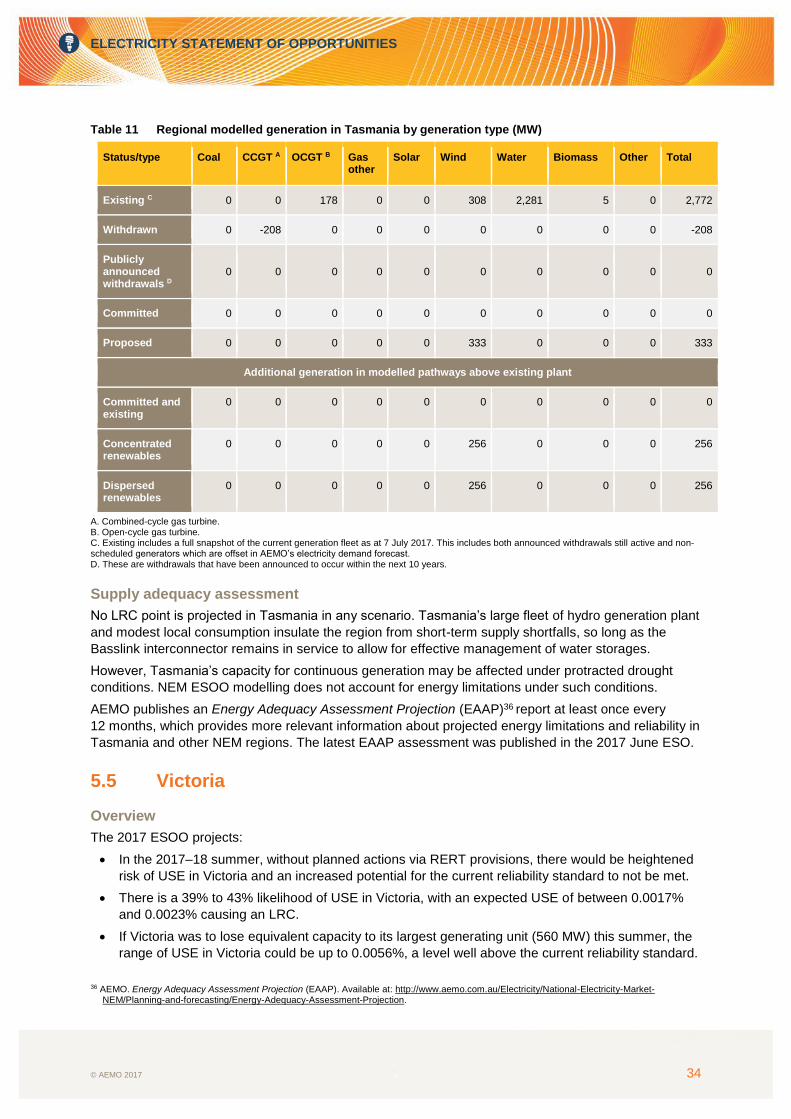
ELECTRICITY STATEMENT OF OPPORTUNITIES
© AEMO 2017 34
Table 11 Regional modelled generation in Tasmania by generation type (MW)
Status/type Coal CCGT A OCGT B Gas other
Solar Wind Water Biomass Other Total
Existing C 0 0 178 0 0 308 2,281 5 0 2,772
Withdrawn 0 -208 0 0 0 0 0 0 0 -208
Publicly announced withdrawals D
0 0 0 0 0 0 0 0 0 0
Committed 0 0 0 0 0 0 0 0 0 0
Proposed 0 0 0 0 0 333 0 0 0 333
Additional generation in modelled pathways above existing plant
Committed and existing
0 0 0 0 0 0 0 0 0 0
Concentrated renewables
0 0 0 0 0 256 0 0 0 256
Dispersed renewables
0 0 0 0 0 256 0 0 0 256
A. Combined-cycle gas turbine. B. Open-cycle gas turbine. C. Existing includes a full snapshot of the current generation fleet as at 7 July 2017. This includes both announced withdrawals still active and non-scheduled generators which are offset in AEMO’s electricity demand forecast. D. These are withdrawals that have been announced to occur within the next 10 years.
Supply adequacy assessment
No LRC point is projected in Tasmania in any scenario. Tasmania’s large fleet of hydro generation plant
and modest local consumption insulate the region from short-term supply shortfalls, so long as the
Basslink interconnector remains in service to allow for effective management of water storages.
However, Tasmania’s capacity for continuous generation may be affected under protracted drought
conditions. NEM ESOO modelling does not account for energy limitations under such conditions.
AEMO publishes an Energy Adequacy Assessment Projection (EAAP)36 report at least once every
12 months, which provides more relevant information about projected energy limitations and reliability in
Tasmania and other NEM regions. The latest EAAP assessment was published in the 2017 June ESO.
5.5 Victoria
Overview
The 2017 ESOO projects:
In the 2017–18 summer, without planned actions via RERT provisions, there would be heightened
risk of USE in Victoria and an increased potential for the current reliability standard to not be met.
There is a 39% to 43% likelihood of USE in Victoria, with an expected USE of between 0.0017%
and 0.0023% causing an LRC.
If Victoria was to lose equivalent capacity to its largest generating unit (560 MW) this summer, the
range of USE in Victoria could be up to 0.0056%, a level well above the current reliability standard.
36 AEMO. Energy Adequacy Assessment Projection (EAAP). Available at: http://www.aemo.com.au/Electricity/National-Electricity-Market-
NEM/Planning-and-forecasting/Energy-Adequacy-Assessment-Projection.
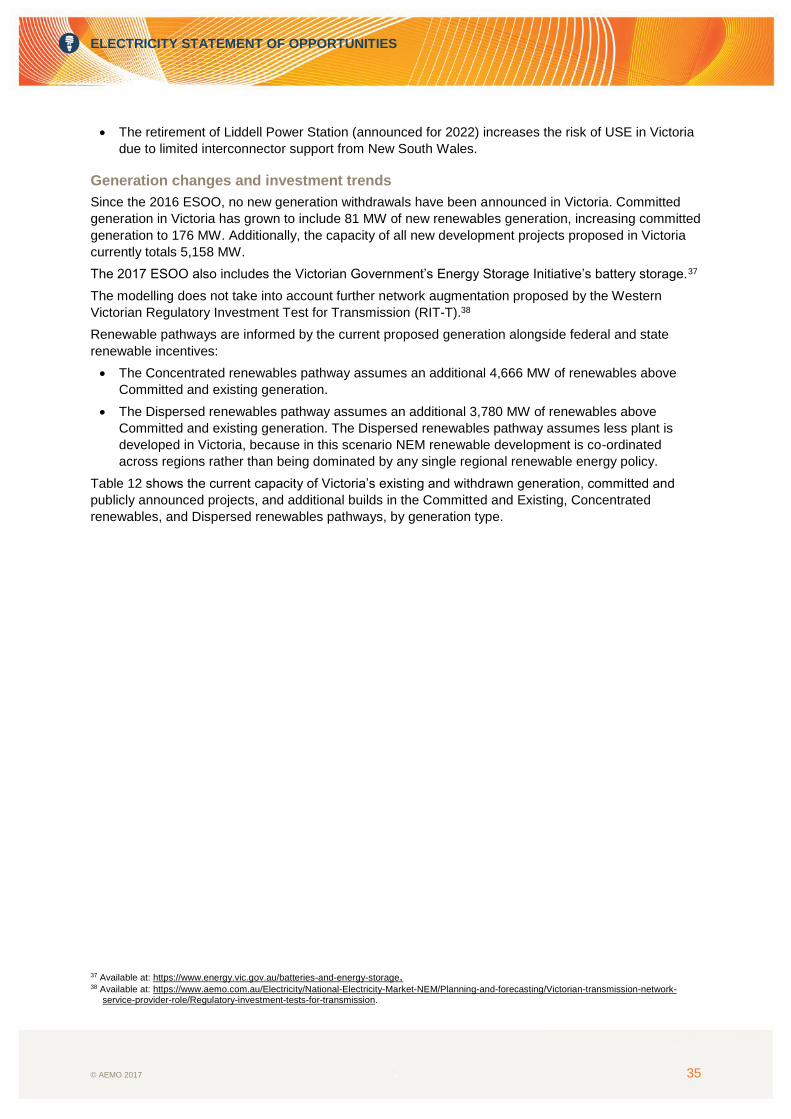
ELECTRICITY STATEMENT OF OPPORTUNITIES
© AEMO 2017 35
The retirement of Liddell Power Station (announced for 2022) increases the risk of USE in Victoria
due to limited interconnector support from New South Wales.
Generation changes and investment trends
Since the 2016 ESOO, no new generation withdrawals have been announced in Victoria. Committed
generation in Victoria has grown to include 81 MW of new renewables generation, increasing committed
generation to 176 MW. Additionally, the capacity of all new development projects proposed in Victoria
currently totals 5,158 MW.
The 2017 ESOO also includes the Victorian Government’s Energy Storage Initiative’s battery storage.37
The modelling does not take into account further network augmentation proposed by the Western
Victorian Regulatory Investment Test for Transmission (RIT-T).38
Renewable pathways are informed by the current proposed generation alongside federal and state
renewable incentives:
The Concentrated renewables pathway assumes an additional 4,666 MW of renewables above
Committed and existing generation.
The Dispersed renewables pathway assumes an additional 3,780 MW of renewables above
Committed and existing generation. The Dispersed renewables pathway assumes less plant is
developed in Victoria, because in this scenario NEM renewable development is co-ordinated
across regions rather than being dominated by any single regional renewable energy policy.
Table 12 shows the current capacity of Victoria’s existing and withdrawn generation, committed and
publicly announced projects, and additional builds in the Committed and Existing, Concentrated
renewables, and Dispersed renewables pathways, by generation type.
37 Available at: https://www.energy.vic.gov.au/batteries-and-energy-storage. 38 Available at: https://www.aemo.com.au/Electricity/National-Electricity-Market-NEM/Planning-and-forecasting/Victorian-transmission-network-
service-provider-role/Regulatory-investment-tests-for-transmission.
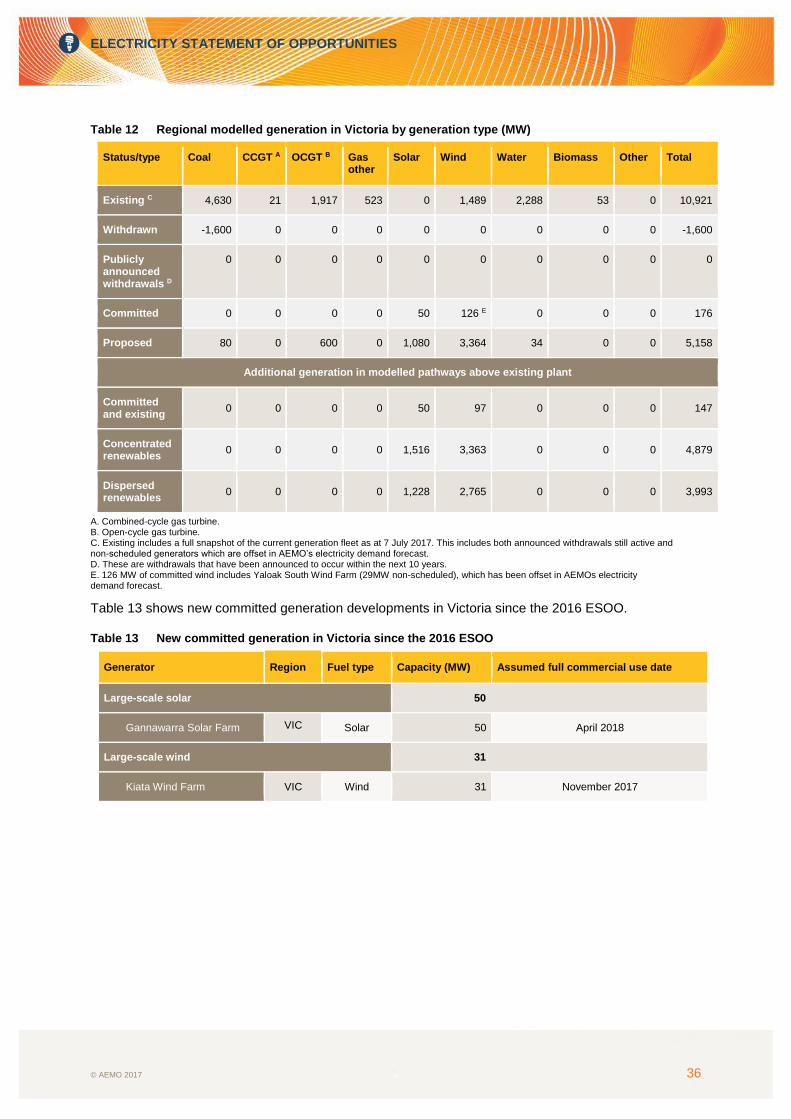
ELECTRICITY STATEMENT OF OPPORTUNITIES
© AEMO 2017 36
Table 12 Regional modelled generation in Victoria by generation type (MW)
Status/type Coal CCGT A OCGT B Gas other
Solar Wind Water Biomass Other Total
Existing C 4,630 21 1,917 523 0 1,489 2,288 53 0 10,921
Withdrawn -1,600 0 0 0 0 0 0 0 0 -1,600
Publicly announced withdrawals D
0 0 0 0 0 0 0 0 0 0
Committed 0 0 0 0 50 126 E 0 0 0 176
Proposed 80 0 600 0 1,080 3,364 34 0 0 5,158
Additional generation in modelled pathways above existing plant
Committed and existing
0 0 0 0 50 97 0 0 0 147
Concentrated renewables
0 0 0 0 1,516 3,363 0 0 0 4,879
Dispersed renewables
0 0 0 0 1,228 2,765 0 0 0 3,993
A. Combined-cycle gas turbine. B. Open-cycle gas turbine. C. Existing includes a full snapshot of the current generation fleet as at 7 July 2017. This includes both announced withdrawals still active and non-scheduled generators which are offset in AEMO’s electricity demand forecast. D. These are withdrawals that have been announced to occur within the next 10 years. E. 126 MW of committed wind includes Yaloak South Wind Farm (29MW non-scheduled), which has been offset in AEMOs electricity demand forecast.
Table 13 shows new committed generation developments in Victoria since the 2016 ESOO.
Table 13 New committed generation in Victoria since the 2016 ESOO
Generator Region Fuel type Capacity (MW) Assumed full commercial use date
Large-scale solar 50
Gannawarra Solar Farm VIC Solar 50 April 2018
Large-scale wind 31
Kiata Wind Farm VIC Wind 31 November 2017
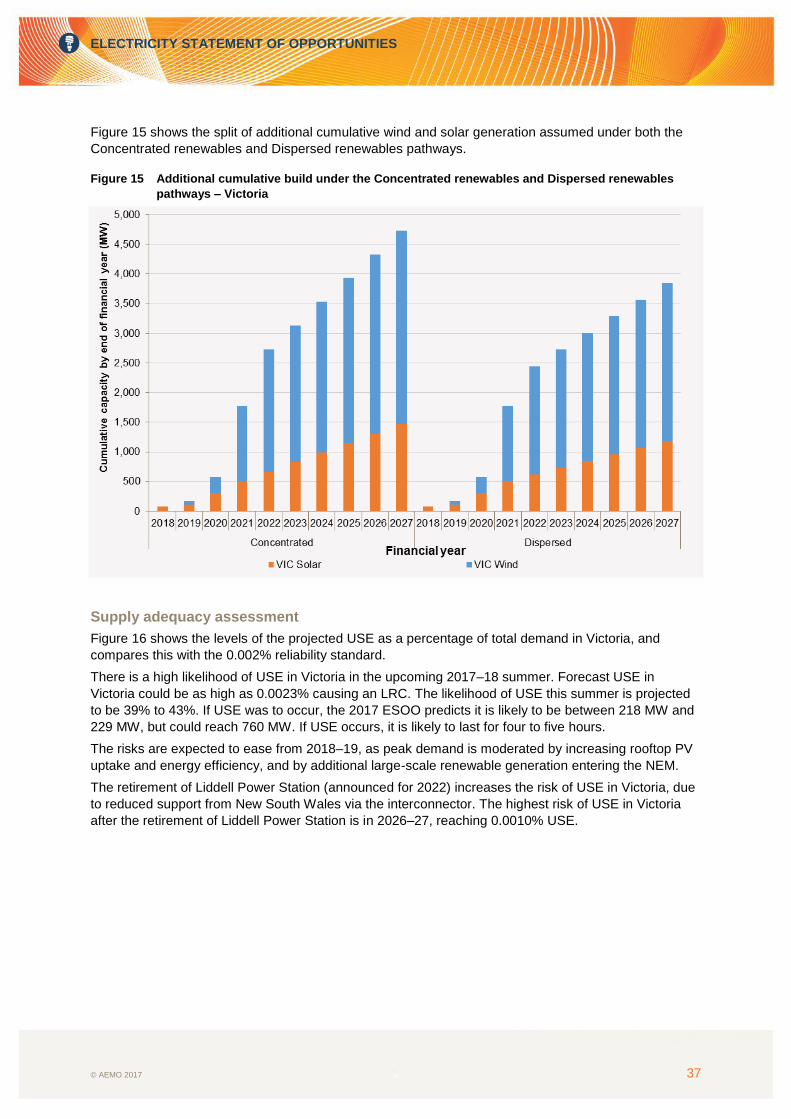
ELECTRICITY STATEMENT OF OPPORTUNITIES
© AEMO 2017 37
Figure 15 shows the split of additional cumulative wind and solar generation assumed under both the
Concentrated renewables and Dispersed renewables pathways.
Figure 15 Additional cumulative build under the Concentrated renewables and Dispersed renewables
pathways – Victoria
Supply adequacy assessment
Figure 16 shows the levels of the projected USE as a percentage of total demand in Victoria, and
compares this with the 0.002% reliability standard.
There is a high likelihood of USE in Victoria in the upcoming 2017–18 summer. Forecast USE in
Victoria could be as high as 0.0023% causing an LRC. The likelihood of USE this summer is projected
to be 39% to 43%. If USE was to occur, the 2017 ESOO predicts it is likely to be between 218 MW and
229 MW, but could reach 760 MW. If USE occurs, it is likely to last for four to five hours.
The risks are expected to ease from 2018–19, as peak demand is moderated by increasing rooftop PV
uptake and energy efficiency, and by additional large-scale renewable generation entering the NEM.
The retirement of Liddell Power Station (announced for 2022) increases the risk of USE in Victoria, due
to reduced support from New South Wales via the interconnector. The highest risk of USE in Victoria
after the retirement of Liddell Power Station is in 2026–27, reaching 0.0010% USE.
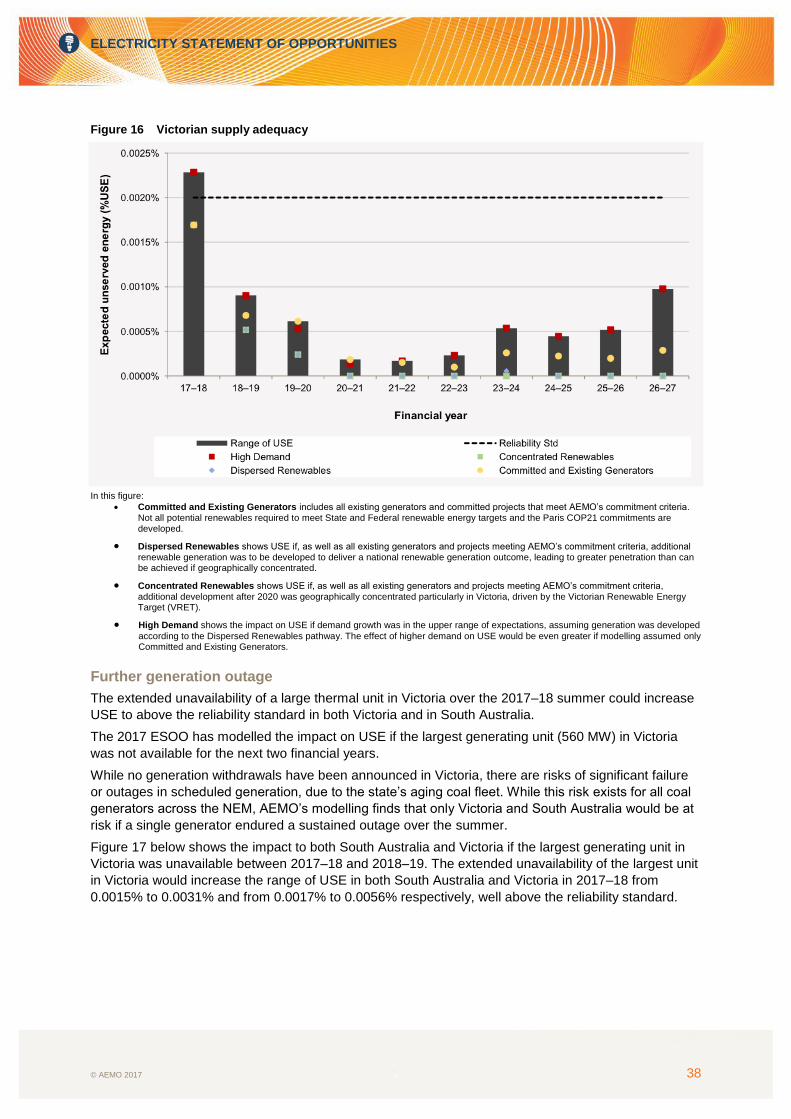
ELECTRICITY STATEMENT OF OPPORTUNITIES
© AEMO 2017 38
Figure 16 Victorian supply adequacy
In this figure:
Committed and Existing Generators includes all existing generators and committed projects that meet AEMO’s commitment criteria. Not all potential renewables required to meet State and Federal renewable energy targets and the Paris COP21 commitments are developed.
Dispersed Renewables shows USE if, as well as all existing generators and projects meeting AEMO’s commitment criteria, additional renewable generation was to be developed to deliver a national renewable generation outcome, leading to greater penetration than can be achieved if geographically concentrated.
Concentrated Renewables shows USE if, as well as all existing generators and projects meeting AEMO’s commitment criteria, additional development after 2020 was geographically concentrated particularly in Victoria, driven by the Victorian Renewable Energy Target (VRET).
High Demand shows the impact on USE if demand growth was in the upper range of expectations, assuming generation was developed
according to the Dispersed Renewables pathway. The effect of higher demand on USE would be even greater if modelling assumed only Committed and Existing Generators.
Further generation outage
The extended unavailability of a large thermal unit in Victoria over the 2017–18 summer could increase
USE to above the reliability standard in both Victoria and in South Australia.
The 2017 ESOO has modelled the impact on USE if the largest generating unit (560 MW) in Victoria
was not available for the next two financial years.
While no generation withdrawals have been announced in Victoria, there are risks of significant failure
or outages in scheduled generation, due to the state’s aging coal fleet. While this risk exists for all coal
generators across the NEM, AEMO’s modelling finds that only Victoria and South Australia would be at
risk if a single generator endured a sustained outage over the summer.
Figure 17 below shows the impact to both South Australia and Victoria if the largest generating unit in
Victoria was unavailable between 2017–18 and 2018–19. The extended unavailability of the largest unit
in Victoria would increase the range of USE in both South Australia and Victoria in 2017–18 from
0.0015% to 0.0031% and from 0.0017% to 0.0056% respectively, well above the reliability standard.
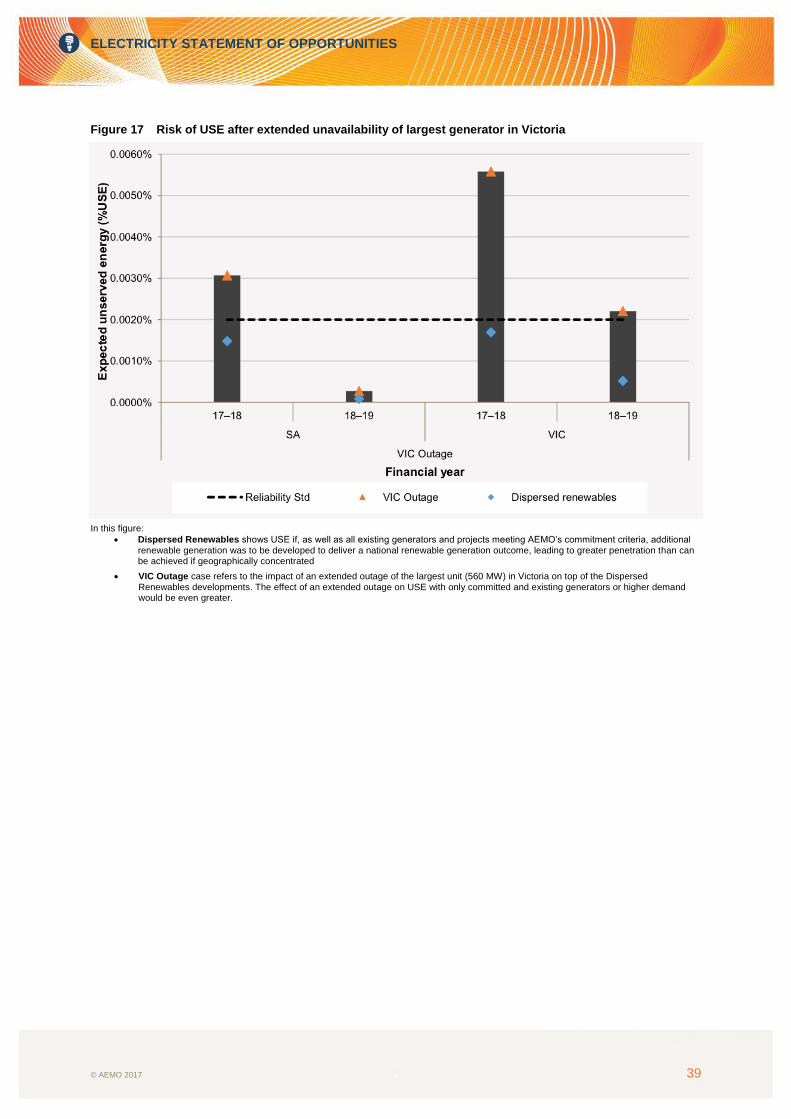
ELECTRICITY STATEMENT OF OPPORTUNITIES
© AEMO 2017 39
Figure 17 Risk of USE after extended unavailability of largest generator in Victoria
In this figure:
Dispersed Renewables shows USE if, as well as all existing generators and projects meeting AEMO’s commitment criteria, additional
renewable generation was to be developed to deliver a national renewable generation outcome, leading to greater penetration than can be achieved if geographically concentrated
VIC Outage case refers to the impact of an extended outage of the largest unit (560 MW) in Victoria on top of the Dispersed Renewables developments. The effect of an extended outage on USE with only committed and existing generators or higher demand would be even greater.
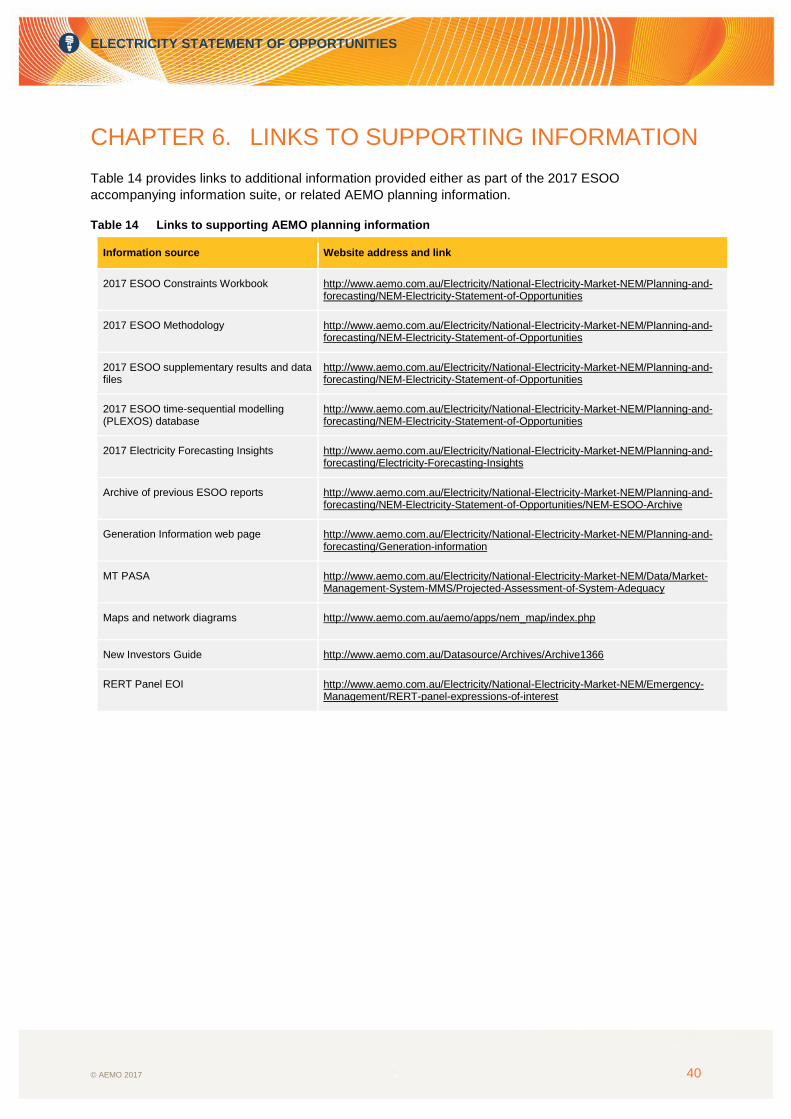
ELECTRICITY STATEMENT OF OPPORTUNITIES
© AEMO 2017 40
CHAPTER 6. LINKS TO SUPPORTING INFORMATION
Table 14 provides links to additional information provided either as part of the 2017 ESOO
accompanying information suite, or related AEMO planning information.
Table 14 Links to supporting AEMO planning information
Information source Website address and link
2017 ESOO Constraints Workbook http://www.aemo.com.au/Electricity/National-Electricity-Market-NEM/Planning-and-forecasting/NEM-Electricity-Statement-of-Opportunities
2017 ESOO Methodology http://www.aemo.com.au/Electricity/National-Electricity-Market-NEM/Planning-and-forecasting/NEM-Electricity-Statement-of-Opportunities
2017 ESOO supplementary results and data files
http://www.aemo.com.au/Electricity/National-Electricity-Market-NEM/Planning-and-forecasting/NEM-Electricity-Statement-of-Opportunities
2017 ESOO time-sequential modelling (PLEXOS) database
http://www.aemo.com.au/Electricity/National-Electricity-Market-NEM/Planning-and-forecasting/NEM-Electricity-Statement-of-Opportunities
2017 Electricity Forecasting Insights http://www.aemo.com.au/Electricity/National-Electricity-Market-NEM/Planning-and-forecasting/Electricity-Forecasting-Insights
Archive of previous ESOO reports http://www.aemo.com.au/Electricity/National-Electricity-Market-NEM/Planning-and-forecasting/NEM-Electricity-Statement-of-Opportunities/NEM-ESOO-Archive
Generation Information web page http://www.aemo.com.au/Electricity/National-Electricity-Market-NEM/Planning-and-forecasting/Generation-information
MT PASA http://www.aemo.com.au/Electricity/National-Electricity-Market-NEM/Data/Market-Management-System-MMS/Projected-Assessment-of-System-Adequacy
Maps and network diagrams http://www.aemo.com.au/aemo/apps/nem_map/index.php
New Investors Guide http://www.aemo.com.au/Datasource/Archives/Archive1366
RERT Panel EOI http://www.aemo.com.au/Electricity/National-Electricity-Market-NEM/Emergency-Management/RERT-panel-expressions-of-interest
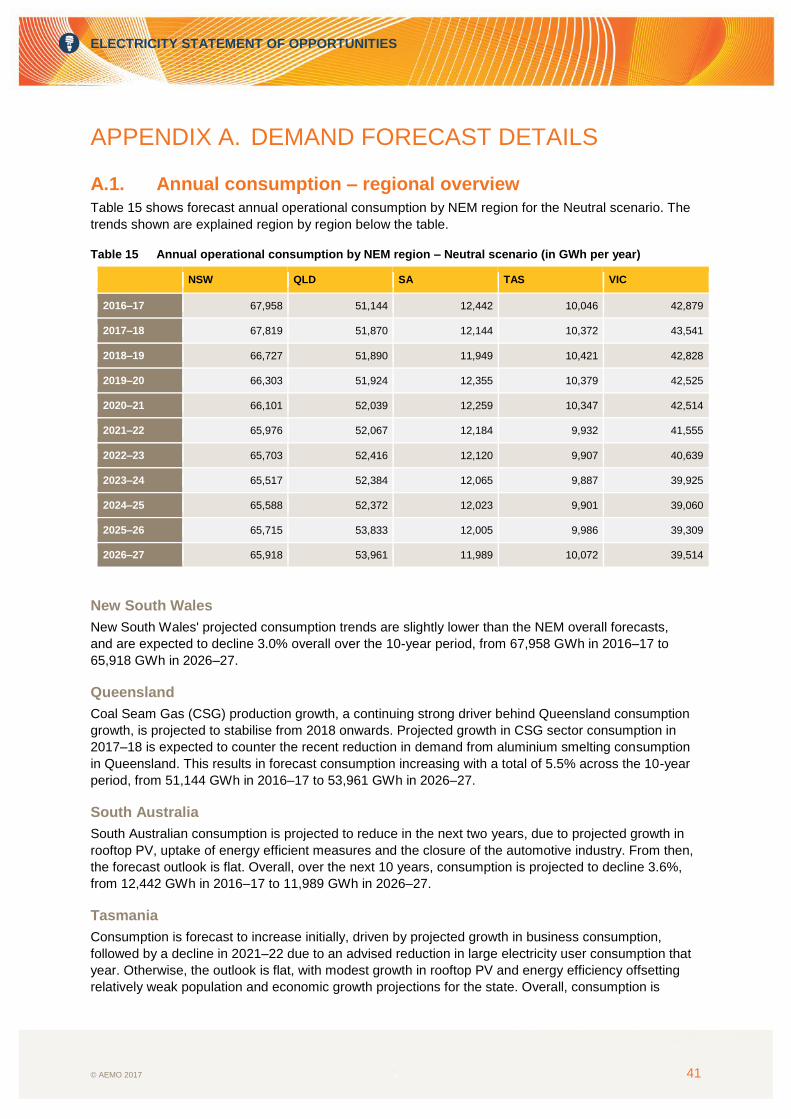
ELECTRICITY STATEMENT OF OPPORTUNITIES
© AEMO 2017 41
APPENDIX A. DEMAND FORECAST DETAILS
A.1. Annual consumption – regional overview Table 15 shows forecast annual operational consumption by NEM region for the Neutral scenario. The
trends shown are explained region by region below the table.
Table 15 Annual operational consumption by NEM region – Neutral scenario (in GWh per year)
NSW QLD SA TAS VIC
2016–17 67,958 51,144 12,442 10,046 42,879
2017–18 67,819 51,870 12,144 10,372 43,541
2018–19 66,727 51,890 11,949 10,421 42,828
2019–20 66,303 51,924 12,355 10,379 42,525
2020–21 66,101 52,039 12,259 10,347 42,514
2021–22 65,976 52,067 12,184 9,932 41,555
2022–23 65,703 52,416 12,120 9,907 40,639
2023–24 65,517 52,384 12,065 9,887 39,925
2024–25 65,588 52,372 12,023 9,901 39,060
2025–26 65,715 53,833 12,005 9,986 39,309
2026–27 65,918 53,961 11,989 10,072 39,514
New South Wales
New South Wales' projected consumption trends are slightly lower than the NEM overall forecasts,
and are expected to decline 3.0% overall over the 10-year period, from 67,958 GWh in 2016–17 to
65,918 GWh in 2026–27.
Queensland
Coal Seam Gas (CSG) production growth, a continuing strong driver behind Queensland consumption
growth, is projected to stabilise from 2018 onwards. Projected growth in CSG sector consumption in
2017–18 is expected to counter the recent reduction in demand from aluminium smelting consumption
in Queensland. This results in forecast consumption increasing with a total of 5.5% across the 10-year
period, from 51,144 GWh in 2016–17 to 53,961 GWh in 2026–27.
South Australia
South Australian consumption is projected to reduce in the next two years, due to projected growth in
rooftop PV, uptake of energy efficient measures and the closure of the automotive industry. From then,
the forecast outlook is flat. Overall, over the next 10 years, consumption is projected to decline 3.6%,
from 12,442 GWh in 2016–17 to 11,989 GWh in 2026–27.
Tasmania
Consumption is forecast to increase initially, driven by projected growth in business consumption,
followed by a decline in 2021–22 due to an advised reduction in large electricity user consumption that
year. Otherwise, the outlook is flat, with modest growth in rooftop PV and energy efficiency offsetting
relatively weak population and economic growth projections for the state. Overall, consumption is

ELECTRICITY STATEMENT OF OPPORTUNITIES
© AEMO 2017 42
projected to grow from 10,046 GWh in 2016–17 to 10,072 GWh by 2026–27, an expected increase of
0.3% over the period.
Victoria
The consumption forecast for Victoria is flat to 2021–22, followed by a reduction in consumption over
the next four years driven by forecast decline in business consumption. From the mid-2020s,
consumption is projected to increase slightly. This results in an overall projected reduction of
consumption of 7.8% over the 10-year period, from 42,879 GWh in 2016–17 to 39,514 GWh in
2026–27.
A.2. Maximum demand – regional overview
New South Wales
Maximum operational demand is expected to remain relatively flat until 2023–24, then increase to the
end of the forecast period.
Increases are attributed to projected appliance uptake, increasing cooling load, and population
growth. In the short term, increases in maximum operational demand are forecast to be offset by
increases in the installed capacity of rooftop PV. In the mid to late 2020s, maximum demand is
forecast to shift to later in the day, just before or during sunset, while temperatures are still high
and generation from installed rooftop PV falls with lower solar radiation.
Maximum operational demand (10% POE) is forecast to continue occurring in summer until late in
the forecast period, when New South Wales is forecast to become predominantly winter peaking,
as rooftop PV has a bigger offsetting impact during summer.
Table 16 Forecast operational maximum demand (10% POE, Summer) for New South Wales
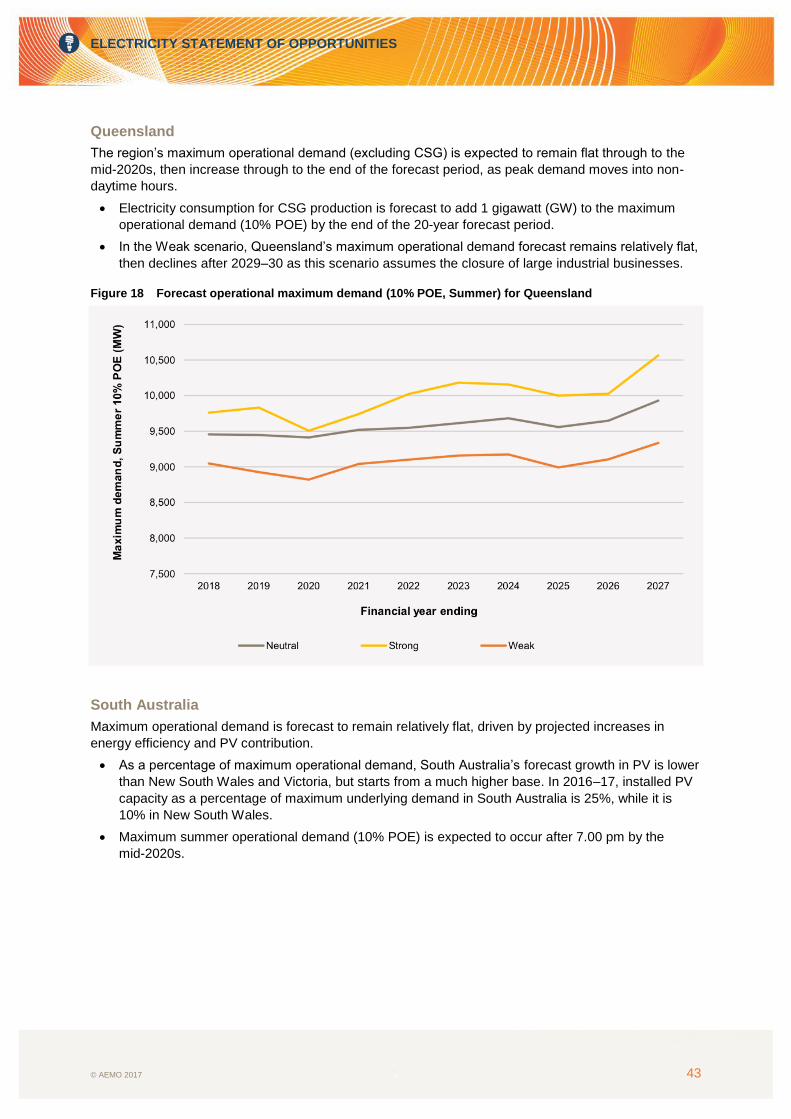
ELECTRICITY STATEMENT OF OPPORTUNITIES
© AEMO 2017 43
Queensland
The region’s maximum operational demand (excluding CSG) is expected to remain flat through to the
mid-2020s, then increase through to the end of the forecast period, as peak demand moves into non-
daytime hours.
Electricity consumption for CSG production is forecast to add 1 gigawatt (GW) to the maximum
operational demand (10% POE) by the end of the 20-year forecast period.
In the Weak scenario, Queensland’s maximum operational demand forecast remains relatively flat,
then declines after 2029–30 as this scenario assumes the closure of large industrial businesses.
Figure 18 Forecast operational maximum demand (10% POE, Summer) for Queensland
South Australia
Maximum operational demand is forecast to remain relatively flat, driven by projected increases in
energy efficiency and PV contribution.
As a percentage of maximum operational demand, South Australia’s forecast growth in PV is lower
than New South Wales and Victoria, but starts from a much higher base. In 2016–17, installed PV
capacity as a percentage of maximum underlying demand in South Australia is 25%, while it is
10% in New South Wales.
Maximum summer operational demand (10% POE) is expected to occur after 7.00 pm by the
mid-2020s.
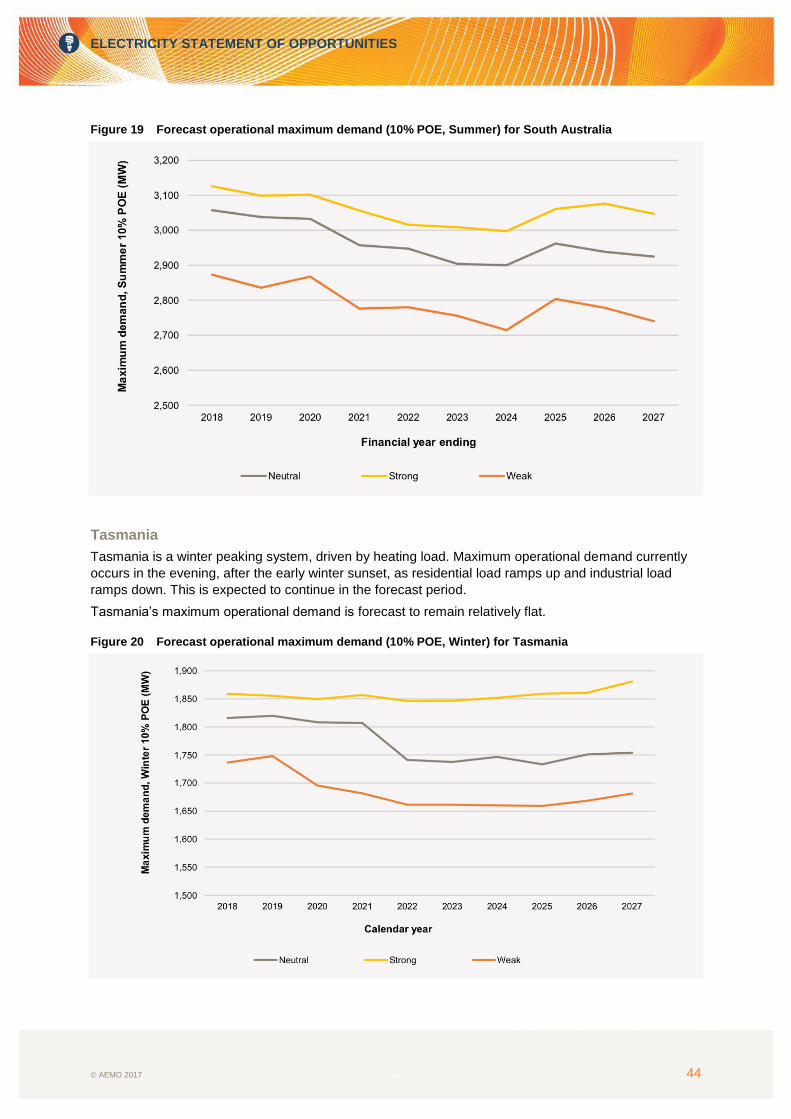
ELECTRICITY STATEMENT OF OPPORTUNITIES
© AEMO 2017 44
Figure 19 Forecast operational maximum demand (10% POE, Summer) for South Australia
Tasmania
Tasmania is a winter peaking system, driven by heating load. Maximum operational demand currently
occurs in the evening, after the early winter sunset, as residential load ramps up and industrial load
ramps down. This is expected to continue in the forecast period.
Tasmania’s maximum operational demand is forecast to remain relatively flat.
Figure 20 Forecast operational maximum demand (10% POE, Winter) for Tasmania
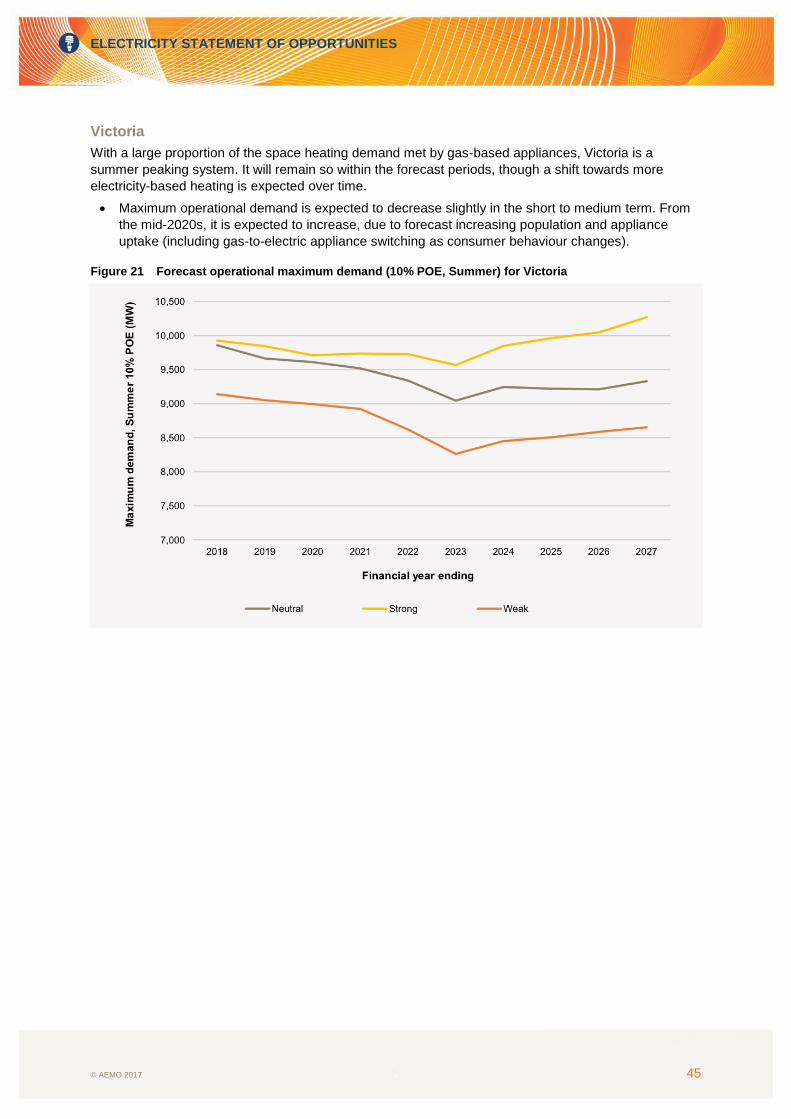
ELECTRICITY STATEMENT OF OPPORTUNITIES
© AEMO 2017 45
Victoria
With a large proportion of the space heating demand met by gas-based appliances, Victoria is a
summer peaking system. It will remain so within the forecast periods, though a shift towards more
electricity-based heating is expected over time.
Maximum operational demand is expected to decrease slightly in the short to medium term. From
the mid-2020s, it is expected to increase, due to forecast increasing population and appliance
uptake (including gas-to-electric appliance switching as consumer behaviour changes).
Figure 21 Forecast operational maximum demand (10% POE, Summer) for Victoria
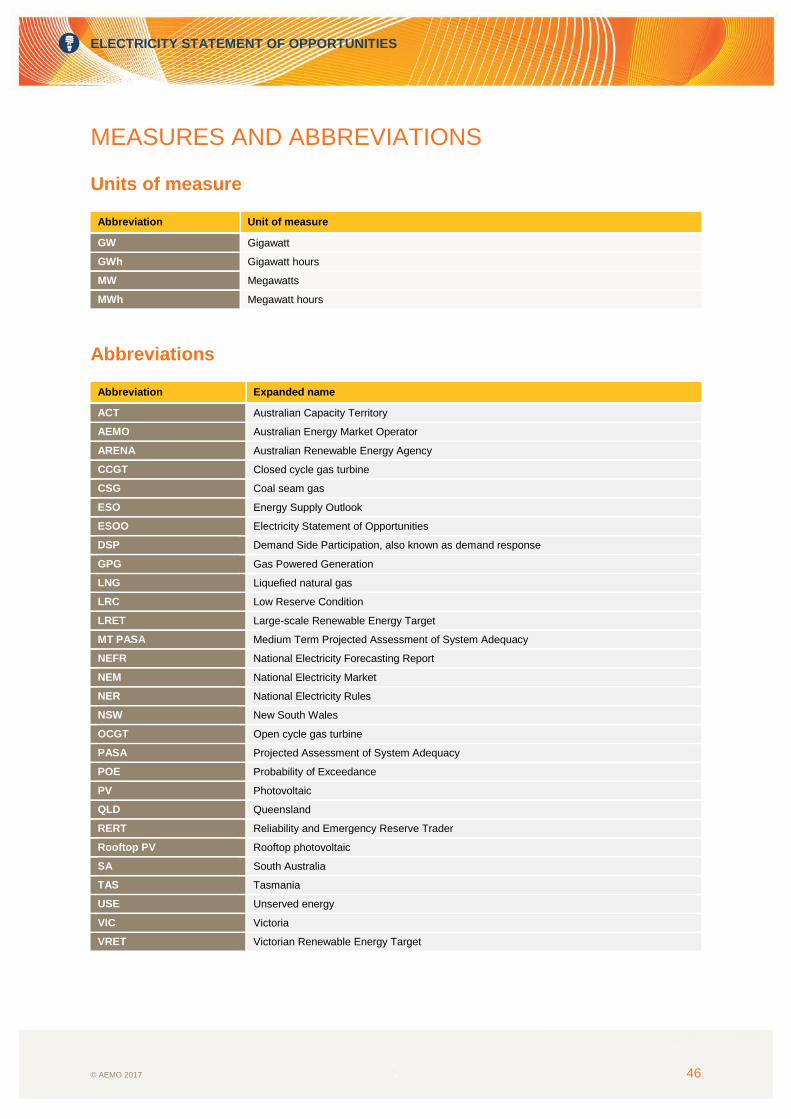
ELECTRICITY STATEMENT OF OPPORTUNITIES
© AEMO 2017 46
MEASURES AND ABBREVIATIONS
Units of measure
Abbreviation Unit of measure
GW Gigawatt
GWh Gigawatt hours
MW Megawatts
MWh Megawatt hours
Abbreviations
Abbreviation Expanded name
ACT Australian Capacity Territory
AEMO Australian Energy Market Operator
ARENA Australian Renewable Energy Agency
CCGT Closed cycle gas turbine
CSG Coal seam gas
ESO Energy Supply Outlook
ESOO Electricity Statement of Opportunities
DSP Demand Side Participation, also known as demand response
GPG Gas Powered Generation
LNG Liquefied natural gas
LRC Low Reserve Condition
LRET Large-scale Renewable Energy Target
MT PASA Medium Term Projected Assessment of System Adequacy
NEFR National Electricity Forecasting Report
NEM National Electricity Market
NER National Electricity Rules
NSW New South Wales
OCGT Open cycle gas turbine
PASA Projected Assessment of System Adequacy
POE Probability of Exceedance
PV Photovoltaic
QLD Queensland
RERT Reliability and Emergency Reserve Trader
Rooftop PV Rooftop photovoltaic
SA South Australia
TAS Tasmania
USE Unserved energy
VIC Victoria
VRET Victorian Renewable Energy Target
ELECTRICITY STATEMENT OF OPPORTUNITIES
© AEMO 2017 47
GLOSSARY This document uses many terms that have meanings defined in the National Electricity Rules (NER).
The NER meanings are adopted unless otherwise specified.
Term Definition
committed projects Generation that is considered to be proceeding under AEMO’s commitment criteria (see Generation Information on AEMO’s website, link in Table 14).
electrical energy Average electrical power over a time period, multiplied by the length of the time period.
electrical power Instantaneous rate at which electrical energy is consumed, generated, or transmitted.
firming capability Firming capability can be dispatched to maintain balance on the power grid. It can include generation on the grid, storage, demand resources behind the meter, flexible demand, or flexible network capability.
generating capacity Amount of capacity (in megawatts (MW)) available for generation.
generating unit Power stations may be broken down into separate components known as generating units, and may be considered separately in terms (for example) of dispatch, withdrawal, and maintenance.
installed capacity The generating capacity (in megawatts (MW)) of the following (for example):
A single generating unit.
A number of generating units of a particular type or in a particular area.
All of the generating units in a region.
Rooftop PV installed capacity is the total amount of cumulative rooftop PV capacity installed at any given time.
Low Reserve Condition (LRC) When AEMO considers that a region’s reserve margin (calculated under 10% Probability of Exceedance (POE) scheduled and semi-scheduled maximum demand conditions) for the period being assessed is below the Reliability Standard.
maximum demand (MD) Highest amount of electrical power delivered, or forecast to be delivered, over a defined period (day, week, month, season, or year) either at a connection point, or simultaneously at a defined set of connection points.
mothballed A generation unit that has been withdrawn from operation but may return to service at some point in the future.
non-scheduled generation Generation by a generating unit that is not scheduled by AEMO as part of the central dispatch process, and which has been classified as a non-scheduled generating unit in accordance with Chapter 2 of the NER.
operational electrical consumption
The electrical energy supplied by scheduled, semi-scheduled, and significant non-scheduled generating units, less the electrical energy supplied by small non-scheduled generation.
probability of exceedance (POE) maximum demand
The probability, as a percentage, that a maximum demand level will be met or exceeded (for example, due to weather conditions) in a particular period of time. For example, a 10% POE maximum demand for a given season means a 10% probability that the projected level will be met or exceeded – in other words, projected maximum demand levels are expected to be met or exceeded, on average, only one year in 10.
proposed projects Includes both advanced proposals at an intermediate stage of development, and publicly announced proposals at an early stage of development.
reliability standard The power system reliability benchmark set by the Reliability Panel.
The reliability standard for generation and inter-regional transmission elements in the national electricity market is a maximum expected unserved energy (USE) in a region of 0.002% of the total energy demanded in that region for a financial year.
scenario Consistent set of assumptions to develop demand, transmission, and supply forecasts.
scheduled generation Generation by any generating unit that is classified as a scheduled generating unit in accordance with Chapter 2 of the NER.
semi-scheduled generation Generation by any generating unit that is classified as a semi-scheduled generating unit in accordance with Chapter 2 of the NER.
summer Unless otherwise specified, refers to the period 1 November – 31 March (for all regions except Tasmania), and 1 December – 28 February (for Tasmania only).
winter Unless otherwise specified, refers to the period 1 June – 31 August (for all regions).