electricity procurement plan - illinois...illinois power agency final 2020 procurement plan january...
TRANSCRIPT
Illinois Power Agency Final 2020 Procurement Plan January 17, 2020
ELECTRICITY PROCUREMENT
PLAN
Final 2020 Plan January 17, 2020
Prepared to conform with the Illinois Commerce Commission’s Final Order in Docket No. 19-0951, dated December 19, 2019
Prepared in accordance with the Illinois Power Agency Act (20 ILCS 3855) and the Illinois Public Utilities Act (220 ILCS 5)
2020
Illinois Power Agency Final 2020 Procurement Plan January 17, 2020
i
Table of Contents
1 Executive Summary .......................................................................................................................................................... 1 1.1 Power Procurement Strategy ......................................................................................................................................................... 1 1.2 Renewable Energy Resources ........................................................................................................................................................ 3 1.3 Procurement Recommendations .................................................................................................................................................. 3 1.4 The Action Plan .................................................................................................................................................................................... 5
2 Legislative/Regulatory Requirements of the Plan ................................................................................................ 7 2.1 IPA Authority ......................................................................................................................................................................................... 7 2.2 Procurement Plan Development and Approval Process .................................................................................................... 8 2.3 Procurement Plan Requirements ................................................................................................................................................. 9 2.4 Standard Product Procurement .................................................................................................................................................. 10 2.5 Demand Response Products ......................................................................................................................................................... 10 2.6 Clean Coal Portfolio Standard ...................................................................................................................................................... 11 2.7 Recent Legislative Proposals and Related Developments............................................................................................... 12
3 Load Forecasts ................................................................................................................................................................. 15 3.1 Statutory Requirements ................................................................................................................................................................. 15 3.2 Summary of Information Provided by Ameren Illinois .................................................................................................... 15 3.2.1 Macroeconomics ............................................................................................................................................................................ 18 3.2.2 Weather ............................................................................................................................................................................................. 18 3.2.3 Switching ........................................................................................................................................................................................... 18 3.2.4 Load Shape and Load Factor .................................................................................................................................................... 19 3.3 Summary of Information Provided by ComEd ..................................................................................................................... 21 3.3.1 Macroeconomics ............................................................................................................................................................................ 23 3.3.2 Weather ............................................................................................................................................................................................. 23 3.3.3 Switching ........................................................................................................................................................................................... 24 3.3.4 Load Shape and Load Factor .................................................................................................................................................... 25 3.4 Summary of Information Provided by MidAmerican ........................................................................................................ 26 3.4.1 Macroeconomics ............................................................................................................................................................................ 29 3.4.2 Weather ............................................................................................................................................................................................. 29 3.4.3 Switching ........................................................................................................................................................................................... 29 3.4.4 Load Shape and Load Factor .................................................................................................................................................... 30 3.5 Sources of Uncertainty in the Load Forecasts ...................................................................................................................... 31 3.5.1 Overall Load Growth .................................................................................................................................................................... 31 3.5.2 Weather ............................................................................................................................................................................................. 32 3.5.3 Load Profiles .................................................................................................................................................................................... 32 3.5.4 Municipal Aggregation and Individual Switching ........................................................................................................... 33 3.5.5 Hourly Billed Customers ............................................................................................................................................................ 35 3.5.6 Energy Efficiency ........................................................................................................................................................................... 35 3.5.7 Demand Response ........................................................................................................................................................................ 35 3.5.8 Emerging Technologies .............................................................................................................................................................. 35 3.6 Recommended Load Forecasts.................................................................................................................................................... 36 3.6.1 Base Cases......................................................................................................................................................................................... 36 3.6.2 High and Low Excursion Cases ................................................................................................................................................ 36
4 Existing Resource Portfolio and Supply Gap ........................................................................................................ 38 4.1 Ameren Illinois Resource Portfolio ........................................................................................................................................... 39 4.2 ComEd Resource Portfolio ............................................................................................................................................................ 39 4.3 MidAmerican Resource Portfolio ............................................................................................................................................... 40
5 PJM and MISO Resource Adequacy Outlook and Uncertainty ........................................................................ 42 5.1 Resource Adequacy Projections ................................................................................................................................................. 42 5.2 RTO Administered Organized Capacity Auctions................................................................................................................ 45
Illinois Power Agency Final 2020 Procurement Plan January 17, 2020
ii
5.2.1 PJM Reliability Pricing Model .................................................................................................................................................. 45 5.2.2 Overview of MISO Planning Resource Auction ................................................................................................................ 49
6 Managing Supply Risks ................................................................................................................................................. 52 6.1 Risks ........................................................................................................................................................................................................ 52 6.1.1 Volume Uncertainty and Price Risk ...................................................................................................................................... 52 6.1.2 Residual Supply Risk.................................................................................................................................................................... 53 6.1.3 Basis Differential Risk ................................................................................................................................................................. 53 6.2 Tools for Managing Supply Risk ................................................................................................................................................. 53 6.3 Types of Supply Hedges .................................................................................................................................................................. 54 6.3.1 Suitability of Supply Hedges ..................................................................................................................................................... 55 6.3.2 Options as a Hedge on Load Variability .............................................................................................................................. 56 6.4 Tools for Managing Surpluses and Portfolio Rebalancing .............................................................................................. 57 6.5 Purchased Electricity Adjustment Overview ........................................................................................................................ 57 6.6 Estimating Supply Risks in the IPA’s Historical Approach to Portfolio Management ........................................ 59 6.6.1 Historical Strategies of the IPA ............................................................................................................................................... 59 6.6.2 Measuring the Cost and Uncertainty Impacts of Supply Risk Factors ................................................................... 60 6.7 Demand Response as a Risk Management Tool ................................................................................................................... 61
7 Resource Choices ............................................................................................................................................................ 63 7.1 Energy..................................................................................................................................................................................................... 63 7.1.1 Energy Procurement Strategy ................................................................................................................................................. 63 7.1.2 Energy Procurement Implementation ................................................................................................................................. 64 7.2 Capacity ................................................................................................................................................................................................. 71 7.2.1 Capacity Procurement Strategy .............................................................................................................................................. 71 7.2.1.1 ComEd ............................................................................................................................................................................................. 71 7.2.1.2 Ameren Illinois ............................................................................................................................................................................ 71 7.2.1.3 MidAmerican ................................................................................................................................................................................ 71 7.2.2 Capacity Procurement Implementation .............................................................................................................................. 72 7.2.2.1 Ameren Illinois ............................................................................................................................................................................ 72 7.2.2.2 ComEd ............................................................................................................................................................................................. 73 7.2.2.3 MidAmerican ................................................................................................................................................................................ 74 7.3 Transmission and Ancillary Services ........................................................................................................................................ 74 7.4 Demand Response Products ......................................................................................................................................................... 74 7.5 Clean Coal .............................................................................................................................................................................................. 76
8 Procurement Process Design ..................................................................................................................................... 78 8.1 Contract Forms ................................................................................................................................................................................... 79 8.2 IPA Recovery of Procurement Expenses ................................................................................................................................. 80 8.3 Second Procurement Event ........................................................................................................................................................... 81 8.4 Informal Hearing ............................................................................................................................................................................... 81
Appendices (Overview) ........................................................................................................................................................ 83 Appendix A Regulatory Compliance Index ................................................................................................................................... 83 Appendix B Ameren Illinois Submittal........................................................................................................................................... 83 Appendix C ComEd Submittal ............................................................................................................................................................ 83 Appendix D MidAmerican Submittal .............................................................................................................................................. 83 Appendix E Ameren Illinois Load Forecast and Supply Portfolio...................................................................................... 83 Appendix F ComEd Load Forecast and Supply Portfolio ....................................................................................................... 83 Appendix G MidAmerican Load Forecast and Supply Portfolio ......................................................................................... 84 Appendices are available separately at: www.illinois.gov/sites/ipa/Pages/2020-Appendices.aspx

Illinois Power Agency Final 2020 Procurement Plan January 17, 2020
iii
Tables Table 1-1: Summary of Energy Hedging Strategy for all Utilities .............................................................................................. 2 Table 1-2: Summary of Capacity Procurement for Ameren Illinois ........................................................................................ 3 Table 1-3: Summary of Capacity Procurement for ComEd ........................................................................................................... 3 Table 1-4: Summary of Capacity Procurement for MidAmerican ............................................................................................. 3 Table 1-5: Summary of Procurement Plan Recommendations Based on July 15, 2019 Utility Load Forecast
(Quantities to be Adjusted Based on the March and July 2020 Load Forecasts. .......................................... 4 Table 3-1: Load Multipliers in Ameren Illinois Excursion Cases ............................................................................................. 18 Table 3-2: Representative ARES Fixed Price Offers and Utility Price to Compare .......................................................... 34 Table 7-1: Summary of Energy Procurement Strategy for all Utilities .................................................................................. 63 Table 7-2: Ameren Illinois 2020 Spring and Fall Procurements .............................................................................................. 66 Table 7-3: ComEd 2020 Spring and Fall Procurements ............................................................................................................... 68 Table 7-4: MidAmerican 2020 Spring and Fall Procurements.................................................................................................. 70 Table 7-5: Summary of MidAmerican Load and Capability ........................................................................................................ 72 Table 7-6: Summary of Capacity Procurement for Ameren Illinois........................................................................................ 73 Table 7-7: Summary of Capacity Procurement for ComEd ......................................................................................................... 73 Table 7-8: Summary of Capacity Procurement for MidAmerican ........................................................................................... 74
Illinois Power Agency Final 2020 Procurement Plan January 17, 2020
iv
Figures Figure 3-1: Ameren Illinois’ Forecast Retail Customer Load Breakdown, Delivery Year 2020-2021..................... 16 Figure 3-2: Ameren Illinois’ Forecast Retail Customer Load by Delivery Year ................................................................. 17 Figure 3-3: Ameren Illinois’ Forecast Eligible Retail Customer Load* by Month .............................................................. 17 Figure 3-4: Supply Obligation in Ameren Illinois’ Forecasts ..................................................................................................... 19 Figure 3-5: Sample Daily Load Shape, Summer Day in Ameren Illinois’ Forecasts ......................................................... 20 Figure 3-6: Sample Daily Load Shape, Spring Day in Ameren Illinois’ Forecasts ............................................................. 20 Figure 3-7: Load Factor in Ameren Illinois’ Forecasts .................................................................................................................. 21 Figure 3-8: ComEd’s Forecast Retail Customer Load Breakdown, Delivery Year 2020-2021 .................................... 22 Figure 3-9: ComEd’s Forecast Retail Customer Load by Delivery Year ................................................................................ 22 Figure 3-10: ComEd’s Forecast Eligible Retail Customer Load by Month ........................................................................... 23 Figure 3-11: The Impact of Weather in ComEd’s Forecasts ....................................................................................................... 24 Figure 3-12: Supply Obligation in ComEd’s Forecasts .................................................................................................................. 25 Figure 3-13: Sample Daily Load Shape, Summer Day in ComEd’s Forecasts ..................................................................... 25 Figure 3-14: Sample Daily Load Shape, Spring Day in ComEd’s Forecasts.......................................................................... 26 Figure 3-15: Load Factor in ComEd’s Forecasts .............................................................................................................................. 26 Figure 3-16: MidAmerican’s Forecast Retail Customer Load Breakdown, Delivery Year 2020-2021 .................... 27 Figure 3-17: MidAmerican’s Forecast Retail Customer Load by Delivery Year ................................................................ 28 Figure 3-18: MidAmerican’s Forecast Eligible Retail Customer Load by Month .............................................................. 28 Figure 3-19: Supply Obligation in MidAmerican’s Forecasts .................................................................................................... 29 Figure 3-20: Sample Daily Load Shape, Summer Day in MidAmerican’s Forecasts ........................................................ 30 Figure 3-21: Sample Daily Load Shape, Spring Day in MidAmerican’s Forecasts ............................................................ 30 Figure 3-22: Load Factor in MidAmerican’s Forecasts ................................................................................................................. 31 Figure 3-23: Coefficient of Variation of Daily Peak-Period Loads ........................................................................................... 33 Figure 3-24: Example of Over- and Under-Hedging of Hourly Load ...................................................................................... 33 Figure 3-25: Comparison of Ameren Illinois, ComEd, and MidAmerican High and Low Load Forecasts for
Delivery Year 2020-2021 ................................................................................................................................................... 36 Figure 4-1: Ameren Illinois’ On-Peak Supply Gap - June 2020-May 2025 Period - Base Case Load Forecast ..... 39 Figure 4-2: ComEd’s On-Peak Supply Gap - June 2020-May 2025 period - Base Case Load Forecast .................... 40 Figure 4-3: MidAmerican’s On-Peak Supply Gap - June 2020-May 2025 period - Base Case Load Forecast ....... 41 Figure 5-1: PJM / NERC Projected Capacity Supply and Demand for Delivery Years 2019-2020 to 2024-2025
........................................................................................................................................................................................................ 43 Figure 5-2: MISO / NERC Projected Capacity Supply and Demand for the Delivery Years 2019-2020 to 2024-
2025 ............................................................................................................................................................................................. 44 Figure 5-3: PJM (ComEd Zone) Capacity Price for Delivery Years 2012-2013 to 2021-2022 .................................... 46 Figure 5-4: MISO PRA Results .................................................................................................................................................................. 50 Figure 6-1: Purchased Electricity Adjustments in Cents/kWh, June 2011 – September 2019 .................................. 59 Figure 7-1: Ameren Illinois Off-Peak Energy Supply Portfolio and Load ............................................................................. 64 Figure 7-2: Ameren Illinois Peak Energy Supply Portfolio and Load .................................................................................... 65 Figure 7-3: ComEd Peak Energy Supply Portfolio and Load ...................................................................................................... 67 Figure 7-4: ComEd Off-Peak Energy Supply Portfolio and Load .............................................................................................. 67 Figure 7-5: MidAmerican Peak Energy Supply Portfolio and Load ........................................................................................ 69 Figure 7-6: MidAmerican Off-Peak Energy Supply Portfolio and Load ................................................................................. 69

Illinois Power Agency Final 2020 Procurement Plan January 17, 2020
1
1 Executive Summary
This is the twelfth electricity procurement plan (the “Plan,” “Procurement Plan,” “2020 Plan,” or “2020 Procurement Plan”) prepared by the Illinois Power Agency (“IPA” or “Agency”) under the authority granted to it under the Illinois Power Agency Act (“IPA Act”) and the Illinois Public Utilities Act (“PUA”). Chapter 2 of this Plan describes the specific legislative authority and requirements to be included in the plan, including those set forth in previous orders of the Illinois Commerce Commission (“Commission” or “ICC”).
The Plan addresses the provision of electricity for the “eligible retail customers” of Ameren Illinois Company (“Ameren Illinois”), Commonwealth Edison Company (“ComEd”), and MidAmerican Energy Company (“MidAmerican”). Following MidAmerican’s participation for its fourth time in the 2019 IPA Procurement Plan, MidAmerican has again elected to have the IPA procure power and energy for a portion of its eligible Illinois customers through the 2020 Plan.1
As defined in Section 16-111.5(a) of the PUA, “eligible retail customers” are for Ameren Illinois and ComEd generally residential and small commercial fixed price customers who have not chosen service from an alternate supplier. For MidAmerican, eligible retail customers include residential, commercial, industrial, street lighting, and public authority customers that purchase power and energy from MidAmerican under fixed-price bundled service tariffs. The Plan considers a 5-year planning horizon that begins with the 2020-2021 Delivery Year2 and lasts through the 2024-2025 Delivery Year.
The 2019 Procurement Plan, as approved by the Commission in Docket No. 18-1564, called for the energy requirements for Ameren Illinois, ComEd, and MidAmerican to be procured by the IPA through two block energy procurements (Spring 2019 and Fall 2019). In addition, the 2019 Plan included two capacity procurements for Ameren Illinois (Spring 2019 and Fall 2019). The 2019 Procurement Plan also recommended a continuation of the energy procurement strategies proposed in the 2018 Procurement Plan. This 2020 Procurement Plan recommends a further continuation of those strategies.
Renewable energy resources are now procured through procurements and programs subject to a separate planning process. Those include procurements and programs described in the Long-Term Renewable Resources Procurement Plan (“Long-Term Plan”) developed by the IPA and approved by the Commission on April 3, 2018 in Docket No. 17-0838.
Section 16-111.5(b)(5)(ii)(B) of the PUA calls for that Long-Term Plan to be updated, and possibly revised, every two years “in conjunction with the Agency's other planning and approval processes” to the extent practicable. Concurrent with the release of the draft 2020 Procurement Plan, the Agency also released a draft Revised Long-Term Renewable Resources Procurement Plan for public comment, and while the two plans will be subject to separate written comment processes and will be filed separately with the Illinois Commerce Commission, public hearings for receiving comment were jointly held.
1.1 Power Procurement Strategy
The 2020 Plan proposes to continue using the risk management and procurement strategy that the IPA has historically utilized: hedging load by procuring on and off-peak blocks of forward energy in a three-year laddered approach. The IPA believes the continuation of its tested and proven risk management strategy is the most prudent and reasonable approach, and the approach most likely to meet its statutorily mandated objective to “[d]evelop electricity procurement plans to ensure adequate, reliable, affordable, efficient, and
1 While procurement plans are required to be prepared annually for Ameren Illinois and ComEd, Section 16-111.5(a) of the PUA states that “[a] small multi-jurisdictional electric utility . . . may elect to procure power and energy for all or a portion of its eligible Illinois retail customers” in accordance with the planning and procurement provisions found in the IPA Act. On April 9, 2015, MidAmerican formally notified the IPA of its intent to procure power and energy for a portion of its eligible retail customer load through the IPA for the first time and to participate in its 2016 procurement planning process. This Plan reflects the continued inclusion of MidAmerican in the IPA’s 2020 procurement planning process.
2 As defined by Section 1-10 of the IPA Act, a delivery year lasts from June 1 until May 31 of the following year. (20 ILCS 3855/1-10).

Illinois Power Agency Final 2020 Procurement Plan January 17, 2020
2
environmentally sustainable electric service at the lowest total cost over time, taking into account any benefits of price stability.”3
The IPA’s energy hedging strategy for the 2020 Procurement Plan is consistent with the strategy used for the 2019 Plan. That strategy involves the procurement of hedges in 2020 to meet a portion of anticipated eligible retail customer energy supply requirements for a three-year period and includes two block energy procurement events, one in the Spring and the second in the Fall. Details of this procurement strategy can be found in Section 7.1.
Additionally, for Ameren Illinois, for the 2021-2022 Delivery Year, the IPA recommends continuing the strategy of procuring up to 50% of its forecasted capacity requirements in bilateral transactions and the remaining balance through the MISO Planning Resource Auction (“PRA”).4 For the 2022-2023 Delivery Year, the IPA recommends procuring up to 25% of its forecasted capacity requirements in bilateral transactions in 2020, with the balance of forecast capacity requirement to be determined in the 2021 Electricity Procurement Plan. For ComEd, consistent with the strategy adopted in prior plans, the IPA proposes that forecasted capacity requirements be secured by ComEd through the PJM Reliability Pricing Model process. Consistent with the approach taken in the 2019 Plan, the IPA recommends that MidAmerican’s forecasted capacity deficit be secured by MidAmerican through the annual MISO PRA.5
In addition to the various proposals above, the IPA recommends that ancillary services, load balancing services, and transmission services be purchased by Ameren Illinois and MidAmerican from the MISO marketplace and by ComEd from the PJM markets.
The following tables summarize the IPA’s proposed hedging strategy and planned procurements:
Table 1-1: Summary of Energy Hedging Strategy for all Utilities6
Spring 2020 Procurement Fall 2020 Procurement
June 2020-May 2021 (Upcoming Delivery Year)
Upcoming Delivery Year+1
Upcoming Delivery Year+2
October 2020-May
2021
Upcoming Delivery Year + 1
Upcoming Delivery Year + 2
June 100% peak and off peak
July and Aug. 106% peak, 100% off peak Sep. 100% peak and off peak
Oct. - May 75% peak and off peak
37.5% 12.5% 100% 50% 25%
3 20 ILCS 3855/1-20(a)(1).
4 The PRA is an annual capacity auction that determines clearing prices on a zonal basis. The PRA provides load serving entities in MISO with an option for meeting their capacity obligations by buying capacity from the auction.
5 MidAmerican utilizes the IPA’s procurement process to meet only that portion of its requirements not under existing contracts (or allocated to its Illinois service territory).
6 Table 1-1 shows the cumulative percentage of load to be hedged by the conclusion of the indicated procurement events.
Illinois Power Agency Final 2020 Procurement Plan January 17, 2020
3
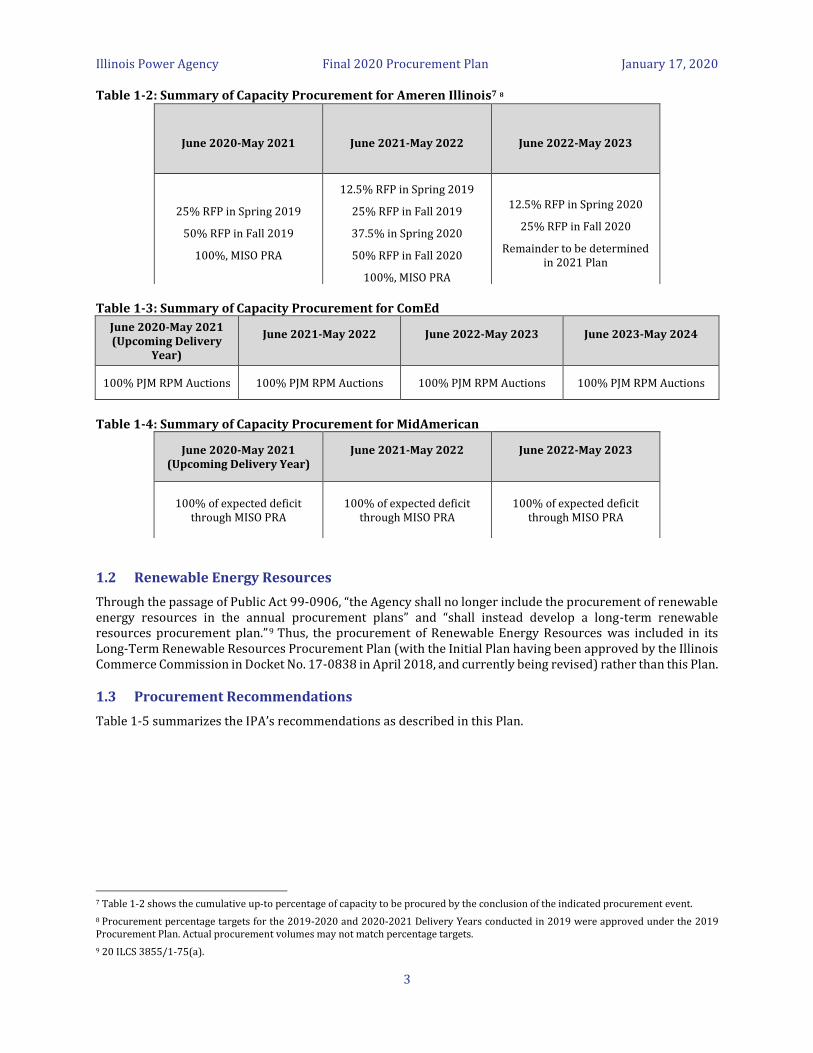
Table 1-2: Summary of Capacity Procurement for Ameren Illinois7 8
Table 1-3: Summary of Capacity Procurement for ComEd
June 2020-May 2021 (Upcoming Delivery
Year)
June 2021-May 2022
June 2022-May 2023
June 2023-May 2024
100% PJM RPM Auctions 100% PJM RPM Auctions 100% PJM RPM Auctions 100% PJM RPM Auctions
Table 1-4: Summary of Capacity Procurement for MidAmerican
1.2 Renewable Energy Resources
Through the passage of Public Act 99-0906, “the Agency shall no longer include the procurement of renewable energy resources in the annual procurement plans” and “shall instead develop a long-term renewable resources procurement plan.”9 Thus, the procurement of Renewable Energy Resources was included in its Long-Term Renewable Resources Procurement Plan (with the Initial Plan having been approved by the Illinois Commerce Commission in Docket No. 17-0838 in April 2018, and currently being revised) rather than this Plan.
1.3 Procurement Recommendations
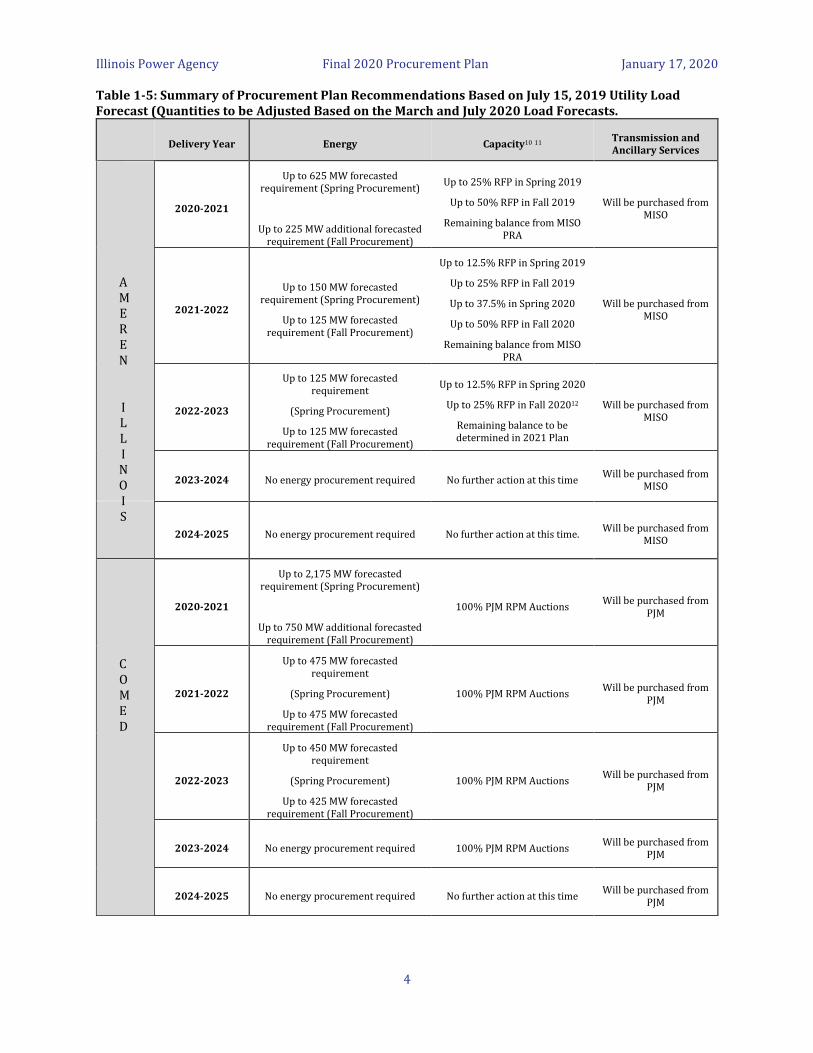
Table 1-5 summarizes the IPA’s recommendations as described in this Plan.
7 Table 1-2 shows the cumulative up-to percentage of capacity to be procured by the conclusion of the indicated procurement event.
8 Procurement percentage targets for the 2019-2020 and 2020-2021 Delivery Years conducted in 2019 were approved under the 2019 Procurement Plan. Actual procurement volumes may not match percentage targets.
9 20 ILCS 3855/1-75(a).
June 2020-May 2021
June 2021-May 2022
June 2022-May 2023
25% RFP in Spring 2019
50% RFP in Fall 2019
100%, MISO PRA
12.5% RFP in Spring 2019
25% RFP in Fall 2019
37.5% in Spring 2020
50% RFP in Fall 2020
100%, MISO PRA
12.5% RFP in Spring 2020
25% RFP in Fall 2020
Remainder to be determined in 2021 Plan
June 2020-May 2021 (Upcoming Delivery Year)
June 2021-May 2022
June 2022-May 2023
100% of expected deficit through MISO PRA
100% of expected deficit
through MISO PRA
100% of expected deficit through MISO PRA
Illinois Power Agency Final 2020 Procurement Plan January 17, 2020
4
Table 1-5: Summary of Procurement Plan Recommendations Based on July 15, 2019 Utility Load Forecast (Quantities to be Adjusted Based on the March and July 2020 Load Forecasts.
Delivery Year Energy Capacity10 11 Transmission and Ancillary Services
2020-2021
Up to 625 MW forecasted requirement (Spring Procurement)
Up to 225 MW additional forecasted requirement (Fall Procurement)
Up to 25% RFP in Spring 2019
Up to 50% RFP in Fall 2019
Remaining balance from MISO PRA
Will be purchased from MISO
2021-2022
Up to 150 MW forecasted requirement (Spring Procurement)
Up to 125 MW forecasted requirement (Fall Procurement)
Up to 12.5% RFP in Spring 2019
Up to 25% RFP in Fall 2019
Up to 37.5% in Spring 2020
Up to 50% RFP in Fall 2020
Remaining balance from MISO PRA
Will be purchased from MISO
2022-2023
Up to 125 MW forecasted requirement
(Spring Procurement)
Up to 125 MW forecasted requirement (Fall Procurement)
Up to 12.5% RFP in Spring 2020
Up to 25% RFP in Fall 202012
Remaining balance to be determined in 2021 Plan
Will be purchased from MISO
2023-2024 No energy procurement required No further action at this time Will be purchased from
MISO
2024-2025 No energy procurement required No further action at this time. Will be purchased from
MISO
2020-2021
Up to 2,175 MW forecasted requirement (Spring Procurement)
Up to 750 MW additional forecasted requirement (Fall Procurement)
100% PJM RPM Auctions Will be purchased from
PJM
2021-2022
Up to 475 MW forecasted requirement
(Spring Procurement)
Up to 475 MW forecasted requirement (Fall Procurement)
100% PJM RPM Auctions Will be purchased from
PJM
2022-2023
Up to 450 MW forecasted requirement
(Spring Procurement)
Up to 425 MW forecasted requirement (Fall Procurement)
100% PJM RPM Auctions Will be purchased from
PJM
2023-2024 No energy procurement required 100% PJM RPM Auctions Will be purchased from
PJM
2024-2025 No energy procurement required No further action at this time Will be purchased from
PJM
COMED
AMEREN
ILLINOIS
Illinois Power Agency Final 2020 Procurement Plan January 17, 2020
5
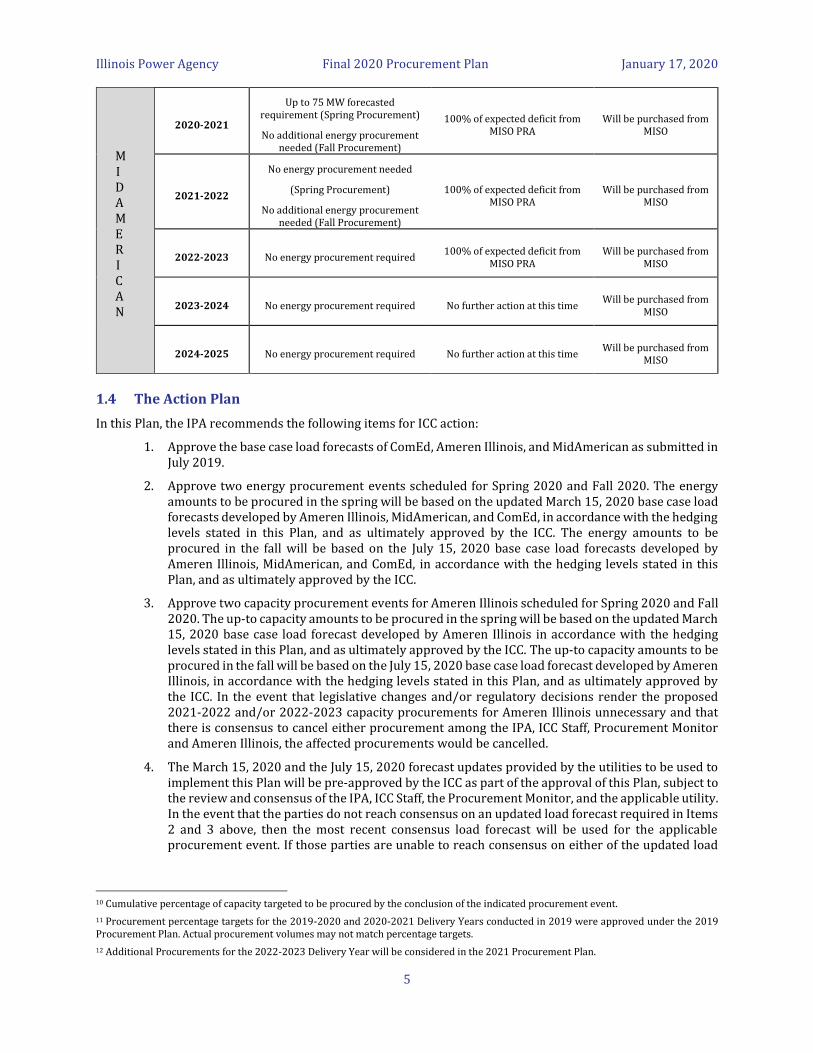
2020-2021
Up to 75 MW forecasted requirement (Spring Procurement)
No additional energy procurement needed (Fall Procurement)
100% of expected deficit from MISO PRA
Will be purchased from MISO
2021-2022
No energy procurement needed
(Spring Procurement)
No additional energy procurement needed (Fall Procurement)
100% of expected deficit from MISO PRA
Will be purchased from MISO
2022-2023 No energy procurement required 100% of expected deficit from
MISO PRA Will be purchased from
MISO
2023-2024 No energy procurement required No further action at this time Will be purchased from
MISO
2024-2025 No energy procurement required No further action at this time Will be purchased from
MISO
1.4 The Action Plan
In this Plan, the IPA recommends the following items for ICC action:
1. Approve the base case load forecasts of ComEd, Ameren Illinois, and MidAmerican as submitted in July 2019.
2. Approve two energy procurement events scheduled for Spring 2020 and Fall 2020. The energy amounts to be procured in the spring will be based on the updated March 15, 2020 base case load forecasts developed by Ameren Illinois, MidAmerican, and ComEd, in accordance with the hedging levels stated in this Plan, and as ultimately approved by the ICC. The energy amounts to be procured in the fall will be based on the July 15, 2020 base case load forecasts developed by Ameren Illinois, MidAmerican, and ComEd, in accordance with the hedging levels stated in this Plan, and as ultimately approved by the ICC.
3. Approve two capacity procurement events for Ameren Illinois scheduled for Spring 2020 and Fall 2020. The up-to capacity amounts to be procured in the spring will be based on the updated March 15, 2020 base case load forecast developed by Ameren Illinois in accordance with the hedging levels stated in this Plan, and as ultimately approved by the ICC. The up-to capacity amounts to be procured in the fall will be based on the July 15, 2020 base case load forecast developed by Ameren Illinois, in accordance with the hedging levels stated in this Plan, and as ultimately approved by the ICC. In the event that legislative changes and/or regulatory decisions render the proposed 2021-2022 and/or 2022-2023 capacity procurements for Ameren Illinois unnecessary and that there is consensus to cancel either procurement among the IPA, ICC Staff, Procurement Monitor and Ameren Illinois, the affected procurements would be cancelled.
4. The March 15, 2020 and the July 15, 2020 forecast updates provided by the utilities to be used to implement this Plan will be pre-approved by the ICC as part of the approval of this Plan, subject to the review and consensus of the IPA, ICC Staff, the Procurement Monitor, and the applicable utility. In the event that the parties do not reach consensus on an updated load forecast required in Items 2 and 3 above, then the most recent consensus load forecast will be used for the applicable procurement event. If those parties are unable to reach consensus on either of the updated load
10 Cumulative percentage of capacity targeted to be procured by the conclusion of the indicated procurement event.
11 Procurement percentage targets for the 2019-2020 and 2020-2021 Delivery Years conducted in 2019 were approved under the 2019 Procurement Plan. Actual procurement volumes may not match percentage targets.
12 Additional Procurements for the 2022-2023 Delivery Year will be considered in the 2021 Procurement Plan.
MIDAMERICAN

Illinois Power Agency Final 2020 Procurement Plan January 17, 2020
6
forecasts required in Items 2 and 3 above, then the July 2019 load forecast will be used for the applicable procurement event.
5. Approve procurement by ComEd, Ameren Illinois, and MidAmerican of capacity, network transmission service and ancillary services from each utility’s respective Regional Transmission Organization (“RTO”).
The Illinois Power Agency respectfully files its Final 2020 Procurement Plan, reflecting the Commission’s Order approving its Plan in Docket No. 19-0951, including the approval of the specific action items listed above, which the Commission has found will produce the “lowest total cost over time, taking into account any benefits of price stability,” as required by Section 16-111.5(d)(4) of the PUA.

Illinois Power Agency Final 2020 Procurement Plan January 17, 2020
7
2 Legislative/Regulatory Requirements of the Plan
This Section of the 2020 Procurement Plan describes the legislative and regulatory requirements applicable to the Agency’s annual Procurement Plan, including compliance with previous Commission Orders. The Regulatory Compliance Index (Appendix A) provides a complete cross-index of regulatory/legislative requirements and the specific sections of this Plan that address each requirement identified.
Public Act 99-0906, which became effective on June 1, 2017, substantially modified what elements are to be included in the IPA’s annual “power procurement plan.” Starting with the 2018 Procurement Plan, the IPA no longer includes the procurement of renewable energy resources as part of the annual procurement plan.13 The procurement of renewable energy resources to comply with the Illinois Renewable Portfolio Standard (“RPS”) requirements in Section 1-75(c) of the IPA Act is instead addressed through the IPA’s separately-developed Long-Term Renewable Resources Procurement Plan, first approved by the Illinois Commerce Commission on April 3, 2018 in Docket No. 17-0838. At the time of this filing, the IPA’s proposed revisions to the Long-Term Renewable Resources Procurement Plan are being addressed in Docket No. 19-0995.
Public Act 99-0906 also included revisions to the state’s energy efficiency portfolio standard (found in Section 8-103 of the PUA) as well as the elimination of the mechanism through which incremental energy efficiency programs were included in IPA procurement plans under Section 16-111.5B of the PUA. 14 The 2020 Procurement Plan is focused only on the procurement of standard wholesale power products to meet the needs of the Ameren Illinois, ComEd and MidAmerican eligible retail customers.
2.1 IPA Authority
The IPA was established in 2007 by Public Act 95-0481 to ensure that ratepayers, specifically customers in service classes that have not been declared competitive and who take service from the utility’s bundled rate (“eligible retail customers”),15 benefit from retail and wholesale competition. The original objective of the IPA Act was to improve the process to procure electricity for those customers.16 In creating the IPA, the General Assembly found that Illinois citizens should be provided “adequate, reliable, affordable, efficient, and environmentally-sustainable electric service at the lowest total cost over time, taking into account benefits of price stability.”17 The IPA Act thus directs the IPA to “[d]evelop electricity procurement plans” and conduct competitive procurement processes to bring resources under contract in a manner consistent with those findings.
Each year, the IPA thus must develop a “power procurement plan” and conduct a competitive procurement process to procure supply resources as identified in its procurement plan as approved by the Commission pursuant to Section 16-111.5 of the PUA. 18 The purpose of the power procurement plan is to secure the wholesale electric power products and associated transmission services to meet the needs of eligible retail customers in the service areas of Commonwealth Edison Company (“ComEd”) and Ameren Illinois Company (“Ameren Illinois”), as well as “small multi-jurisdictional utilities” should they request to participate.19 The IPA Act directs that the procurement plan be developed and the competitive procurement process be conducted by “experts or expert consulting firms,” respectively known as the “Procurement Planning Consultant” 20 and
13 See 20 ILCS 3855/1-75(a); 220 ILCS 5/16-111.5(b)(5).
14 See 220 ILCS 5/16-111.5B(a)(5) (“The requirements set forth in paragraphs (1) through (5) of this subsection (a)” – i.e., the solicitation, inclusion, and approval of incremental energy efficiency programs in IPA procurement plans – “shall terminate after the filing of the procurement plan in 2015, and no energy efficiency shall be procured by the Agency thereafter. Energy efficiency programs approved previously under this Section shall terminate no later than December 31, 2017.”).
15 220 ILCS 5/16-111.5(a).
16 See 20 ILCS 3855/1-5(2)-(4).
17 20 ILCS 3855/1-5(1).
18 See 20 ILCS 3855/1-20(a)(2), 1-75(a).
19 20 ILCS 3855/1-20(a)(1). MidAmerican elected to participate in IPA Procurement Plans starting in 2016 and will continue to participate in the 2020 Plan. See also 220 ILCS 5/16-111.5(a). (“This Section shall not apply to a small multi-jurisdictional utility until such time as a small multi-jurisdictional utility requests the Illinois Power Agency to prepare a procurement plan for its eligible retail customers.”)
20 20 ILCS 3855/1-75(a)(1).
Illinois Power Agency Final 2020 Procurement Plan January 17, 2020
8
“Procurement Administrator.”21 The Illinois Commerce Commission is tasked with approval of the plan and monitoring of the procurement events through a Commission-hired “Procurement Monitor.”22
Public Act 99-0906 modified the IPA’s procurement planning process in part through the introduction of new requirements impacting the Agency. These requirements include the development of a separate zero emission standard procurement plan and the procurement of zero-emission credits from zero-emission generators (i.e., nuclear power plants);23 the development of a separate long-term plan for the procurement of renewable energy resources (which includes the development of an adjustable block program to procure renewable energy credits from distributed generation and community solar projects; and the development of a low-income solar program using, in part, money held in the Renewable Energy Resources Fund); 24 and the elimination of the statutory requirement that the Agency include cost-effective incremental energy efficiency programs in its annual power procurement plan.25
2.2 Procurement Plan Development and Approval Process
Although elements of the procurement planning process are ongoing, with the Agency continually soliciting and incorporating stakeholder input and lessons from past proceedings while monitoring ongoing energy market activity, the formal process for composing the 2020 Procurement Plan began on July 15, 2019. By that date, each Illinois utility that procures electricity through the IPA (ComEd, Ameren Illinois, and MidAmerican) had submitted load forecasts to the Agency. These forecasts – which form the backbone of the Procurement Plan and which are covered in Sections 3.2, 3.3, and 3.4 in greater detail – cover a five-year planning horizon and include hourly data representing high, low, and base/expected scenarios for the load of the eligible retail customers.
After the receipt of load forecasts from the utilities, the IPA next prepares a draft Procurement Plan. The 2020 Plan was made available for public review and comment on August 15, 2019. The Public Utilities Act provides for a 30-day comment period starting on the day the IPA releases its draft plan. The 2020 Plan comment period concluded as scheduled on September 16, 2019.26 Written comments were received from only Ameren Illinois. During the 30-day comment period, the Agency held public hearings within each participating utility’s service area for the purpose of receiving public comment on the draft Procurement Plan.27
After the receipt of comments, and within 14 days after the conclusion of the comment period, the IPA “shall revise the procurement plan as necessary based on the comments received” and file that revised Plan with the Commission.28 The IPA’s 2020 Plan was filed with the Commission on September 30, 2019. Within 5 days after the Procurement Plan is filed with the Commission, parties must file Objections to the Plan.29
Only Ameren Illinois filed Objections to the Plan. Staff of the Commission and the Office of the Attorney General also participated in this proceeding.30
Under the PUA, the Commission approves the Procurement Plan, including the load forecasts used in the Plan, if the Commission determines that “it will ensure adequate, reliable, affordable, efficient, and environmentally sustainable electric service at the lowest total cost over time, taking into account any benefits of price
21 20 ILCS 3855/1-75(a)(2).
22 220 ILCS 5/16-111.5(b), (c)(2).
23 See 20 ILCS 3855/1-75(d-5).
24 See 20 ILCS 3855/1-75(c); Docket No. 17-0838.
25 See 220 ILCS 5/16-111.5B.
26 The 30 day deadline, September 14, 2019, falls on a Saturday; hence, comments were due the next business day (Monday September 16).
27 220 ILCS 5/16-111.5(d)(2). For the 2020 Plan, public hearings were held concurrently with public hearings on the Agency’s draft Revised Long-Term Renewable Resources Procurement Plan, which was to be developed in conjunction with this Plan’s development, comment, and approval processes to the extent practicable. (See 220 ILCS 5/16-111.5(b)(5)(ii)(B)). Public hearings took place on September 3, 2019 in Chicago, and September 4, 2019 in both Springfield and Moline. No comments were received at the hearings.
28 See 220 ILCS 5/16-111.5(d)(2).
29 220 ILCS 5/16-111.5(d)(3).
30 See generally Docket No. 19-0951.
Illinois Power Agency Final 2020 Procurement Plan January 17, 2020
9
stability.” 31 The Commission approved the 2020 Plan without modifications in Docket No. 19-0951 on December 19, 2019,32 and this Final Plan reflects the approval.
2.3 Procurement Plan Requirements
At its core, the Procurement Plan consists of three pieces: (1) a forecast of how much energy (and in some cases capacity) is required by eligible retail customers; (2) the supply currently under contract; and (3) what type and how much supply must be procured to meet load requirements and to satisfy all other legal requirements associated with the Procurement Plan. To that end, the Procurement Plan must contain an hourly load analysis, which includes: multi-year historical analysis of hourly loads; switching trends and competitive retail market analysis; known or projected changes to future loads; and growth forecasts by customer class.33 In addition, the Procurement Plan must analyze the impact of demand side and renewable energy initiatives, including the impact of demand response programs and energy efficiency programs, both current and projected.34 Based on the hourly load analysis, the Procurement Plan must detail the IPA’s plan for meeting the expected load requirements that will not be met through pre-existing contracts,35 and in doing so must:
• Define the different Illinois retail customer classes for which supply is being purchased, and include monthly forecasted system supply requirements, including expected minimum, maximum, and average values for the planning period.36
• Include the proposed mix and selection of standard wholesale products for which contracts will be executed during the next year that, separately or in combination, will meet the portion of the load requirements not met through pre-existing contracts or in the case of MidAmerican, including allocations to eligible Illinois customers of energy and capacity from company owned generating resources.37 Such standard wholesale products include, but are not limited to, monthly 5 x 16 peak period block energy, monthly off-peak wrap energy, monthly 7 x 24 energy, annual 5 x 16 energy, annual off-peak wrap energy, annual 7 x 24 energy, monthly capacity, annual capacity, peak load capacity obligations, capacity purchase plan, and ancillary services.38
• Detail the proposed term structures for each wholesale product type included in the portfolio of products.39
• Assess the price risk, load uncertainty, and other factors associated with the proposed portfolio measures, including, to the extent possible, the following factors: contract terms; time frames for security products or services; fuel costs; weather patterns; transmission costs; market conditions; and the governmental regulatory environment.40 For those portfolio measures that are identified as having significant price risk, the Plan shall identify alternatives to those measures.
• For load requirements included in the Plan, include the proposed procedures for balancing loads, including the process for hourly load balancing of supply and demand and the criteria for portfolio re-balancing in the event of significant shifts in load. 41
• Include demand-response products, as discussed below.
31 220 ILCS 5/16-111.5(d)(4).
32 See Docket No. 19-0951, Final Order dated December 19, 2019 at 18.
33 220 ILCS 5/16-111.5(b)(1)(i)-(iv).
34 220 ILCS 5/16-111.5(b)(2), (b)(2)(i).
35 220 ILCS 5/16-111.5(b)(3).
36 220 ILCS 5/16-111.5(b)(i), (b)(iii).
37 220 ILCS 5/16-111.5(b)(3)(iv).
38 Id.
39 220 ILCS 5/16-111.5(b)(3)(v).
40 220 ILCS 5/16-111.5(b)(3)(vi).
41 220 ILCS 5/16-111.5(b)(4).
Illinois Power Agency Final 2020 Procurement Plan January 17, 2020
10
2.4 Standard Product Procurement
As noted in Section 2.3, the IPA Act provides examples of “standard wholesale products.”42 This listing has been understood by the Commission to be non-exhaustive and non-static. 43 Instead, as articulated by the Commission in approving the 2015 Plan, “[w]henever the Commission is confronted with a unique product, there must be an examination of the attributes of the product and whether those are consistent with other commonly traded products in the wholesale market” to determine whether the product meets this definition, and such products “must be routinely traded in a liquid market and have transparent prices that allow participants a degree of assurance that they are receiving fair market prices.”44
Reading Subsection 16-111.5(b)(3)(vi) in conjunction with Subsection 16-111.5(e) and the ICC’s Order approving the IPA’s 2014 Procurement Plan,45 the IPA understands that the definition of “standard product” also includes wholesale load-following products (including “full requirements” products) so long as the product definition is standardized such that bids may be judged solely on price. 46 With respect to demand-side products, in approving the 2015 Plan the Commission determined that block super-peak energy efficiency products proposed for procurement by the Agency “should not be procured at this time,” but left open the possibility that “as demand-side markets evolve and energy efficiency products become more standardized, the Commission could envision a time in which these products might satisfy Section 16-111.5 of the PUA.”47
2.5 Demand Response Products
The IPA may include cost-effective demand response products in its Procurement Plan. The Procurement Plan must include the particular “mix of cost-effective, demand-response products for which contracts will be executed during the next year, to meet the expected load requirements that will not be met through preexisting contracts.”48 Under the PUA, cost-effective demand-response measures may be procured whenever the cost is lower than procuring comparable capacity products, if the product and company offering the product meet minimum standards.49 Specifically:
• The demand-response measures must be procured by a demand-response provider from eligible retail customers;50
• The products must at least satisfy the demand-response requirements of the regional transmission organization market in which the utility’s service territory is located, including, but not limited to, any applicable capacity or dispatch requirements;51
42 220 ILCS 5/16-111.5(b)(3)(iv).
43 See Docket No. 14-0588, Final Order dated December 17, 2014 at 156 (“the list enumerated in 16-111.5(b)(3)(iv) contains the phrase ‘including but not limited to’ which expands the list rather than limits it;” “the phrase ‘standard wholesale products’ cannot be static and it depends on the products that may be traded in wholesale markets at a given time”).
44 Id.
45 While not adopting the Illinois Competitive Energy Association’s full requirements proposal, the Commission’s Final Order approving the IPA’s 2014 Plan made clear that wholesale load-following products, including “full requirements” products, may qualify as a “standard product.” See Docket No. 13-0546, Final Order dated December 18, 2013 at 94 (“the Commission agrees with Staff and the IPA that full requirements products should be considered a ‘standard product’ under Section 16-111.5”). 46 See, e.g., 220 ILCS 5/16-111.5(e)(2) (requiring development of standardized “contract forms and credit terms” for a procurement); 16-111.5(e)(3)-(4) (creation of a price-based benchmark and selection of bids “on the basis of price”); Docket No. 09-0373, Final Order dated December 28, 2009 at 115-116 (Commission approval of long-term renewable resource PPA project selection based on price alone). Note also that the Commission’s Order approving the 2015 Procurement Plan indicates that “as demand-side markets evolve and energy efficiency products become more standardized, the Commission could envision a time in which these products might satisfy Section 16-111.5 of the PUA.” (Docket No. 14-0588, Final Order dated December 17, 2014 at 156).
47 Docket No. 14-0588, Final Order dated December 17, 2014 at 156.
48 220 ILCS 5/16-111.5(b)(3)(ii).
49 Id.
50 220 ILCS 5/16-111.5(b)(3)(ii)(A).
51 220 ILCS 5/16-111.5(b)(3)(ii)(B).
Illinois Power Agency Final 2020 Procurement Plan January 17, 2020
11
• The products must provide for customers’ participation in the stream of benefits produced by the demand-response products; 52
• The provider must have a plan for the reimbursement of the utility for any costs incurred as a result of the failure of the provider to perform its obligations;53; and
• Demand-response measures included in the plan shall meet the same credit requirements as apply to suppliers of capacity in the applicable regional transmission organization market.54
Public Act 97-0616, the Energy Infrastructure Modernization Act (“EIMA”), required ComEd and Ameren Illinois to file tariffs instituting an opt-in market-based peak time rebate (“PTR”) program with the Commission within 60 days after the Commission approved the utility’s AMI Plan. 55 ComEd’s PTR program was provisionally approved in Docket No. 12-0484, and Ameren Illinois’ PTR program was likewise provisionally approved in Docket No. 13-0105. 56 These programs are discussed further in Section 7.4, where demand response resource choices are examined.
Public Act 99-0906 made significant revisions to the energy efficiency and demand response portfolio standard found in Section 8-103 of the Public Utilities Act, creating new requirements that became effective on January 1, 2018. On June 30, 2017, ComEd filed its 2018-2021 Energy Efficiency and Demand Response Plan; for its demand response goal, ComEd proposed to implement a demand response program element that would fund the enrollment into its air conditioning (“AC”) cycling program of any purchasers of qualified smart thermostats from ComEd’s other residential program elements. 57 Ameren Illinois also filed its Energy Efficiency and Demand-Response Plan on June 30, 2017; Ameren Illinois proposed to achieve demand response reductions and meet its obligations under Section 8-103B(g)(4.5) through the peak demand reduction coincident to the electric energy efficiency savings proposed in its plan.58 These Plans were both approved by the Commission on September 11, 2017.59
2.6 Clean Coal Portfolio Standard
The IPA Act contains an aspirational goal that cost-effective clean coal resources will account for 25% of the electricity used in Illinois by January 1, 2025.60 As a part of the goal, the Plan must also include electricity generated from clean coal facilities.61 While there is a broader definition of “clean coal facility” contained in the definition section of the IPA Act,62 Section 1-75(d) describes two special cases: the “initial clean coal facility”63 and “electricity generated by power plants that were previously owned by Illinois utilities and that have been or will be converted into clean coal facilities” (i.e., “retrofit clean coal facility”).64 Currently, there is no facility meeting the definition of an “initial clean coal facility” or a “retrofit clean coal facility” that the IPA is aware of, that has announced plans to begin operations within the next five years. A discussion of the considerations and challenges associated with possible clean coal procurements is contained in Section 7.4.
In Docket No. 12-0544, the Commission approved inclusion of the FutureGen 2.0 project as a “retrofit clean coal facility” starting in the 2017-2018 Delivery Year; that administrative approval and the associated cost recovery
52 220 ILCS 5/16-111.5(b)(3)(ii)(C).
53 220 ILCS 5/16-111.5(b)(3)(ii)(D).
54 220 ILCS 5/16-111.5(b)(3)(ii)(E).
55 220 ILCS 5/16-108.6(g).
56 See Docket No. 12-0484, Interim Order dated February 21, 2013 at 32; Docket No. 13-0105, Interim Order dated January 7, 2014 at 19.
57 See Docket No. 17-0312, Final Order dated September 11, 2017 at 19.
58 See Docket No. 17-0311, Final Order dated September 11, 2017 at 46-47.
59 The Commission’s approval of the Ameren Illinois plan in Docket No. 17-0311 was appealed by the People of the State of Illinois, through the Office of the Attorney General, to the Illinois Appellate Court, Fourth District under Case No. 4-17-0870.
60 20 ILCS 3855/1-75(d).
61 20 ILCS 3855/1-75(d)(1).
62 20 ILCS 3855/1-10.
63 Id.
64 20 ILCS 3855/1-75(d)(5).
Illinois Power Agency Final 2020 Procurement Plan January 17, 2020
12
mechanism were subsequently appealed, and initially upheld by the Illinois First District Appellate Court.65 With an appeal still pending before the Illinois Supreme Court, the U.S. Department of Energy (“U.S. DOE”) announced in February 2015 that federal funding for the project would be suspended. 66 The FutureGen Alliance’s Board of Directors “approved a resolution, dated January 6, 2016, ceasing all FutureGen Project development efforts” 67 and FutureGen exercised its right to terminate the prior-approved FutureGen 2.0 Sourcing Agreements with ComEd and Ameren Illinois. The Illinois Supreme Court subsequently dismissed the pending appeal of the appellate court’s decision as moot through a May 2016 ruling, vacating the judgment of the appellate court without expressing an opinion on its merits while refraining from vacating those portions of the Commission’s Order approving the 2013 Procurement Plan concerning FutureGen 2.0 sourcing agreements and related authority.68
2.7 Recent Legislative Proposals and Related Developments
Under changes made to Section 1-75(c) of the IPA Act and Section 16-111.5 of the PUA, the Agency’s responsibility for renewable energy resource procurement has transitioned from meeting percentage-based renewables requirements applicable to eligible retail customer load to meeting similar percentage-based requirements for all retail customer load.69 As part of this transition, the IPA was tasked with developing a separate Long-Term Renewable Resources Procurement Plan through which it proposed procurements and programs to meet these new targets,70 conducting “initial forward procurements” of renewable energy credits from new wind projects and new utility-scale solar and brownfield site photovoltaic projects,71 developing an adjustable block program to support the development of new distributed photovoltaic generation and community solar projects,72 and developing a low-income solar incentive program to support the development of a low-income solar marketplace.73 The Agency’s Long-Term Renewable Resources Procurement Plan was approved by the Commission in Docket No. 17-0838 on April 3, 2018 and is currently being revised as part of Docket No. 19-0951. Incremental energy efficiency programs and renewable energy resource procurement provided for the bulk of contested issues in past IPA Plan approval proceedings. As those issues are now handled through separate proceedings and processes not involving the IPA, the number of contested issues and intensity of arguments in attaining approval of the IPA’s annual procurement plans has been reduced, with just two contested issues for the 2018 Plan, no contested issues for the 2019 Plan, and only one contested issue for the recently-concluded 2020 Plan approval proceeding.
During the Spring 2019 session of the Illinois General Assembly, multiple bills were introduced that would impact the IPA’s planning and procurement processes. These bills include the following:
• HB 3624/SB 2132 (the “Clean Energy Jobs Act”)
• HB 2861/SB 660 (known colloquially as the “Clean Energy Progress Act”)
• HB 2966/SB 1781 (known colloquially as the “Path to 100 Act”)
• HB 2713/SB 2080 (the “Coal to Solar and Energy Storage Act”)
• HB 125/SB 135 (the “Competitive Clean Energy Act”)
65 Commonwealth Edison Co. v. Illinois Commerce Commission, et al., 2014 IL App (1st) 130544, July 22, 2014.
66 See, e.g., http://www.chicagobusiness.com/article/20150203/NEWS11/150209921/futuregen-clean-coal-plant-is-dead.
67 Supplemental Brief of Appellee FutureGen Industrial Alliance, Inc. on the Issue of Mootness, dated January 13, 2016, at 1.
68 Commonwealth Edison Co. v. Illinois Commerce Commission, et al., 2016 IL 118129, May 19, 2016.
69 See 20 ILCS 3855/1-75(c)(1)(B). Among other changes, the revised law also now features quantitative targets for the procurement of renewable energy credits from new generating facilities as well. (See 20 ILCS 3855/1-75(c)(1)(C)).
70 See 20 ILCS 3855/1-75(c)(1)(A); 220 ILCS 5/16-111.5(b)(5).
71 20 ILCS 3855/1-75(c)(1)(G).
72 See 20 ILCS 3855/1-75(c)(1)(K).
73 See 20 ILCS 3855/1-56(b)(2).
Illinois Power Agency Final 2020 Procurement Plan January 17, 2020
13
• HB 81 (additional authority related to clean coal facility sourcing agreements)
Some of these bills – in particular, the first two listed above – would massively expand the Agency’s procurement of standard wholesale products, specifically through the assumption of new responsibilities related to capacity procurements to support new renewable energy development or existing at-risk nuclear facilities, creating overlap with its annual planning process. While the Agency understands that such responsibilities would be likely be handled through a separate planning process, this approach would unquestionably carry impacts on the development of the Agency’s annual procurement plans.
The Spring 2019 legislative session concluded on May 31, 2019 without any of the above bills making significant advancement.74 Likewise, the Fall 2019 veto session, held during October 28-30 and November 12-14, ended without any movement on these bills or other proposals. The General Assembly is scheduled to assemble again starting on January 28, 2020.
The Agency is presently monitoring legislative discussions and plans to be an active participant in any hearings, negotiations, or other discussions in which its interests are implicated. On a national level, litigation and federal policy decisions have continued to shape the United States Environmental Protection Agency’s (“U.S. EPA”) approach to limiting CO2 emissions from coal-fired power plants. On August 3, 2015, the U.S. EPA released its Clean Power Plan rules promulgated pursuant to Section 111(d) of the Clean Air Act, requiring states to develop strategies intended to reduce carbon dioxide emissions associated with electricity generation. On February 9, 2016, the U.S. Supreme Court stayed implementation of the Clean Power Plan pending judicial review.75 Under the Clean Power Plan, initial state compliance plans were scheduled to be due to the U.S. EPA by September 6, 2016, but the stay delayed the timing for the state compliance plan development. In March 2017, President Trump issued an Executive Order seeking to revise or terminate the Clean Power Plan,76 and on October 16, 2017, U.S. EPA published a Proposed Rule to repeal the Clean Power Plan.77 On December 28, 2017, U.S. EPA published an Advance Notice of Proposed Rulemaking with the purpose of soliciting public comment on a new rule to regulate greenhouse gas (“GHG”) emissions from existing electric generating units, written comments were due by February 26, 2018.78 On July 9, 2018 a draft of a new rule, which would replace the Clean Power Plan, was sent to the White House for review.79 The U.S. EPA released its proposed rulemaking, titled the “Affordable Clean Energy” (“ACE”) rule, on August 21, 2018. 80 On June 19, 2019, the EPA issued the final rule to replace the Clean Power Plan. The ACE rule established emissions guidelines for states to use for developing limits to CO2 emissions from coal-fired power plants which identifies coal plant heat rate improvements as the best system of emission reduction (BSER).81 The ACE rule is generally less stringent as compared with the Clean Power Plan (which would have imposed limitations on emissions from power plants to be achieved through switching power plant fuels from coal to
74 For more background, see: https://www.dailyherald.com/news/20190521/energy-legislation-on-the-back-burner-in-springfield.
75 See, e.g., http://www.nytimes.com/2016/02/10/us/politics/supreme-court-blocks-obama-epa-coal-emissions-regulations.html; http://www.scotusblog.com/wp-content/uploads/2016/02/15A773-Clean-Power-Plan-stay-order.pdf.
76See, e.g., https://www.nytimes.com/2017/03/28/climate/trump-executive-order-climate-change.html; https://www.whitehouse.gov/the-press-office/2017/03/28/presidential-executive-order-promoting-energy-independence-and-economi-1.
77 See https://www.regulations.gov/document?D=EPA-HQ-OAR-2017-0355-0002.
78 See https://www.regulations.gov/document?D=EPA-HQ-OAR-2017-0545-0001; https://www.regulations.gov/docketBrowser?rpp=25&so=DESC&sb=commentDueDate&po=0&dct=PS&D=EPA-HQ-OAR-2017-0545.
79 Proctor, D., “EPA Sends Replacement for Clean Power Plan to Trump,” www.powermag.com/category/coal/, July 10, 2018.
80 Emissions Guidelines for Greenhouse Gas Emissions From Existing Electric Utility Generating Units; Revisions to Emission Guideline Implementing Regulations; Revisions to New Source Review Program, 83 Fed. Reg. 44746 (August 31, 2018); see also https://www.epa.gov/stationary-sources-air-pollution/proposal-affordable-clean-energy-ace-rule.
81 See: https://www.epa.gov/stationary-sources-air-pollution/affordable-clean-energy-rule.
Illinois Power Agency Final 2020 Procurement Plan January 17, 2020
14
natural gas, increasing generation from renewable resources, or requiring new coal-fired plants to meet low CO2 emissions limits only possible through the use of carbon capture technology).82 While additional and continued litigation regarding the ACE rule is likely,83 the likelihood and potential impact of any federal CO2 emissions reduction regulations appears reduced, at least for the foreseeable future. Additionally, the Agency is actively monitoring developments at the Federal Energy Regulatory Commission (“FERC”) regarding capacity market constructs for PJM and MISO, the two Regional Transmission Organizations that Illinois is part of, including the recent FERC Order on PJM capacity market design. These are discussed further in Chapter 5 below.
82 “Goodbye, Clean Power Plan: Stanford researchers discuss the new energy rule,” Stanford Woods Institute for the Environment, June 21, 2019.
83 In July 2019, the American Lung Association and the American Public Health Association jointly brought a petition in the U.S. Circuit Court for the District of Columbia (“DC Circuit”) (case no. 19-1140) to challenge the ACE rule; see https://www.apha.org/news-and-media/news-releases/apha-news-releases/2019/ace-rule and https://www.epa.gov/sites/production/files/2019-07/documents/ala_19-1140_pfr_07082019.pdf. On August 13, 2019, a coalition of twenty-two states and seven cities jointly filed a petition in the same court challenging the ACE rule (case no. 19-1165); see https://www.nytimes.com/2019/08/13/climate/states-lawsuit-clean-power-ace.html and https://ag.ny.gov/sites/default/files/2019_08_13_final_petition_for_review.pdf. The following day, August 14th, a group of ten environmental organizations filed a petition on the same matter in the same court (case no. 19-1166); see https://thehill.com/policy/energy-environment/457375-green-groups-sue-trump-for-gutting-obama-power-plant-rules and https://www.nrdc.org/sites/default/files/ace-rule-petition-20190814.pdf. On September 6th, the Solar Energy Industries Association and American Wind Energy Association jointly filed a petition for review of the ACE rule in the DC Circuit (case no. 19-1187); see https://www.epa.gov/sites/production/files/2019-09/documents/awea_19-1187_pfr_09062019.pdf. Also on September 6th, a coalition of large electric utility companies also filed a petition for review in the same court, arguing that the ACE rule’s strategy of limiting emissions reduction measures to existing generating units is inconsistent with the Clean Air Act (case no. 19-1188); see http://ens-newswire.com/2019/09/16/utilities-ask-court-to-reinstate-obamas-clean-power-plan and https://www.epa.gov/sites/production/files/2019-09/documents/cei_19-1188_pfr_09062019.pdf. Besides those mentioned here, at least seven other petitions challenging the ACE rule were filed in the DC Circuit in late August and early September of 2019. The U.S. EPA has requested expedited consideration of all these petitions.
Illinois Power Agency Final 2020 Procurement Plan January 17, 2020
15
3 Load Forecasts
3.1 Statutory Requirements
Under Illinois law, a procurement plan must be prepared annually for each “electric utility that on December 31, 2005 served at least 100,000 customers in Illinois.”84 Section 16-115(a) of the PUA allows small multi-jurisdictional electric utilities to elect to have the IPA procure power and energy for all or a portion of its eligible retail customer load in Illinois. Besides the two electric utilities that serve at least 100,000 customers in Illinois, Ameren Illinois and ComEd, a third electric utility, MidAmerican, which serves fewer than 100,000 electric customers in Illinois, has elected to have the IPA procure electricity85 for a portion of its load.86 The plan must include a load forecast based on an analysis of hourly loads. The statute requires the analysis to include:
• Multi-year historical analysis of hourly loads;
• Switching trends and competitive retail market analysis;
• Known or projected changes to future loads; and
• Growth forecasts by customer class.87
The statute also defines the process by which the procurement plan is developed. The load forecasts themselves are developed by the utilities as stated in the statute:
Each utility shall annually provide a range of load forecasts to the Illinois Power Agency by July 15 of each year, or such other date as may be required by the Commission or Agency. The load forecasts shall cover the 5-year procurement planning period for the next procurement plan and shall include hourly data representing a high-load, low-load and expected-load scenario for the load of the eligible retail customers. The utility shall provide supporting data and assumptions for each of the scenarios.88
The forecasts are prepared by the utilities, but the Procurement Plan is ultimately the responsibility of the Agency. The Commission is required to approve the plan, including the forecasts on which it is based. Therefore, the Agency must review and evaluate the load forecasts to ensure they are sufficient for the purpose of procurement planning. This Chapter contains a summary of the load forecasts for Ameren Illinois, ComEd, and MidAmerican and the Agency’s evaluation of those load forecasts.
Note: Throughout this Plan, except where noted, the retail load is taken to include an allowance for losses. In other words, it represents the volume of energy that each utility must schedule to meet the load of its eligible retail customers at the RTO level (MISO for Ameren Illinois and MidAmerican, and PJM for ComEd).
3.2 Summary of Information Provided by Ameren Illinois
In compliance with Section 16-111.5(d)(1) of the Public Utilities Act, Ameren Illinois provided the IPA with the following documents for use in preparation of this Plan:
• Ameren Illinois Company Load Forecast for the period June 1, 2020 – May 31, 2025 (See Appendix B)
84 220 ILCS 5/16-111.5(a).
85 MidAmerican registers with MISO its generation resources allocated to serve its Illinois customers as historical resources. Incremental amounts of electricity refer to the capacity and energy that would be needed in addition to the historical resources to meet the projected loads.
86 Utilities that serve fewer than 100,000 electric customers in Illinois are not obligated to, but “may elect to procure power and energy for all or a portion of their eligible Illinois retail customers” using the IPA process (220 ILCS 5/16-111.5(a)). This is the fifth annual procurement process in which MidAmerican elected to have the IPA procure power and energy for a portion of its Illinois jurisdictional load.
87 220 ILCS 5/16-111.5(b)(1).
88 220 ILCS 5/16-111.5(d)(1).
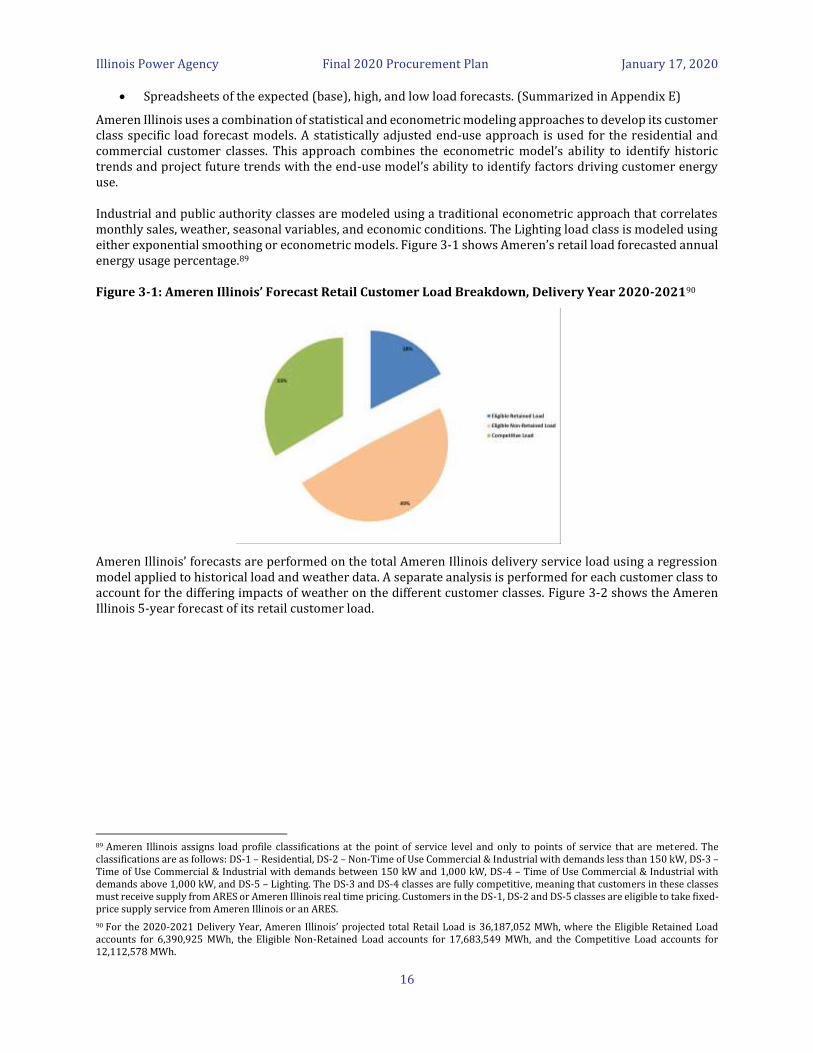
Illinois Power Agency Final 2020 Procurement Plan January 17, 2020
16
• Spreadsheets of the expected (base), high, and low load forecasts. (Summarized in Appendix E)
Ameren Illinois uses a combination of statistical and econometric modeling approaches to develop its customer class specific load forecast models. A statistically adjusted end-use approach is used for the residential and commercial customer classes. This approach combines the econometric model’s ability to identify historic trends and project future trends with the end-use model’s ability to identify factors driving customer energy use.
Industrial and public authority classes are modeled using a traditional econometric approach that correlates monthly sales, weather, seasonal variables, and economic conditions. The Lighting load class is modeled using either exponential smoothing or econometric models. Figure 3-1 shows Ameren’s retail load forecasted annual energy usage percentage.89
Figure 3-1: Ameren Illinois’ Forecast Retail Customer Load Breakdown, Delivery Year 2020-202190
Ameren Illinois’ forecasts are performed on the total Ameren Illinois delivery service load using a regression model applied to historical load and weather data. A separate analysis is performed for each customer class to account for the differing impacts of weather on the different customer classes. Figure 3-2 shows the Ameren Illinois 5-year forecast of its retail customer load.
89 Ameren Illinois assigns load profile classifications at the point of service level and only to points of service that are metered. The classifications are as follows: DS-1 – Residential, DS-2 – Non-Time of Use Commercial & Industrial with demands less than 150 kW, DS-3 – Time of Use Commercial & Industrial with demands between 150 kW and 1,000 kW, DS-4 – Time of Use Commercial & Industrial with demands above 1,000 kW, and DS-5 – Lighting. The DS-3 and DS-4 classes are fully competitive, meaning that customers in these classes must receive supply from ARES or Ameren Illinois real time pricing. Customers in the DS-1, DS-2 and DS-5 classes are eligible to take fixed-price supply service from Ameren Illinois or an ARES.
90 For the 2020-2021 Delivery Year, Ameren Illinois’ projected total Retail Load is 36,187,052 MWh, where the Eligible Retained Load accounts for 6,390,925 MWh, the Eligible Non-Retained Load accounts for 17,683,549 MWh, and the Competitive Load accounts for 12,112,578 MWh.
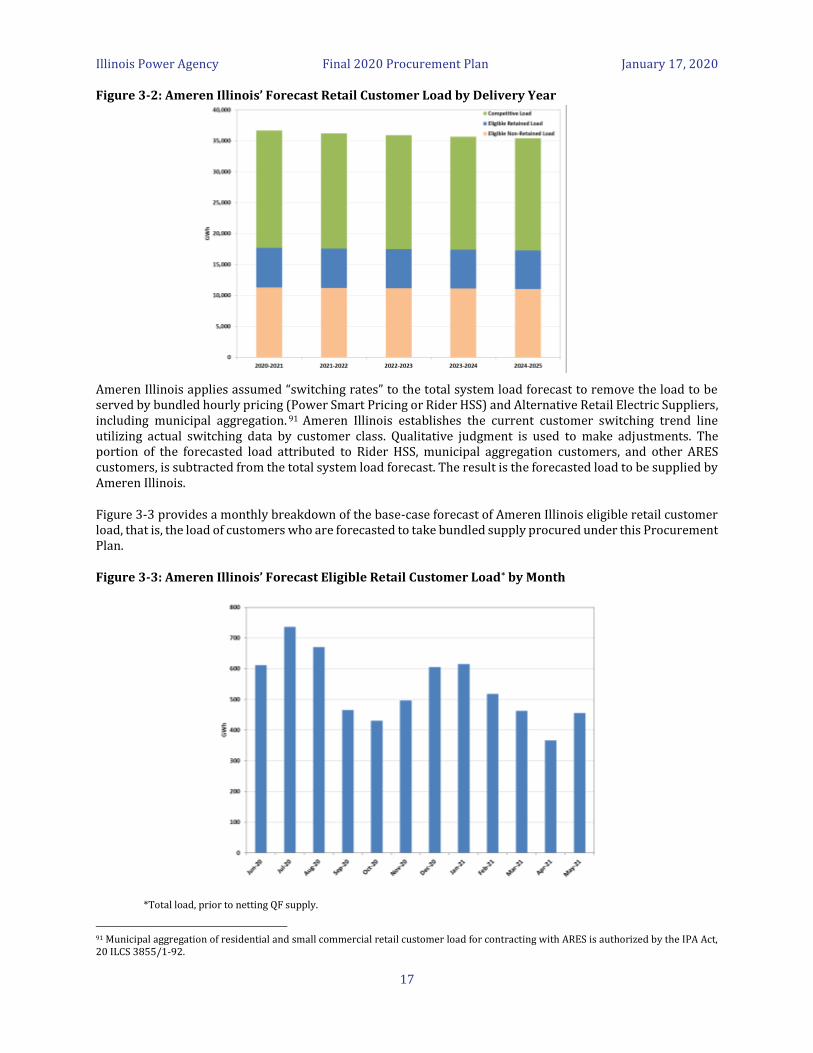
Illinois Power Agency Final 2020 Procurement Plan January 17, 2020
17
Figure 3-2: Ameren Illinois’ Forecast Retail Customer Load by Delivery Year
Ameren Illinois applies assumed “switching rates” to the total system load forecast to remove the load to be served by bundled hourly pricing (Power Smart Pricing or Rider HSS) and Alternative Retail Electric Suppliers, including municipal aggregation. 91 Ameren Illinois establishes the current customer switching trend line utilizing actual switching data by customer class. Qualitative judgment is used to make adjustments. The portion of the forecasted load attributed to Rider HSS, municipal aggregation customers, and other ARES customers, is subtracted from the total system load forecast. The result is the forecasted load to be supplied by Ameren Illinois.
Figure 3-3 provides a monthly breakdown of the base-case forecast of Ameren Illinois eligible retail customer load, that is, the load of customers who are forecasted to take bundled supply procured under this Procurement Plan.
Figure 3-3: Ameren Illinois’ Forecast Eligible Retail Customer Load* by Month
*Total load, prior to netting QF supply.
91 Municipal aggregation of residential and small commercial retail customer load for contracting with ARES is authorized by the IPA Act, 20 ILCS 3855/1-92.

Illinois Power Agency Final 2020 Procurement Plan January 17, 2020
18
Ameren Illinois provides a base case and two complete excursion cases: a low forecast and a high forecast. Each excursion case addresses three different uncertainties that simultaneously move in the same direction: macroeconomics, weather, and switching. This means, for example, that a high load case should represent the combination of stronger-than-expected economic growth (which increases load), extreme weather (which increases load) and a reduced level of switching (which increases the “eligible” fraction of retail load, that is, the fraction for which the utility retains the supply obligation). Similarly, a low load case should represent the combination of weaker-than-expected economic growth, mild weather and an increased level of switching.
3.2.1 Macroeconomics
The Ameren Illinois base case load forecast is based on a statistically adjusted end-use forecast that combines technological coefficients (efficiencies of various end-use equipment) and econometric variables (income levels and energy prices). Ameren Illinois did not define “high” and “low” cases by varying the econometric (or other) variables. Instead, Ameren Illinois looked at the statistics of the residuals from the model fit, and the high and low cases are based on a 95% confidence interval. For the residential electric customer class, Ameren Illinois currently projects a 5-year compound annual growth rate of -0.7%. For commercial customers, the growth rate for Ameren Illinois is projected to be -0.2%. While for industrial customers, the growth rate for Ameren Illinois is projected to be -1.4%.
Ameren Illinois’ “high” and “low” forecasts are uniform modifications of the base case, excluding incremental energy efficiency, by rate class. Specifically, in each case, a single multiplier is defined for each of the three non-fully competitive delivery service rate classes, and the “before switching” load forecast for every hour is multiplied by the rate class multiplier. Table 3-1 below shows the current rates for the low and high cases for each of the three rate classes.
Table 3-1: Load Multipliers in Ameren Illinois Excursion Cases
Rate Class Low Case High Case DS-1 0.93 1.07 DS-2 0.93 1.07 DS-5 0.93 1.07
In regression models, residuals indicate the difference between the predicted and actual values. Patterns associated with residuals may indicate the impact of non-specified variables. Because the excursion cases are based on the statistics of the residuals, they reflect the influence of variables not modeled. The forecasting model appears to be dominated by technological and weather effects. The econometric variables are related to short-term decision-making. Uncertainty around long-term economic growth will appear in the residuals.
3.2.2 Weather
Ameren Illinois includes “high weather” and “low weather” in its characterization of the high and low cases. Ameren Illinois did not re-compute its load forecasting models with different values for the weather variables. The high and low scenarios only account for an average impact of weather, and macroeconomic effects, which is proportionally the same in each hour.
The low case is about 7% lower than the base case and the high case is about 7% higher than the base case. The difference between the high, low, and base cases are the variation Ameren Illinois attributes to macroeconomic effects and weather variables.
3.2.3 Switching
According to Ameren Illinois, customer switching to alternative retail electric suppliers, in particular through municipal aggregation, is the greatest driver of load uncertainty. As of May 1, 2019, customer switching has resulted in approximately 61% of residential and 70% small commercial load taking service from alternative retail electric suppliers rather than from Ameren’s default service. Ameren Illinois expects that the amount of load supplied by ARES will remain flat across the planning horizon. This expectation is partially based on the fact that the vast majority of municipal aggregation contracts were renewed after their recent expiration.
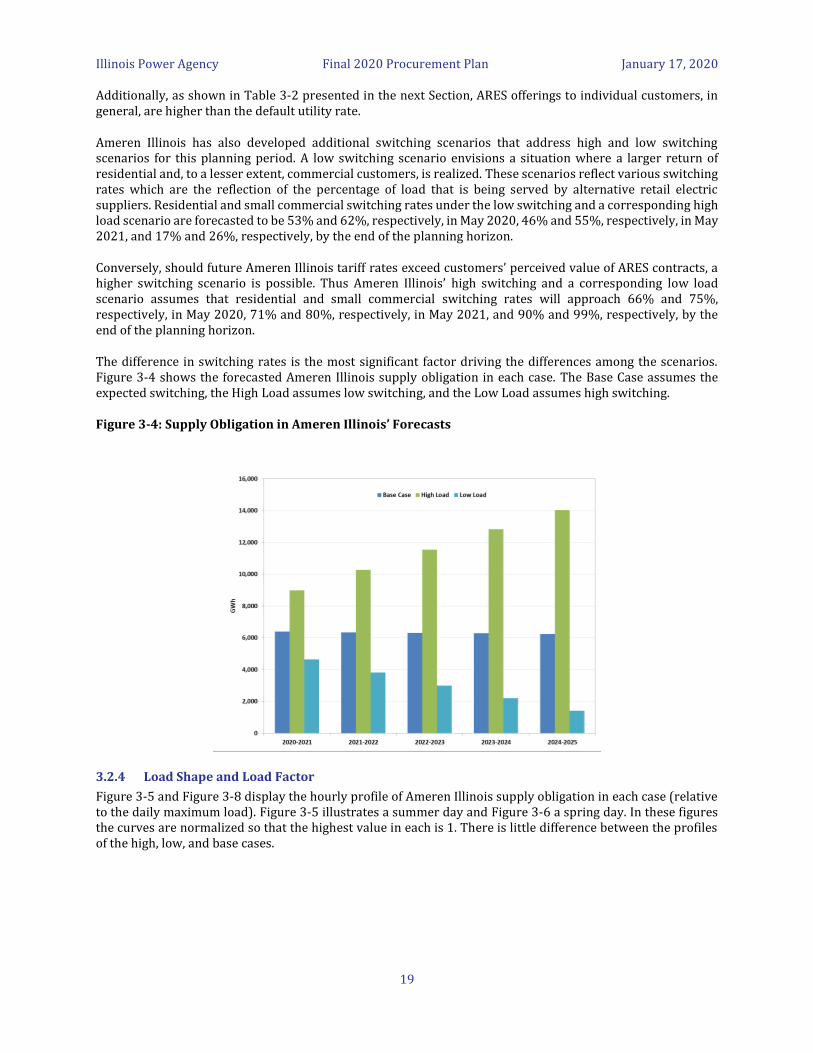
Illinois Power Agency Final 2020 Procurement Plan January 17, 2020
19
Additionally, as shown in Table 3-2 presented in the next Section, ARES offerings to individual customers, in general, are higher than the default utility rate.
Ameren Illinois has also developed additional switching scenarios that address high and low switching scenarios for this planning period. A low switching scenario envisions a situation where a larger return of residential and, to a lesser extent, commercial customers, is realized. These scenarios reflect various switching rates which are the reflection of the percentage of load that is being served by alternative retail electric suppliers. Residential and small commercial switching rates under the low switching and a corresponding high load scenario are forecasted to be 53% and 62%, respectively, in May 2020, 46% and 55%, respectively, in May 2021, and 17% and 26%, respectively, by the end of the planning horizon.
Conversely, should future Ameren Illinois tariff rates exceed customers’ perceived value of ARES contracts, a higher switching scenario is possible. Thus Ameren Illinois’ high switching and a corresponding low load scenario assumes that residential and small commercial switching rates will approach 66% and 75%, respectively, in May 2020, 71% and 80%, respectively, in May 2021, and 90% and 99%, respectively, by the end of the planning horizon.
The difference in switching rates is the most significant factor driving the differences among the scenarios. Figure 3-4 shows the forecasted Ameren Illinois supply obligation in each case. The Base Case assumes the expected switching, the High Load assumes low switching, and the Low Load assumes high switching.
Figure 3-4: Supply Obligation in Ameren Illinois’ Forecasts
3.2.4 Load Shape and Load Factor
Figure 3-5 and Figure 3-8 display the hourly profile of Ameren Illinois supply obligation in each case (relative to the daily maximum load). Figure 3-5 illustrates a summer day and Figure 3-6 a spring day. In these figures the curves are normalized so that the highest value in each is 1. There is little difference between the profiles of the high, low, and base cases.
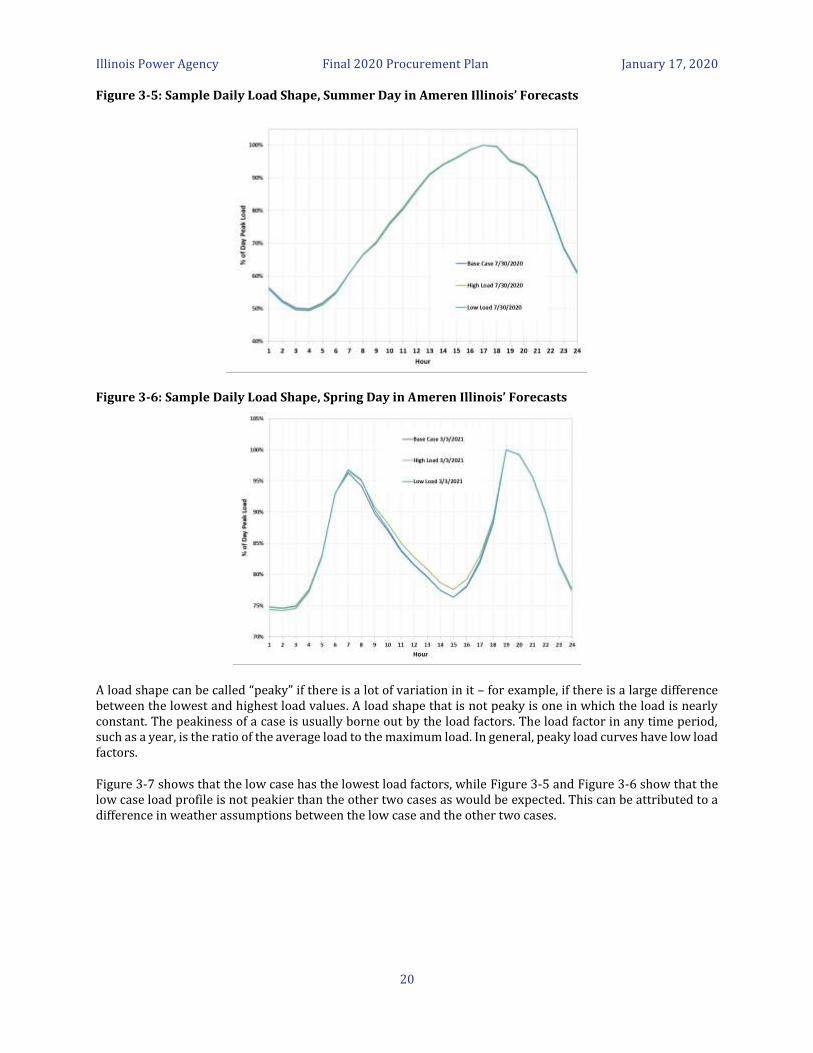
Illinois Power Agency Final 2020 Procurement Plan January 17, 2020
20
Figure 3-5: Sample Daily Load Shape, Summer Day in Ameren Illinois’ Forecasts
Figure 3-6: Sample Daily Load Shape, Spring Day in Ameren Illinois’ Forecasts
A load shape can be called “peaky” if there is a lot of variation in it – for example, if there is a large difference between the lowest and highest load values. A load shape that is not peaky is one in which the load is nearly constant. The peakiness of a case is usually borne out by the load factors. The load factor in any time period, such as a year, is the ratio of the average load to the maximum load. In general, peaky load curves have low load factors.
Figure 3-7 shows that the low case has the lowest load factors, while Figure 3-5 and Figure 3-6 show that the low case load profile is not peakier than the other two cases as would be expected. This can be attributed to a difference in weather assumptions between the low case and the other two cases.
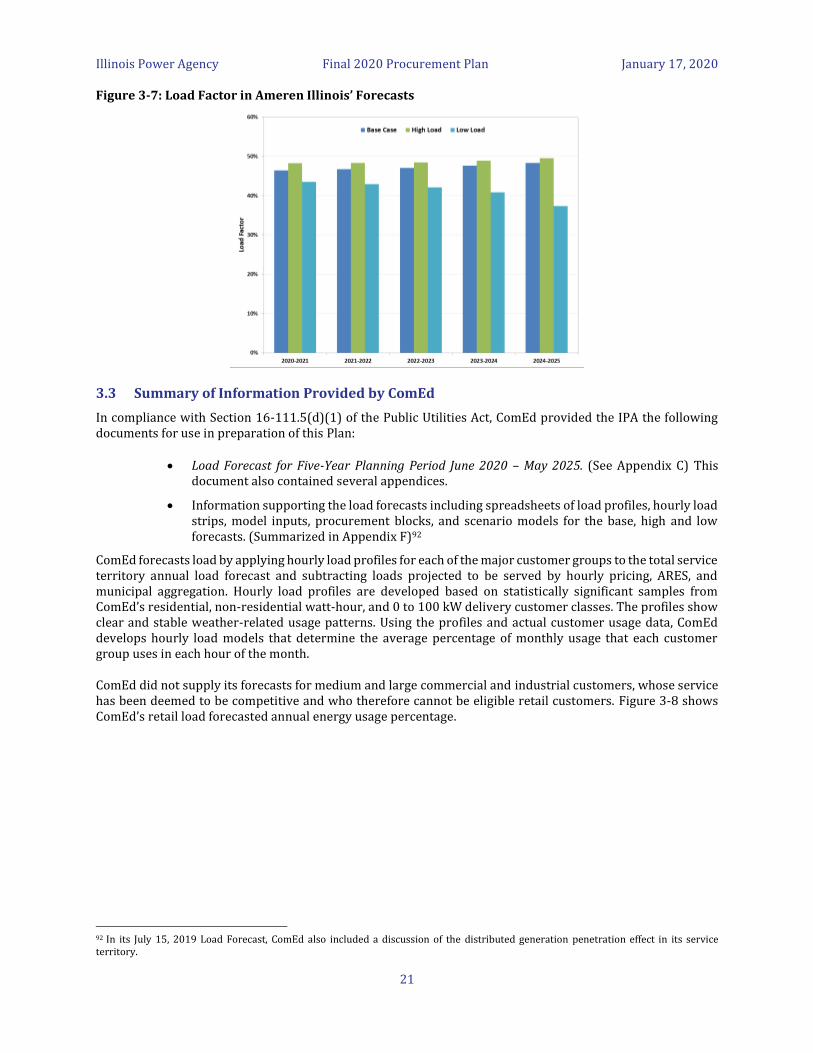
Illinois Power Agency Final 2020 Procurement Plan January 17, 2020
21
Figure 3-7: Load Factor in Ameren Illinois’ Forecasts
3.3 Summary of Information Provided by ComEd
In compliance with Section 16-111.5(d)(1) of the Public Utilities Act, ComEd provided the IPA the following documents for use in preparation of this Plan:
• Load Forecast for Five-Year Planning Period June 2020 – May 2025. (See Appendix C) This document also contained several appendices.
• Information supporting the load forecasts including spreadsheets of load profiles, hourly load strips, model inputs, procurement blocks, and scenario models for the base, high and low forecasts. (Summarized in Appendix F)92
ComEd forecasts load by applying hourly load profiles for each of the major customer groups to the total service territory annual load forecast and subtracting loads projected to be served by hourly pricing, ARES, and municipal aggregation. Hourly load profiles are developed based on statistically significant samples from ComEd’s residential, non-residential watt-hour, and 0 to 100 kW delivery customer classes. The profiles show clear and stable weather-related usage patterns. Using the profiles and actual customer usage data, ComEd develops hourly load models that determine the average percentage of monthly usage that each customer group uses in each hour of the month.
ComEd did not supply its forecasts for medium and large commercial and industrial customers, whose service has been deemed to be competitive and who therefore cannot be eligible retail customers. Figure 3-8 shows ComEd’s retail load forecasted annual energy usage percentage.
92 In its July 15, 2019 Load Forecast, ComEd also included a discussion of the distributed generation penetration effect in its service territory.
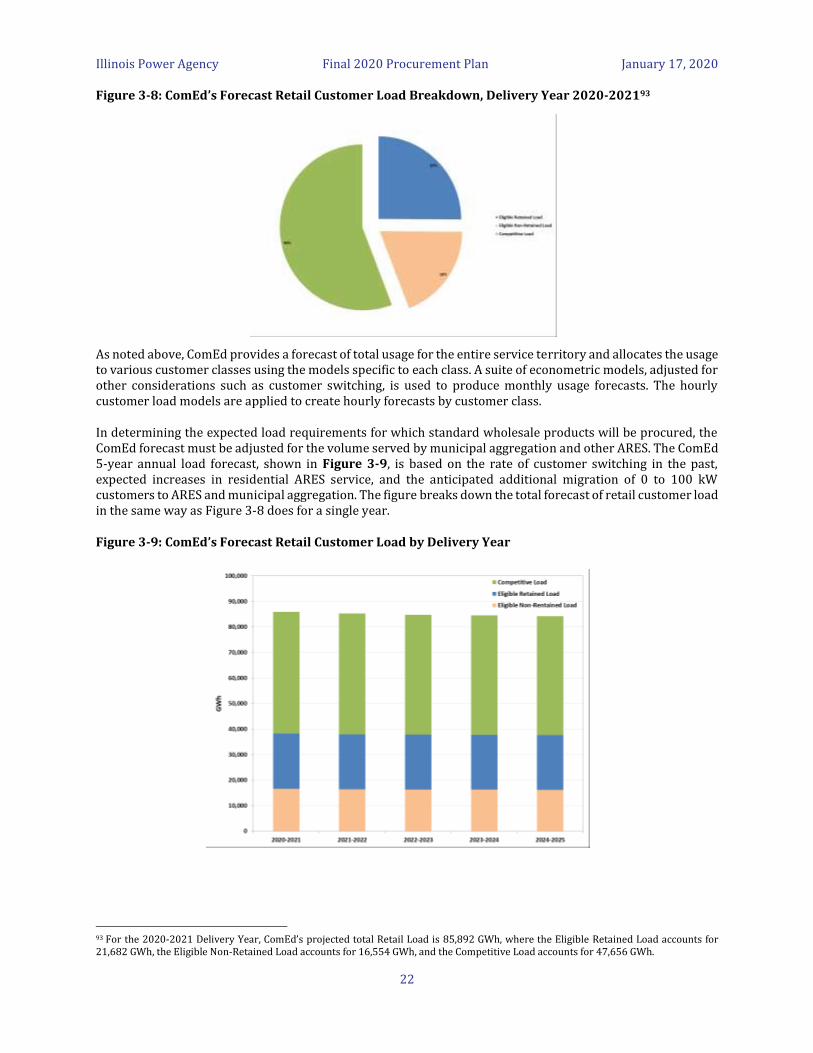
Illinois Power Agency Final 2020 Procurement Plan January 17, 2020
22
Figure 3-8: ComEd’s Forecast Retail Customer Load Breakdown, Delivery Year 2020-202193
As noted above, ComEd provides a forecast of total usage for the entire service territory and allocates the usage to various customer classes using the models specific to each class. A suite of econometric models, adjusted for other considerations such as customer switching, is used to produce monthly usage forecasts. The hourly customer load models are applied to create hourly forecasts by customer class.
In determining the expected load requirements for which standard wholesale products will be procured, the ComEd forecast must be adjusted for the volume served by municipal aggregation and other ARES. The ComEd 5-year annual load forecast, shown in Figure 3-9, is based on the rate of customer switching in the past, expected increases in residential ARES service, and the anticipated additional migration of 0 to 100 kW customers to ARES and municipal aggregation. The figure breaks down the total forecast of retail customer load in the same way as Figure 3-8 does for a single year.
Figure 3-9: ComEd’s Forecast Retail Customer Load by Delivery Year
93 For the 2020-2021 Delivery Year, ComEd’s projected total Retail Load is 85,892 GWh, where the Eligible Retained Load accounts for 21,682 GWh, the Eligible Non-Retained Load accounts for 16,554 GWh, and the Competitive Load accounts for 47,656 GWh.
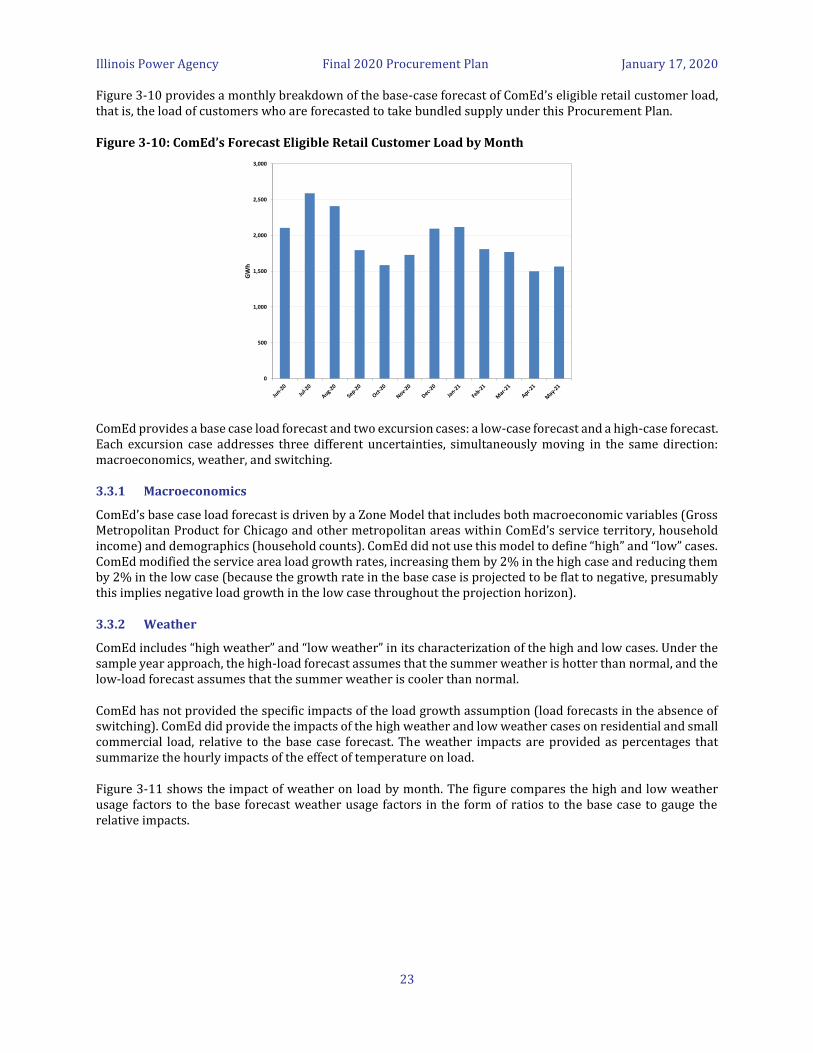
Illinois Power Agency Final 2020 Procurement Plan January 17, 2020
23
Figure 3-10 provides a monthly breakdown of the base-case forecast of ComEd’s eligible retail customer load, that is, the load of customers who are forecasted to take bundled supply under this Procurement Plan.
Figure 3-10: ComEd’s Forecast Eligible Retail Customer Load by Month
ComEd provides a base case load forecast and two excursion cases: a low-case forecast and a high-case forecast. Each excursion case addresses three different uncertainties, simultaneously moving in the same direction: macroeconomics, weather, and switching.
3.3.1 Macroeconomics
ComEd’s base case load forecast is driven by a Zone Model that includes both macroeconomic variables (Gross Metropolitan Product for Chicago and other metropolitan areas within ComEd’s service territory, household income) and demographics (household counts). ComEd did not use this model to define “high” and “low” cases. ComEd modified the service area load growth rates, increasing them by 2% in the high case and reducing them by 2% in the low case (because the growth rate in the base case is projected to be flat to negative, presumably this implies negative load growth in the low case throughout the projection horizon).
3.3.2 Weather
ComEd includes “high weather” and “low weather” in its characterization of the high and low cases. Under the sample year approach, the high-load forecast assumes that the summer weather is hotter than normal, and the low-load forecast assumes that the summer weather is cooler than normal.
ComEd has not provided the specific impacts of the load growth assumption (load forecasts in the absence of switching). ComEd did provide the impacts of the high weather and low weather cases on residential and small commercial load, relative to the base case forecast. The weather impacts are provided as percentages that summarize the hourly impacts of the effect of temperature on load.
Figure 3-11 shows the impact of weather on load by month. The figure compares the high and low weather usage factors to the base forecast weather usage factors in the form of ratios to the base case to gauge the relative impacts.
0
500
1,000
1,500
2,000
2,500
3,000
GW
h
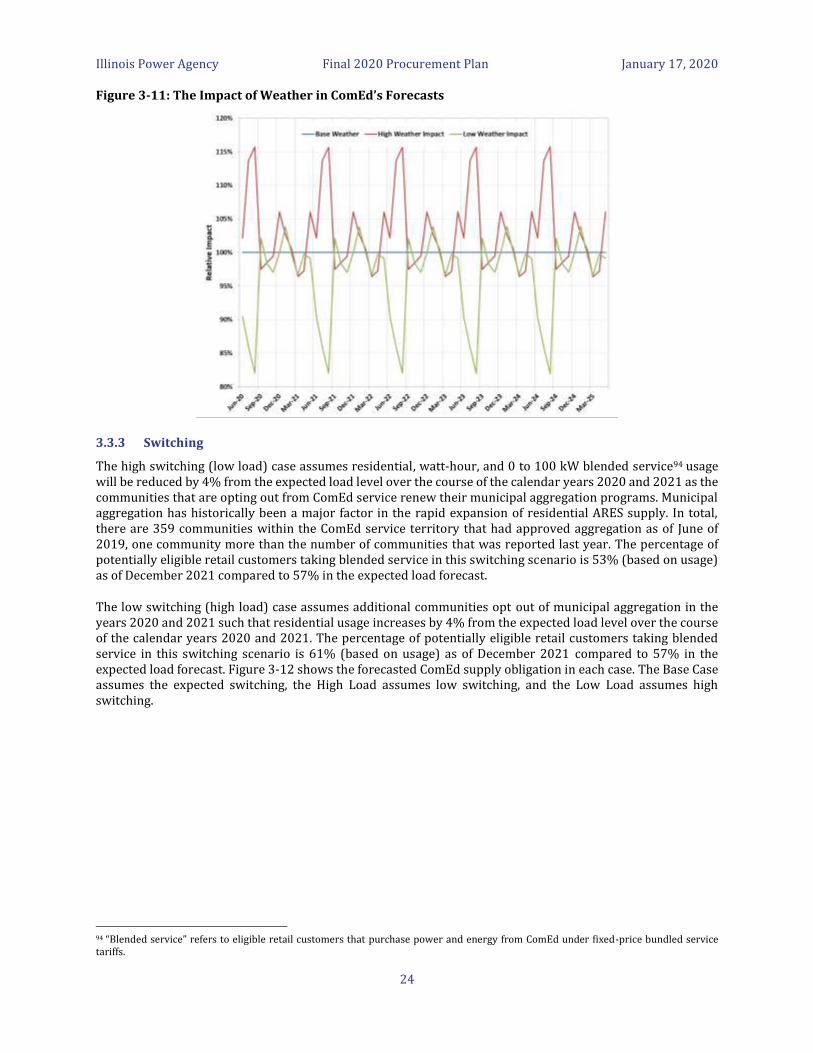
Illinois Power Agency Final 2020 Procurement Plan January 17, 2020
24
Figure 3-11: The Impact of Weather in ComEd’s Forecasts
3.3.3 Switching
The high switching (low load) case assumes residential, watt-hour, and 0 to 100 kW blended service94 usage will be reduced by 4% from the expected load level over the course of the calendar years 2020 and 2021 as the communities that are opting out from ComEd service renew their municipal aggregation programs. Municipal aggregation has historically been a major factor in the rapid expansion of residential ARES supply. In total, there are 359 communities within the ComEd service territory that had approved aggregation as of June of 2019, one community more than the number of communities that was reported last year. The percentage of potentially eligible retail customers taking blended service in this switching scenario is 53% (based on usage) as of December 2021 compared to 57% in the expected load forecast.
The low switching (high load) case assumes additional communities opt out of municipal aggregation in the years 2020 and 2021 such that residential usage increases by 4% from the expected load level over the course of the calendar years 2020 and 2021. The percentage of potentially eligible retail customers taking blended service in this switching scenario is 61% (based on usage) as of December 2021 compared to 57% in the expected load forecast. Figure 3-12 shows the forecasted ComEd supply obligation in each case. The Base Case assumes the expected switching, the High Load assumes low switching, and the Low Load assumes high switching.
94 “Blended service” refers to eligible retail customers that purchase power and energy from ComEd under fixed-price bundled service tariffs.

Illinois Power Agency Final 2020 Procurement Plan January 17, 2020
25
Figure 3-12: Supply Obligation in ComEd’s Forecasts
3.3.4 Load Shape and Load Factor
Figure 3-13 and Figure 3-14 display the hourly profile of the utility supply obligation in each case (relative to the daily maximum load). Figure 3-13 illustrates a summer day, and Figure 3-14 a spring day. There is no significant difference between the profiles of the high case and the base case on a summer day, but the low case is flatter. During the sample spring day, the base case is peakier than the high case, and the low case is slightly peakier than the base case.
Figure 3-13: Sample Daily Load Shape, Summer Day in ComEd’s Forecasts
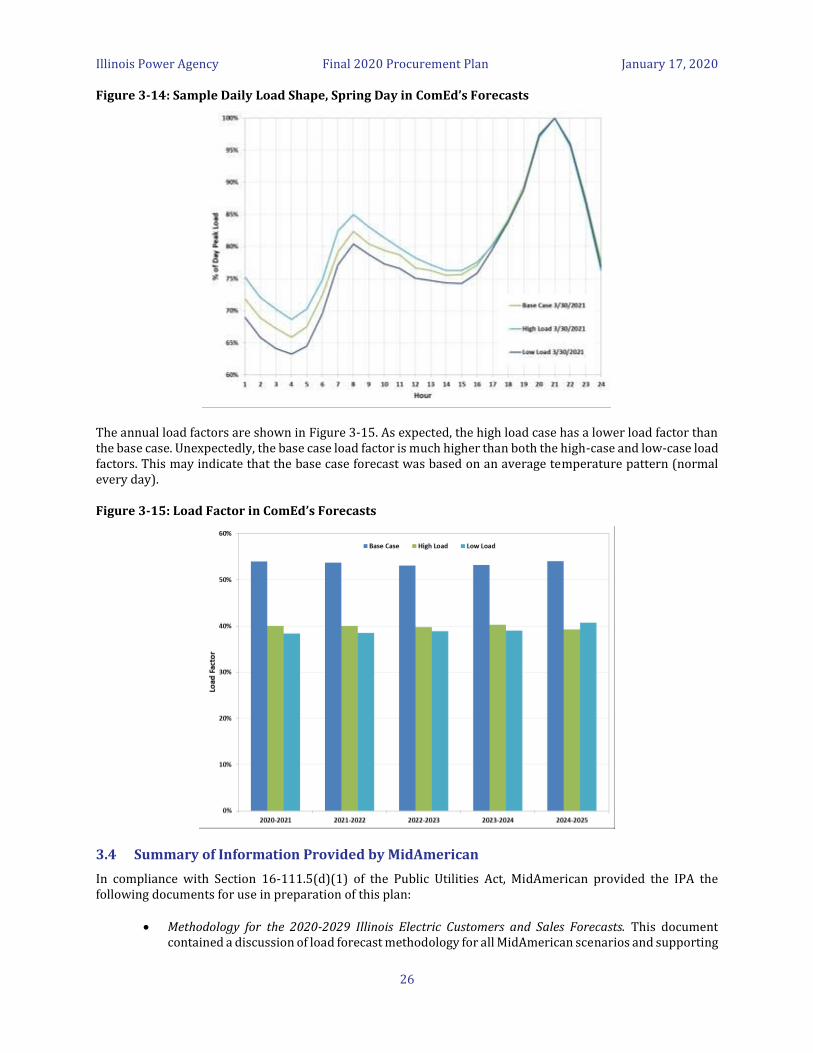
Illinois Power Agency Final 2020 Procurement Plan January 17, 2020
26
Figure 3-14: Sample Daily Load Shape, Spring Day in ComEd’s Forecasts
The annual load factors are shown in Figure 3-15. As expected, the high load case has a lower load factor than the base case. Unexpectedly, the base case load factor is much higher than both the high-case and low-case load factors. This may indicate that the base case forecast was based on an average temperature pattern (normal every day).
Figure 3-15: Load Factor in ComEd’s Forecasts
3.4 Summary of Information Provided by MidAmerican
In compliance with Section 16-111.5(d)(1) of the Public Utilities Act, MidAmerican provided the IPA the following documents for use in preparation of this plan:
• Methodology for the 2020-2029 Illinois Electric Customers and Sales Forecasts. This document contained a discussion of load forecast methodology for all MidAmerican scenarios and supporting

Illinois Power Agency Final 2020 Procurement Plan January 17, 2020
27
data for the base scenario forecast. The load forecast included a multi-year historical analysis of hourly load data, forecasted load and capability along with the impact of demand side and renewable energy initiatives. MidAmerican’s load forecast was further broken down by revenue class, projected kWh usage and sales, which factored in economic and demographic variables along with weather variables based on weather data. Additionally, the load forecast accounted for sales forecasts based on variables and model statistics along with the non-coincident electric gross peak demand forecast and represents all of the eligible retail customer classes, except the customer being served by an ARES. MidAmerican methodology also includes the discussion of the energy efficiency and switching trends. Pursuant to Section 16-111.5(d)(1), MidAmerican’s load forecast covered a five‐year procurement planning period. (See Appendix D)
• Spreadsheets of load profiles, hourly load strips, procurement blocks, and scenario models for the base, high and low forecasts. (Summarized in Appendix G)
MidAmerican forecasts load by using econometric models on a monthly basis. For the residential, commercial and public authority classes, sales are determined by multiplying customers by use per customer. For the industrial class, sales are modeled directly. For the street lighting class, sales are forecast using trending.
The gross peak numbers used in the analysis are the historical gross peaks, which take into account demand side management impacts.
MidAmerican has one active alternative retail supplier in its Illinois service territory. MidAmerican has no customer classes that have been declared competitive. Figure 3-16 shows Ameren’s retail load forecasted annual energy usage percentage. The low level of switching among MidAmerican’s eligible retail customers relative to the much higher switching levels for Ameren Illinois and ComEd is likely due to a combination of market conditions in MidAmerican’s service area, including the relatively low cost of MidAmerican-owned resources allocated to its Illinois load (which would lead to little or no municipal aggregation activity, and little profit opportunity for ARES).
Figure 3-16: MidAmerican’s Forecast Retail Customer Load Breakdown, Delivery Year 2020-202195
MidAmerican provided a forecast of total usage for the entire service territory combining the projected customers and sales numbers modeled using data specific to the area being forecast. A suite of econometric models, adjusted for other considerations such as customer switching, is used to produce monthly usage forecasts. The hourly customer load models are applied to create hourly forecasts by customer class. Some variables, such as customer numbers, price, sales, revenue class, jurisdiction, etc., were obtained internally from the company database, while other data, such as economic, demographic and weather were received from external sources.
95 For the 2020-2021 Delivery Year, MidAmerican’s projected total Retail Load is 2,127,826 MWh, where the Eligible Retained Load accounts for 2,044,749 MWh and the Eligible Non-retained Load accounts for 83,077 MWh.
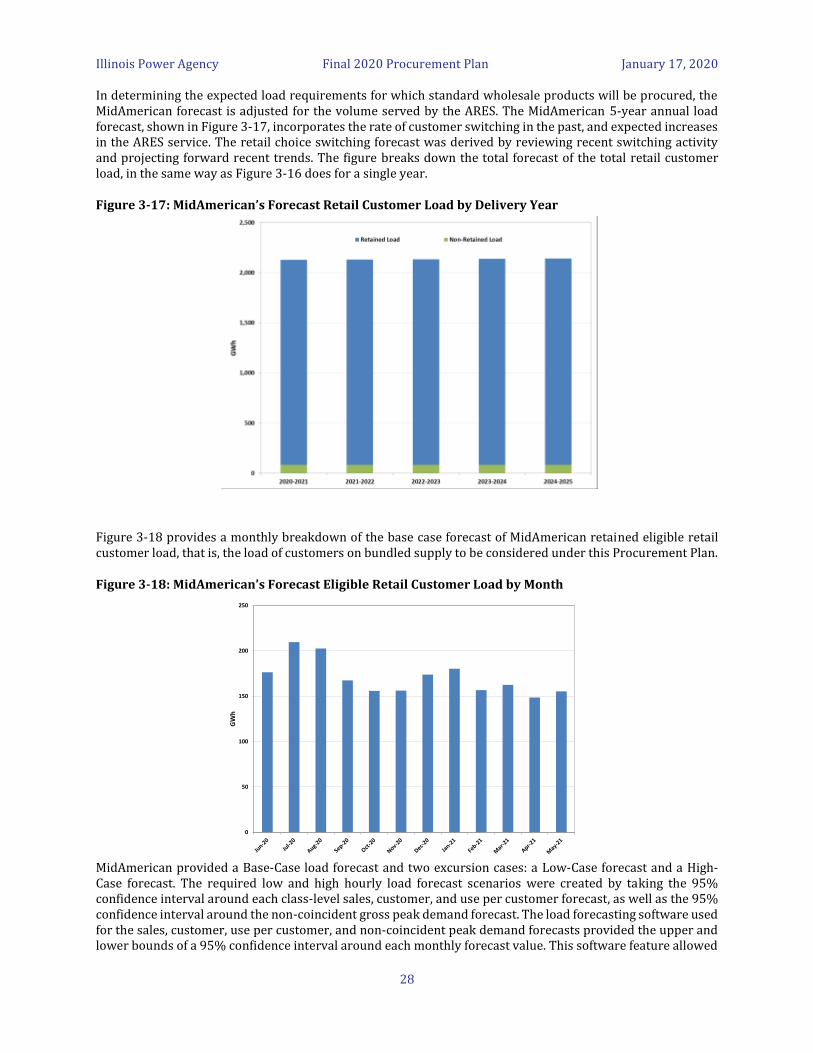
Illinois Power Agency Final 2020 Procurement Plan January 17, 2020
28
In determining the expected load requirements for which standard wholesale products will be procured, the MidAmerican forecast is adjusted for the volume served by the ARES. The MidAmerican 5-year annual load forecast, shown in Figure 3-17, incorporates the rate of customer switching in the past, and expected increases in the ARES service. The retail choice switching forecast was derived by reviewing recent switching activity and projecting forward recent trends. The figure breaks down the total forecast of the total retail customer load, in the same way as Figure 3-16 does for a single year.
Figure 3-17: MidAmerican’s Forecast Retail Customer Load by Delivery Year
Figure 3-18 provides a monthly breakdown of the base case forecast of MidAmerican retained eligible retail customer load, that is, the load of customers on bundled supply to be considered under this Procurement Plan.
Figure 3-18: MidAmerican’s Forecast Eligible Retail Customer Load by Month
MidAmerican provided a Base-Case load forecast and two excursion cases: a Low-Case forecast and a High-Case forecast. The required low and high hourly load forecast scenarios were created by taking the 95% confidence interval around each class-level sales, customer, and use per customer forecast, as well as the 95% confidence interval around the non-coincident gross peak demand forecast. The load forecasting software used for the sales, customer, use per customer, and non-coincident peak demand forecasts provided the upper and lower bounds of a 95% confidence interval around each monthly forecast value. This software feature allowed
0
50
100
150
200
250
GW
h
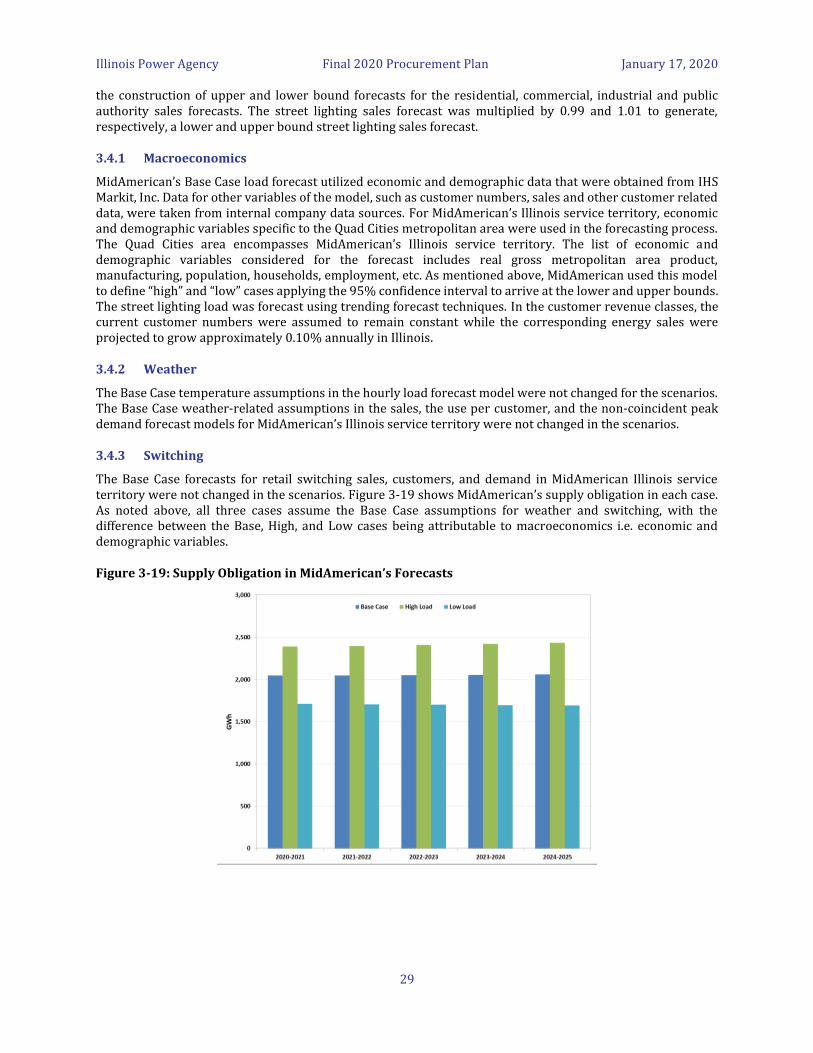
Illinois Power Agency Final 2020 Procurement Plan January 17, 2020
29
the construction of upper and lower bound forecasts for the residential, commercial, industrial and public authority sales forecasts. The street lighting sales forecast was multiplied by 0.99 and 1.01 to generate, respectively, a lower and upper bound street lighting sales forecast.
3.4.1 Macroeconomics
MidAmerican’s Base Case load forecast utilized economic and demographic data that were obtained from IHS Markit, Inc. Data for other variables of the model, such as customer numbers, sales and other customer related data, were taken from internal company data sources. For MidAmerican’s Illinois service territory, economic and demographic variables specific to the Quad Cities metropolitan area were used in the forecasting process. The Quad Cities area encompasses MidAmerican’s Illinois service territory. The list of economic and demographic variables considered for the forecast includes real gross metropolitan area product, manufacturing, population, households, employment, etc. As mentioned above, MidAmerican used this model to define “high” and “low” cases applying the 95% confidence interval to arrive at the lower and upper bounds. The street lighting load was forecast using trending forecast techniques. In the customer revenue classes, the current customer numbers were assumed to remain constant while the corresponding energy sales were projected to grow approximately 0.10% annually in Illinois.
3.4.2 Weather
The Base Case temperature assumptions in the hourly load forecast model were not changed for the scenarios. The Base Case weather-related assumptions in the sales, the use per customer, and the non-coincident peak demand forecast models for MidAmerican’s Illinois service territory were not changed in the scenarios.
3.4.3 Switching
The Base Case forecasts for retail switching sales, customers, and demand in MidAmerican Illinois service territory were not changed in the scenarios. Figure 3-19 shows MidAmerican’s supply obligation in each case. As noted above, all three cases assume the Base Case assumptions for weather and switching, with the difference between the Base, High, and Low cases being attributable to macroeconomics i.e. economic and demographic variables.
Figure 3-19: Supply Obligation in MidAmerican’s Forecasts
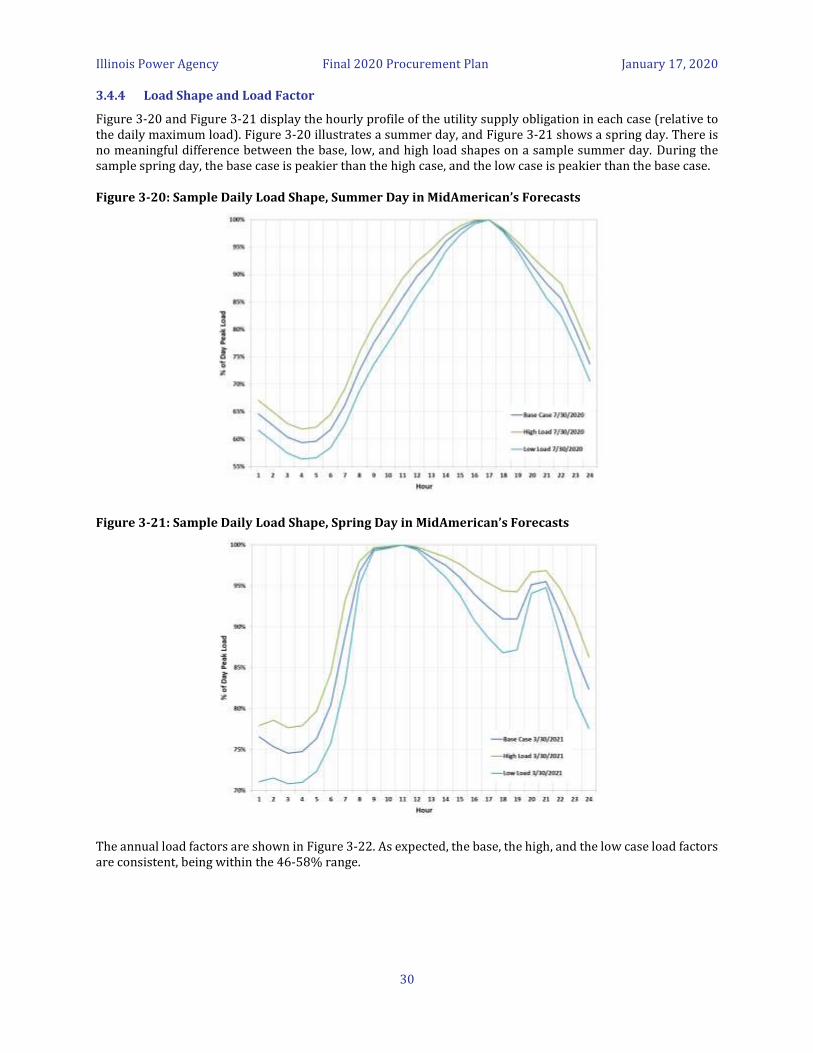
Illinois Power Agency Final 2020 Procurement Plan January 17, 2020
30
3.4.4 Load Shape and Load Factor
Figure 3-20 and Figure 3-21 display the hourly profile of the utility supply obligation in each case (relative to the daily maximum load). Figure 3-20 illustrates a summer day, and Figure 3-21 shows a spring day. There is no meaningful difference between the base, low, and high load shapes on a sample summer day. During the sample spring day, the base case is peakier than the high case, and the low case is peakier than the base case.
Figure 3-20: Sample Daily Load Shape, Summer Day in MidAmerican’s Forecasts
Figure 3-21: Sample Daily Load Shape, Spring Day in MidAmerican’s Forecasts
The annual load factors are shown in Figure 3-22. As expected, the base, the high, and the low case load factors are consistent, being within the 46-58% range.
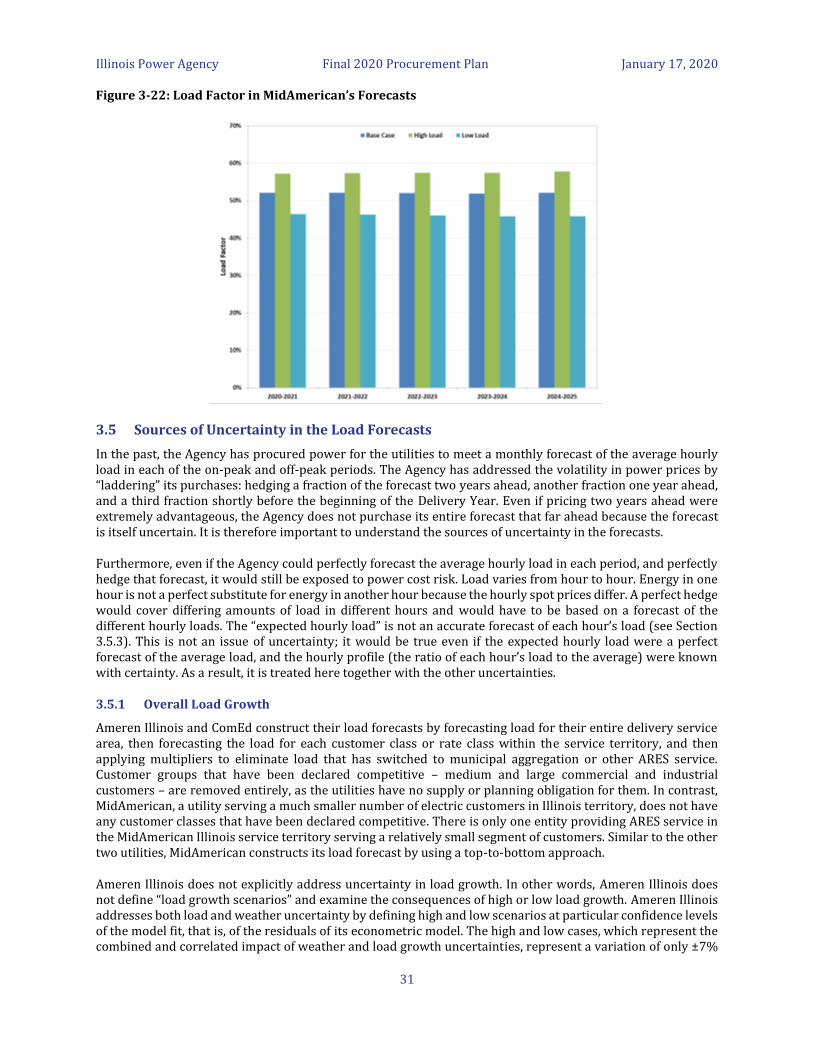
Illinois Power Agency Final 2020 Procurement Plan January 17, 2020
31
Figure 3-22: Load Factor in MidAmerican’s Forecasts
3.5 Sources of Uncertainty in the Load Forecasts
In the past, the Agency has procured power for the utilities to meet a monthly forecast of the average hourly load in each of the on-peak and off-peak periods. The Agency has addressed the volatility in power prices by “laddering” its purchases: hedging a fraction of the forecast two years ahead, another fraction one year ahead, and a third fraction shortly before the beginning of the Delivery Year. Even if pricing two years ahead were extremely advantageous, the Agency does not purchase its entire forecast that far ahead because the forecast is itself uncertain. It is therefore important to understand the sources of uncertainty in the forecasts.
Furthermore, even if the Agency could perfectly forecast the average hourly load in each period, and perfectly hedge that forecast, it would still be exposed to power cost risk. Load varies from hour to hour. Energy in one hour is not a perfect substitute for energy in another hour because the hourly spot prices differ. A perfect hedge would cover differing amounts of load in different hours and would have to be based on a forecast of the different hourly loads. The “expected hourly load” is not an accurate forecast of each hour’s load (see Section 3.5.3). This is not an issue of uncertainty; it would be true even if the expected hourly load were a perfect forecast of the average load, and the hourly profile (the ratio of each hour’s load to the average) were known with certainty. As a result, it is treated here together with the other uncertainties.
3.5.1 Overall Load Growth
Ameren Illinois and ComEd construct their load forecasts by forecasting load for their entire delivery service area, then forecasting the load for each customer class or rate class within the service territory, and then applying multipliers to eliminate load that has switched to municipal aggregation or other ARES service. Customer groups that have been declared competitive – medium and large commercial and industrial customers – are removed entirely, as the utilities have no supply or planning obligation for them. In contrast, MidAmerican, a utility serving a much smaller number of electric customers in Illinois territory, does not have any customer classes that have been declared competitive. There is only one entity providing ARES service in the MidAmerican Illinois service territory serving a relatively small segment of customers. Similar to the other two utilities, MidAmerican constructs its load forecast by using a top-to-bottom approach.
Ameren Illinois does not explicitly address uncertainty in load growth. In other words, Ameren Illinois does not define “load growth scenarios” and examine the consequences of high or low load growth. Ameren Illinois addresses both load and weather uncertainty by defining high and low scenarios at particular confidence levels of the model fit, that is, of the residuals of its econometric model. The high and low cases, which represent the combined and correlated impact of weather and load growth uncertainties, represent a variation of only ±7%

Illinois Power Agency Final 2020 Procurement Plan January 17, 2020
32
in service area load. However, Ameren Illinois’ high and low cases also include extreme customer migration uncertainty.
ComEd defines high and low load growth scenarios as 2% above or below the load growth in the base case forecast. The changes in load growth are imposed upon the model rather than derived from economic scenarios, so it is hard to determine how they relate to economic uncertainty. Given the stability of utility loads in recent years, differences of ±2% in load growth should represent an appropriately representative range of uncertainty.
Like Ameren Illinois, MidAmerican addresses the load and weather uncertainty by defining high and low scenarios at particular confidence levels, i.e., by applying the 95% confidence interval around reference sales, customer and use per customer forecast, and the non-coincident gross peak demand forecast. The street lighting sales forecast, however, was multiplied by 0.99 and 1.01 to generate, respectively, a lower and upper bound of street lighting sales forecast, which is more similar to the ComEd’s approach.
3.5.2 Weather
On a short-term basis, weather fluctuations are a key driver of the uncertainty in load forecasts, and in the daily variation of load forecasts around an average-day forecast. The discussion of high and low scenarios in Sections 3.2.2, 3.3.2, and 3.4.2 notes the way that Ameren Illinois, ComEd, and MidAmerican have incorporated weather variation into the high and low load forecasts. Ameren Illinois treats weather uncertainty together with load growth uncertainty. ComEd’s forecasts are built around two sample years. Much of the impact of weather is on load variability within the year. MidAmerican’s base case weather-related assumptions are not changed for the high-case and low-case load forecasts. The base-case load forecast is built on the “weather normalized” historical sales.
3.5.3 Load Profiles
As noted above, the “average hour” load forecast is not an accurate forecast of each hour’s load. Within the sixteen-hour daily peak period, mid-afternoon hours would be expected to have higher loads than average, and early morning or evening hours would be expected to have lower loads. More importantly, multiplying the average hourly load by the cost of a “strip” contract (equal delivery in each hour of the period) gives an inaccurate forecast of the cost of energy. This is because hourly energy prices are correlated with hourly loads (energy costs more when demand is high). Technically, this is referred to as a “biased” forecast, because the expected cost will predictably differ from the product of the “average hour” load forecast and the “strip” contract price.
Figure 3-23 illustrates this disconnect by showing, for each month, the average historical “daily coefficient of variation” for peak period loads. This figure is based on historical ComEd loads from 2009 through 2018, normalized to the monthly base case forecasts in the first Delivery Year. To calculate the daily coefficient of variation, the variances of loads within each day’s peak period are averaged to produce an expected daily variance. That variance is then scaled to load by first taking the square root and then dividing by the average peak-period hourly load forecasted for the month. As the figure shows, there is significant load variation during the day in the high-priced summer months.
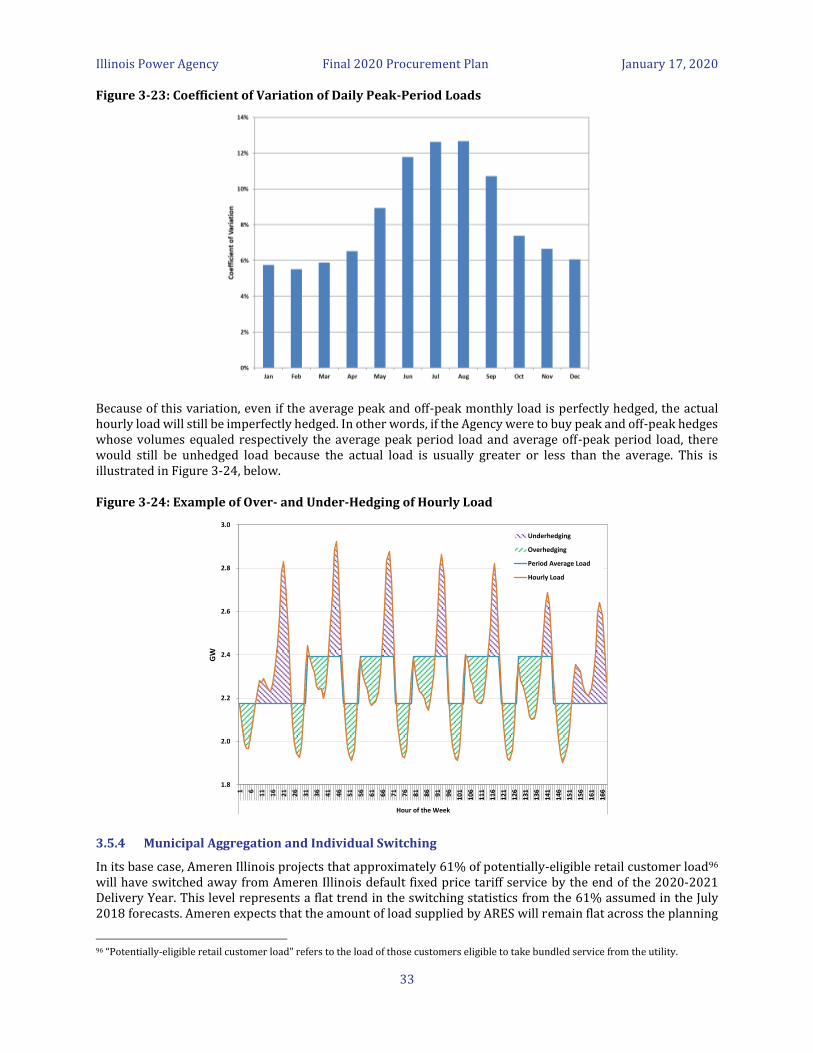
Illinois Power Agency Final 2020 Procurement Plan January 17, 2020
33
Figure 3-23: Coefficient of Variation of Daily Peak-Period Loads
Because of this variation, even if the average peak and off-peak monthly load is perfectly hedged, the actual hourly load will still be imperfectly hedged. In other words, if the Agency were to buy peak and off-peak hedges whose volumes equaled respectively the average peak period load and average off-peak period load, there would still be unhedged load because the actual load is usually greater or less than the average. This is illustrated in Figure 3-24, below.
Figure 3-24: Example of Over- and Under-Hedging of Hourly Load
3.5.4 Municipal Aggregation and Individual Switching
In its base case, Ameren Illinois projects that approximately 61% of potentially-eligible retail customer load96 will have switched away from Ameren Illinois default fixed price tariff service by the end of the 2020-2021 Delivery Year. This level represents a flat trend in the switching statistics from the 61% assumed in the July 2018 forecasts. Ameren expects that the amount of load supplied by ARES will remain flat across the planning
96 “Potentially-eligible retail customer load” refers to the load of those customers eligible to take bundled service from the utility.
1.8
2.0
2.2
2.4
2.6
2.8
3.0
1 6
11
16
21
26
31
36
41
46
51
56
61
66
71
76
81
86
91
96
10
1
10
6
11
1
11
6
12
1
12
6
131
13
6
14
1
14
6
15
1
15
6
16
1
16
6
Hour of the Week
GW
Underhedging
Overhedging
Period Average Load
Hourly Load
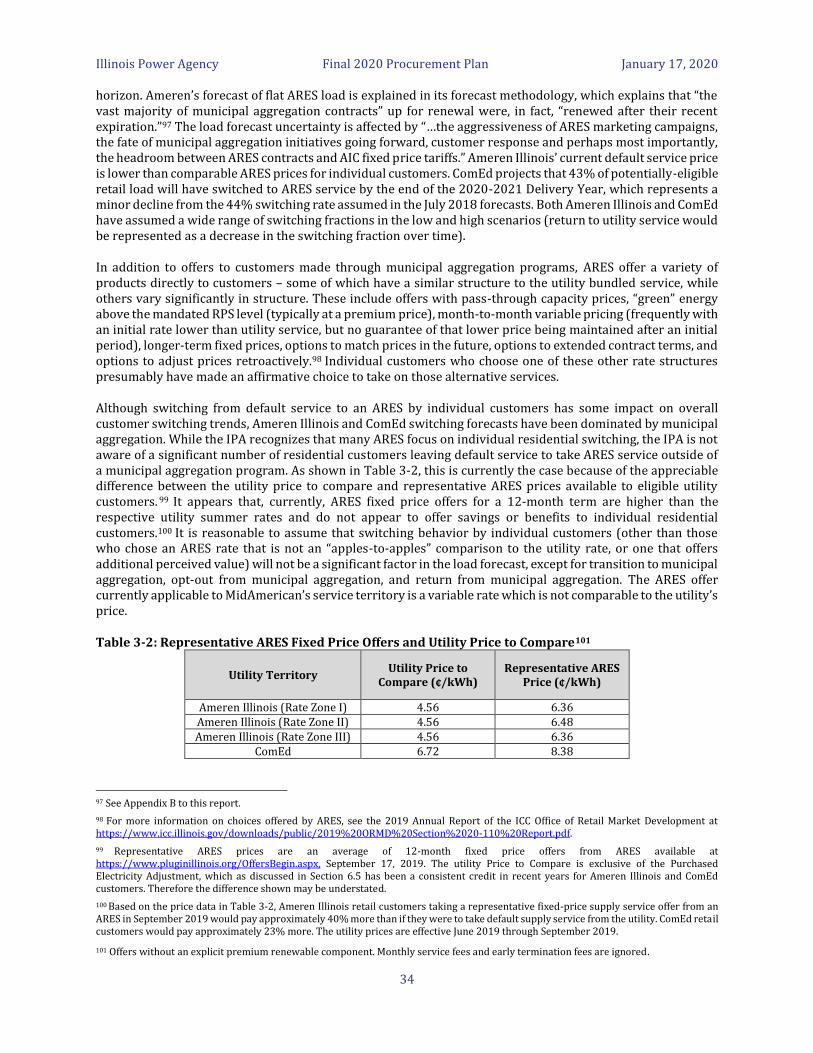
Illinois Power Agency Final 2020 Procurement Plan January 17, 2020
34
horizon. Ameren’s forecast of flat ARES load is explained in its forecast methodology, which explains that “the vast majority of municipal aggregation contracts” up for renewal were, in fact, “renewed after their recent expiration.”97 The load forecast uncertainty is affected by “…the aggressiveness of ARES marketing campaigns, the fate of municipal aggregation initiatives going forward, customer response and perhaps most importantly, the headroom between ARES contracts and AIC fixed price tariffs.” Ameren Illinois’ current default service price is lower than comparable ARES prices for individual customers. ComEd projects that 43% of potentially-eligible retail load will have switched to ARES service by the end of the 2020-2021 Delivery Year, which represents a minor decline from the 44% switching rate assumed in the July 2018 forecasts. Both Ameren Illinois and ComEd have assumed a wide range of switching fractions in the low and high scenarios (return to utility service would be represented as a decrease in the switching fraction over time).
In addition to offers to customers made through municipal aggregation programs, ARES offer a variety of products directly to customers – some of which have a similar structure to the utility bundled service, while others vary significantly in structure. These include offers with pass-through capacity prices, “green” energy above the mandated RPS level (typically at a premium price), month-to-month variable pricing (frequently with an initial rate lower than utility service, but no guarantee of that lower price being maintained after an initial period), longer-term fixed prices, options to match prices in the future, options to extended contract terms, and options to adjust prices retroactively.98 Individual customers who choose one of these other rate structures presumably have made an affirmative choice to take on those alternative services.
Although switching from default service to an ARES by individual customers has some impact on overall customer switching trends, Ameren Illinois and ComEd switching forecasts have been dominated by municipal aggregation. While the IPA recognizes that many ARES focus on individual residential switching, the IPA is not aware of a significant number of residential customers leaving default service to take ARES service outside of a municipal aggregation program. As shown in Table 3-2, this is currently the case because of the appreciable difference between the utility price to compare and representative ARES prices available to eligible utility customers. 99 It appears that, currently, ARES fixed price offers for a 12-month term are higher than the respective utility summer rates and do not appear to offer savings or benefits to individual residential customers.100 It is reasonable to assume that switching behavior by individual customers (other than those who chose an ARES rate that is not an “apples-to-apples” comparison to the utility rate, or one that offers additional perceived value) will not be a significant factor in the load forecast, except for transition to municipal aggregation, opt-out from municipal aggregation, and return from municipal aggregation. The ARES offer currently applicable to MidAmerican’s service territory is a variable rate which is not comparable to the utility’s price.
Table 3-2: Representative ARES Fixed Price Offers and Utility Price to Compare101
Utility Territory Utility Price to
Compare (¢/kWh) Representative ARES
Price (¢/kWh)
Ameren Illinois (Rate Zone I) 4.56 6.36 Ameren Illinois (Rate Zone II) 4.56 6.48 Ameren Illinois (Rate Zone III) 4.56 6.36
ComEd 6.72 8.38
97 See Appendix B to this report.
98 For more information on choices offered by ARES, see the 2019 Annual Report of the ICC Office of Retail Market Development at https://www.icc.illinois.gov/downloads/public/2019%20ORMD%20Section%2020-110%20Report.pdf.
99 Representative ARES prices are an average of 12-month fixed price offers from ARES available at https://www.pluginillinois.org/OffersBegin.aspx, September 17, 2019. The utility Price to Compare is exclusive of the Purchased Electricity Adjustment, which as discussed in Section 6.5 has been a consistent credit in recent years for Ameren Illinois and ComEd customers. Therefore the difference shown may be understated.
100 Based on the price data in Table 3-2, Ameren Illinois retail customers taking a representative fixed-price supply service offer from an ARES in September 2019 would pay approximately 40% more than if they were to take default supply service from the utility. ComEd retail customers would pay approximately 23% more. The utility prices are effective June 2019 through September 2019.
101 Offers without an explicit premium renewable component. Monthly service fees and early termination fees are ignored.
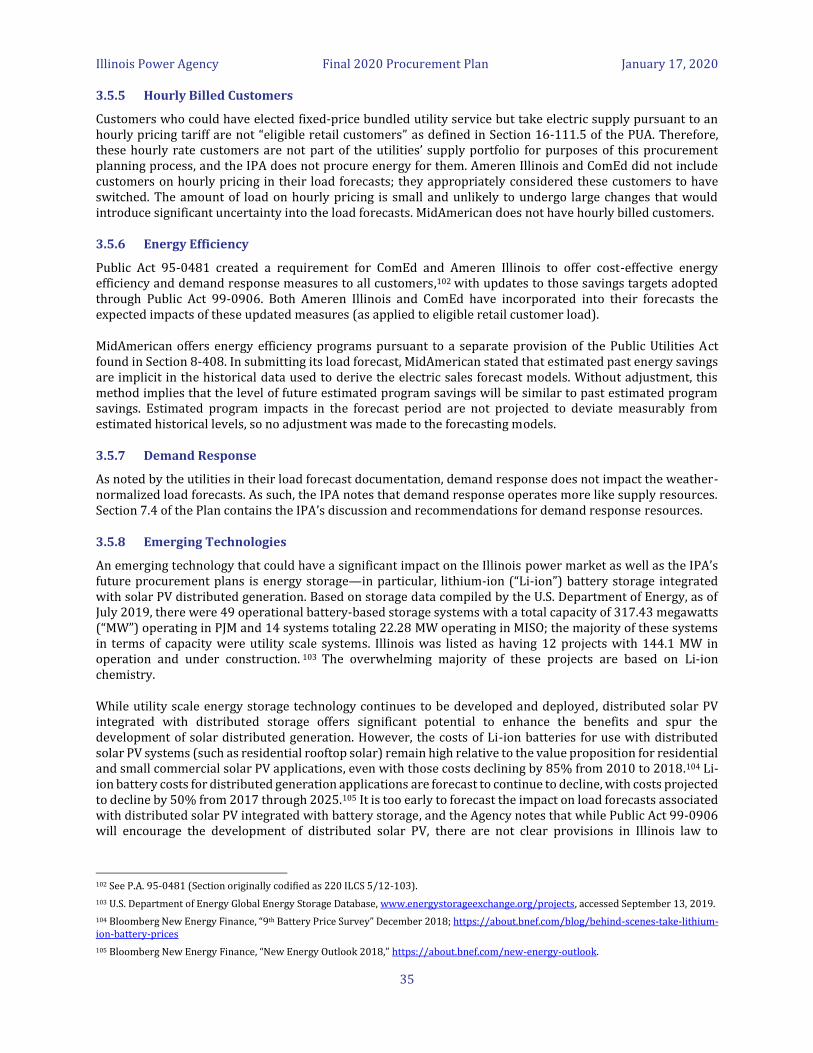
Illinois Power Agency Final 2020 Procurement Plan January 17, 2020
35
3.5.5 Hourly Billed Customers
Customers who could have elected fixed-price bundled utility service but take electric supply pursuant to an hourly pricing tariff are not “eligible retail customers” as defined in Section 16-111.5 of the PUA. Therefore, these hourly rate customers are not part of the utilities’ supply portfolio for purposes of this procurement planning process, and the IPA does not procure energy for them. Ameren Illinois and ComEd did not include customers on hourly pricing in their load forecasts; they appropriately considered these customers to have switched. The amount of load on hourly pricing is small and unlikely to undergo large changes that would introduce significant uncertainty into the load forecasts. MidAmerican does not have hourly billed customers.
3.5.6 Energy Efficiency
Public Act 95-0481 created a requirement for ComEd and Ameren Illinois to offer cost-effective energy efficiency and demand response measures to all customers,102 with updates to those savings targets adopted through Public Act 99-0906. Both Ameren Illinois and ComEd have incorporated into their forecasts the expected impacts of these updated measures (as applied to eligible retail customer load).
MidAmerican offers energy efficiency programs pursuant to a separate provision of the Public Utilities Act found in Section 8-408. In submitting its load forecast, MidAmerican stated that estimated past energy savings are implicit in the historical data used to derive the electric sales forecast models. Without adjustment, this method implies that the level of future estimated program savings will be similar to past estimated program savings. Estimated program impacts in the forecast period are not projected to deviate measurably from estimated historical levels, so no adjustment was made to the forecasting models.
3.5.7 Demand Response
As noted by the utilities in their load forecast documentation, demand response does not impact the weather-normalized load forecasts. As such, the IPA notes that demand response operates more like supply resources. Section 7.4 of the Plan contains the IPA’s discussion and recommendations for demand response resources.
3.5.8 Emerging Technologies
An emerging technology that could have a significant impact on the Illinois power market as well as the IPA’s future procurement plans is energy storage—in particular, lithium-ion (“Li-ion”) battery storage integrated with solar PV distributed generation. Based on storage data compiled by the U.S. Department of Energy, as of July 2019, there were 49 operational battery-based storage systems with a total capacity of 317.43 megawatts (“MW”) operating in PJM and 14 systems totaling 22.28 MW operating in MISO; the majority of these systems in terms of capacity were utility scale systems. Illinois was listed as having 12 projects with 144.1 MW in operation and under construction. 103 The overwhelming majority of these projects are based on Li-ion chemistry.
While utility scale energy storage technology continues to be developed and deployed, distributed solar PV integrated with distributed storage offers significant potential to enhance the benefits and spur the development of solar distributed generation. However, the costs of Li-ion batteries for use with distributed solar PV systems (such as residential rooftop solar) remain high relative to the value proposition for residential and small commercial solar PV applications, even with those costs declining by 85% from 2010 to 2018.104 Li-ion battery costs for distributed generation applications are forecast to continue to decline, with costs projected to decline by 50% from 2017 through 2025.105 It is too early to forecast the impact on load forecasts associated with distributed solar PV integrated with battery storage, and the Agency notes that while Public Act 99-0906 will encourage the development of distributed solar PV, there are not clear provisions in Illinois law to
102 See P.A. 95-0481 (Section originally codified as 220 ILCS 5/12-103).
103 U.S. Department of Energy Global Energy Storage Database, www.energystorageexchange.org/projects, accessed September 13, 2019.
104 Bloomberg New Energy Finance, “9th Battery Price Survey” December 2018; https://about.bnef.com/blog/behind-scenes-take-lithium-ion-battery-prices
105 Bloomberg New Energy Finance, “New Energy Outlook 2018,” https://about.bnef.com/new-energy-outlook.

Illinois Power Agency Final 2020 Procurement Plan January 17, 2020
36
encourage the adoption of integrated storage technologies. The Agency plans to continue to monitor the development of this technology as well as the utility scale energy storage market in the coming years.
3.6 Recommended Load Forecasts
3.6.1 Base Cases
The IPA recommends adoption of the Ameren Illinois, ComEd, and MidAmerican base case load forecasts. Ameren Illinois and ComEd forecasts include already approved energy efficiency programs, and MidAmerican’s forecast includes verified energy efficiency program impacts as well.
3.6.2 High and Low Excursion Cases
The high and low cases represent useful examples of potential load variability. Although they are primarily driven by variation in switching, Ameren Illinois correctly notes that this is the major uncertainty in its outlook. The switching variability, especially in Ameren Illinois’ high and low forecasts, is extreme and thus these may be characterized as “stress cases.” The Agency’s procurement strategy to date has been built on hedging the expected average hourly load in each of the peak and off-peak sub-periods, and the high and low cases represent significant variation in those averages.
As illustrated in Figure 3-25, the Ameren Illinois low and high load forecasts are on average equal to 72% and 141% of the base case forecast, respectively, during the 2020-2021 Delivery Year. Comparatively, for the same period, ComEd’s low and high load forecasts are on average equal to 91% and 109% of the base forecast, respectively. This reflects the differences in switching assumptions used by the two utilities. MidAmerican’s low and high load forecast deviations from the base case are flat and symmetrical being equal to 83% and 117%, respectively. The reference case forecasts for retail switching were not changed in Mid American’s high and low load forecasts.
Figure 3-25: Comparison of Ameren Illinois, ComEd, and MidAmerican High and Low Load Forecasts for Delivery Year 2020-2021
0%
20%
40%
60%
80%
100%
120%
140%
160%
Jun-20 Jul-20 Aug-20 Sep-20 Oct-20 Nov-20 Dec-20 Jan-21 Feb-21 Mar-21 Apr-21 May-21
Expected Load
Ameren - High Load Relative to Expected Load
Ameren - Low Load Relative to Expected Load
ComEd - High Load Relative to Expected Load
ComEd - Low Load Relative to Expected Load
MidAmerican - High Load Relative to Expected Load
MidAmerican - Low Load Relative to Expected Load

Illinois Power Agency Final 2020 Procurement Plan January 17, 2020
37
Another potential use of the high and low cases would be to analyze the risks of different supply strategies. A key driver of that risk is the cost of meeting unhedged load on the spot market. One of the main reasons is the disparity between load and the selected hedging instrument. As in Figure 3-24, load is variable while the hedging instrument (standard block energy) features a constant delivery of energy. The spot price at which the unhedged volumes are covered is positively correlated with load. However, as explained below, the high and low cases are less suitable for such a risk analysis.
The relatively high load factor of the ComEd base case forecast implies that the hourly profile of that case is not representative of a typical year. This means that the base case hourly forecast would understate the amount by which hourly loads vary from the average hourly loads in the peak and off-peak sub-periods. Using that hourly profile for a risk analysis could lead to underestimating the cost of unhedged supply.
The Ameren Illinois and MidAmerican load scenarios have identical monthly load shapes (differing by uniform scaling factors). These shapes will not provide much information about the cost of meeting fluctuating loads, except for the information contained in the expected load shape.
The extreme nature of the Ameren Illinois low and high load forecasts can influence the results of a probabilistic risk analysis. With almost any assignment of weights to the Ameren Illinois cases, load uncertainty will dominate price uncertainty. This does not apply to ComEd and MidAmerican, which must be taken into account when evaluating any simulation of procurement risk.
Illinois Power Agency Final 2020 Procurement Plan January 17, 2020
38
4 Existing Resource Portfolio and Supply Gap
Starting with the 2014 Procurement Plan, the IPA has procured energy supply in standard 25 MW on-peak and off-peak blocks. This energy block size was reduced from the previous level of 50 MW to more accurately match procured supply with eligible retail customer load.106 These purchases are driven by the supply requirements outlined in the current year procurement plan and are executed through a competitive procurement process administered by the IPA’s Procurement Administrator. This procurement process is monitored for the Commission by the Commission-retained Procurement Monitor. The history of the IPA-administered procurements is available on the IPA website.107
The 2019 Procurement Plan included the procurement of energy supply to meet the needs of ComEd’s and Ameren Illinois’ eligible retail customers, as well as that portion of MidAmerican’s eligible retail customer load not met through its allocation of existing generation. The current plan will continue the procurement of energy supply for each of the three utilities.
In addition to purchasing energy block contracts in the forward markets, Ameren Illinois, MidAmerican, and ComEd rely on the operation of their RTOs (MISO and PJM) to balance their loads and consequently may incur additional costs or credits. Purchased energy blocks may not perfectly cover the load, therefore triggering the need for spot energy purchases or sales from or to the RTO. The IPA’s procurement plans are based on a supply strategy designed, among other things, to balance price risk and cost. The underlying principle of this supply strategy is to procure energy products that will cover all or most of the near-term load requirements and then gradually decrease the amount of energy purchased relative to load for the following years.
The current IPA energy procurement strategy involves procurement of hedges to meet a portion of the hedging requirements over a three year period and includes two procurement events in which the July and August peak requirements will be hedged at 106%, while the remaining peak and off-peak requirements will be hedged at 100%. In the Spring 2020 procurement event, 106% of the July and August expected peak, 100% of the July and August off-peak, 100% of the June and September peak and off-peak, and 75% of the October through May peak and off-peak requirements for the 2020-2021 Delivery Year will be targeted for procurement. The Fall 2020 procurement event will bring the targeted hedge levels to 100% for October through May of the 2020-2021 Delivery Year. A portion of the targeted hedge levels for the 2021-2022 and the 2022-2023 Delivery Years of 50% and 25%, respectively, will be acquired spread on an equal basis in the spring and fall procurement events.
Because of the uncertainty in the amount of eligible retail customer load in future years, the IPA has not purchased energy beyond a 3-year horizon, except in a few circumstances. These include:
• 20-year bundled REC and energy purchases (also known as the 2010 long-term power purchase agreements or “LTPPAs”), starting in June 2012, made by Ameren Illinois and ComEd in December 2010 pursuant to the Final Order in Docket No. 09-0373.108
• The February 2012 “Rate Stability” procurements mandated by Public Act 97-0616 for block energy products covering the period June 2013 through December 2017.109
106 See 2014 IPA Procurement Plan at 93.
107 http://www2.illinois.gov/ipa/Pages/Prior_Approved_Plans.aspx.
108 With the changes to the Renewable Resources Budget contained in Public Act 99-0906, curtailment of the Ameren Illinois and ComEd LTPPAs (as occurred for ComEd in 2013 and 2014) is extremely unlikely. MidAmerican is not a counterparty to the LTPPAs.
109 P.A. 97-0616 also mandated associated REC procurements, but these REC procurements did not impact the (energy) resource portfolio. Additionally, twenty-year power purchase agreements between Ameren Illinois and ComEd and the FutureGen Industrial Alliance, Inc. were directed by the Commission order approving the Agency’s 2013 Procurement Plan. (See Docket No. 12-0544) However, U.S. DOE funding support for FutureGen 2.0 was suspended, and in early 2016, the project’s development was ultimately terminated.
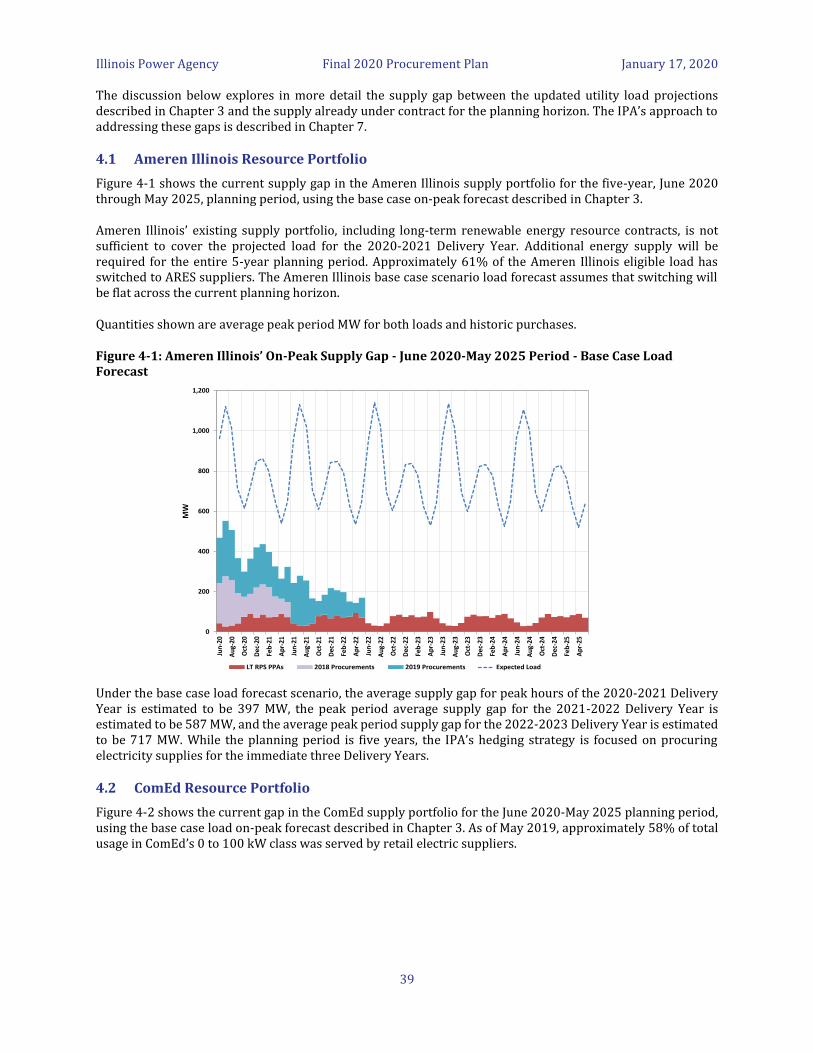
Illinois Power Agency Final 2020 Procurement Plan January 17, 2020
39
The discussion below explores in more detail the supply gap between the updated utility load projections described in Chapter 3 and the supply already under contract for the planning horizon. The IPA’s approach to addressing these gaps is described in Chapter 7.
4.1 Ameren Illinois Resource Portfolio
Figure 4-1 shows the current supply gap in the Ameren Illinois supply portfolio for the five-year, June 2020 through May 2025, planning period, using the base case on-peak forecast described in Chapter 3.
Ameren Illinois’ existing supply portfolio, including long-term renewable energy resource contracts, is not sufficient to cover the projected load for the 2020-2021 Delivery Year. Additional energy supply will be required for the entire 5-year planning period. Approximately 61% of the Ameren Illinois eligible load has switched to ARES suppliers. The Ameren Illinois base case scenario load forecast assumes that switching will be flat across the current planning horizon.
Quantities shown are average peak period MW for both loads and historic purchases.
Figure 4-1: Ameren Illinois’ On-Peak Supply Gap - June 2020-May 2025 Period - Base Case Load Forecast
Under the base case load forecast scenario, the average supply gap for peak hours of the 2020-2021 Delivery Year is estimated to be 397 MW, the peak period average supply gap for the 2021-2022 Delivery Year is estimated to be 587 MW, and the average peak period supply gap for the 2022-2023 Delivery Year is estimated to be 717 MW. While the planning period is five years, the IPA’s hedging strategy is focused on procuring electricity supplies for the immediate three Delivery Years.
4.2 ComEd Resource Portfolio
Figure 4-2 shows the current gap in the ComEd supply portfolio for the June 2020-May 2025 planning period, using the base case load on-peak forecast described in Chapter 3. As of May 2019, approximately 58% of total usage in ComEd’s 0 to 100 kW class was served by retail electric suppliers.
0
200
400
600
800
1,000
1,200
Jun
-20
Au
g-20
Oct
-20
Dec
-20
Feb
-21
Ap
r-21
Jun
-21
Au
g-21
Oct
-21
Dec
-21
Feb
-22
Ap
r-22
Jun
-22
Au
g-22
Oct
-22
Dec
-22
Feb
-23
Ap
r-23
Jun
-23
Au
g-23
Oct
-23
Dec
-23
Feb
-24
Ap
r-24
Jun
-24
Au
g-24
Oct
-24
Dec
-24
Feb
-25
Ap
r-25
MW
LT RPS PPAs 2018 Procurements 2019 Procurements Expected Load
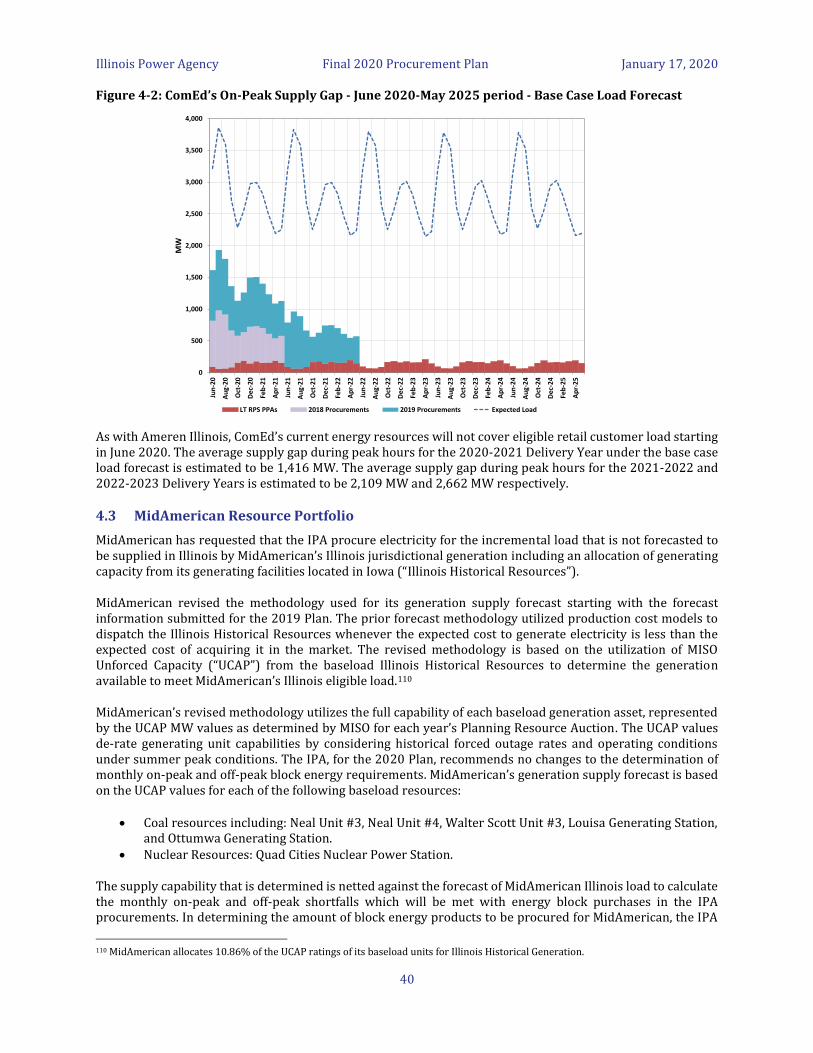
Illinois Power Agency Final 2020 Procurement Plan January 17, 2020
40
Figure 4-2: ComEd’s On-Peak Supply Gap - June 2020-May 2025 period - Base Case Load Forecast
As with Ameren Illinois, ComEd’s current energy resources will not cover eligible retail customer load starting in June 2020. The average supply gap during peak hours for the 2020-2021 Delivery Year under the base case load forecast is estimated to be 1,416 MW. The average supply gap during peak hours for the 2021-2022 and 2022-2023 Delivery Years is estimated to be 2,109 MW and 2,662 MW respectively.
4.3 MidAmerican Resource Portfolio
MidAmerican has requested that the IPA procure electricity for the incremental load that is not forecasted to be supplied in Illinois by MidAmerican’s Illinois jurisdictional generation including an allocation of generating capacity from its generating facilities located in Iowa (“Illinois Historical Resources”).
MidAmerican revised the methodology used for its generation supply forecast starting with the forecast information submitted for the 2019 Plan. The prior forecast methodology utilized production cost models to dispatch the Illinois Historical Resources whenever the expected cost to generate electricity is less than the expected cost of acquiring it in the market. The revised methodology is based on the utilization of MISO Unforced Capacity (“UCAP”) from the baseload Illinois Historical Resources to determine the generation available to meet MidAmerican’s Illinois eligible load.110
MidAmerican’s revised methodology utilizes the full capability of each baseload generation asset, represented by the UCAP MW values as determined by MISO for each year’s Planning Resource Auction. The UCAP values de-rate generating unit capabilities by considering historical forced outage rates and operating conditions under summer peak conditions. The IPA, for the 2020 Plan, recommends no changes to the determination of monthly on-peak and off-peak block energy requirements. MidAmerican’s generation supply forecast is based on the UCAP values for each of the following baseload resources:
• Coal resources including: Neal Unit #3, Neal Unit #4, Walter Scott Unit #3, Louisa Generating Station, and Ottumwa Generating Station.
• Nuclear Resources: Quad Cities Nuclear Power Station.
The supply capability that is determined is netted against the forecast of MidAmerican Illinois load to calculate the monthly on-peak and off-peak shortfalls which will be met with energy block purchases in the IPA procurements. In determining the amount of block energy products to be procured for MidAmerican, the IPA
110 MidAmerican allocates 10.86% of the UCAP ratings of its baseload units for Illinois Historical Generation.
0
500
1,000
1,500
2,000
2,500
3,000
3,500
4,000
Jun
-20
Au
g-2
0
Oct
-20
Dec
-20
Feb
-21
Ap
r-2
1
Jun
-21
Au
g-2
1
Oct
-21
Dec
-21
Feb
-22
Ap
r-2
2
Jun
-22
Au
g-2
2
Oct
-22
Dec
-22
Feb
-23
Ap
r-2
3
Jun
-23
Au
g-2
3
Oct
-23
Dec
-23
Feb
-24
Ap
r-2
4
Jun
-24
Au
g-2
4
Oct
-24
Dec
-24
Feb
-25
Ap
r-2
5
MW
LT RPS PPAs 2018 Procurements 2019 Procurements Expected Load

Illinois Power Agency Final 2020 Procurement Plan January 17, 2020
41
treats the allocation of capacity and energy from MidAmerican’s Illinois Historical Resources in a manner analogous to a series of standard energy blocks. This approach is consistent with the 2019 Procurement Plan approved by the Commission.
The IPA believes that the methodology used with regards to MidAmerican’s supply procurement is reasonable and that the overall hedging levels and laddered procurement approach are consistent with the proposed approach for Ameren Illinois and ComEd. The IPA and MidAmerican will monitor the actual performance of this approach and will revisit it in future procurement plans, if warranted.
Figure 4-3 shows the current supply gap in the MidAmerican supply portfolio for the five-year planning period, using MidAmerican’s base case on-peak load forecast. The average supply surplus during peak hours for the 2020-2021 Delivery Year under the base case load forecast is estimated to be 11 MW. The average supply surplus during peak hours for the 2021-2022 Delivery Year is 10 MW and for the 2022-2023 Delivery Year the supply surplus is 10 MW.
Figure 4-3: MidAmerican’s On-Peak Supply Gap - June 2020-May 2025 period - Base Case Load Forecast

Illinois Power Agency Final 2020 Procurement Plan January 17, 2020
42
5 PJM and MISO Resource Adequacy Outlook and Uncertainty
As a result of retail choice in Illinois, the resource adequacy challenge (i.e., the load and resource balance) can be summarized as a function of determining what level of resources to purchase and from which markets. However, for the Illinois market to function properly, the RTO markets and operations (e.g., MISO and PJM) must provide sufficient resources to satisfy the load requirements for all customers reliably. This Chapter reviews the likely load and resource outcomes over the planning horizon to determine if the current system is likely to provide the necessary resources such that customers will be served with reliable power.
In reviewing the load and resource outcomes over the planning horizon, this Chapter analyzes several studies of resource adequacy that are publicly available from different planning and reliability entities. These entities include:
• North American Electric Reliability Corporation (“NERC”), the entity certified by the Federal Energy Regulatory Commission (“FERC”) to establish and enforce reliability standards with the goal of ensuring the reliability of the bulk power system.
• PJM Interconnection, L.L.C. (“PJM”), which operates the transmission grid in Northern Illinois, serving ComEd.
• Midcontinent Independent System Operator, Inc. (“MISO”), which operates the transmission grid in most of central and southern Illinois, serving Ameren Illinois and MidAmerican.
From the review of these entities’ most recent resource adequacy documentation, it is apparent that, over the planning horizon, PJM will maintain adequate resources to meet the collective needs of customers in those regions. MISO, on the other hand, could be short of the resources necessary to meet the target reserve margin starting in the 2023-2024 timeframe if “low certainty resources” are included in the supply mix.111 If the “low certainty resources” are not included in the supply mix, MISO could be short of the resources necessary to meet the target reserve margin starting in the 2021-2022 timeframe.
5.1 Resource Adequacy Projections
PJM
As shown in Figure 5-1, PJM is projected to have sufficient resources to meet load plus required reserve margins for the Delivery Years 2019-2020 to 2024-2025, with projected reserve margins above the 15.8% target reserve margin. For the 2019-2020 Delivery Year, the reserve margin is 17.2% above the target reserve margin, peaks at 19.9% above the target reserve margin in 2021-2022, and declines to 18.2% above the target reserve margin for the 2024-2025 Delivery Year.
111 Low Certainty Resources (sometimes referred to as unconfirmed retirements) are units that have indicated to MISO through the OMS-MISO survey that they might retire in a given Delivery Year, but have not provided a formal notice of retirement through the Attachment Y process of the MISO Tariff. MISO does not include the capacity associated with these low certainty resources in their resource adequacy analysis. NERC, on the other hand, includes these resources in their analysis.

Illinois Power Agency Final 2020 Procurement Plan January 17, 2020
43
Figure 5-1: PJM / NERC Projected Capacity Supply and Demand for Delivery Years 2019-2020 to 2024-2025
Source: NERC 2018 Long Term Reliability Assessment (“NERC 2018 LTRA”)
MISO
As shown in Figure 5-2, based upon the NERC 2018 LTRA, on a region-wide basis MISO is expected to have sufficient resources to meet load plus required reserve margin for the Delivery Years 2019-2020 to 2022-2023 with projected reserve margins above the 17.1% target reserve margin. However, in 2023-2024, NERC estimates that MISO will have insufficient resources to meet load plus a target reserve margin. For the 2019-2020 Delivery Year, the reserve margin is approximately 4.2% above the target reserve margin, declining to approximately 1.8% above the target reserve margin for the 2022-2023 Delivery Year. Figure 5-2 also shows MISO’s reserve margin analysis presented in the 2018 MISO Transmission Expansion Planning (“MTEP”) report, which addresses resource adequacy. The MISO assessment forecasts the reserve margin declining below the target reserve margin in 2021-2022, 2 years earlier than the NERC forecast. MISO notes that the difference is due to the treatment of “low certainty resources”, as explained above. Also, as reported in previous procurement plans, MISO and NERC assessments differ in how the reserve margin percent is calculated. MISO’s calculation of the reserve margin counts Demand Response (“DR”) as a resource while the NERC assessment has DR calculated on the demand side. MISO however notes that while the reserve margin percent will be slightly different, the absolute GW shortfall/surplus is the same between the two assessments.112
Both NERC and MISO draw the same conclusions from the long-term resource assessments; these can be summarized as follows:
• MISO projects that each Local Resource Zone (“LRZ” or “Zone”) within the MISO footprint will have sufficient resources within its boundaries to meet the respective local clearing requirement.
• All Zones within MISO are sufficient from a resource adequacy point of view in the near term when available capacity and transfer limitations are considered. Projected regional shortages in later years may be rectified; MISO is engaged with stakeholders in a number of resource adequacy reforms to help rectify these out-year shortages.
112 See 2017 IPA Electricity Procurement Plan, at 56.
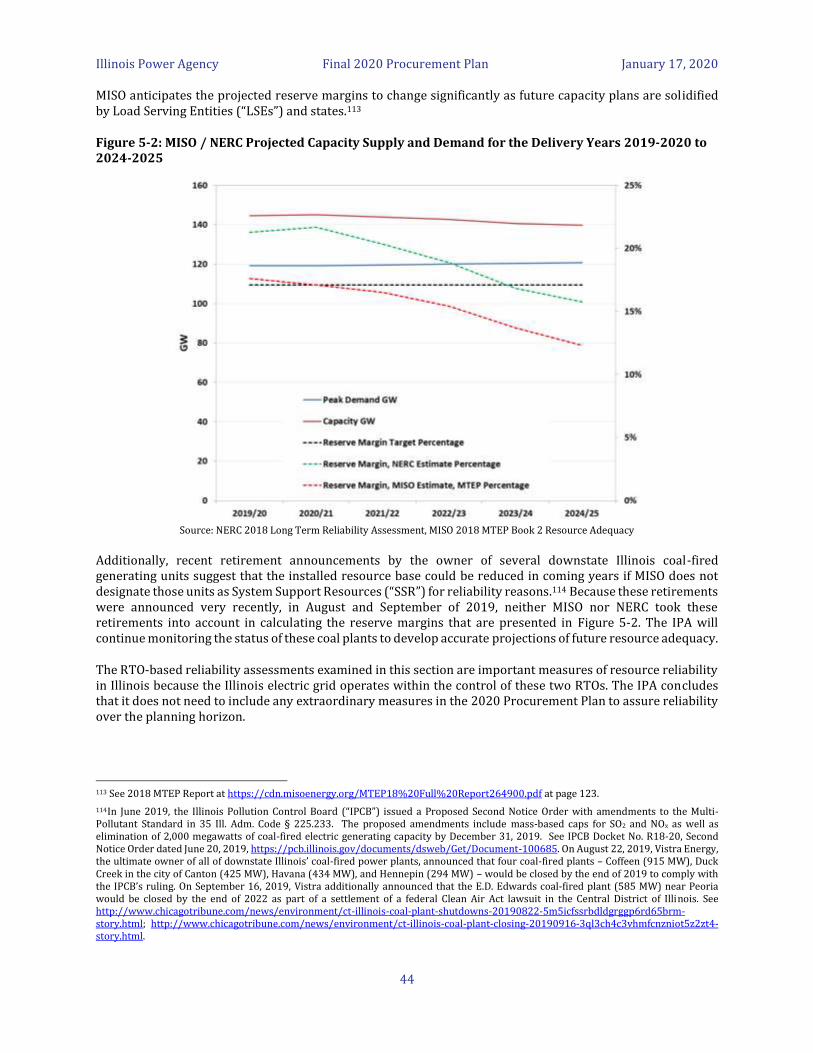
Illinois Power Agency Final 2020 Procurement Plan January 17, 2020
44
MISO anticipates the projected reserve margins to change significantly as future capacity plans are solidified by Load Serving Entities (“LSEs”) and states.113
Figure 5-2: MISO / NERC Projected Capacity Supply and Demand for the Delivery Years 2019-2020 to 2024-2025
Source: NERC 2018 Long Term Reliability Assessment, MISO 2018 MTEP Book 2 Resource Adequacy
Additionally, recent retirement announcements by the owner of several downstate Illinois coal-fired generating units suggest that the installed resource base could be reduced in coming years if MISO does not designate those units as System Support Resources (“SSR”) for reliability reasons.114 Because these retirements were announced very recently, in August and September of 2019, neither MISO nor NERC took these retirements into account in calculating the reserve margins that are presented in Figure 5-2. The IPA will continue monitoring the status of these coal plants to develop accurate projections of future resource adequacy.
The RTO-based reliability assessments examined in this section are important measures of resource reliability in Illinois because the Illinois electric grid operates within the control of these two RTOs. The IPA concludes that it does not need to include any extraordinary measures in the 2020 Procurement Plan to assure reliability over the planning horizon.
113 See 2018 MTEP Report at https://cdn.misoenergy.org/MTEP18%20Full%20Report264900.pdf at page 123.
114In June 2019, the Illinois Pollution Control Board (“IPCB”) issued a Proposed Second Notice Order with amendments to the Multi-Pollutant Standard in 35 Ill. Adm. Code § 225.233. The proposed amendments include mass-based caps for SO2 and NOx as well as elimination of 2,000 megawatts of coal-fired electric generating capacity by December 31, 2019. See IPCB Docket No. R18-20, Second Notice Order dated June 20, 2019, https://pcb.illinois.gov/documents/dsweb/Get/Document-100685. On August 22, 2019, Vistra Energy, the ultimate owner of all of downstate Illinois’ coal-fired power plants, announced that four coal-fired plants – Coffeen (915 MW), Duck Creek in the city of Canton (425 MW), Havana (434 MW), and Hennepin (294 MW) – would be closed by the end of 2019 to comply with the IPCB’s ruling. On September 16, 2019, Vistra additionally announced that the E.D. Edwards coal-fired plant (585 MW) near Peoria would be closed by the end of 2022 as part of a settlement of a federal Clean Air Act lawsuit in the Central District of Illinois. See http://www.chicagotribune.com/news/environment/ct-illinois-coal-plant-shutdowns-20190822-5m5icfssrbdldgrggp6rd65brm-story.html; http://www.chicagotribune.com/news/environment/ct-illinois-coal-plant-closing-20190916-3ql3ch4c3vhmfcnzniot5z2zt4-story.html.

Illinois Power Agency Final 2020 Procurement Plan January 17, 2020
45
5.2 RTO Administered Organized Capacity Auctions
Electric power systems should have sufficient capacity resources to meet peak load requirements plus a planning reserve margin to maintain resource adequacy and ensure reliable system operations. Regional transmission organizations like PJM and MISO operate centralized competitive capacity markets to help ensure resource adequacy and reliability. This section provides a brief overview and a regulatory update of these organized capacity markets.
5.2.1 PJM Reliability Pricing Model
In PJM, capacity is largely procured through the PJM-organized capacity market, the Reliability Pricing Model (“RPM”), which was approved by FERC in December 2006. In 2015, PJM implemented changes to the RPM construct, which established a Capacity Performance product.115 RPM is a forward capacity auction through which generators offer capacity to serve the obligations of load-serving entities. The primary capacity auctions, Base Residual Auctions (“BRAs”), are held each May, three years prior to the commitment period. In the RPM construct, the commitment period is referred to as a “Delivery Year”. In this Plan, “Delivery Year” is also used in relation to all capacity and energy procurements.116 In addition to the BRAs, up to three incremental auctions are held, at intervals of 20, 10, and 3 months prior to the Delivery Year. The 1st, 2nd, and 3rd Incremental Auctions are conducted to allow for replacement resource procurement, increases and decreases in resource commitments due to reliability requirement adjustments, and deferred short-term resource procurement.117 A Conditional Incremental Auction may be conducted, if and when necessary, to secure commitments of additional capacity to address reliability criteria violations arising from the delay of a backbone transmission upgrade that was modeled in the BRA.
Just prior to the beginning of each Delivery Year, the Final Zonal Net Load Price, which is the price paid by LSEs for capacity procured as part of the RPM, is calculated. This price is determined based on the results of the BRA and subsequent incremental auctions for a given year. As the procurement of the majority of the capacity via the RPM is done during the BRA, there is little variation between the BRA clearing price (Preliminary Zonal Capacity Price) and the Final Zonal Net Load Price as shown in Figure 5-3. However, while Figure 5-3 shows little variation in the ComEd zone between the BRA clearing price and the Final Zonal Net Load Price for the Delivery Years through 2015-2016, Delivery Years 2016-2017 and 2017-2018 show a significant variation between the prices. This is because the Final Zonal Net Load Price for 2016-2017 and 2017-2018 includes the incremental costs of each year’s transitional Capacity Performance Incremental Auction (“CPIA”).118
Figure 5-3 also shows higher BRA prices in the ComEd zone for Delivery Years 2018-2019, 2019-2020, 2020-2021, and 2021-2022 relative to 2017-2018, which are attributable to the transition to full implementation of
115 On June 9, 2015, FERC accepted PJM’s proposal to establish a new capacity product, a Capacity Performance Resource, on a phased-in basis, to ensure that PJM’s capacity market provides adequate incentives for resource performance during emergency conditions (FERC Docket No. ER15-623 et al., 151 FERC ¶ 61,208). Resources that are committed as capacity performance resources will be paid incentives to ensure that they deliver the promised energy and reserves when called upon in emergencies. Capacity Performance has been fully implemented for the 2018-2019, 2019-2020, 2020-2021, and 2021-2022 Delivery Years, with transitional capacity performance incremental auctions conducted for the 2016-2017 and 2017-2018 years to facilitate improved resource performance during those years by allowing a portion of capacity to be rebid as Capacity Performance Resources in a new procurement. Implementation of Capacity Performance has generally resulted in increased capacity clearing prices, in particular for the ComEd zone.
116 As noted above, a Delivery Year is June 1 through May 31 of the following year. The use of “Delivery Year” in this Plan also applies to the MISO RTO where the term “Planning Year” is normally used.
117 Deferred short-term resource procurement only applies prior to the 2018-2019 Delivery Year.
118 The BRA clearing price (Preliminary Zonal Capacity Price) for the ComEd zone for 2016-2017 was $59.37/MW-Day. 60% of resources procured in the 2016-2017 CPIA were Capacity Performance Resources. The preliminary incremental cost component for the 2016-2017 CPIA was $38.17/MW-Day and the final incremental cost component was $39.86/MW-Day. After factoring in the adjustments to account for the results of the 1st, 2nd, and 3rd incremental auctions, the Final Zonal Net Load Price was $101.62/MW-Day, a 71% increase from the BRA clearing price. 70% of resources procured in the 2017-2018 CPIA were Capacity Performance Resources. The BRA clearing price for the ComEd zone for 2017-2018 was $119.81/MW-Day. The preliminary incremental cost component for the 2017-2018 CPIA was $27.69/MW-Day and the final incremental cost component was $29.97. After factoring in the adjustments to account for the results of the 1st, 2nd, and 3rd incremental auctions, the Final Zonal Net Load Price for 2017-2018 was $153.61/MW-Day, a 28% increase from the BRA clearing price.
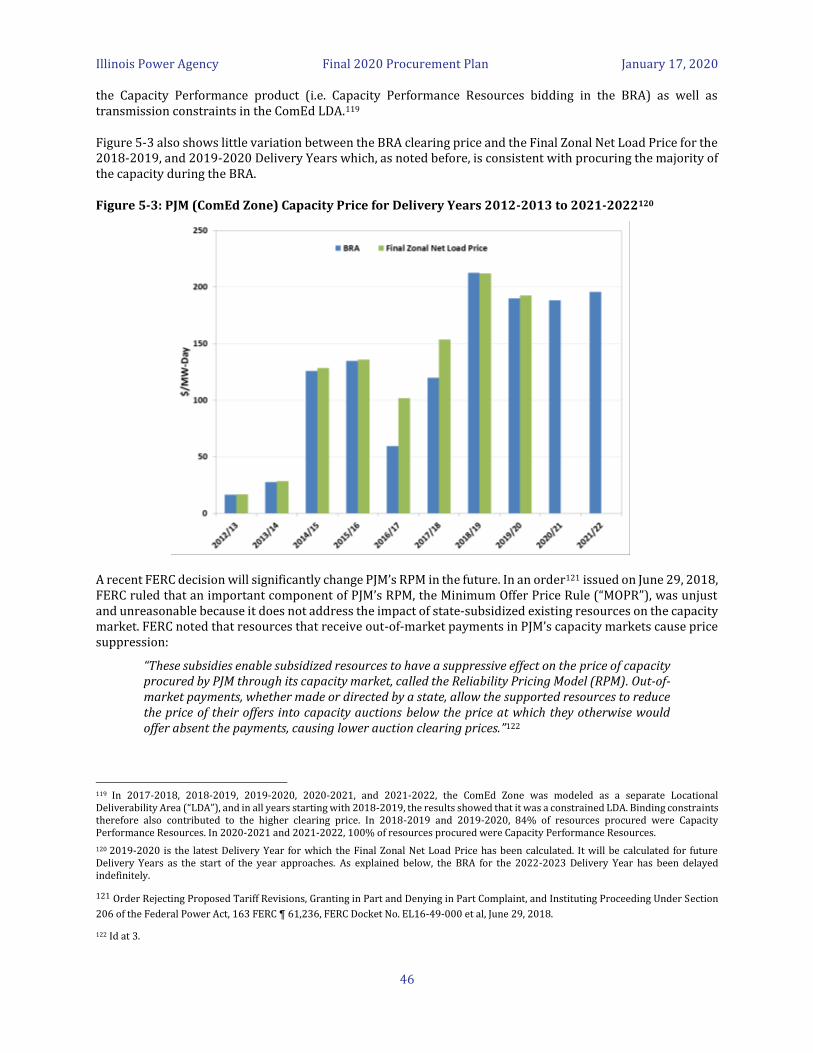
Illinois Power Agency Final 2020 Procurement Plan January 17, 2020
46
the Capacity Performance product (i.e. Capacity Performance Resources bidding in the BRA) as well as transmission constraints in the ComEd LDA.119
Figure 5-3 also shows little variation between the BRA clearing price and the Final Zonal Net Load Price for the 2018-2019, and 2019-2020 Delivery Years which, as noted before, is consistent with procuring the majority of the capacity during the BRA.
Figure 5-3: PJM (ComEd Zone) Capacity Price for Delivery Years 2012-2013 to 2021-2022120
A recent FERC decision will significantly change PJM’s RPM in the future. In an order121 issued on June 29, 2018, FERC ruled that an important component of PJM’s RPM, the Minimum Offer Price Rule (“MOPR”), was unjust and unreasonable because it does not address the impact of state-subsidized existing resources on the capacity market. FERC noted that resources that receive out-of-market payments in PJM’s capacity markets cause price suppression:
“These subsidies enable subsidized resources to have a suppressive effect on the price of capacity procured by PJM through its capacity market, called the Reliability Pricing Model (RPM). Out-of-market payments, whether made or directed by a state, allow the supported resources to reduce the price of their offers into capacity auctions below the price at which they otherwise would offer absent the payments, causing lower auction clearing prices.”122
119 In 2017-2018, 2018-2019, 2019-2020, 2020-2021, and 2021-2022, the ComEd Zone was modeled as a separate Locational Deliverability Area (“LDA”), and in all years starting with 2018-2019, the results showed that it was a constrained LDA. Binding constraints therefore also contributed to the higher clearing price. In 2018-2019 and 2019-2020, 84% of resources procured were Capacity Performance Resources. In 2020-2021 and 2021-2022, 100% of resources procured were Capacity Performance Resources.
120 2019-2020 is the latest Delivery Year for which the Final Zonal Net Load Price has been calculated. It will be calculated for future Delivery Years as the start of the year approaches. As explained below, the BRA for the 2022-2023 Delivery Year has been delayed indefinitely.
121 Order Rejecting Proposed Tariff Revisions, Granting in Part and Denying in Part Complaint, and Instituting Proceeding Under Section
206 of the Federal Power Act, 163 FERC ¶ 61,236, FERC Docket No. EL16-49-000 et al, June 29, 2018.
122 Id at 3.
Illinois Power Agency Final 2020 Procurement Plan January 17, 2020
47
FERC further noted that such out-of-market payments include subsidies through zero-emissions credit (“ZEC”) programs and renewable portfolio standard (“RPS”) programs, and that subsidies for ZEC and RPS resources must be treated comparably to subsidies for other resources:
“Out-of-market payments include, for example, the zero-emissions credits (ZEC) programs and Renewable Portfolio Standards (RPS) programs on which we base our determination in this order that PJM’s Open Access Transmission Tariff (OATT or Tariff) is unjust, unreasonable, and unduly discriminatory or preferential…”123
FERC instituted a proceeding124 under Section 206 of the Federal Power Act to find a replacement for the current MOPR through two ways: (i) expanding the current MOPR to all resources (new and existing) receiving out-of-market payments, and (ii) allowing resources receiving out-of-market payments, with a corresponding amount of load, to opt out of the capacity market and instead participate in a process similar to the current Fixed Resource Requirement (FRR) process, to be defined more specifically by FERC.125 On August 30, 2018, FERC granted a request by PJM to delay the 2022-2023 BRA until August 2019 (from its customary scheduled date in May 2019) to accommodate the results of the pending federal regulatory proceeding.126
On October 2, 2018, PJM filed a specific proposal that had two main features: (i) an expanded MOPR that would apply to all fuel and technology types as well as to existing and new resources, and (ii) a Resource Carve-Out (“RCO”) that would allow resources subject to the MOPR to receive capacity market payments without bidding into the PJM capacity market. 127 Several parties have submitted various comments in the docket, some commenting on FERC’s proposal in general, and others specifically addressing PJM’s proposal. Select filings can be summarized as follows:
• In their initial comments, the ICC addressed FERC’s proposal in general.128 The ICC noted that “in order to make any FRR Alternative or other accommodative measures meaningful for owners of resources targeted for MOPR to choose, many PJM states will need to pass legislation effecting this approach.” The ICC explained that new legislation was likely necessary because the owners of the targeted resources were unlikely to choose the FRR Alternative in the absence of a new revenue stream to replace the PJM capacity market revenue that may be lost by application of the expanded MOPR. Specifically, in Illinois, there was currently no law or regulation that requires LSEs to make capacity payments to owners of facilities that receive ZEC or REC compensation. Illinois, and likely other states, will require time to enact legislation to enable the FRR Alternative or other accommodating measures.
• In reply comments, the ICC addressed PJM’s specific proposal, disagreeing with specific design principles of the PJM proposal including the functioning of the RCO option and how the MOPR price would be set.129 For example, the ICC noted that PJM’s RCO option did not actually carve out (remove) targeted resources from the PJM capacity auction, but rather the carve out was only in the sense that the resource would not receive capacity payments from the PJM capacity auction. The ICC also felt that PJM’s proposed administrative determination of the MOPR floor price would result in MOPR floor prices that are too high.
• In their initial brief, the Illinois Attorney General (“Illinois AG”) pointed out that, for delivery years 2018-2022, the ZEC program which has been instituted in Illinois, has not resulted in the depression of capacity clearing prices in the ComEd zone relative to the prices in other PJM areas.130 The Illinois AG also (i) recommended that state public utility commissions, state attorney generals, and state consumer advocates be given access to the bid data in any auction where resources where subject to
123 Id at 3.
124 FERC Docket No. EL18-178-000.
125 In the Order FERC refers to the opt-out process as the “FRR Alternative”.
126 Order Granting Waiver, 164 FERC ¶ 61,153, FERC Docket No. ER18-2222-000, August 30, 2018.
127 Initial Submission of PJM Interconnection, L.L.C, FERC Docket No. EL18-178-000 (Consolidated), October 2, 2018.
128 Comments of the Illinois Commerce Commission, FERC Docket No. EL18-178-000 (Consolidated), October 2, 2018.
129 Reply Comments of the Illinois Commerce Commission, FERC Docket No. EL18-178-000 (Consolidated), November 2, 2018.
130 Initial Brief of the People of the State of Illinois, FERC Docket No. EL18-178-000 (Consolidated), October 3, 2018.
Illinois Power Agency Final 2020 Procurement Plan January 17, 2020
48
the new MOPR, so as to allow for transparency and to prevent the exercise of market power; (ii) recommended that FERC include a price cap on the revenues that could be received by subsidized resources participating under an FRR Alternative mechanism so as to make sure that the resultant rates were just and reasonable; and (iii) recommended that FERC delay the implementation of any changes to the PJM tariff until the state has developed a state-level FRR Alternative, and no earlier than the 2023-2024 delivery year, so as to give the state enough time to plan. The Illinois AG also made suggestions on how the MOPR should be determined, noting for example that FERC should order PJM to determine a MOPR for nuclear and renewable resources, or any other technology that receives subsidies, based on public information.
• In their reply brief, the Illinois AG made several points as follows:131 (i) the Illinois AG urges FERC to reject an FRR Alternative and the PJM RCO; (ii) the MOPR floor offer should be based on net avoidable cost rate for all resources (new and existing; subsidized and not subsidized) as recommended by the PJM Independent Market Monitor; (iii) the PJM RPM has operational deficiencies; and (iv) if FERC approves the FRR Alternative, a capacity resource’s option to go to the FRR Alternative, and be treated as a resource outside the PJM capacity auction, should be subject to state approval.
• In their initial brief, Exelon Corporation noted that: 132 (i) they supported a resource-specific FRR Alternative that is workable for states seeking to exercise control over their generation mix, and that allows states the flexibility to conduct an out-of-market capacity procurement of the resources they wish to procure for public policy reasons; (ii) resources receiving out-of-market revenue, or that have had their capacity procured by states pursuant to an out-of-market capacity procurement, would be removed from the capacity market along with matching load identified by the supplier in advance of PJM’s capacity auction; and (iii) load would be matched according to bilateral agreements presented by the supplier in the event that the FRR Alternative resource has sold its capacity bilaterally, or as designated by the procuring state in the event that capacity is procured through a state-administered process. Although FRR Alternative resources would be selling their capacity outside the RPM market, these resources would still be making capacity commitments to PJM pursuant to the FRR Alternative, and accordingly they would take on all the obligations of capacity performance resources.
• In their reply comments the PJM Consumer Representatives (PCR) addressed PJM’s specific proposal.133 PCR urged FERC to reject PJM’s extended RCO because it seeks to implement essentially the same capacity repricing proposal that that FERC had rejected in the June 29, 2018 order. PCR supported the exclusion of combined heat and power facilities and voluntary REC programs from the expanded MOPR.134 PCR also argued that the duration of the RCO should be determined by the states and not PJM.
On April 10, 2019, PJM filed a motion for supplemental clarification of FERC’s June 29, 2018 Order.135 In their motion, PJM set forth their intention to run the BRA
for the 2022-2023 Delivery Year in August, 2019 (“August
2019 BRA”) under the currently-effective tariff provisions (i.e., the existing capacity market rules). In addition, PJM sought confirmation that, to the extent FERC has not established a replacement rate prior to the August 2019 BRA, any replacement rate FERC later establishes would be applied prospectively and would not require PJM to rerun the August 2019 BRA. In an order issued on July 25, 2019,136 FERC denied PJM’s motion and directed PJM not to run the BRA for the 2022-2023 Delivery Year in August 2019.
131 Responsive Brief of the People of the State of Illinois, FERC Docket No. EL18-178-000 (Consolidated), November 6, 2018.
132 Initial Brief of Exelon Corporation, FERC Docket No. EL18-178-000 (Consolidated), October 2, 2018.
133 Reply Comments of the PJM Consumer Representatives, FERC Docket No. EL18-178-000 (Consolidated), November 6, 2018.
134 Voluntary REC programs are those programs where the market seller sells the REC to a purchaser that is not required by a state program
to purchase the REC, and that purchaser does not receive any state financial inducement or credit for the purchase of the REC.
135 Motion for Supplemental Clarification of PJM Interconnection, L.L.C., FERC Docket No. EL18-178-000 (Consolidated), April 10, 2019.
136 Order on Motion for Supplemental Clarification, 168 FERC ¶ 61,051, FERC Docket No. EL18-178-000 (Consolidated), July 25, 2019

Illinois Power Agency Final 2020 Procurement Plan January 17, 2020
49
On December 19, 2019, FERC issued its long-anticipated order in FERC Docket No. EL18-178-000.137 In its Order, FERC expanded the MOPR to apply to all fuel and technology types (new and existing resources). The expanded MOPR also includes new and existing demand response, energy efficiency, storage and all resources owned by vertically-integrated utilities. Essentially, with certain exceptions, all existing and new resources receiving a state subsidy would not be allowed to offer capacity bids below the applicable MOPR floor. FERC directed PJM to develop applicable MOPR floors for new and existing resources using 100% of cost of new entry and net avoided cost, respectively. FERC also rejected the RCO option. FERC directed PJM to submit a compliance filing within 90 days, which should include a proposed schedule for future capacity auctions.138
Based on the discussion above, the PJM capacity auction remains in a state of regulatory uncertainty pending rehearing requests, PJM’s compliance filing, and FERC’s acceptance of that filing. The IPA will continue to monitor this proceeding and legislative developments and incorporate any necessary responsive adjustments to future Plans.
5.2.2 Overview of MISO Planning Resource Auction
The MISO Resource Adequacy Construct, specified in Module E-1 of its Tariff, 139 contains the Resource Adequacy Requirements (“RAR”) that require LSEs in the MISO region to procure sufficient Planning Resources to meet their anticipated peak demand, plus a planning reserve margin (“PRM”)140 for the Delivery Year. An LSE’s total resource adequacy obligation is referred to as the Planning Reserve Margin Requirement (“PRMR”). On June 11, 2012, FERC conditionally approved MISO’s proposal to enhance its RAR by establishing an annual construct based upon meeting reliability requirements on a locational basis, including the use of an annual Planning Resource Auction or PRA. MISO implemented the Module E-1 RAR, which became fully effective on June 1, 2013.
On December 15, 2017, MISO filed the currently effective provisions of its Tariff governing resource adequacy in MISO with FERC, informing FERC that their filing did not change any of the current Tariff provisions regarding MISO’s resource adequacy requirements, and requesting that FERC reaffirm that these provisions are just and reasonable.141 On February 28, 2018, FERC issued an order accepting MISO’s filing. 142 MISO’s Independent Market Monitor (“IMM”), however, asserted that “it does not believe that the Auction outcomes have been just and reasonable because the prices produced through the Auction have departed from any reasonable measure of an efficient capacity price level.”143 The MISO IMM further stated that “it expects prices to continue to clear at near-zero prices due to attributes of MISO’s construct including the vertical demand curve coupled with new restrictions on capacity imports by PJM Interconnection, LLC (PJM) and increased sub-regional transfer capability between MISO South and MISO Midwest”.144
On March 26, 2018, MISO filed changes to the MISO Tariff to enhance the locational aspect of their Resource Adequacy Construct with FERC by (i) creating External Resource Zones (“ERZs”), (ii) allocating excess auction revenues through Historic Unit Considerations (“HUCs”), and (iii) aligning parameters used to calculate auction inputs such as Capacity Import Limits (“CIL”), Capacity Export Limits (“CEL”) and Local Clearing Requirements
137 https://www.ferc.gov/whats-new/comm-meet/2019/121919/E-1.pdf
138 https://www.ferc.gov/media/news-releases/2019/2019-4/12-19-19-E-1.asp#.Xg9slEdKiUl
139 Under the MISO Tariff Module E-2 outlines, the RAR compliance obligations for a new LSE during a transitional period until the new LSE’s assets can be included in the full annual RAR process in accordance with Module E-1.
140 The PRM (or target reserve margin) is determined by MISO, based on a Loss of Load Expectation (“LOLE”) of one day in ten years, or state-specific standards. If a state regulatory body establishes a minimum PRM for the LSEs under its jurisdiction, then that state-set PRM would be adopted by MISO for jurisdictional LSEs in that state.
141 Refiling of MISO’s Resource Adequacy Construct, FERC Docket No. ER18-462-000, December 15, 2017.
142 Order Accepting Tariff Filing, 162 FERC ¶ 61,176, FERC Docket No. ER18-462-000, February 28, 2018.
143 Id. at 6.
144 Id. at 6.

Illinois Power Agency Final 2020 Procurement Plan January 17, 2020
50
(“LCR”) with the use of these limits in the PRA.145 FERC’s Staff issued a Deficiency Letter146 to MISO on May 15, 2018, to which MISO responded on June 5, 2018.147 FERC issued an Order on August 2, 2018 rejecting MISO’s proposed tariff revisions but providing some guidance for a revised proposal.148 On August 31, 2018 MISO submitted a revised proposal.149 On October 31, 2018, FERC issued an order accepting MISO’s filing.150
In the spring of 2013, MISO administered its first PRA; it covered the 2013-2014 Delivery Year. Since then, in the spring of each year MISO has conducted its annual PRA; the spring 2019 MISO PRA was the seventh auction administered by MISO. Figure 5-4 below shows the results of the MISO PRA since its inception.
Figure 5-4: MISO PRA Results
As shown in Figure 5-4, and explained in detail in the 2019 Procurement Plan,151 capacity prices in the MISO PRA have been volatile, ranging from a low of $1.00/MW-Day to a high of $150/MW-Day (For Zone 4 the range has been $1.05/MW-Day to $150/MW-Day).
As reaffirmed by FERC’s February 28, 2018 order mentioned above, the PRA remains as the only market-based capacity auction for all load in MISO.152 Also, in their protest to MISO’s refiling of MISO’s Resource Adequacy Construct, the MISO IMM stated that “given the nature of capacity market supply, any capacity market with a vertical demand curve and a small amount of surplus capacity would clear close to zero, which is consistent
145 MISO filing to “Enhance Locational Aspect of Resource Adequacy Construct”, FERC Docket No. ER18-1173-000, March 26, 2018.
146 See https://elibrary.ferc.gov/idmws/common/opennat.asp?fileID=14920258.
147 See https://elibrary.ferc.gov/idmws/common/opennat.asp?fileID=14938877.
148 Order on Tariff Filing, 164 FERC ¶ 61,081, FERC Docket No. ER18-1173-000 et al., August 2, 2018.
149 Refiling of Resource Adequacy Construct Locational Enhancements, FERC Docket No. ER18-2363-000, August 31, 2018.
150 Order Accepting Tariff Filing, 165 FERC ¶ 61,067, FERC Docket No. ER18-2363-000, October 31, 2018. 151 See IPA’s Final 2019 Procurement Plan, Section 5.2.2, pages 54-55.
152 The IPA, however, notes that in MISO the majority of capacity is procured either bilaterally or through Fixed Resource Adequacy Plans.
Illinois Power Agency Final 2020 Procurement Plan January 17, 2020
51
with the recent auction results in MISO”.153 By the same token, the IPA notes that the nature of the vertical demand curve is such that even small deficits in supply can lead to a significantly higher price. While there has been significant price volatility in the results of the MISO PRA over recent years, the clearing price for Zone 4 in the last three auctions (2017-2018, 2018-2019, and 2019-2020 Delivery Years) is significantly lower than in the 2016-2017 Delivery Year. The IPA is, however, concerned that uncertainty around potential coal plant retirements (discussed above), ongoing changes to the rules at MISO and FERC, and other potential legislative and regulatory changes represent significant ongoing uncertainty in the capacity market resulting in PRA price volatility. In light of this, the IPA’s procurement strategy will continue to balance anticipated low capacity clearing prices coupled with high price volatility in the MISO PRA with relatively higher capacity prices observed in the IPA’s capacity procurements. In light of this, as outlined in Section 7.2, the IPA recommends a continuation of the capacity procurement strategy for Ameren Illinois eligible retail customer load for the 2021-2022 and 2022-2023 Delivery Years.
153 Refiling of MISO’s Resource Adequacy Construct, FERC Docket No. ER18-462-000, December 15, 2017, at 9.
Illinois Power Agency Final 2020 Procurement Plan January 17, 2020
52
6 Managing Supply Risks
The Illinois Power Agency Act lists the priorities applicable to the IPA’s portfolio design, which are “to ensure adequate, reliable, affordable, efficient, and environmentally sustainable electric service at the lowest total cost over time, taking into account any benefits of price stability.”154
At the same time, the Legislature recognized that achievement of these priorities requires a careful balancing of risks and costs, when it required that the Procurement Plan include:
an assessment of the price risk, load uncertainty, and other factors that are associated with the proposed procurement plan; this assessment, to the extent possible, shall include an analysis of the following factors: contract terms, time frames for securing products or services, fuel costs, weather patterns, transmission costs, market conditions, and the governmental regulatory environment; the proposed procurement plan shall also identify alternatives for those portfolio measures that are identified as having significant price risk.155
This Chapter discusses and assesses risk in the supply portfolio, as well as tools and strategies for mitigating the relevant risks. Developing a risk management strategy requires knowledge of the risk factors associated with energy procurement and delivery, and of the tools available to manage those risks. Section 6.1 describes the relevant risk factors. Sections 6.2 and 6.3 describe the tools for managing supply risk and the types of contracts and hedges that can be used to manage supply risk. Those products provide the basis for building the supply portfolio. Section 6.4 addresses the complementary issue of reducing or re-balancing the supply portfolio when needed, and the legal, regulatory and policy issues that may arise if utilities have to do so by selling previously purchased hedges. Section 6.5 provides a historical summary of the Ameren Illinois, ComEd, and MidAmerican Purchased Electricity Adjustment (“PEA”) rates as a guide to the historical impact of risk factors.156 This section also addresses the changes in MidAmerican pricing that reflect the costs of participating in the IPA procurements. Section 6.6 discusses the IPA’s historical approach to risk and portfolio management. Finally, Section 6.7 addresses the role of demand response programs in risk management.
Section 6.6.2 addresses the cost and uncertainty impacts of supply risk factors. Risk is often taken to mean the amount by which costs differ from initial estimates. Utility energy pricing in Illinois for Ameren Illinois and ComEd customers is based on estimates and cost differences which are trued up after the fact through the PEA. Prior to the 2016-2017 Delivery Year, MidAmerican provided power and energy to its eligible Illinois customers only from MidAmerican owned generation, with energy costs for MidAmerican customers in Illinois recovered through base rates regulated by the ICC. Starting with the 2016-2017 Delivery Year, MidAmerican pricing for its Illinois customers also included the cost of energy obtained in IPA procurements through its PEA, which reflects a cost recovery process similar to what is used by Ameren Illinois and ComEd.
6.1 Risks
Procurement risk factors can be divided into three broad categories: volume, price, and hedging imperfections. Volume risk deals with risk factors associated with identifying the volume and timing of energy delivery to meet demand requirements. Price risk covers not only the uncertainty in the cost of the energy but also the costs associated with energy delivery in real time. Hedging imperfections are the result of mismatches between the types of available hedge products and the nature of customer demand.
6.1.1 Volume Uncertainty and Price Risk
The accuracy of load forecasts directly impacts volume uncertainty. Accurate customer consumption profiles, load growth projections, and weather forecasts impact both the total energy requirement and the shape of the load curve. Chapter 3 describes the load forecasting processes utilized by Ameren Illinois, ComEd and MidAmerican. The risk factors that determine overall volume risk include: changes in customer load profiles
154 20 ILCS 3855/1-20(a)(1).
155 220 ILCS 5/16-111.5(b)(3)(vi).
156 See 220 ILCS 5/16-111.5(l). This policy is manifest through riders filed by each utility – ComEd’s Rider PE (Purchased Electricity), and Ameren Illinois’ Rider PER (Purchased Electricity Recovery).

Illinois Power Agency Final 2020 Procurement Plan January 17, 2020
53
and usage patterns, the uncertainties associated with load growth and short-term weather fluctuations, technology changes such as smart meters and behind the meter generation and storage, and customer switching. For the Illinois utilities, a key factor in volume risk is the uncertainty associated with customer switching which directly impacts the results of the utilities’ load forecasts. The opportunities for potentially eligible retail customers to take service from ARES or through municipal aggregation resulted in substantial portions of the potentially eligible retail customer load switching away from the utilities for non-utility retail contracts that ran through the 2014-2015 procurement year. More recently, the number of residential customers taking ARES supply has declined. The primary uncertainty surrounding customer switching going forward appears to be the potential for additional retail load migration back to the utilities. For Ameren Illinois and ComEd, the switched load percentage is expected to remain essentially flat over the 5-year forecasting horizon. MidAmerican’s switched load is projected to grow slightly before leveling off, but will remain a much smaller part of its total Illinois load (less than 5%).
Customer switching decisions are influenced by the difference between utility and third-party pricing. Customer switching behavior impacts volume risk and, in turn, variability in utility customer volumes impacts price risks. The IPA’s historical procurement strategy involves buying power in a “laddered” approach with a large fraction of the power to serve retail customers in the Delivery Year procured through forward purchases in a three-year approach. In a period of rising prices, those forward purchases are likely to be priced below market. Therefore, the blended price of utility supply may be less than the current price of an ARES offer, even an offer through municipal aggregation. This price difference can result in increased customer migration back to the utility. The reverse can occur as well; higher utility supply costs relative to alternatives through ARES suppliers or municipal aggregation can result in eligible retail customers migrating away from the utilities.
6.1.2 Residual Supply Risk
Hedging imperfection can contribute to supply risks through mismatches in procurement supply shape, supply delivery points and customer load locations. The standard on-peak and off-peak block energy products procured by the IPA do not reflect the variation in hourly loads. These products provide constant volume and prices across a fixed number of hours while hourly prices as well as load vary across the day and within each of the peak and off-peak periods. Because of this variation, even if the average peak and off-peak monthly load is perfectly hedged, the actual hourly load will still be imperfectly hedged. Residual supply risk will remain since the actual load will vary between being greater than or less than the average.
6.1.3 Basis Differential Risk
Basis differential risk relates to the uncertainty that the price of energy at a given pricing point is not the same as the settlement price at the point(s) or zone where the energy is ultimately consumed. Locational mismatches are generally not a risk for the IPA procurements since the delivery points for the hedge contracts are the LSE’s load zone.
6.2 Tools for Managing Supply Risk
Traditionally, a utility’s electricity supply plan includes physical supply and financial hedges. Physical supply includes the power plants that the utility owns or controls, as well as transactions for physical delivery of electricity. Financial hedges are additional hedging instruments used to manage price risk and other risks, such as weather risk.
Following the enactment of the Electric Service Customer Choice and Rate Relief Law (Public Act 90-0561) in 1997, ComEd and Ameren Illinois divested their generating plants to unregulated affiliates or third parties. ComEd and Ameren Illinois have no contracts for unit-specific physical delivery, other than certain Qualifying Facilities (as designated under the federal Public Utilities Regulatory Policies Act) contracts. As the utilities do not purchase and take title to electricity, the utilities’ supply positions, other than RTO spot energy, are exclusively price hedges. MidAmerican has retained the resources that serve its Illinois customers; most of these resources are located outside of Illinois. MidAmerican allocates a portion of the capacity and energy from specified resources under its control for its Illinois eligible retail customers. Prior to the 2016 Plan procurements, the allocated capacity and energy from MidAmerican owned resources were sufficient to meet the needs of MidAmerican’s Illinois eligible retail customers. Current and planned retirements among these
Illinois Power Agency Final 2020 Procurement Plan January 17, 2020
54
resources are reducing the capacity available for allocation to MidAmerican’s Illinois customers. As a result, MidAmerican requested that the IPA procure the portion of energy and capacity that is not forecast to be met by the Illinois-allocated MidAmerican resources. Following the approach started for the 2016 Plan and continued under the 2017, 2018 and 2019 Plans, for the 2020 Plan, the IPA will procure the net energy requirements between MidAmerican’s eligible retail customer load and the MidAmerican controlled generation allocated to its Illinois customers. The portion of MidAmerican’s capacity requirements for eligible retail customers in Illinois not covered by MidAmerican’s owned resources will be procured through the MISO PRA.
ComEd’s capacity requirements will continue to be obtained through the PJM-Administered capacity market. The Ameren Illinois capacity needs will be procured through a combination of IPA procurements for 50% of its needs in the near-term forward market with the remaining balance obtained through the MISO PRA.
Physical electricity supply and load balancing for ComEd, Ameren Illinois, and MidAmerican are coordinated by the respective RTOs (PJM for ComEd and MISO for Ameren Illinois and MidAmerican). ComEd, Ameren Illinois, and MidAmerican are considered to be LSEs by the RTOs. Each RTO provides day-ahead and real-time electricity markets and clearing prices. The generators supply their energy to the RTO, and the RTO delivers energy to LSEs and customers. The RTO ensures the physical delivery of power. The cost of managing this delivery, including the cost of managing reliability risks, is passed on to the LSEs financially. The risks faced by LSEs in supplying energy to customers are mostly financial. The LSEs still need to manage certain operational risks such as scheduling and settlement. There are other, non-financial risks associated with electricity retailing, such as customer billing or accounts receivable risks, but those are not associated with the supply portfolio.
Each RTO charges a uniform day-ahead price for all energy scheduled to be delivered in a given hour and delivery zone. To the extent that real-time demand differs from the day-ahead schedule, load is balanced by the RTO at a real-time price: if demand exceeds the day-ahead schedule, then the LSEs pay the real-time price; and if demand is less than the day-ahead schedule, the LSEs are credited with the real-time price. Both the day-ahead and the real-time prices are referred to as Locational Marginal Prices (“LMPs”) because they depend on the delivery location or zone.
6.3 Types of Supply Hedges
The 2014 Procurement Plan contained a detailed description of a number of different types of supply hedges, which are listed below. One point made in that Plan is that hedges available in the market are not perfect; the risks listed in Section 6.1 cannot all be hedged away except perhaps through a specially tailored “full requirements” hedge contract, whose price premium may not be acceptable in return for that degree of risk reduction.157
An important category of energy supply hedges is a unit-specific supply contract. Other supply hedges are forward contracts, futures contracts, and options.
Unit-Specific Hedges
Unit-specific hedges are tied to the output of a specific generating unit which can depend on how the unit is dispatched, including contracts that fall into the following categories:
• As-available • Baseload • Dispatchable
157 Even a full requirements hedge does not truly eliminate all risk. For example, if a supplier of a full requirements tranche were to default, additional procurement costs to make up the shortfall could be passed along to eligible retail customers.
Illinois Power Agency Final 2020 Procurement Plan January 17, 2020
55
Unit-Independent Hedges
Other energy supply hedges are available that are not dependent on the operation of a specific generating unit including:
• Standard forward hedges (block contracts) • Shaped forward hedges • Futures contracts • Options • Full requirements hedges
6.3.1 Suitability of Supply Hedges
Not all of the types of hedges listed in Section 6.3 are suitable for use in this Procurement Plan, and not all may be readily available in electricity markets. 158 Illinois law requires that “any procurement occurring in accordance with this plan shall be competitively bid through a request for proposals process,” provides a set of requirements that the procurement process must satisfy, and mandates that the results be accepted by the ICC.159 Among the specific requirements, the Procurement Administrator must be able to develop a market-based price benchmark for the process; the bidding must be competitive; and the ICC’s Procurement Monitor is required to report on bidder behavior.160 The level of bidding competitiveness can be gauged by the breadth of participation by bidders in the procurement.
Hedges most suitable for use by the Agency are those standardized products that are well-understood, and preferably widely-traded. If a product has liquid trading markets, or is similar to other products with liquid markets, a bidder can manage its risk exposure. The availability of information on current prices and the price history of similar products help bidders provide more competitive pricing, and help the Procurement Administrator produce a realistic benchmark. Prior to its 2014 Procurement Plan, the IPA had generally restricted its hedging to the use of standard forward energy hedges in 50 MW increments. The IPA began using 25 MW increments and a second, fall energy procurement with the 2014 Plan. The Agency’s recommended plans have been stated in terms of monthly contracts, although procurement events have met some of these needs with multi-month contracts.
The IPA has in the past purchased energy products that are not typically traded, such as the long-term PPAs with new build renewable generation that were authorized in the 2010 Procurement Plan. As noted in Section 2, these products still must be standardized in such a way that the winning bidders may be selected based on price alone, and the price is subject to a market-based benchmark. As discussed in Chapter 2, while the ICC clarified its understanding of the definition of “standard wholesale product” in its approval of the 2014 and 2015 Procurement Plans, the IPA’s authority to procure other products, including shaped forward contracts and option contracts, could be subject to future litigation. Markets for products that are specifically designed for the IPA’s requirements, such as full requirements contracts or over-the-counter options, will likely have limited transparency. The IPA’s procurement structure requires a benchmarking and approval process which may not be compatible with such a low level of transparency.
Quoted prices for energy futures contracts at the PJM Northern Illinois Hub and the MISO Illinois Hub provide reasonable indications of the future prices anticipated by the market, making such contracts easier to benchmark. The markets for long-dated (i.e., further in the future) contracts are generally less liquid than the markets for near term contracts, however. The Agency would need to obtain competitive pricing on such 158 There had been substantial debate in the approval of past Procurement Plans related to whether a full requirements approach is a more suitable approach for eligible retail customers. In approving the 2015 Plan and rejecting the Illinois Competitive Energy Association’s full requirements procurement proposal as “not supported by the record,” the Commission stated that it “wishe[d] to make clear that it is not inclined to consider future years’ full requirements procurement proposals absent new arguments supported by an analysis quantifying benefits to eligible retail customers.” Docket No. 14-0588, Final Order dated December 17, 2014 at 114. Since that decision, the IPA is not aware of any new arguments in favor of full requirements (let alone new arguments supported by analyses quantifying benefits to eligible retail customers), and notes the continued success of its procurement approach in producing highly competitive service rates for Ameren Illinois, MidAmerican, and ComEd eligible retail customers.
159 220 ILCS 5/16-111.5(b), (e), (f).
160 220 ILCS 5/16-111.5(f).
Illinois Power Agency Final 2020 Procurement Plan January 17, 2020
56
contracts if it were to incorporate them in its supply portfolio. However, it would be difficult or impossible to conduct the statutory RFP process for exchange-traded futures contracts: setting a price through an RFP process structured per legislative mandates is incompatible with price-setting in an open outcry auction, through electronic trading or by a market-maker. It is also unclear how the margin requirements would fit within the current regulatory framework, if price movements require the utility to post margin many months in advance of delivery. The same concerns are even more applicable to options contracts.
6.3.2 Options as a Hedge on Load Variability
An option gives the buyer a right but not an obligation to buy or sell a commodity at a specified price on or before a certain date. For example, a call option gives the buyer the right, but not the obligation, to buy a specific contract. A put option gives the buyer the right, but not the obligation, to sell a specific contract. Options are “one-way” hedges. A call option, for example, can help hedge against price increases but provides no hedge against price decreases. Options on forward or futures contracts are much less expensive than the contracts themselves, because they only convey the right to buy or sell the contract for the commodity.
Options can be perceived as attractive tools to hedge against customer migration and other forms of load fluctuations. According to option pricing theory, options are not any more useful for hedging price risk than are forward contracts unless one is exposed to other risks that correlate with and enhance price risk (for example, loss of load accompanied with declining prices). In theory, option prices are determined by the value of the option as a price hedge. If an option had additional value as a hedge against load migration risk, some might consider options to be a bargain. It turns out that options are expensive when used as hedges for load migration risk. This is because if a call option on 1 MW of load has a price V, then that should be its value as a price hedge. If the 1 MW is not currently served by the utility, but may return with some probability P, then the value of this option should be only P times V which is less than its price. In other words, the value of the option as a hedge against load migration risk is less than its value as a price hedge. But it is the value as a price hedge that determines the option’s price.
There are also other costs and logistical obstacles to using options:
• A large part of the volume of options on the market is traded on exchanges. They have a particular advantage in that the trading exchange bears the counterparty default risk. However, the Agency’s structured procurement process prevents the Agency from buying options on the exchanges.
• Option contracts can be relatively illiquid, making it more difficult to assure fair pricing. If options purchased through the IPA procurement process required an affirmative exercise decision, which most likely they would, the utilities would seek regulatory comfort on their exercise decision-making before agreeing to use options. For example, if an exercise decision were dependent on the utility’s load forecast or view of municipal aggregation, the utility would want to be able to show it had acted prudently. If the utility exercised a put option, to sell the underlying hedge, it would want to be sure that decision did not make it a wholesale market participant for purposes of FERC Order 717. If the option exercise was purely financial and automatic—resulting only in a cash payment from the option holder—these concerns might not be as important, but counterparty credit would be an issue.
• The use of options is subject to regulations under the federal Dodd-Frank Act of 2010 (specifically Title VII161). Under this act, the trading of options (and other swaps) would be reported to a central database for clearing purposes. Trade details (price, volumes, time stamped trade confirmations, and complete audit trails) would need to be reported. In addition, trade records must be kept for 5 years after the termination of trade (either through exercise or expiration), and must be made available within five business days of request. This would add to either the purchase cost or the ownership cost of options.
161 Pub. Law 111-203, July 21, 2010 (modifying, inter alia, the Commodity Exchange Act at 7 U.S.C. § 2).
Illinois Power Agency Final 2020 Procurement Plan January 17, 2020
57
6.4 Tools for Managing Surpluses and Portfolio Rebalancing
The Illinois Power Agency Act specifies that the Procurement Plan “shall include … the criteria for portfolio re-balancing in the event of significant shifts in load.”162 It is therefore appropriate to consider what tools are available to conduct such rebalancing, keeping in mind that the utilities, not the Agency, are the owners of the forward hedges and that selling of excess supply in the forward markets may have unintended cost and accounting consequences.
• To date, the only rebalancing of hedge portfolios prior to the delivery date has been the curtailment of long-term renewable contracts due to budget restrictions. Spending on these contracts was subject to a limit related to a statutorily-mandated rate impact cap calculated based on eligible retail customer load, making the budget available for payment under those contracts subject to fluctuation due to load migration away from (and back to) utility supply.163
• Sales of excess supply by the utilities via a reverse RFP to rebalance their supply portfolio may create a de facto “wholesale marketing function” within the utilities. The employees involved in wholesale marketing activities would be subject to the separation of functions in accordance with FERC Order 717.164
• To date, the utilities have scheduled excess supply in their portfolios, or made up supply deficits in the RTOs’ day-ahead markets with residual balancing occurring in the RTOs’ real-time markets. This has been the dominant mode of portfolio rebalancing.
• As an alternative form of rebalancing, the Agency could conduct “reverse RFP” procurement events, in which the bids are to buy rather than sell forward hedges. The Agency does not believe that it has the authority to sell excess supply via its authority to “conduct competitive procurement processes” under 20 ILCS 3855/1-20(a)(2).
• The Agency could conceivably issue an RFP to purchase derivative products, such as put options on forward hedges, which would have a similar risk reduction effect to selling forwards. This may avoid legal and contractual difficulties associated with selling forward hedge contracts. This approach would also require the utilities to ensure they had regulatory approval to exercise the options after purchasing them, and the employees who exercise the option could become classified as part of a “marketing function.” The Agency does not envision entering into derivative contracts for rebalancing purposes.
• The Agency could conduct multiple procurement events in a year if the rebalancing required is to increase the supply under contract. Since 2014, the IPA has conducted two energy procurements each year, one in the spring and the other in the fall. Starting with the 2018 Procurement Plan, the IPA began conducting two capacity procurements to cover a portion of Ameren’s capacity requirements, one in the spring and one in the fall. Conducting multiple procurements each year provides for a more precise portfolio balance, which is the direct result of using more current load forecasts.
6.5 Purchased Electricity Adjustment Overview
The PEA functions as a financial balancing mechanism to assure that electricity supply charges match supply costs over time. The balance is reviewed monthly and the charge rate is adjusted accordingly. The PEA can be a debit or credit to address the difference between the revenue collected from customers and the cost of electricity supplied to these same customers in a given period. The supply costs are tracked, and the PEA adjusted, for each customer group. The PEA is applicable to the purchased electricity costs of Ameren Illinois, ComEd, and MidAmerican.
162 220 ILCS 5/16-111.5(b)(4).
163 As the state’s renewable portfolio standard has transitioned as of June 1, 2019 to being funded through a charge assessed to all utility retail customers, future curtailment of these agreements is no longer a meaningful risk. (See 20 ILCS 3855/1-75(c)(1)(E)).
164 125 FERC ¶ 61,064, Oct. 16, 2008.
Illinois Power Agency Final 2020 Procurement Plan January 17, 2020
58
The PEA provides some guidance as to the amount by which the complete set of risk factors caused the cost of energy supply to differ from utility estimates. Figure 6-1 shows how the PEAs for Ameren Illinois and ComEd have changed over the last eight years. The figure also shows the applicable MidAmerican PEAs starting with October 2016. While Ameren Illinois’ PEAs have been generally “negative” (i.e., operating as a credit to customers) over this period, ComEd’s have been “negative” as well as “positive” (i.e., operating as charge to customers). ComEd has voluntarily limited its PEA to move between +0.5 cents/ kWh and -0.5 cents/kWh, and the figure shows that ComEd’s PEA has oscillated between those limits. Although based on a relatively short period, the MidAmerican PEA has shown significantly more volatility, ranging from a negative 2.415 cents/kWh in November 2017 to a positive 1.277 cents/kWh in June 2017and a positive 1.127 cents/kWh in February 2018. Prior to April of 2018, MidAmerican had been including in the PEA factor the entire adjustment amount in a single month, creating significant volatility in the PEA factor. In April of 2018, MidAmerican began amortizing the monthly adjustment amount over multiple months, when needed. MidAmerican is using a “soft cap” of +$100,000 to determine if the monthly adjustment amount should be amortized. During the time that the amortization has been used in the calculation, MidAmerican has seen a reduction in volatility with the PEA mostly positive, ranging from a negative 0.076 cents/kWh in April 2018 to a positive 0.776 cents/kWh in June 2019. MidAmerican and the IPA will continue to monitor this situation over the next year to assess whether further adjustments to the forecast process are warranted.
In April 2014, the Commission approved an adjustment to ComEd’s PEA that allows the accumulated balance of deferrals associated with the computation of the PEA each June to be rolled into the base default service rate for the next year and the associated balance to be reset to zero. The ComEd PEA increased from a credit to a charge for April and May of 2015. This was due to how the ICC instructed ComEd to recover customer care costs from eligible retail customers, and not due to costs related to energy procurement. Absent that cost recovery, the PEA would have operated as a credit to customers in those two months. The ComEd PEA also reflected charges in August 2015, June through September 2016, June through September 2017, and in February 2018. The ComEd PEA reflected credits for most of the other months from October 2016 through June 2019.
In the early months of the historical period, notably July 2013 through September 2013 and July 2014 through November 2014, the magnitude of the Ameren Illinois negative PEAs increased significantly. The IPA understands that this change was largely the result of the long position in the supply portfolio of Ameren Illinois resulting from the increase in municipal aggregation switching, and that long position was subsequently settled favorably to customers within the MISO balancing markets. This drove an over-collection from eligible retail customers during the previous winters and the large negative PEA values represent the return of those proceeds to the remaining eligible retail customers. Since December 2014, the negative values of the Ameren Illinois PEAs have been much smaller as portfolio volumes have become better matched with actual load. Ameren Illinois’ PEA values have been primarily negative through June 2019 ranging from -0.052 cents/ kWh to -0.561 cents /kWh with small positive values in December 2018 and January 2019.

Illinois Power Agency Final 2020 Procurement Plan January 17, 2020
59
Figure 6-1: Purchased Electricity Adjustments in Cents/kWh, June 2011 – September 2019
*Uniform across all zones in the Ameren Illinois service territory since Oct. 2013. For previous months, values differed slightly by Zone.
6.6 Estimating Supply Risks in the IPA’s Historical Approach to Portfolio Management
6.6.1 Historical Strategies of the IPA
The utilities, pursuant to plans developed by the IPA, have historically used fixed-price, fixed-quantity forward energy contracts and financial hedges (such as the LTPPAs), along with RTO load balancing services to serve load. Energy deliveries have been coordinated by the RTOs and the Agency arranged a portfolio of long-term contracts and standard forward hedges. These forward hedges were procured in multiples of 50 MW during the earlier procurements and in 25 MW blocks since 2014. Ancillary services have been purchased from the RTO spot markets. The utilities have used Auction Revenue Rights to mitigate transmission congestion cost.
Forward hedges have been procured on a “laddered” basis. The Agency originally sought to hedge 35% of energy requirements on a three-year-ahead basis, another 35% on a two-year-ahead basis, and the remainder on a year-ahead basis. Prior to 2014, procurements had been annual, in April or May, rather than on a more frequent or ratable basis. For example, in the spring of 2010, the Agency procured forward hedge volumes as close as possible to 35% of the monthly average peak and off-peak load forecasts for the 2012-2013 Delivery Year. In the spring of 2011, the Agency procured forward hedge volumes to bring the total volume as close as possible to 70% of then-current monthly average peak and off-peak load forecasts for the 2012-2013 Delivery Year. And in the spring of 2012, the Agency procured forward hedge volumes to bring the total volume as close as possible to 100% of then-current monthly average peak and off-peak load forecasts for the 2012-2013 Delivery Year. In the 2013 Procurement Plan, the Agency indicated it was considering a change in hedging from
Illinois Power Agency Final 2020 Procurement Plan January 17, 2020
60
100%/70%/35% of the expected load to 75%/50%/25%. Because there were no procurements in 2013, that hedging strategy was not formally adopted or implemented.
In the 2014 Procurement Plan, the IPA proposed a modification to the 75%/50%/25% strategy. Specifically, the Agency proposed that the procurement goal for a mid-April procurement event should be to hedge 106% of the expected load for the immediately following June-October. These months would be close to the procurement date and no benefit was seen in deferring 25% of the procurement to the spot market. On the other hand, because of the correlation between load and price and because prices in the hours of high usage are more than 100% of the time-weighted average price, a $1/MWh movement in the monthly average price translates into an increase of more than $1/MWh in the average portfolio cost (the load-weighted average price) – in fact, approximately $1.06/MWh. The Agency continued to recommend hedging up to only 75% of the expected load for November-May of the prompt Delivery Year in the April procurement, but also recommended a second procurement in September to bring the hedged volume for those months to 100%.
In the 2015 Procurement Plan, the IPA adopted some minor changes from the 2014 Plan. The hedge ratios for the April procurement event were adjusted to 100% of the expected load for off-peak hours for June through October delivery in the prompt delivery year and for on-peak hours for June, September, and October delivery in the prompt delivery year. The hedge ratio was left at 106% only for the on-peak hours of July and August The target hedge ratios for delivery in subsequent years were adjusted to 37.5% for all months (June-May) of the following delivery year for the April procurement event, 50% for all months of the following delivery year for the September event, 12.5% for all months of the second delivery year out for the April event, and 25% for all months of the second delivery year out for the September event.
In the 2016 Procurement Plan, other than moving October from the group of months fully hedged in the April procurement to the group of months to be fully hedged in the Fall procurement, no substantial changes to the strategy were implemented, but consideration was given to adjusting the cumulative hedge ratios for various delivery months, effective at the next to last scheduled event prior to delivery.
For the 2017, 2018 and 2019 Procurement Plans, the IPA continued the use of two procurement events for standard energy blocks, which were held in the spring with a subsequent event scheduled for each fall.
Under the 2020 Procurement Plan, the IPA proposes to continue the use of two procurement events to be held in the spring and fall. The hedge ratios are proposed to remain at the values set for the 2019 Plan.
This procurement schedule balances procurement overhead costs, price risk, and load uncertainty. If the amounts to be hedged in any year are small, the Agency could decide to avoid the procurement overhead and not schedule a procurement event (as in 2013). The Agency has not used options, unit specific contracts (except for the LTPPAs and the since-cancelled FutureGen agreements), or other forms of hedging in the past. In addition, the Agency has not used forward sales or put options to rebalance its portfolio.
6.6.2 Measuring the Cost and Uncertainty Impacts of Supply Risk Factors
Given the monthly volatility in forward energy prices, the IPA investigated the merit of considering alternative procurement schedule strategies with the goal of further minimizing the volatility of the resulting portfolios of contracts for each delivery month in developing its 2016 Plan.
For the 2016 Plan, the IPA conducted a detailed analysis related to procurement scheduling and volatility.165 The results of that analysis indicated that the closer the procurement events are held to the product delivery date, the greater the impact of volatility on the products procured. The on-peak convenience volatility curves shown in this analysis demonstrated these results. However, other factors also impact the scheduling of procurement events relative to delivery timing and may result in reasonable decisions to hold procurement events in close proximity to product delivery dates.
165 See 2016 IPA Procurement Plan at 71-80.
Illinois Power Agency Final 2020 Procurement Plan January 17, 2020
61
The results of the 2016 Plan analysis suggested that volatility, as measured by the standard deviation of daily forward prices within a trade month, is not significantly different from trade month to trade month and is generally somewhat higher in any trade month for delivery in a summer month (e.g., July) than for delivery than other months. High volatility for winter delivery months (e.g., January) is a relatively recent development with prices since 2018, along with recent futures prices, showing peaks in January as well as July.
The cost to eligible retail customers for qualified service in a given month is driven by the average price paid for blocks of on-peak and off-peak energy secured under a procurement plan. The stability of that cost is a function of the long-term trends (both predictable and random) in forward prices over the procurement period and the more random draw of the forward price on the days in which components of the portfolio are procured. The IPA performed a “backcast” analysis to study the effects of different procurement schedules for the on-peak energy component of the monthly portfolios for October 2014 through September 2015 delivery using the PJM Northern Illinois Hub forward price data. A Monte-Carlo simulation was conducted with 10,000 iterations. In each iteration a forward price was drawn from a normal distribution for each delivery month and from each designated event date range (one to two months of trade days), and a weighted average portfolio cost for each delivery month under each procurement schedule, based on the designated target levels was calculated. The distributions over all iterations of the portfolio average costs were analyzed to determine means and standard deviations.
While the IPA did not include modeling of seasonal futures prices in the 2016 Plan’s Monte Carlo simulation, it appears that the fairly stable volatility of average futures prices and the maturity-varying profile of convenience yields both lend support to a strategy of using multiple procurements which may be evenly spaced and sized. In order to avoid excessive uncertainty in procurement costs, the shape of the convenience yield curves indicates that the last procurement should be made several months in advance of contract expiry.
Based on this analysis and its experience since, the IPA sees no reason to change the energy procurement schedule and approach for its 2020 Plan from the approach established in the 2015 Plan, which was utilized again for the 2016, 2017, 2018, and 2019 Plans.
6.7 Demand Response as a Risk Management Tool
Demand response programs operated by ComEd are not used to offset the incremental demand, over and above the weather-normalized base case peak load. The programs, however, are supply risk management tools available to help assure that sufficient resources are available under extreme conditions. Under the current PJM capacity construct, demand resources participate fully as a source of supply in the capacity procurement process, and the RPM provides capacity compensation for demand resources that clear in RPM auctions in the same manner as cleared generation resources receive compensation. To participate fully as a source of supply, the demand response resource must, either by itself or, if seasonal, by being coupled with another eligible seasonal resource, be able to meet the annual availability requirements imposed on resources by PJM’s adoption of Capacity Performance requirements.
In the case of Ameren Illinois and MidAmerican, MISO provides the ability for demand response measures to reduce supply risk. On March 14, 2014, FERC approved MISO’s modification to its Module E-1 tariff to treat demand response and energy efficiency resources similarly to other capacity providing resources for operational planning purposes. MISO distinguishes between capacity resources that clear the capacity auction and load modifying resources (“LMR”) that have no capacity supply obligation. LMR have different obligations than capacity resources, but do count toward planning resources. By qualifying as an LMR, the demand resource is able to help meet resource adequacy requirements obligations and receives compensation for providing planning resource capability. Also, by qualifying as an LMR, the demand resource is obligated to curtail during emergencies and may be penalized for failure to do so.166 On February 2, 2017, FERC approved proposed changes to MISO’s tariff to establish measurement and verification criteria for the LMR for the
166 A service that can include LMRs in MISO is Emergency Demand Response (EDR). EDR resources are required to respond during an emergency. EDR resources may qualify as LMR, but are not required to do so. The EDR has flexibility with respect to offering emergency energy but is not counted as capacity towards resource adequacy requirements.
Illinois Power Agency Final 2020 Procurement Plan January 17, 2020
62
purpose of determining whether these resources are meeting their performance obligations.167 On February 19, 2019, FERC approved revisions to MISO’s tariff which allow MISO to more effectively access the capabilities of LMRs by requiring an LMR to offer its capability based on availability in all seasons and be deployed based on the shortest notification requirement that it can meet.168 These rules will improve transparency around LMR capability by providing firmer and more clearly documented commitments regarding availability prior to participating in MISO’s capacity market.
FERC Order No. 745 requires Independent System Operators (“ISOs”) and RTOs to compensate demand response resources participating in wholesale markets at the market price. In January 2016, the U.S. Supreme Court reversed a D.C. Circuit Court of Appeals ruling and upheld FERC’s jurisdiction over demand response competing in wholesale markets, holding that the Federal Power Act provides FERC with the authority to regulate wholesale market operators’ compensation of demand response bids and affirming the validity of the methodology used by FERC to provide compensation.169 Chapter 7 of this Plan provides details and additional discussion regarding demand response resources.
167 See Midcontinent Independent System Operator, Inc., 158 FERC ¶ 61,119 (2017).
168 See Midcontinent Independent System Operator, Inc., 166 FERC ¶ 61,116 (2019).
169 See FERC v. Electric Power Supply Ass’n, 2016 WL 280888, 136 S. Ct. 760 (2016).
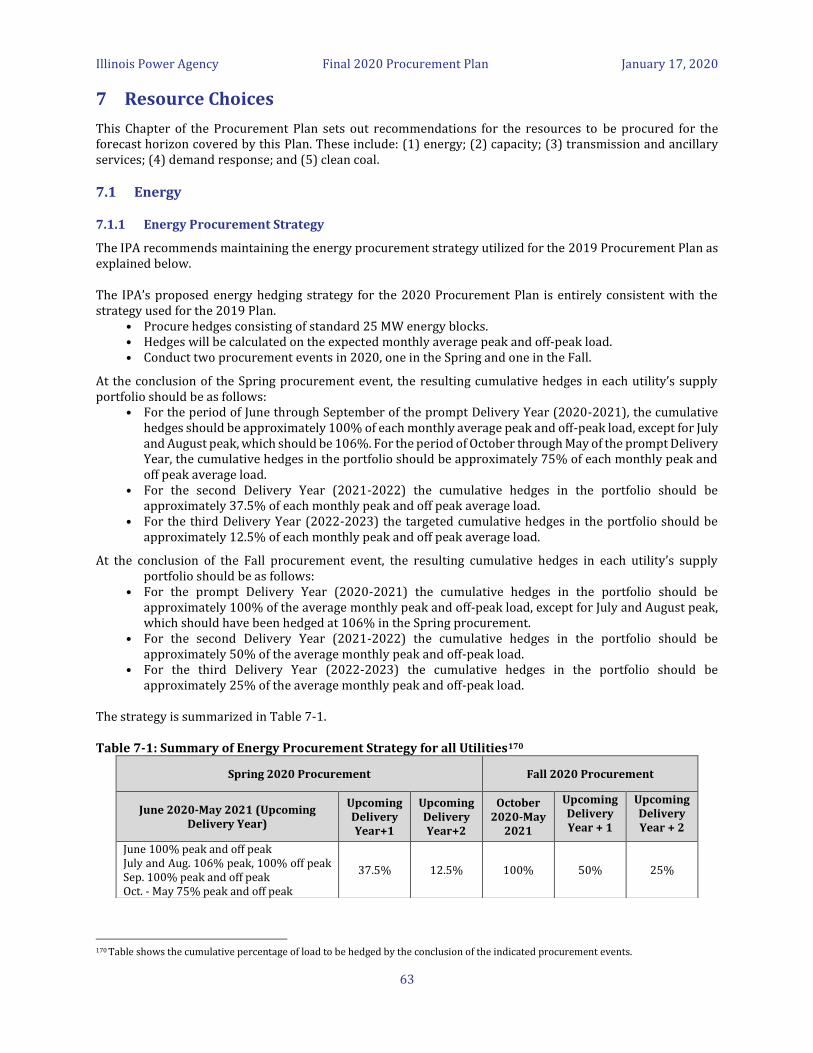
Illinois Power Agency Final 2020 Procurement Plan January 17, 2020
63
7 Resource Choices
This Chapter of the Procurement Plan sets out recommendations for the resources to be procured for the forecast horizon covered by this Plan. These include: (1) energy; (2) capacity; (3) transmission and ancillary services; (4) demand response; and (5) clean coal.
7.1 Energy
7.1.1 Energy Procurement Strategy
The IPA recommends maintaining the energy procurement strategy utilized for the 2019 Procurement Plan as explained below.
The IPA’s proposed energy hedging strategy for the 2020 Procurement Plan is entirely consistent with the strategy used for the 2019 Plan.
• Procure hedges consisting of standard 25 MW energy blocks. • Hedges will be calculated on the expected monthly average peak and off-peak load. • Conduct two procurement events in 2020, one in the Spring and one in the Fall.
At the conclusion of the Spring procurement event, the resulting cumulative hedges in each utility’s supply portfolio should be as follows:
• For the period of June through September of the prompt Delivery Year (2020-2021), the cumulative hedges should be approximately 100% of each monthly average peak and off-peak load, except for July and August peak, which should be 106%. For the period of October through May of the prompt Delivery Year, the cumulative hedges in the portfolio should be approximately 75% of each monthly peak and off peak average load.
• For the second Delivery Year (2021-2022) the cumulative hedges in the portfolio should be approximately 37.5% of each monthly peak and off peak average load.
• For the third Delivery Year (2022-2023) the targeted cumulative hedges in the portfolio should be approximately 12.5% of each monthly peak and off peak average load.
At the conclusion of the Fall procurement event, the resulting cumulative hedges in each utility’s supply portfolio should be as follows:
• For the prompt Delivery Year (2020-2021) the cumulative hedges in the portfolio should be approximately 100% of the average monthly peak and off-peak load, except for July and August peak, which should have been hedged at 106% in the Spring procurement.
• For the second Delivery Year (2021-2022) the cumulative hedges in the portfolio should be approximately 50% of the average monthly peak and off-peak load.
• For the third Delivery Year (2022-2023) the cumulative hedges in the portfolio should be approximately 25% of the average monthly peak and off-peak load.
The strategy is summarized in Table 7-1.
Table 7-1: Summary of Energy Procurement Strategy for all Utilities170
170 Table shows the cumulative percentage of load to be hedged by the conclusion of the indicated procurement events.
Spring 2020 Procurement Fall 2020 Procurement
June 2020-May 2021 (Upcoming Delivery Year)
Upcoming Delivery Year+1
Upcoming Delivery Year+2
October 2020-May
2021
Upcoming Delivery Year + 1
Upcoming Delivery Year + 2
June 100% peak and off peak July and Aug. 106% peak, 100% off peak Sep. 100% peak and off peak Oct. - May 75% peak and off peak
37.5% 12.5% 100% 50% 25%

Illinois Power Agency Final 2020 Procurement Plan January 17, 2020
64
7.1.2 Energy Procurement Implementation
The following tables and figures were constructed using each utility’s July 2019 base load forecasts to provide indicative procurement values for the 2020-2021 Delivery Year. 171 The actual target procurement volumes used for the Spring and Fall 2020 procurements will be calculated using the March 2020 and the July 2020 updated load forecasts respectively. The IPA recommends that each utility submit forecast updates that reflect the most accurate and up-to-date information and modeling available at the time. In updating the load forecasts, the utilities may incorporate refinements to their forecasts including but not limited to changes to variables' values (such as switching) and reasonable enhancements to econometric models, provided that any such refinements are properly disclosed and subject to the review and consensus of the IPA, ICC Staff, the Procurement Monitor, and the applicable utility.
While the utilities provided five years of load forecasts, given the absence of visible and liquid block energy markets four and five years out, it is not recommended that any block energy purchases be made to secure supply for those years (Delivery Years 2023-2024 and 2024-2025) in this Procurement Plan. Therefore, the tables and figures that follow only cover Delivery Years 2020-2021, 2021-2022, and 2022-2023.
Figure 7-1: Ameren Illinois Off-Peak Energy Supply Portfolio and Load
171 The anticipated procurement volumes are rounded up or down to the nearest 25 MW block. For additional information on expected load and supply already under contract, see Appendices E (Ameren Illinois), F (ComEd), and G (MidAmerican).
0
200
400
600
800
1,000
1,200
MW
LT RPS PPAs 2018 Procurements
2019 Procurements Indicative Spring 2020 Procurement
Indicative Fall 2020 Procurement Expected Load
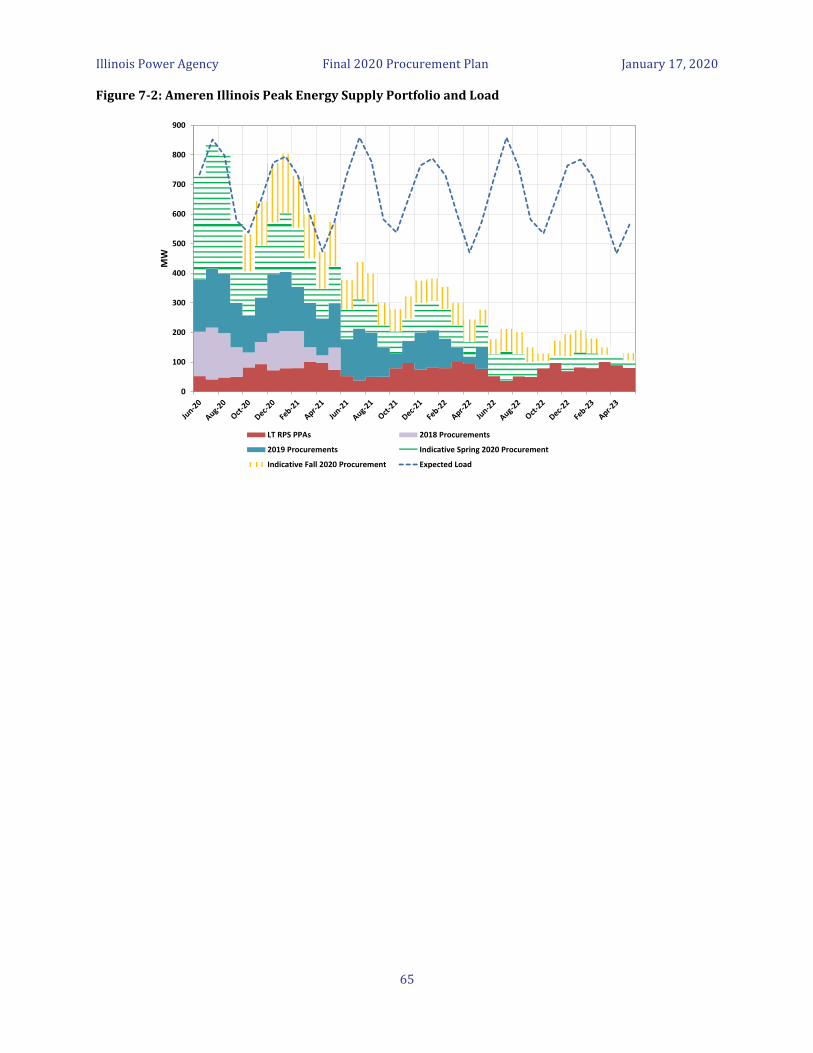
Illinois Power Agency Final 2020 Procurement Plan January 17, 2020
65
Figure 7-2: Ameren Illinois Peak Energy Supply Portfolio and Load
0
100
200
300
400
500
600
700
800
900
MW
LT RPS PPAs 2018 Procurements
2019 Procurements Indicative Spring 2020 Procurement
Indicative Fall 2020 Procurement Expected Load
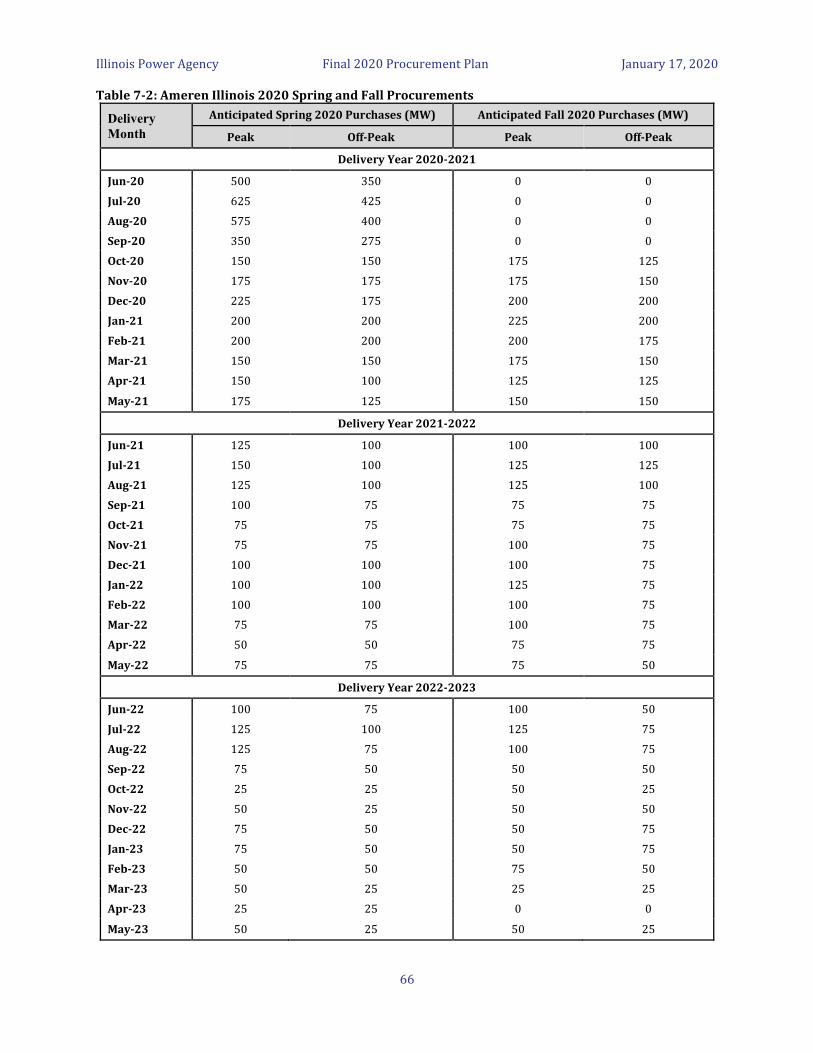
Illinois Power Agency Final 2020 Procurement Plan January 17, 2020
66
Table 7-2: Ameren Illinois 2020 Spring and Fall Procurements
Delivery
Month
Anticipated Spring 2020 Purchases (MW) Anticipated Fall 2020 Purchases (MW)
Peak Off-Peak Peak Off-Peak
Delivery Year 2020-2021
Jun-20 500 350 0 0
Jul-20 625 425 0 0
Aug-20 575 400 0 0
Sep-20 350 275 0 0
Oct-20 150 150 175 125
Nov-20 175 175 175 150
Dec-20 225 175 200 200
Jan-21 200 200 225 200
Feb-21 200 200 200 175
Mar-21 150 150 175 150
Apr-21 150 100 125 125
May-21 175 125 150 150
Delivery Year 2021-2022
Jun-21 125 100 100 100
Jul-21 150 100 125 125
Aug-21 125 100 125 100
Sep-21 100 75 75 75
Oct-21 75 75 75 75
Nov-21 75 75 100 75
Dec-21 100 100 100 75
Jan-22 100 100 125 75
Feb-22 100 100 100 75
Mar-22 75 75 100 75
Apr-22 50 50 75 75
May-22 75 75 75 50
Delivery Year 2022-2023
Jun-22 100 75 100 50
Jul-22 125 100 125 75
Aug-22 125 75 100 75
Sep-22 75 50 50 50
Oct-22 25 25 50 25
Nov-22 50 25 50 50
Dec-22 75 50 50 75
Jan-23 75 50 50 75
Feb-23 50 50 75 50
Mar-23 50 25 25 25
Apr-23 25 25 0 0
May-23 50 25 50 25
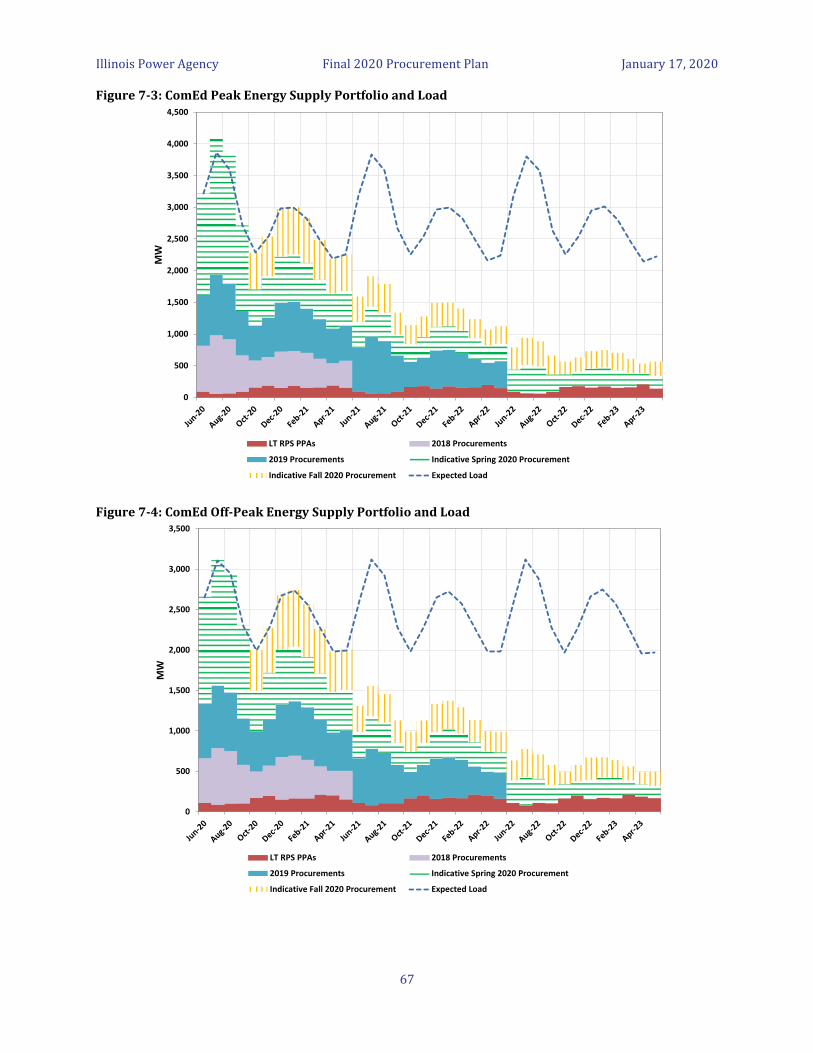
Illinois Power Agency Final 2020 Procurement Plan January 17, 2020
67
Figure 7-3: ComEd Peak Energy Supply Portfolio and Load
Figure 7-4: ComEd Off-Peak Energy Supply Portfolio and Load
0
500
1,000
1,500
2,000
2,500
3,000
3,500
4,000
4,500
MW
LT RPS PPAs 2018 Procurements
2019 Procurements Indicative Spring 2020 Procurement
Indicative Fall 2020 Procurement Expected Load
0
500
1,000
1,500
2,000
2,500
3,000
3,500
MW
LT RPS PPAs 2018 Procurements
2019 Procurements Indicative Spring 2020 Procurement
Indicative Fall 2020 Procurement Expected Load
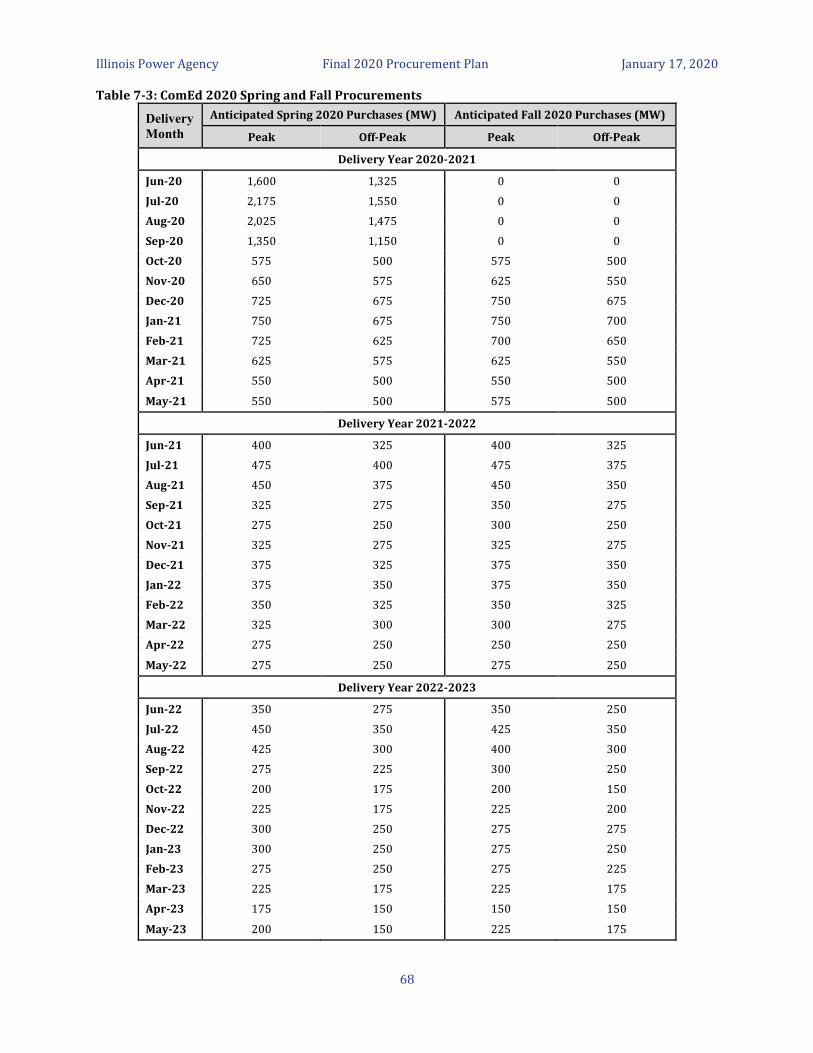
Illinois Power Agency Final 2020 Procurement Plan January 17, 2020
68
Table 7-3: ComEd 2020 Spring and Fall Procurements
Delivery
Month
Anticipated Spring 2020 Purchases (MW) Anticipated Fall 2020 Purchases (MW)
Peak Off-Peak Peak Off-Peak
Delivery Year 2020-2021
Jun-20 1,600 1,325 0 0
Jul-20 2,175 1,550 0 0
Aug-20 2,025 1,475 0 0
Sep-20 1,350 1,150 0 0
Oct-20 575 500 575 500
Nov-20 650 575 625 550
Dec-20 725 675 750 675
Jan-21 750 675 750 700
Feb-21 725 625 700 650
Mar-21 625 575 625 550
Apr-21 550 500 550 500
May-21 550 500 575 500
Delivery Year 2021-2022
Jun-21 400 325 400 325
Jul-21 475 400 475 375
Aug-21 450 375 450 350
Sep-21 325 275 350 275
Oct-21 275 250 300 250
Nov-21 325 275 325 275
Dec-21 375 325 375 350
Jan-22 375 350 375 350
Feb-22 350 325 350 325
Mar-22 325 300 300 275
Apr-22 275 250 250 250
May-22 275 250 275 250
Delivery Year 2022-2023
Jun-22 350 275 350 250
Jul-22 450 350 425 350
Aug-22 425 300 400 300
Sep-22 275 225 300 250
Oct-22 200 175 200 150
Nov-22 225 175 225 200
Dec-22 300 250 275 275
Jan-23 300 250 275 250
Feb-23 275 250 275 225
Mar-23 225 175 225 175
Apr-23 175 150 150 150
May-23 200 150 225 175

Illinois Power Agency Final 2020 Procurement Plan January 17, 2020
69
Figure 7-5: MidAmerican Peak Energy Supply Portfolio and Load172
Figure 7-6: MidAmerican Off-Peak Energy Supply Portfolio and Load
172 While it may appear that the volume of hedges to be procured for MidAmerican is relatively small, it is important to recognize that the incremental cost of acquiring these hedges is also relatively small and that the hedges cover a period of significant price volatility in the electric power markets - peak summer.
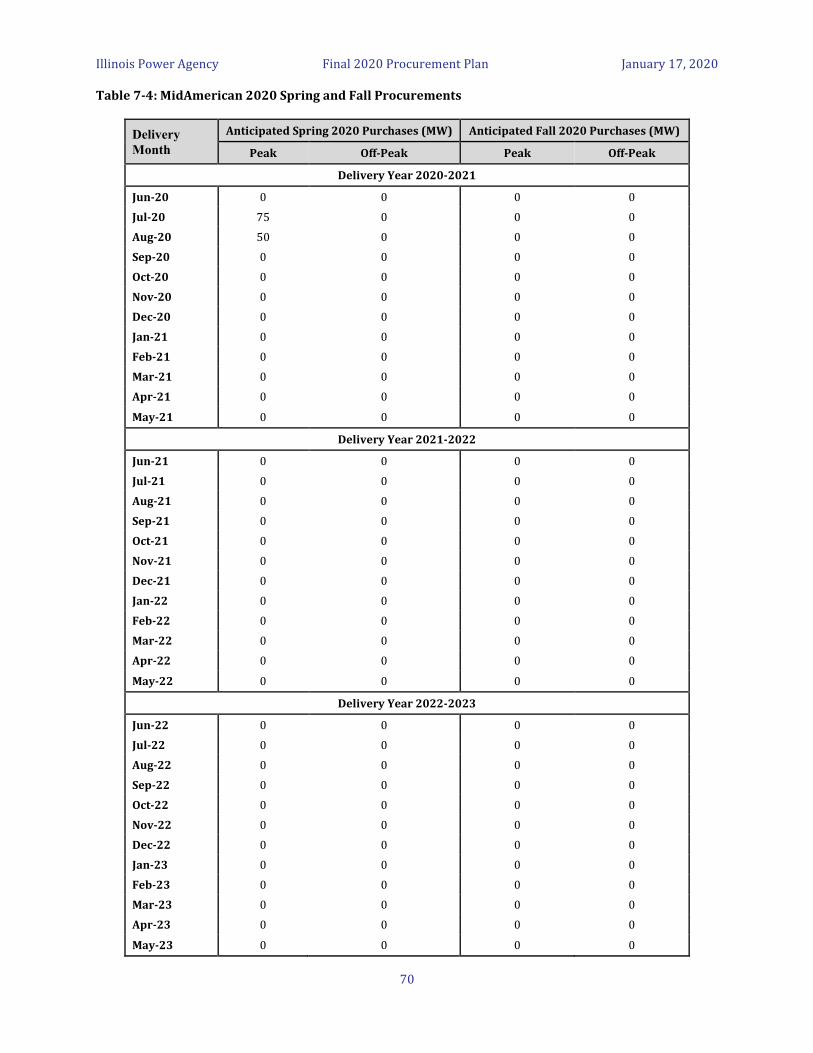
Illinois Power Agency Final 2020 Procurement Plan January 17, 2020
70
Table 7-4: MidAmerican 2020 Spring and Fall Procurements
Delivery
Month
Anticipated Spring 2020 Purchases (MW) Anticipated Fall 2020 Purchases (MW)
Peak Off-Peak Peak Off-Peak
Delivery Year 2020-2021
Jun-20 0 0 0 0
Jul-20 75 0 0 0
Aug-20 50 0 0 0
Sep-20 0 0 0 0
Oct-20 0 0 0 0
Nov-20 0 0 0 0
Dec-20 0 0 0 0
Jan-21 0 0 0 0
Feb-21 0 0 0 0
Mar-21 0 0 0 0
Apr-21 0 0 0 0
May-21 0 0 0 0
Delivery Year 2021-2022
Jun-21 0 0 0 0
Jul-21 0 0 0 0
Aug-21 0 0 0 0
Sep-21 0 0 0 0
Oct-21 0 0 0 0
Nov-21 0 0 0 0
Dec-21 0 0 0 0
Jan-22 0 0 0 0
Feb-22 0 0 0 0
Mar-22 0 0 0 0
Apr-22 0 0 0 0
May-22 0 0 0 0
Delivery Year 2022-2023
Jun-22 0 0 0 0
Jul-22 0 0 0 0
Aug-22 0 0 0 0
Sep-22 0 0 0 0
Oct-22 0 0 0 0
Nov-22 0 0 0 0
Dec-22 0 0 0 0
Jan-23 0 0 0 0
Feb-23 0 0 0 0
Mar-23 0 0 0 0
Apr-23 0 0 0 0
May-23 0 0 0 0
Illinois Power Agency Final 2020 Procurement Plan January 17, 2020
71
7.2 Capacity
7.2.1 Capacity Procurement Strategy
7.2.1.1 ComEd
Prior procurement plans, including the 2019 Procurement Plan, have recommended that ComEd obtain its capacity needs through the PJM-administered capacity market. For the 2020 Plan, the IPA recommends that ComEd continue to obtain its capacity needs from the PJM-administered capacity market. Table 7-7 summarizes the proposed capacity procurement for ComEd.
7.2.1.2 Ameren Illinois
For Ameren Illinois, the 2019 Procurement Plan recommended a procurement of a portion of the Ameren Illinois capacity needs for the 2019-2020, 2020-2021, and 2021-2022 Delivery Years through bilateral capacity purchases obtained through the IPA competitive procurement process, with the remainder of its capacity needs procured through the MISO PRA. The IPA recommends a continuation of this capacity procurement strategy, which is the procurement of 50% of the capacity requirements in the near-term forward markets through IPA administered RFPs in a laddered fashion, and the remaining balance through the MISO PRA.
Specifically, for Ameren Illinois, the IPA proposes the following capacity procurement strategy: • Conduct two procurement events in 2020, one in the Spring and one in the Fall. • For the 2020-2021 Delivery Year, no change to what was approved in the 2019 Procurement Plan. That is,
to procure up to 50%of the forecasted capacity requirements through an RFP administered by the IPA in Fall, 2019, and procure the remaining balance through the MISO PRA scheduled for April of 2020. No additional procurements of capacity for the 2020-2021 Delivery Year will be needed.
• For the 2021-2022 Delivery Year, up to 25% of the forecasted capacity requirements will be procured through an RFP administered by the IPA in Fall, 2019, as outlined in the 2019 Procurement Plan.
• For the 2021-2022 and 2022-2023 Delivery Years, the IPA proposes to procure capacity requirements through its two 2020 capacity procurement events, resulting in hedging at the following levels:
o At the conclusion of the Spring 2020 procurement event, the resulting cumulative capacity hedges in Ameren Illinois portfolio of Zonal Resource Credits (“ZRCs”) should be as follows:
▪ For the 2021-2022 Delivery Year, the cumulative hedges should be no more than 37.5% of the capacity requirements.
▪ For the 2022-2023 Delivery Year, the cumulative hedges should be no more than 12.5% of the capacity requirements.
o At the conclusion of the Fall 2020 procurement event, the resulting cumulative capacity hedges in Ameren Illinois portfolio of Zonal Resource Credits (“ZRCs”) should be as follows:
▪ For the 2021-2022 Delivery Year, the cumulative hedges should be no more than 50% of the capacity requirements.
▪ For the 2022-2023 Delivery Year, the cumulative hedges should be no more than 25% of the capacity requirements.
• Procure the remaining balance of the 2021-2022 Delivery Year capacity requirements through the MISO PRA scheduled for April of 2021. No additional procurements of capacity for the 2020-2021 Delivery Year will be needed.
• Procure the remaining balance of the 2022-2023 Delivery Year capacity requirements in the MISO PRA and/or additional procurement events to be determined in the 2021 Procurement Plan.
While Ameren Illinois provided a five-year capacity requirement forecast, given the absence of visible and liquid capacity markets in MISO, it is not recommended that any capacity hedges be procured for years beyond the 2022-2023 Delivery Year in this Procurement Plan.
7.2.1.3 MidAmerican
The IPA notes that the magnitude of the proposed capacity procurements for MidAmerican is small relative to its capacity requirements, as shown in Table 7-5 which presents MidAmerican’s load and capability. The IPA,

Illinois Power Agency Final 2020 Procurement Plan January 17, 2020
72
consistent with the discussion regarding the procurement strategy for ComEd, recommends that MidAmerican procure 100% of its forecasted capacity deficit through its RTO’s capacity market, the MISO PRA.
Table 7-5: Summary of MidAmerican Load and Capability
2020-2021 2021-2022 2022-2023 2023-2024 2024-2025
Coincident Peak Load 429 429 431 431 432
Reserves 34 34 34 34 34
Coincident Peak Load with Reserves 463 463 465 465 466
Total Net Capability 395 395 395 395 395
Deficit to Be Procured in MISO PRA 67 68 69 70 70
7.2.2 Capacity Procurement Implementation
7.2.2.1 Ameren Illinois
For Ameren Illinois, the IPA concludes that it does not need to include any extraordinary measures in the 2020 Procurement Plan to assure reliability over the planning horizon. For the 2020-2021 Delivery Year, the IPA recommends no changes from the previously approved strategy. For the 2021-2022 and 2022-2023 Delivery Years, the IPA recommends a continuation of the strategy of procuring Ameren Illinois capacity requirements through IPA-administered RFPs and through the MISO PRA, as shown below in Table 7-6.
The figures in this Table were constructed using Ameren Illinois July 2019 base load forecasts to provide indicative procurement values for the 2021-2022 and 2022-2023 Delivery Years. The target Zonal Resource Credits (“ZRCs”) procurement volumes to be used for the Spring and Fall 2020 procurements will be calculated using the March 2020 and the July 2020 updated load forecasts respectively. For the 2022-2023 Delivery Year, any additional procurements to be conducted in 2021 will be determined in the 2021 Procurement Plan. Consistent with the recommendation in Section 7.1.2, the IPA recommends that Ameren Illinois submit forecast updates inclusive of capacity requirements that reflect the most accurate and up-to-date information and modeling available at the time.
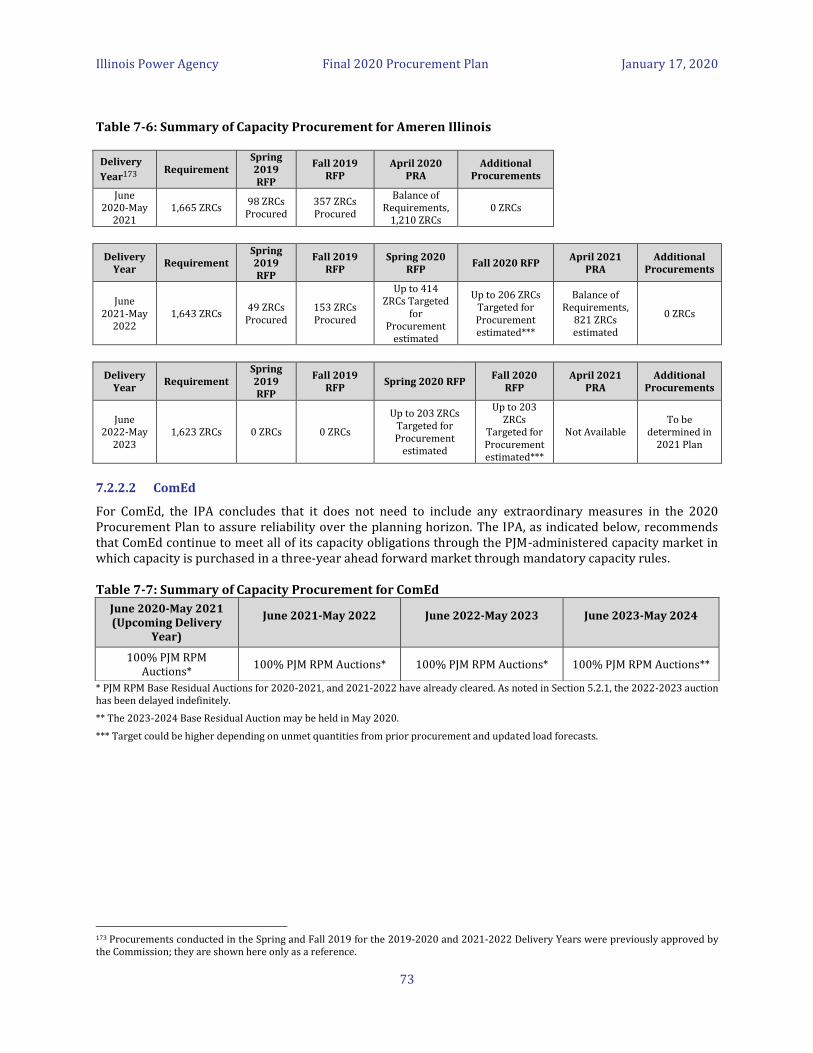
Illinois Power Agency Final 2020 Procurement Plan January 17, 2020
73
Table 7-6: Summary of Capacity Procurement for Ameren Illinois
Delivery
Year173 Requirement
Spring 2019 RFP
Fall 2019 RFP
April 2020 PRA
Additional Procurements
June
2020-May 2021
1,665 ZRCs 98 ZRCs
Procured 357 ZRCs Procured
Balance of Requirements,
1,210 ZRCs 0 ZRCs
Delivery Year
Requirement Spring 2019 RFP
Fall 2019 RFP
Spring 2020 RFP
Fall 2020 RFP April 2021
PRA Additional
Procurements
June 2021-May
2022 1,643 ZRCs
49 ZRCs Procured
153 ZRCs Procured
Up to 414 ZRCs Targeted
for Procurement
estimated
Up to 206 ZRCs Targeted for Procurement estimated***
Balance of Requirements,
821 ZRCs estimated
0 ZRCs
Delivery Year
Requirement Spring 2019 RFP
Fall 2019 RFP
Spring 2020 RFP Fall 2020
RFP April 2021
PRA Additional
Procurements
June 2022-May
2023 1,623 ZRCs 0 ZRCs 0 ZRCs
Up to 203 ZRCs Targeted for Procurement
estimated
Up to 203 ZRCs
Targeted for Procurement estimated***
Not Available To be
determined in 2021 Plan
7.2.2.2 ComEd
For ComEd, the IPA concludes that it does not need to include any extraordinary measures in the 2020 Procurement Plan to assure reliability over the planning horizon. The IPA, as indicated below, recommends that ComEd continue to meet all of its capacity obligations through the PJM-administered capacity market in which capacity is purchased in a three-year ahead forward market through mandatory capacity rules.
Table 7-7: Summary of Capacity Procurement for ComEd
* PJM RPM Base Residual Auctions for 2020-2021, and 2021-2022 have already cleared. As noted in Section 5.2.1, the 2022-2023 auction has been delayed indefinitely.
** The 2023-2024 Base Residual Auction may be held in May 2020.
*** Target could be higher depending on unmet quantities from prior procurement and updated load forecasts.
173 Procurements conducted in the Spring and Fall 2019 for the 2019-2020 and 2021-2022 Delivery Years were previously approved by the Commission; they are shown here only as a reference.
June 2020-May 2021 (Upcoming Delivery
Year)
June 2021-May 2022
June 2022-May 2023
June 2023-May 2024
100% PJM RPM Auctions*
100% PJM RPM Auctions* 100% PJM RPM Auctions* 100% PJM RPM Auctions**
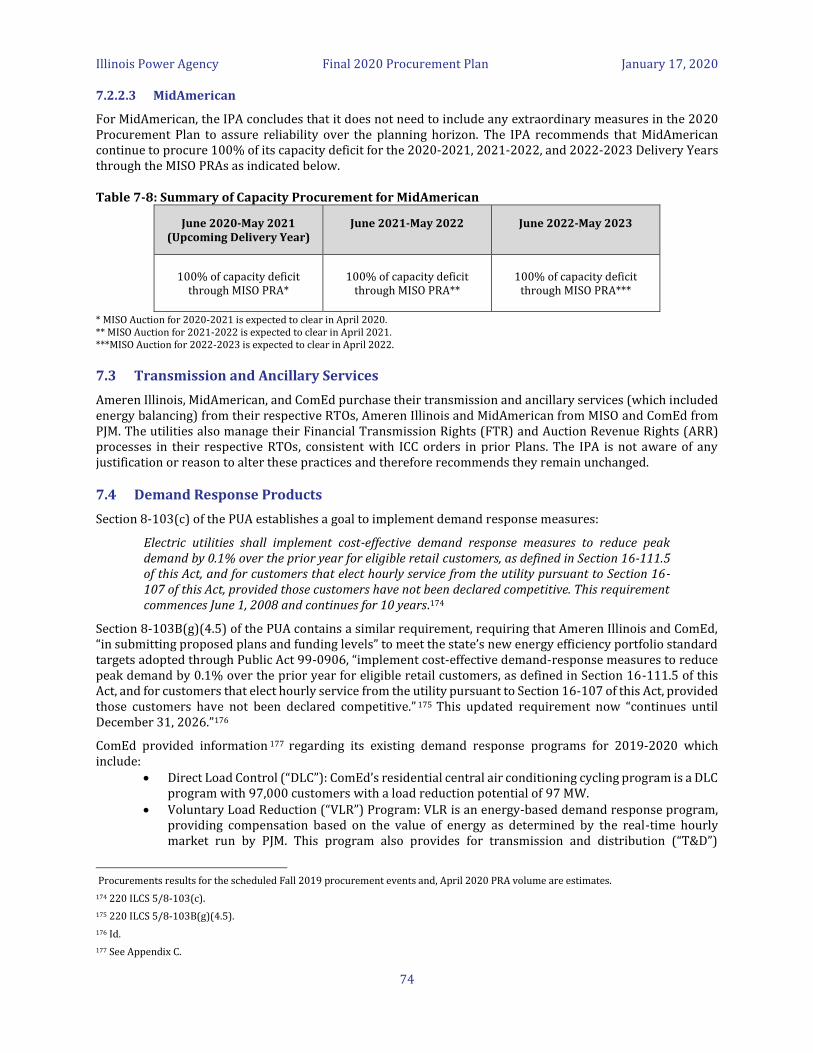
Illinois Power Agency Final 2020 Procurement Plan January 17, 2020
74
7.2.2.3 MidAmerican
For MidAmerican, the IPA concludes that it does not need to include any extraordinary measures in the 2020 Procurement Plan to assure reliability over the planning horizon. The IPA recommends that MidAmerican continue to procure 100% of its capacity deficit for the 2020-2021, 2021-2022, and 2022-2023 Delivery Years through the MISO PRAs as indicated below.
Table 7-8: Summary of Capacity Procurement for MidAmerican
* MISO Auction for 2020-2021 is expected to clear in April 2020. ** MISO Auction for 2021-2022 is expected to clear in April 2021. ***MISO Auction for 2022-2023 is expected to clear in April 2022.
7.3 Transmission and Ancillary Services
Ameren Illinois, MidAmerican, and ComEd purchase their transmission and ancillary services (which included energy balancing) from their respective RTOs, Ameren Illinois and MidAmerican from MISO and ComEd from PJM. The utilities also manage their Financial Transmission Rights (FTR) and Auction Revenue Rights (ARR) processes in their respective RTOs, consistent with ICC orders in prior Plans. The IPA is not aware of any justification or reason to alter these practices and therefore recommends they remain unchanged.
7.4 Demand Response Products
Section 8-103(c) of the PUA establishes a goal to implement demand response measures:
Electric utilities shall implement cost-effective demand response measures to reduce peak demand by 0.1% over the prior year for eligible retail customers, as defined in Section 16-111.5 of this Act, and for customers that elect hourly service from the utility pursuant to Section 16-107 of this Act, provided those customers have not been declared competitive. This requirement commences June 1, 2008 and continues for 10 years.174
Section 8-103B(g)(4.5) of the PUA contains a similar requirement, requiring that Ameren Illinois and ComEd, “in submitting proposed plans and funding levels” to meet the state’s new energy efficiency portfolio standard targets adopted through Public Act 99-0906, “implement cost-effective demand-response measures to reduce peak demand by 0.1% over the prior year for eligible retail customers, as defined in Section 16-111.5 of this Act, and for customers that elect hourly service from the utility pursuant to Section 16-107 of this Act, provided those customers have not been declared competitive.” 175 This updated requirement now “continues until December 31, 2026.”176
ComEd provided information 177 regarding its existing demand response programs for 2019-2020 which include:
• Direct Load Control (“DLC”): ComEd’s residential central air conditioning cycling program is a DLC program with 97,000 customers with a load reduction potential of 97 MW.
• Voluntary Load Reduction (“VLR”) Program: VLR is an energy-based demand response program, providing compensation based on the value of energy as determined by the real-time hourly market run by PJM. This program also provides for transmission and distribution (“T&D”)
Procurements results for the scheduled Fall 2019 procurement events and, April 2020 PRA volume are estimates.
174 220 ILCS 5/8-103(c).
175 220 ILCS 5/8-103B(g)(4.5).
176 Id.
177 See Appendix C.
June 2020-May 2021 (Upcoming Delivery Year)
June 2021-May 2022
June 2022-May 2023
100% of capacity deficit through MISO PRA*
100% of capacity deficit
through MISO PRA**
100% of capacity deficit through MISO PRA***
Illinois Power Agency Final 2020 Procurement Plan January 17, 2020
75
compensation based on the local conditions of the T&D network. This portion of the portfolio has 968 MW of potential load reduction.
• Residential Real-Time Pricing (RRTP) Program: All of ComEd’s residential customers have an option to elect an hourly, wholesale market-based rate. The program uses ComEd’s Rate BESH to determine the monthly electricity bills for each RRTP participant. This program has 29,264 customers and a load reduction potential of 13 MW.
• Peak Time Savings (PTS) Program: This program is required by Section 16-108.6(g) of the PUA and was approved by the ICC in Docket No. 12-0484. The PTS program is an opt-in, market-based demand response program for customers with smart meters. Under the program, customers receive bill credits for kWh usage reduction during curtailment periods. The program commenced in 2015 with 56,000 customers and has grown to more than 291,000 customers in 2019. ComEd sold 85 MW of capacity from the program into the PJM capacity auction for the 2019-2020 Delivery Year, 56 MW in the 2020-2021 Delivery Year, and 80 MW in the 2021-2022 Delivery Year.
Ameren Illinois has implemented a Voltage Optimization Program (including, for example, Conservation Voltage Reduction (“CVR”) Program). Ameren Illinois also offers a Real Time Pricing (“RTP”) option and the additional associated Power Smart Pricing (“PSP”) program for smaller customers. Pursuant to the Commission’s Interim Order in Docket No. 13-0105, Ameren Illinois offers a Peak Time Rewards program (Rider PTR). According to Ameren Illinois, the program currently has approximately 101,000 customers and Ameren Illinois sold 13.8 MW of related capacity in the MISO PRA for the 2019-2020 Delivery Year, which provides the pool of funds used for customer rebates. This tariff pertains to an optional program available to DS-1 customers as of June 1, 2016, whereby a customer would receive a billing credit if they curtail electric energy use during specific peak usage periods.
MidAmerican administers a program called “SummerSaver Program,” a residential Direct Load Control (DLC) program. At the time of gross system peak, the SummerSaver program was not in effect. In addition, there is a potential for load displacement due to curtailment of customers on an interruptible rate. There was no curtailment event in effect at the time of gross system peak.
The IPA does not propose any procurement of demand response programs from eligible retail customers in the 2020-2021 Delivery Year. Under current market and regulatory conditions, the IPA believes that a new demand response procurement by the IPA could not meet the standards set forth in Section 16-111.5(b)(3) of the Public Utilities Act. Reasons for this include, for example, the statutory requirement that demand response under this provision must come from “eligible retail customers,” and as the IPA is not aware of any simple, straightforward way of definitively determining whether a non-competitive class customers take supply from the utility or an alternative retail electric supplier for purposes of any demand response aggregation, there may simply be no feasible way to ensure that only eligible retail customers participate. This challenge significantly reduces the likelihood that any demand response procurement would be “cost-effective.” Further, there could be challenges in “satisfy[ing] the demand-response requirements of the regional transmission organization market in which the utility’s service territory is located,” and “provid[ing] for customers’ participation in the stream of benefits produced by the demand-response products.” Fortunately for customers (including both eligible retail customers and those who have switched suppliers or take hourly priced service), the Peak Time Rewards (or Savings) programs as offered by Ameren Illinois and ComEd create value through reduction in capacity charges and the technologies utilized for capacity reductions also have the potential to provide longer term demand response capability that could operate over more peak hours than those used for calculations of capacity obligations.
Going forward, the IPA will continue to assess the demand response market and continue its involvement in stakeholder discussions regarding Illinois state policy on demand response. As the market changes and legal and regulatory barriers are addressed, the Agency may choose to propose a demand response procurement in a future procurement plan.
Illinois Power Agency Final 2020 Procurement Plan January 17, 2020
76
7.5 Clean Coal
The IPA Act contains an aspirational goal that cost-effective clean coal resources will account for 25% of the electricity used in Illinois by January 1, 2025.178 As a part of the goal, the Plan must also include electricity generated from clean coal facilities.179 While there is a broader definition of “clean coal facility” contained in the definition section of the IPA Act180, Section 1-75(d) describes two special cases: the “initial clean coal facility”181 and “electricity generated by power plants that were previously owned by Illinois utilities and that have been or will be converted into clean coal facilities”182 (“retrofit clean coal facility”). Each of these special cases includes specific processes through which sourcing agreements for the power from the facilities would be entered into by both utilities and ARES. Currently, the IPA is unaware of any facility meeting the definition of either an “initial clean coal facility” or a “retrofit clean coal facility” that has announced plans to begin operations within the next five years.
In comments on the Draft 2019 Plan, the Agency received a proposal by two commenters seeking for the Plan to include a competitive procurement for sourcing agreements from a “clean coal facility”183 (i.e., a facility that meets the definition of a “clean coal facility” under Section 1-10 of the IPA Act, but not the definition of “initial clean coal facility” or a “retrofit clean coal facility”). As the Agency understands it, these commenters were seeking a procurement to support the development of a small “clean coal” plant in Mattoon at the location of the original FutureGen project.
As a threshold matter, it is unclear what authority was granted to the Agency to procure sourcing agreements from a “clean coal facility” that does not meet either of the above-referenced special definitions. A similar proposal to procure sourcing agreements from a “clean coal facility” not meeting these special definitions through a competitive procurement process was made in connection with the IPA’s 2015 Plan; after reviewing the arguments of all parties, the Commission articulated serious concerns with whether such a procurement was consistent with the IPA Act, concluding that it was “not convinced” that a proposal of this type “was contemplated by the Illinois General Assembly or is in the public interest.”184 Given the scant guidance and authority offered by the IPA Act for such a procurement process, that conclusion appears well-justified.
Other statutory and budgeting barriers also apply to the procurement of sourcing agreements from a “clean coal facility” that do not apply to the special cases mentioned above. Given the absence of any mechanism in the IPA Act to require ARES to purchase or pay for the output of such a facility, the facility’s additional costs would only be borne by eligible retail customers. At present, eligible retail customer load is less than 25% of the total retail customer load in Illinois (and could vary significantly in future years with customer switching), thus leading to limited (and volatile) funding under the rate impact cap contained in Section 1-75(d)(2). Given cost estimates typically presented for proposed “clean coal” plants, it appears highly unlikely that a clean coal facility could be developed within statutory funding limitations.
The IPA is concerned that should it propose a “competitive” procurement event for clean coal facilities, all reasonable market information indicates that there would be very few viable bidders. As the competitive procurement model relies on robust participation that captures the value created by competition, such a process may fail to yield least-cost results.
For these reasons, the Agency continues to not propose a dedicated clean coal procurement in this Plan. To be clear, nothing in this analysis is intended to prohibit any “clean coal” facility from participating in the IPA’s proposed block energy or capacity procurements described elsewhere in this Chapter; it is merely concluding that special treatment through a dedicated procurement event for long-term, source-specific “clean coal
178 20 ILCS 3855/1-75(d).
179 20 ILCS 3855/1-75(d)(1).
180 20 ILCS 3855/1-10.
181 Id.
182 20 ILCS 3855/1-75(d)(5).
183 See Comments on the Draft 2019 Procurement Plan from Mattoon Power Enterprises LLC and Coles Together, available at https://www2.illinois.gov/sites/ipa/Documents/2019ProcurementPlan/MPE%20procurement%20comment.pdf and https://www2.illinois.gov/sites/ipa/Documents/2019ProcurementPlan/Coles%20Together%20Comments%20to%20IPA%20on%202019%20Draft%20Procurement%20Plan.pdf.
184 Docket No. 14-0588, Final Order dated December 17. 2014 at 315.

Illinois Power Agency Final 2020 Procurement Plan January 17, 2020
77
facility” sourcing agreements is not presently warranted by Section 1-75(d) of the Act. The IPA understands that advocates for the facility being considered in the above analysis (who offered comments in response to the 2019 Plan) are now seeking legislative changes through House Bill 81 in the 101st General Assembly.
Illinois Power Agency Final 2020 Procurement Plan January 17, 2020
78
8 Procurement Process Design
The procedural requirements for the procurement process are detailed in the Illinois Public Utilities Act at Section 16-111.5. 185 The Procurement Administrator, retained by the IPA in accordance with Section 1-75(a)(2) of the IPA Act, conducts the competitive procurement events on behalf of the IPA. The costs of the Procurement Administrator incurred by the IPA are recovered from the bidders and suppliers that participate in the competitive solicitations, through both IPA-assessed Bid Participation Fees and Supplier Fees. The “eligible retail customers” for each of the participating utilities ultimately incur these costs as it is assumed that suppliers’ bid prices reflect a recovery of these fees. As required by the PUA and in order to operate in the best interests of consumers, the IPA and the Procurement Administrator review the procurement process each year in order to identify potential improvements.
Consistent with changes to the IPA’s procurement process resulting from Public Act 99-0906, the IPA no longer includes the procurement of renewable energy resources as part of the annual procurement plan. The procurement of RECs is instead covered by the Long-Term Renewable Resources Procurement Plan.186 The IPA’s procurement process going forward will continue to procure standard wholesale products for the utilities’ eligible retail customers through the annual procurement plans.
Section 16-111.5(e) of the Public Utilities Act specifies that the procurement process must include the following components:
(1) Solicitation, pre-qualification, and registration of bidders. The procurement administrator shall disseminate information to potential bidders to promote a procurement event, notify potential bidders that the procurement administrator may enter into a post-bid price negotiation with bidders that meet the applicable benchmarks187, provide supply requirements, and otherwise explain the competitive procurement process. In addition to such other publication as the procurement administrator determines is appropriate, this information shall be posted on the Illinois Power Agency’s and the Commission’s websites. The procurement administrator shall also administer the prequalification process, including evaluation of credit worthiness, compliance with procurement rules, and agreement to the standard form contract developed pursuant to paragraph (2) of this subsection (e). The procurement administrator shall then identify and register bidders to participate in the procurement event.
(2) Standard contract forms and credit terms and instruments. The procurement administrator, in consultation with the utilities, the Commission, and other interested parties and subject to Commission oversight, shall develop and provide standard contract forms for the supplier contracts that meet generally accepted industry practices. Standard credit terms and instruments that meet generally accepted industry practices shall be similarly developed. The procurement administrator shall make available to the Commission all written comments it receives on the contract forms, credit terms, or instruments. If the procurement administrator cannot reach agreement with the applicable electric utility as to the contract terms and conditions, the procurement administrator must notify the Commission of any disputed terms and the Commission shall resolve the dispute. The terms of the contracts shall not be subject to negotiation by winning bidders, and the bidders must agree to the terms of the contract in advance so that winning bids are selected solely on the basis of price.
(3) Establishment of a market-based price benchmark.
185 See generally 220 ILCS 5/16-111.5.
186 The IPA’s Long-Term Renewable Resources Procurement Plan was approved by the Commission on April 3, 2018 through Docket No. 17-0838; a draft Revised Long-Term Renewable Resources Procurement Plan was released for public comment on August 15, 2019.
187 The IPA Act requires the procurement administrator to notify bidders that the procurement administrator may, in its discretion, enter into post-bid price negotiations with bidders. In order to encourage best and final bids from the bidders and taking into consideration the mandated use of confidential benchmarks, the procurement administrators in previous procurements have decided not to engage in post-bid negotiations.
Illinois Power Agency Final 2020 Procurement Plan January 17, 2020
79
As part of the development of the procurement process, the procurement administrator, in consultation with the Commission staff, Agency staff, and the procurement monitor, shall establish benchmarks for evaluating the final prices in the contracts for each of the products that will be procured through the procurement process. The benchmarks shall be based on price data for similar products for the same delivery period and same delivery hub, or other delivery hubs after adjusting for that difference. The price benchmarks may also be adjusted to take into account differences between the information reflected in the underlying data sources and the specific products and procurement process being used to procure power for the Illinois utilities. The benchmarks shall be confidential but shall be provided to, and will be subject to Commission review and approval, prior to a procurement event.
(4) Request for proposals competitive procurement process. The procurement administrator shall design and issue a request for proposals to supply electricity in accordance with each utility’s procurement plan, as approved by the Commission. The request for proposals shall set forth a procedure for sealed, binding commitment bidding with pay-as-bid settlement, and provision for selection of bids on the basis of price.
(5) A plan for implementing contingencies [i]n the event of supplier default or failure of the procurement process to fully meet the expected load requirements due to insufficient supplier participation, commission rejection of results, or any other cause.
8.1 Contract Forms
The IPA believes that the standard wholesale product contract forms used in its procurements have now become largely standardized and should remain acceptable to future potential bidders. As was the case with the 2014, 2015, 2016, 2017, 2018, and 2019 procurement events, the process to receive comments from potential bidders can be restricted to changes to the forms, thus reducing Procurement Administrator time and billable hours, while shortening the critical path time needed to conduct a procurement event. This is because, prior to the 2014 procurement events, the forms, terms and instruments had become relatively stable, with fewer comments being received from potential bidders requesting revision or optional terms for each succeeding procurement event. Any procurement event to be conducted under the auspices of the 2020 Procurement Plan would be the fourteenth iteration of IPA-run procurement events, when including the Spring 2019 procurement events188 and the planned Fall 2019 procurement events for the procurement of capacity for Ameren Illinois and the procurement of standard energy products for ComEd and Ameren. In each iteration prior to 2014, potential bidders had an opportunity to comment on documents and those comments have been, where appropriate, incorporated into the documents or provided as acceptable alternative language. In the 2014, 2015, 2016, 2017, 2018, and 2019 procurement events, potential bidders submitted only limited comments on the proposed changes to the forms.
In the procurement events conducted for energy blocks since 2012, comments have been few, with virtually no new modifications being accepted or made (in part because some comments made by new participants have been handled in prior procurement events). The documents used for the 2012 IPA-run procurement events illustrate both the breadth and depth of bidder input to the current state of the documents and the maturity of the documents themselves. The contract documents utilized for the MidAmerican energy blocks procurement events were, and continue to be, similar to the Ameren Illinois contract documents.
On the opposite side of this discussion, the IPA also understands that markets are dynamic and periodic review of contract terms is necessary to ensure proper protection for the utilities, utility customers and suppliers. The IPA therefore recommends that the last used forms, namely the energy contracts used in the 2019 procurement events, be the starting point for the contracts used in the energy procurements associated with this Plan. The
188 The Spring 2019 procurement events included the April 22nd procurement of standard energy blocks and the April 26th procurement of MISO Zonal Resource Credits for Ameren Illinois.
Illinois Power Agency Final 2020 Procurement Plan January 17, 2020
80
IPA also recommends that the IPA, Commission Staff, Procurement Administrator, Procurement Monitor, and utilities undertake a joint review of such contracts in order to identify what terms, if any, need to be modified.
8.2 IPA Recovery of Procurement Expenses
Section 1-75(h) of the IPA Act states that “[t]he Agency shall assess fees to each bidder to recover the costs incurred in connection with a competitive procurement process.” 189 Additionally, in April 2014, the IPA adopted administrative rules related to fee assessments that codify past practices including defining “bidders” and “suppliers” in procurement events as well as the process for determining those fees.190
The IPA historically recovered the cost of procurement events through two types of fees: • A “Bid Participation Fee”, which is a flat fee paid by all bidders as a condition of qualification; and
• “Supplier Fees”, which are paid only by the winning bidders as a fee per block won at the conclusion of the procurement event.
For the last several procurements, the Bid Participation Fee has been nominal ($500), which means that the bulk of the costs of the procurement event (which are typically several hundred thousand dollars) are recovered from winning bidders through Supplier Fees. There are two risks for the IPA from recovering costs in this manner:
1. If not all the blocks are procured (and no additional procurement event is held), the IPA will not recover the full cost of the procurement through the combination of the Bid Participation Fees and the Supplier Fees. The Supplier Fees are collected from the “winning bidders” based on the recommended blocks approved by the Commission; the Supplier Fees associated with the blocks that are not procured are not collected.
2. Suppliers may not necessarily pay the Supplier Fees on time (or pay them at all). Suppliers that have bids that are approved by the Commission proceed to the contract execution process with the utility and will get paid under that contract whether or not they have paid the Supplier Fees. When the structure of fees was first introduced, non-payment of the Supplier Fees was an event of default under the contract with the utility. Suppliers had a very strong incentive to pay the Supplier Fees as failure to do so meant that they would not be able to get the compensated under the contract from winning the bid. As procurement events came to be IPA-run, this structure was abandoned as the responsibility for assessing fees to bidders is the IPA’s and not the utility’s. The incentives for suppliers to pay the Supplier Fees were reduced as a result.
In developing its procurement approach, the IPA has considered a number of approaches for addressing these risks, involving two broad categories of solutions:
a. Maintain the current fee structure and use the pre-bid letter of credit provided by bidders as bid assurance collateral to ensure compliance with the payment obligation of the Supplier Fees.
b. Change the current fee structure to have the cost of the procurement largely paid upfront and bar suppliers that fail to pay all fees due from participation in IPA-run events for a period of time.
Until the 2014 procurement events, the pre-bid letter of credit had been strictly a credit instrument held for the benefit of the utility and its customers. The utility was able to draw upon the pre-bid letter of credit if the supplier failed to complete the contract execution process. At that point, the utility that had filed its rates based on the winning bids would have to buy replacement supply, for which it could use funds under the pre-bid letter of credit to mitigate any impact of the default by a supplier on rates. Starting with the 2014 procurement events, the function of the pre-bid letter of credit was expanded to ensure payment of the Supplier Fees by adding a condition to the utility pre-bid letter of credit allowing the utility to draw on the letter of credit if the Supplier Fees are not paid by a date certain (and having an agreement between the IPA and the utility on how funds would flow back to the IPA for payment of the Supplier Fees). This is the approach that was used in the 2014, 2015, 2016, 2017, 2018, and 2019 procurement events.
The IPA has previously received comments on these possible approaches and how the IPA could ensure that in conducting procurement events it complies with Section 1-75(h) of the IPA Act and Section 1200.220 of Title
189 20 ILCS 3855/1-75(h).
190 83 Ill. Admin. Code. §§ 1200.110, 1200.220.
Illinois Power Agency Final 2020 Procurement Plan January 17, 2020
81
83 of the Illinois Administrative Code. Based on those comments and subsequent review of the alternatives, the IPA recommends that the approach used in the procurement events since 2014 be continued to support the procurement events recommended in this Plan. That approach is for the energy contracts to maintain the condition in the utility pre-bid letter of credit allowing the utility to draw if the Supplier Fees are not paid by a date certain. Likewise, as used in the recent procurement events, there will also be an agreement between the IPA and each utility on how funds would flow back to the IPA for payment of the Supplier Fees under this circumstance.
8.3 Second Procurement Event
The IPA recommends that procurement events continue to be held in the spring and fall of 2020 for the purchase of energy blocks and a portion of the necessary Ameren Illinois capacity products (Zonal Resource Credits) under the 2020 Procurement Plan. The components of the procurement process detailed above would be conducted in the spring events. For the fall procurement events, for energy blocks under the Procurement Plan, certain activities would not occur as the fall procurement event could rely on the documents or processes established for the spring procurement event, as follows:
• The procurement administrator will rely on the contract and credit forms established in the Spring 2020 procurement event, and suppliers would not comment anew on these documents;
• The procurement administrator will rely on the RFP design and updated benchmarks using the benchmark methodology established in the Spring 2020 procurement event; and
• The procurement administrator, in consultation with each utility, IPA, ICC Staff and Procurement Monitor, will not be prohibited from making minor changes to the contract and credit terms or minor changes to the RFP documents, including but not limited to clarifications or corrections.
• Suppliers that participate in the Spring 2020 procurement event will have access to an abbreviated qualification and registration process if they also participate in the Fall 2020 procurement event;
The IPA recommends that the Fall 2020 procurement event includes the procurement of standard energy products for Ameren Illinois, ComEd, and MidAmerican (if needed), as well as Zonal Resource Credits for Ameren Illinois.
8.4 Informal Hearing
Section 16-111.5(o) of the PUA states,
On or before June 1 of each year, the Commission shall hold an informal hearing for the purpose of receiving comments on the prior year’s procurement process and any recommendations for change.
On May 8, 2019, the ICC Staff posted a public notice191 for the informal hearing for the purpose of receiving comments regarding the procurement process for the procurement events that were held during the fall of 2018 and the spring of 2019. The Fall 2018 procurements involved the procurement of standard energy products to meet a portion of the requirements of ComEd’s, Ameren Illinois’, and MidAmerican’s eligible retail customers for October 2018 through May 2021 and MISO Zonal Resource Credits capacity products for Ameren Illinois for the Delivery Year 2019-2020. The Spring 2019 procurement events included the purchase of a portion of the three utilities’ energy requirements to meet eligible retail customers’ needs for the 2019-2020, 2020-2021 and 2021-2022 Delivery Years, as well as the purchase of MISO Zonal Resource Credits for Ameren Illinois for the 2020-2021 and 2021-2022 Delivery Years.
Initial comments for the informal hearing were due to the Commission by May 24, 2019 and Reply Comments were due by May 31, 2019. Initial Comments were received from Bates White Economic Consulting (“Bates White”), the ICC’s Procurement Monitor, on May 24, 2019. Overall, Bates White noted that the IPA’s procurements continued to be successful in leveraging the power of competition for the benefit of the utilities’
191 https://www.icc.illinois.gov/downloads/public/3PublicNoticeofInformal HearingElectricEventsIssuedMay82019.pdf.

Illinois Power Agency Final 2020 Procurement Plan January 17, 2020
82
ratepayers. Bates White did not recommend any changes in the procurement process. No Reply Comments were received by the Commission. Comments received in the informal hearing process are available on the Commission’s website.192
192 See https://www.icc.illinois.gov/Electricity/workshops/procurementprocess2019.aspx.
Illinois Power Agency Final 2020 Procurement Plan January 17, 2020
83
Appendices (Overview)
Appendices are available separately at:
www.illinois.gov/sites/ipa/Pages/2020-Appendices.aspx
Note, the term “Expected Case” used in these appendices is synonymous with “Base Case” used in the main body of the Plan.
Appendix A Regulatory Compliance Index
Appendix B Ameren Illinois Submittal
• Ameren Illinois Letter Transmitting Final Data • Ameren Illinois Forecasting Methodology July 2019
Appendix C ComEd Submittal
• ComEd Load Forecast for Five-Year Planning Period June 2020 – May 2025 and Appendices
Appendix D MidAmerican Submittal
• IPA Letter Transmitting Final Data and Methodology – July 15, 2019 • Methodology for the 2020-2029 Illinois Electric Customers and Sales Forecasts
Appendix E Ameren Illinois Load Forecast and Supply Portfolio
E.1 Total Delivery Service Area Load • Table E-1 Ameren Illinois Delivery Service Area Load Forecast – Expected Case • Table E-2 Ameren Illinois Delivery Service Area Load Forecast – High Case • Table E-3 Ameren Illinois Delivery Service Area Load Forecast – Low Case
E.2 Ameren Illinois Bundled Service Load Forecast • Table E-4 Ameren Illinois Bundled Service Load Forecast – Expected Case • Table E-5 Ameren Illinois Bundled Service Load Forecast – High Case • Table E-6 Ameren Illinois Bundled Service Load Forecast – Low Case
E.3 Ameren Illinois Peak/ Off-Peak Distribution of Energy and Average Load • Table E-7 Ameren Illinois Peak/Off-Peak Distribution of Energy and Average Load – Expected Case • Table E-8 Ameren Illinois Peak/Off-Peak Distribution of Energy and Average Load – High Case • Table E-9 Ameren Illinois Peak/Off-Peak Distribution of Energy and Average Load – Low Case
E.4 Ameren Illinois Net Peak Position • Table E-10 Ameren Illinois Net Peak Position – Expected Case • Table E-11 Ameren Illinois Net Peak Position – High Case • Table E-12 Ameren Illinois Net Peak Position – Low Case
E.5 Ameren Illinois Net Off-Peak Position • Table E-13 Ameren Illinois Net Off-Peak Position – Expected Case • Table E-14 Ameren Illinois Net Off-Peak Position – High Case • Table E-15 Ameren Illinois Net Off-Peak Position – Low Case
Appendix F ComEd Load Forecast and Supply Portfolio
F.1 ComEd Residential Bundled Service Load Forecast • Table F-1 ComEd Residential Bundled Service Load Forecast – Expected Case • Table F-2 ComEd Residential Bundled Service Load Forecast – High Case • Table F-3 ComEd Residential Bundled Service Load Forecast – Low Case
F.2 ComEd Commercial Bundled Service Load Forecast • Table F-4 ComEd Commercial Bundled Service Load Forecast – Expected Case • Table F-5 ComEd Commercial Bundled Service Load Forecast – High Case • Table F-6 ComEd Commercial Bundled Service Load Forecast – Low Case
Illinois Power Agency Final 2020 Procurement Plan January 17, 2020
84
F.3 ComEd Net Expected Peak Position • Table F-7 ComEd Net Peak Position
F.4 ComEd Net Expected Off-Peak Position • Table F-8 ComEd Net Off-Peak Position
Appendix G MidAmerican Load Forecast and Supply Portfolio
G.1. MidAmerican Load Forecast • Table G-1 MidAmerican Load Forecast – Expected, High and Low Cases
G.2 Peak/Off-Peak Distribution of Energy and Average Load • Table G-2 MidAmerican Peak/Off-Peak Distribution of Energy and Average Load – Expected Case • Table G-3 MidAmerican Peak/Off-Peak Distribution of Energy and Average Load – High Case • Table G-4 MidAmerican Peak/Off-Peak Distribution of Energy and Average Load – Low Case
G.3 MidAmerican Net Expected Peak Position • Table G-5 MidAmerican Net Peak Position
G.4 MidAmerican Net Expected Off-Peak Position • Table G-6 MidAmerican Net Off-Peak Position