electricity network service provider … network service provider vegetation management variability...
TRANSCRIPT
ELECTRICITY NETWORK SERVICE PROVIDER VEGETATION MANAGEMENT
VARIABILITY REPORT March 2016

i
DISCLAIMER
This document refers to various standards, guidelines, calculations, legal requirements, technical details and other information.
Over time, changes in Australian Standards, industry standards and legislative requirements, as well as technological advances and other factors relevant to the information contained in this document, may affect the accuracy of the information contained in this document. Accordingly, caution should be exercised in relation to the use of the information in this document.
The Energy Networks Association Limited (ENA) accepts no responsibility for the accuracy of any information contained in this document or the consequences of any person relying on such information.
Correspondence should be addressed to the CEO, Energy Networks Association, Level 1, 110 Giles Street, Kingston ACT 2604
COPYRIGHT © Energy Networks Association 2016
All rights are reserved. No part of this work may be reproduced or copied in any form or by any means, electronic or mechanical, including photocopying, without the written permission of the Association.
ii
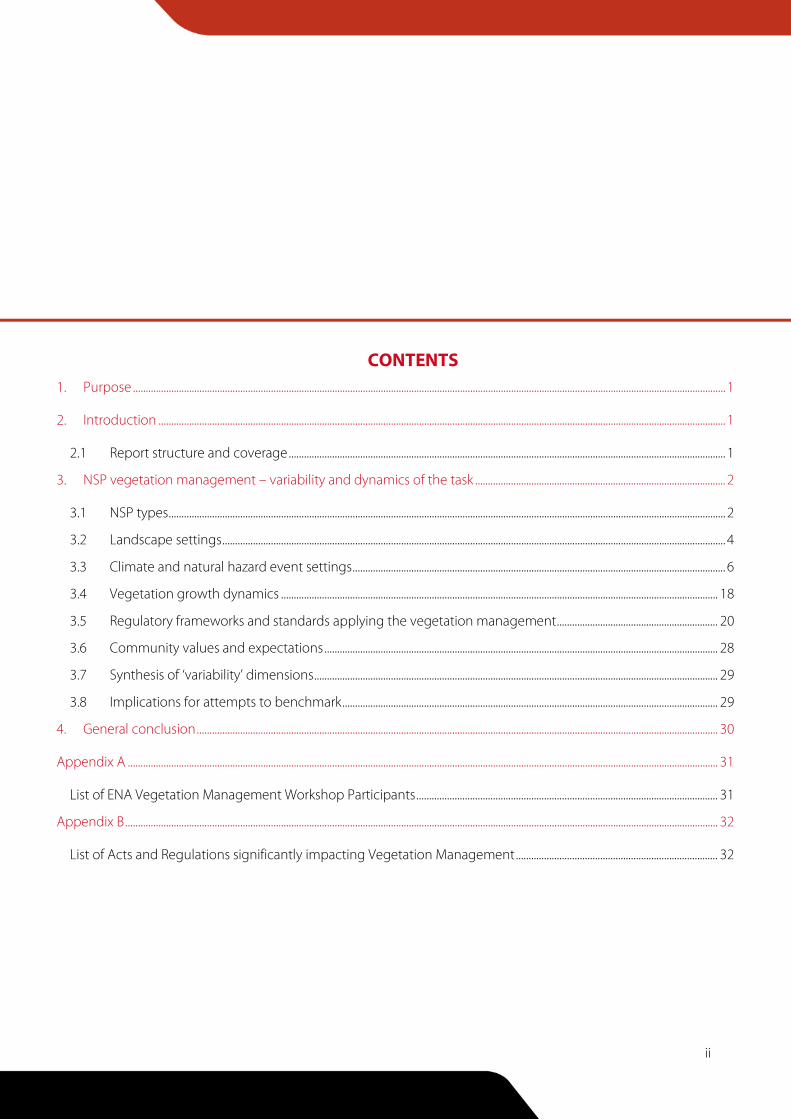
CONTENTS 1. Purpose ........................................................................................................................................................................................................................................ 1
2. Introduction .............................................................................................................................................................................................................................. 1
2.1 Report structure and coverage ........................................................................................................................................................................... 1
3. NSP vegetation management – variability and dynamics of the task .................................................................................................. 2
3.1 NSP types .......................................................................................................................................................................................................................... 2
3.2 Landscape settings ..................................................................................................................................................................................................... 4
3.3 Climate and natural hazard event settings .................................................................................................................................................. 6
3.4 Vegetation growth dynamics ........................................................................................................................................................................... 18
3.5 Regulatory frameworks and standards applying the vegetation management ............................................................... 20
3.6 Community values and expectations .......................................................................................................................................................... 28
3.7 Synthesis of ‘variability’ dimensions .............................................................................................................................................................. 29
3.8 Implications for attempts to benchmark ................................................................................................................................................... 29
4. General conclusion ............................................................................................................................................................................................................ 30
Appendix A ....................................................................................................................................................................................................................................... 31
List of ENA Vegetation Management Workshop Participants ...................................................................................................................... 31
Appendix B ........................................................................................................................................................................................................................................ 32
List of Acts and Regulations significantly impacting Vegetation Management ............................................................................... 32

1
1. PURPOSE The management of vegetation in proximity to electricity assets represents one of the largest recurring operational expenses for electricity network service providers (NSPs). As such, ENA conducted an industry-wide investigation of the key factors that influence vegetation management program design.
This report, titled ”Electricity Network Service Provider Vegetation Management Variability Report” outlines the significant degree of variability in regulatory frameworks and operating standards, and the significant differences in working environments in which NSP vegetation management programs are undertaken.
Key among the factors driving variability in operating environments are differences in asset characteristics between different types of NSP (transmission and distribution), wide-ranging differences in landscape setting features, climate influences on vegetation distribution and growth dynamics, inter-annual variability in climate-driven event cycles, and the influence of different stakeholder values and expectations on vegetation management programs.
The findings of this report should be considered when pursuing improved vegetation management using gap analysis and peer comparison.
2. INTRODUCTION The Energy Networks Association (ENA) is the peak national body representing electricity transmission and distribution businesses (collectively known as Network Service Providers – NSPs), as well as gas distribution businesses, throughout Australia. As required by its NSP members, ENA focusses on key policy and technical issues affecting electricity transmission and distribution networks.
ENA formed a Vegetation Management Reference Group (VMRG) in 2014 to investigate and report on vegetation management drivers and practices across the industry, and to identify potential opportunities for efficiency improvement in vegetation management. The VMRG initiated a survey of NSPs to start the process of assembling information relevant to vegetation management. To analyse the survey results and provide further investigations and analyses, ENA commissioned GHD to undertake a review of NSP vegetation management approaches and practices, with a view to identifying the range of factors that influence good program design and implementation, the key elements of good practice, and opportunities for efficiency gain across the industry.
Discussion of asset-based solutions such as undergrounding or other network design options are outside the scope of this report.
2.1 REPORT STRUCTURE AND COVERAGE
This report provides an overview of the study findings in relation to the analysis of the significant degree of variability in regulatory frameworks and standards, and even greater variability in the operating environments in which NSP vegetation management programs are carried out. Key among the factors driving variability in operating environments were the differences found in asset characteristics between different types of NSP (transmission and distribution), wide-ranging differences in landscape setting features, climate influences on vegetation distribution and growth dynamics, inter-annual variability in climate-driven event cycles, and the influence of different stakeholder values and expectations on vegetation management programs.

2
3. NSP VEGETATION MANAGEMENT – VARIABILITY AND DYNAMICS OF THE TASK Vegetation management is a recurrent activity undertaken on a major scale by all Network Service Providers (NSPs).
The vegetation management task varies greatly between different NSPs influenced by multiple factors including the NSP types (transmission or distribution or both) given the widely varying design/features of network assets they manage and operate; the range of different landscape and climate settings in which they operate; the types, frequency and severity of natural hazard occurrence; the varying regulatory standards between jurisdictions, the highly variable and dynamic nature of different vegetation, and the variation in community expectations and understanding.
3.1 NSP TYPES
Network Service Providers (NSPs) fall into two main categories, transmission and distribution, although there are some NSPs that cover both.
Transmission Network Service Providers (TNSPs) provide the bulk transport of electricity from the generators to the network supply points. Transmission networks typically operate voltages greater than 66kV.
Distribution Network Service Providers (DNSPs) provide the delivery of electricity to the end users. Distribution networks typically operate voltages up to 66kV (66kV is usually classed as sub-transmission, and can be operated by either the DNSP or the TNSP).
Vegetation near powerlines has the potential to cause faults that can cause power outages and damage to network assets, and some vegetation-caused faults can start bushfires or create electrical safety hazards if not controlled.
Vegetation clearance distance to avoid interaction of powerlines and vegetation varies depending on a range of criteria, including:
» the voltage of the powerline;
» the location of the powerline (whether it is in hazardous bushfire risk areas or urban areas);
» regulatory requirements;
» the type of conductor (fully insulated, covered or bare);
» span length (longer spans will sag and swing more under hot/windy conditions and thus require greater clearances).
Vegetation risk profiles, and associated management challenges/requirements typically differ between DNSPs and TNSPs.

3
3.1.1 Transmission NSP challenges and requirements
With regard to the challenges and requirements faced by TNSPs, the following factors are relevant:
» Due to the risks inherent with transmission network voltages, and the much higher consequences of transmission line outages, the clearance regime for many TNSPs (particularly higher voltage lines) is typically in the form of maintenance corridors. Vegetation management focusses on removing tall-growing woody vegetation in the corridor (typically through chemical control and/or recurrent mechanical treatment), and preventing woody vegetation adjacent to the corridor from encroaching back into it – a recurrent challenge;
» Keeping maintenance corridors clear of trees and tall woody shrubs brings very different challenges to vegetation management regimes of NSPs more focused on tree trimming. Individual tree trimming is by nature a ‘selective treatment’ approach in which the treatment is applied specifically to particular branches or leaders of target trees. However, keeping open vegetated maintenance corridors clear of trees typically involves less selective ‘area’ treatment types such as chemical treatment application (herbicide), or area-based mechanical treatments such as slashing and trittering. These treatments have greater potential for impacting non-target plants (potentially including threatened flora species) and disturbing or exposing soils increasing potential for erosion. Hence environmental impact assessment and management challenges are different to, and potentially more onerous than for tree trimming operations;
» Long, straight-line corridors up steep slopes on which vegetation management activities may result in some ground disturbance/exposure can have significant erosion control issues to be managed, particularly in environments with highly erodible soils;
» Sustained periods of wet weather can significantly impact maintenance corridor treatment programs due to the potential for soft ground conditions to preclude access by heavy equipment/vehicles necessary to apply treatments across wide maintenance corridors;
» There can be significant consequences if treatment cycles are adversely impacted by weather as vegetation can, in a single season in some environments, grow from a size class suitable for routine treatment procedures (eg. slashing) to a larger size class no longer suitable for routine practice, thus necessitating the use of significantly more costly equipment/techniques for treatment;
» It is not uncommon for transmission line corridors to traverse conservation reserves in which community sensitivity and expectations of vegetation management is heightened.
3.1.2 Distribution NSP challenges and requirements
The challenges and requirements faced by DNSPs differ significantly from those of TNSPs. Communities may be accustomed to, and more accepting of seeing transmission line assets in clear corridors, whereas they commonly see distribution lines close to vegetation, and in many cases through vegetation, and thus may have different expectations of how vegetation is managed for the two network types. The following factors are relevant:
» The focus of vegetation management in distribution line networks is more commonly on trimming back vegetation under or near powerlines rather than removing it, although DNSP programs do usually involve some targeted tree removals. Hence distribution networks are generally more heavily vegetated and have a much greater clearance burden. Focus is more on recurrent trimming of retained vegetation rather than the TNSP focus of keeping open corridors clear of tall-growing woody vegetation;

4
» DNSPs also have different drivers in terms of the way in which vegetation is managed, as distribution lines are prevalent in urbanised areas/townships, often near ornamental street tree plantings and retained remnant native tree-lined road verges. This typically engenders a heightened ‘aesthetic sensitivity’ for local communities and visitors. Community expectations for frequent light trimming in preference to less frequent, higher visual impact cutting are a significant factor to be considered;
» DNSPs vegetation management programs are also impacted by line clearance issues for trees on private land. Some DNSPs have requirements to obtain approval to trim trees that are on private land but which require trimming to maintain clearance compliance. This can impact the efficiency of program implementation, particularly where delays in gaining approval occur;
» The very large volume of annual vegetation trimming work associated with distribution networks is a significant factor in program design and timely cutting cycle completion;
» DNSP’s, particularly those with long-established and ageing network assets, face ‘legacy issues’ to varying degrees. While these more often affect network asset maintenance programs than vegetation management, there can still be significant vegetation legacy issues such as ongoing maintenance of technically difficult, large, mature, high-cost urban amenity tree maintenance requirements;
» An additional ‘future legacy’ issue facing DNSPs arises from the recently increased focus on tree planting programs pursuant to offsets for development, and generally for environmental reasons. In many areas, local governments require that developers and property owners who remove trees during development must replace removed trees (typically with requirements to plant more than were removed) elsewhere on their property. In many cases these are planted along the street frontage for visual appeal, with many planted near power lines which will in the future grow in to clearance spaces to become a new additional cohort of trees requiring ongoing vegetation management.
3.2 LANDSCAPE SETTINGS
There are many different landscapes in Australia with widely varying characteristics. Potentially there are numerous ways of categorising landscape settings and there are no widely accepted categories, however land use, form and cover characteristics are the key attributes for landscape setting categorisation. For the particular purpose of considering the general impact of landscape factors on vegetation management in this review, landscape settings are broadly grouped into five categories - urban, rural-agricultural, rural-urban interface/intermix areas, forested hill/mountain areas, and remote low rainfall areas. The factors driving vegetation management in one landscape setting can be very different from another, and in some areas one landscape setting may be intermixed with others. At the whole network level, a wide range of landscape settings will be involved, but the overall mix of settings will be important in driving the degree and type of vegetation management applied.
3.2.1 Urban
Urban areas typically have the highest densities of network assets and are mostly distribution networks, but also transmission. In truly urban areas, bushfire associated risk may be absent or confined to retained patches of native vegetation, however public safety related risks can be significant due to the inherently higher population densities in these areas. Bushland reserve areas within broader urban areas can create localised high bushfire risk areas arising from the proximity of residential frontages to bushland. Community expectations, particularly relating to aesthetic values, can affect how vegetation risk is managed and can typically add significantly to complexity and cost relative to some other landscape settings.
5
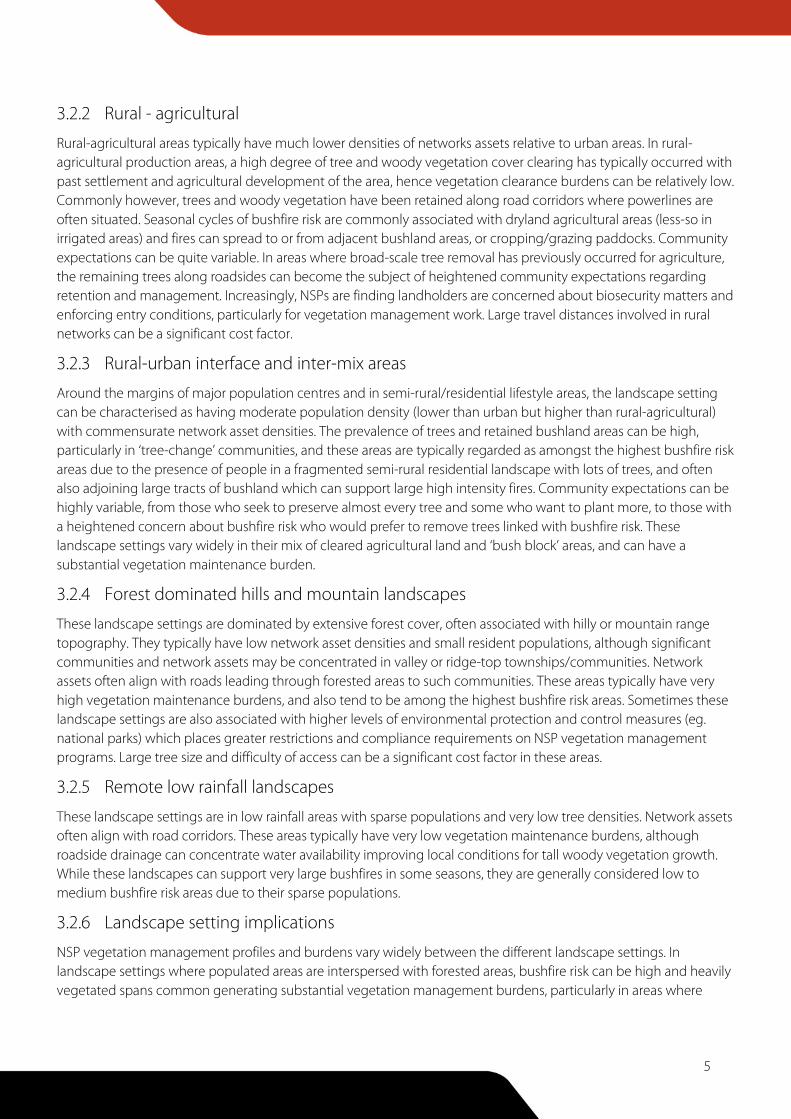
3.2.2 Rural - agricultural
Rural-agricultural areas typically have much lower densities of networks assets relative to urban areas. In rural-agricultural production areas, a high degree of tree and woody vegetation cover clearing has typically occurred with past settlement and agricultural development of the area, hence vegetation clearance burdens can be relatively low. Commonly however, trees and woody vegetation have been retained along road corridors where powerlines are often situated. Seasonal cycles of bushfire risk are commonly associated with dryland agricultural areas (less-so in irrigated areas) and fires can spread to or from adjacent bushland areas, or cropping/grazing paddocks. Community expectations can be quite variable. In areas where broad-scale tree removal has previously occurred for agriculture, the remaining trees along roadsides can become the subject of heightened community expectations regarding retention and management. Increasingly, NSPs are finding landholders are concerned about biosecurity matters and enforcing entry conditions, particularly for vegetation management work. Large travel distances involved in rural networks can be a significant cost factor.
3.2.3 Rural-urban interface and inter-mix areas
Around the margins of major population centres and in semi-rural/residential lifestyle areas, the landscape setting can be characterised as having moderate population density (lower than urban but higher than rural-agricultural) with commensurate network asset densities. The prevalence of trees and retained bushland areas can be high, particularly in ‘tree-change’ communities, and these areas are typically regarded as amongst the highest bushfire risk areas due to the presence of people in a fragmented semi-rural residential landscape with lots of trees, and often also adjoining large tracts of bushland which can support large high intensity fires. Community expectations can be highly variable, from those who seek to preserve almost every tree and some who want to plant more, to those with a heightened concern about bushfire risk who would prefer to remove trees linked with bushfire risk. These landscape settings vary widely in their mix of cleared agricultural land and ‘bush block’ areas, and can have a substantial vegetation maintenance burden.
3.2.4 Forest dominated hills and mountain landscapes
These landscape settings are dominated by extensive forest cover, often associated with hilly or mountain range topography. They typically have low network asset densities and small resident populations, although significant communities and network assets may be concentrated in valley or ridge-top townships/communities. Network assets often align with roads leading through forested areas to such communities. These areas typically have very high vegetation maintenance burdens, and also tend to be among the highest bushfire risk areas. Sometimes these landscape settings are also associated with higher levels of environmental protection and control measures (eg. national parks) which places greater restrictions and compliance requirements on NSP vegetation management programs. Large tree size and difficulty of access can be a significant cost factor in these areas.
3.2.5 Remote low rainfall landscapes
These landscape settings are in low rainfall areas with sparse populations and very low tree densities. Network assets often align with road corridors. These areas typically have very low vegetation maintenance burdens, although roadside drainage can concentrate water availability improving local conditions for tall woody vegetation growth. While these landscapes can support very large bushfires in some seasons, they are generally considered low to medium bushfire risk areas due to their sparse populations.
3.2.6 Landscape setting implications
NSP vegetation management profiles and burdens vary widely between the different landscape settings. In landscape settings where populated areas are interspersed with forested areas, bushfire risk can be high and heavily vegetated spans common generating substantial vegetation management burdens, particularly in areas where

6
growing conditions are most favourable (higher rainfall areas). Conversely, in broadly cleared agricultural landscapes and in remote low rainfall landscapes, vegetation management burdens can be relatively low.
3.3 CLIMATE AND NATURAL HAZARD EVENT SETTINGS
Australia is a vast continent with a wide diversity of climatic zones. Vegetation types and their growth dynamics vary greatly between these climatic zones. Further, different natural hazard event types (for example cyclones, storms and bushfires) which are key influences in NSP vegetation management programs, vary significantly between climate zones, each having a unique mix of event types, occurrence frequencies and severity potential. Even considered at the intra-State scale, the mix of vegetation growth potential and natural event type exposures can vary greatly from one part of a State to another. This means that NSP vegetation management program objectives and strategies may need to be tailored to a range of different natural hazard event and vegetation cover/dynamics environments within a NSP service area.
3.3.1 Climate and rainfall variation
Figure 1 shows the different climate classes and seasonal rainfall zones occurring across Australia. Each Australian State and territory has a unique suite of climatic conditions and variation within any State can be significant. For example in NSW, there are summer-peak rainfall areas with annual rainfall exceeding 1200 mm in north coast/hinterland areas; uniform seasonal rainfall distribution areas ranging from arid to high rainfall through NSW mid-latitudes, and areas with winter-peak rainfall ranging from arid to high precipitation alpine areas in the south. Vegetation structural form and growth dynamics vary substantially according to these different climate influences.
Source Bureau of Meteorology Figure 1 – climate class/seasonal rainfall zones of Australia

7
3.3.2 Natural hazard event variation
The types of natural hazard events which occur in an area also have a significant bearing on vegetation management.
Tropical cyclones
Historically, severe tropical cyclones (category 3 and above) have crossed the Australian coast within a latitude belt from around 10 to 25 degrees south. Figure 2 shows that cyclone occurrence is not uniform around the tropical coastline – with the north-west coast of WA having a significantly higher occurrence than the north east coast of Queensland.
Source: Bureau of Meteorology
Figure 2 Tropical cyclone coastal crossing points 1970-71 to 2007-08 Red dots represent severe tropical cyclones (category three or higher) and black dots represent non-severe cyclones (sub-category three).
Bushfires1
Bushfire risk varies considerably throughout Australia. The timing, duration and severity potential of bushfire seasons also varies around the country (see Figure 3). The highest risks are in areas with summer and summer/autumn bushfire seasons (which have a typically dry summer) particularly those areas with extensive forest cover in proximity to population centres. While major bushfire events are a periodic feature in all Australian States and Territories, event occurrence and severity differs significantly between and within jurisdictions. Historically, loss of life and property damage consequences from bushfires is greatest in Victoria. In Australia’s recorded bushfire history, 15 bushfires identified to have killed 10 or more people have occurred (VIC: 9; NSW: 4; SA: 1; TAS: 1). Bushfire events
1 Bushfires are vegetation fires and include grass, shrubland, woodland, forest, plantation and cropping land fires

8
occasioning large scale house loss (>50 houses) have occurred in all jurisdictions except the Northern Territory and Queensland.
Commission however have identified that the proportion of fires caused by electricity assets is higher on days of catastrophic fire danger when the highest consequence bushfires occur. DNSP assets typically represent a significantly higher proportion of electricity caused fires than TNSP assets.
Figure 3 Bushfire seasons

9
3.3.3 Inter-annual rainfall variation
Inter-annual rainfall in Australia is highly variable, with sustained severe drought periods often followed by floods and/or sustained wet periods, or neutral conditions. Importantly also, droughts rarely occur across the whole continent at the same time, nor do ‘big-wets’. In fact within any particular year, one part of the country can be suffering severe drought while another is experiencing floods or wetter than average conditions. This makes it very difficult to draw meaningful comparisons about vegetation program performance even within a single calendar year.
Figure 4 shows 2 year rainfall deciles across Australia for the period 2001 and 2002, and Figure 5 shows the 2 year rainfall deciles for 2010 and 2011. For the 2002/02 period eastern states experienced widespread and severe drought period as did the south west of WA, however central Australia and the north-west experienced very much above average rainfall conditions. By contrast, in 2010/11 an extremely wet two year period was experienced across the continent with the notable exception of south-west WA which was experiencing very much below average to record low rainfall.
This inter-annual rainfall variability has substantial effects on vegetation growth dynamics, with very low growth and even mortality in sustained dry periods and growth near or at the upper bounds possible in very wet periods. A key point is that growing conditions in one year cannot be relied on to forecast growing conditions for the next. In any one year, some parts of Australia may be experiencing highly favourable growth conditions and others highly unfavourable conditions.
Figure 4 Rainfall deciles 2001/2002

10
Figure 5 Rainfall deciles 2010/2011
3.3.4 State by State Climate overview
Queensland
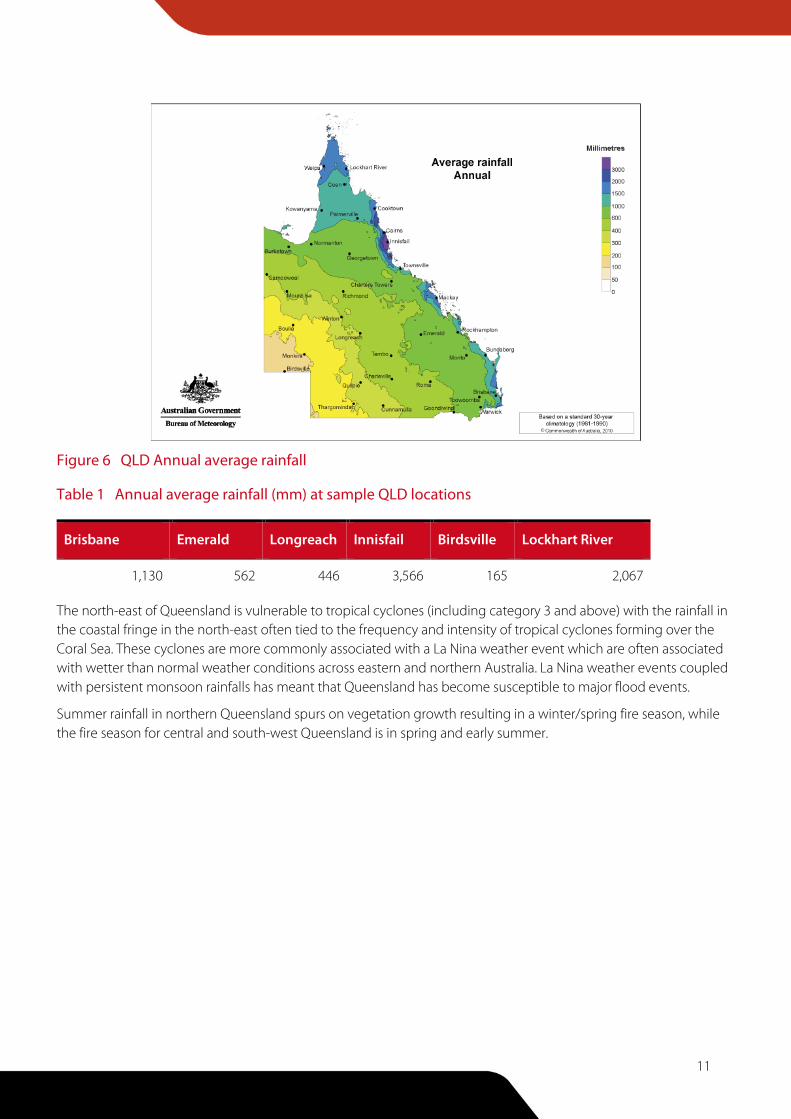
Rainfall and climate across Queensland is varied with the highest rainfall areas in the tropical north and along the coastal fringe with rainfall gradient extending inland to very low rainfall areas towards the south-west (Figure 6). Vegetation growth potential varies greatly along this rainfall gradient. Innisfail and the surrounding region records the highest annual average rainfall of 3,566 mm which is more than 21 times the average annual rainfall recorded at Birdsville. Lockhart River in the far north, experiences a monsoonal wet season and has annual rainfall in excess of 2,000 mm.
Queensland has some very distinct climatic zones, the far west of the state is characterised by hot dry summers and low rainfall, with Birdsville recording some of the highest maximum temperatures in the state. The south-east coastal fringe and hinterland have warm humid summers with the warm ocean temperatures minimising temperature extremities and producing annual rainfall in excess of 1,000 mm. Winters are generally warm with low rainfall, while extra-tropical coast low pressure systems originating from southern Australia results in rainfall to central and southern Queensland particularly in spring and autumn.
11
Figure 6 QLD Annual average rainfall
Table 1 Annual average rainfall (mm) at sample QLD locations
Brisbane Emerald Longreach Innisfail Birdsville Lockhart River
1,130 562 446 3,566 165 2,067
The north-east of Queensland is vulnerable to tropical cyclones (including category 3 and above) with the rainfall in the coastal fringe in the north-east often tied to the frequency and intensity of tropical cyclones forming over the Coral Sea. These cyclones are more commonly associated with a La Nina weather event which are often associated with wetter than normal weather conditions across eastern and northern Australia. La Nina weather events coupled with persistent monsoon rainfalls has meant that Queensland has become susceptible to major flood events.
Summer rainfall in northern Queensland spurs on vegetation growth resulting in a winter/spring fire season, while the fire season for central and south-west Queensland is in spring and early summer.

12
New South Wales
In NSW a rainfall gradient extends from high rainfall areas along the coastal fringe (highest in the subtropical north-east) to a low rainfall arid zone in the west (Figure 7). Annual average rainfall at Coffs Harbour is 1,699 mm which is more than 6.5 times that received at Broken Hill (259 mm). Vegetation growth potential varies greatly along this rainfall gradient.
The coastal plain, hinterland, ranges and tablelands in the eastern portion have a temperate climate (with subtropical areas on the north coast). This climate zone generally supports high vegetation growth potential. In the humid subtropical coastal areas north of the central coast, summer-peak rainfall and summer temperatures moderated by sea breezes provide favourable conditions during a long growing season. Particularly favourable growth conditions also occur in elevated tableland areas adjacent to the Great Dividing Range, where elevation serves to moderate summer temperatures and evaporation. The weather in the south of the state is generally hot in summer and cool in the winter, with a winter rainfall-peak, and the seasons are well-defined.
The coldest region is the Snowy Mountains where the snow and frost continues for quite long durations during the winter months.
Figure 7 NSW Annual average rainfall
Table 2 Annual average rainfall (mm) at sample NSW locations
Sydney Penrith Armidale Coffs Hbr Wagga Broken Hill
1,214 715 766 1,699 572 259
NSW is too far south to experience tropical cyclones. However, other weather phenomena including summer thunderstorms, ‘East Coast Lows’ (ECL - deep low pressure systems which can generate strong winds in coastal areas) and the passage of strong cold fronts can bring strong winds which can blow down trees and large branches. A major vegetation-related natural hazard risk in NSW is bushfires. Extensive tracts of forest and woodland vegetation, in close proximity to, and extending within major population centres, and the potential for extreme fire weather occurrence bring about a high level of bushfire risk.

13
Victoria
Victoria is the second wettest state in Australia after Tasmania and has a varied climate from semi-arid and hot in the far north-west to a temperate and cool climate along the coast (Figure 8). The vast majority of the state receives annual average rainfall in excess of 400 mm. Melbourne has an annual rainfall of 724 mm, while the while coastal and highland weather districts receive reliable rainfall in excess of 600 mm annually, and exceeding 1,000 mm in the Otway Ranges, highland areas and parts of East Gippsland. Mildura in the north-west is the driest part of the state, receiving approximately 290 mm annual average rainfall. Victoria experiences winter dominant rainfall.
The climate of Victoria is generally cooler than the other mainland states and territories. Snow fall and frost are common across the Great Dividing Range with temperatures commonly dropping below zero in the Victorian Alps throughout the winter months.
Figure 8 Victoria Annual average rainfall
Table 3 Annual average rainfall (mm) at sample Vic locations
Melbourne Sale Warrnambool Beechworth Charlton Mildura
724 599 727 954 428 290

14
Tasmania
While Tasmania is Australia’s wettest State, rainfall varies greatly across the island. The south-west corner of Tasmania is the wettest region. Moisture laden air masses moving east from the Southern Ocean give rise to precipitation along the west coast. These air masses cool as they pass over the central highlands creating a rain shadow effect to the east which means the Tasmanian midlands and east coast are drier and warmer than the west coast (Figure 9).
Hobart receives annual average rainfall of 615 mm, making it Australia’s second-driest capital city after Adelaide. Swansea on the east coast and Launceston in the northern midlands, both receive less than 700 mm annual rainfall while Strahan on the west coast receives in excess of 1,532 mm annually. Strathgordon in the highlands, just 150 km by road from Hobart receives up to four times Hobart’s rainfall. Tasmania generally has a winter dominated rainfall pattern.
Tasmania has a cool temperate climate with four distinct seasons. The major towns across Tasmania are located near the coast, so the temperatures of these towns are moderated by the ocean. Significant snow falls can occur in elevated areas throughout the winter months and into early spring.
Figure 9 Tasmania Annual average rainfall
Table 4 Annual average rainfall (mm) at Tasmanian locations
Hobart Launceston Burnie Swansea Strahan Strathgordon
615 679 954 626 1,532 2,526
Tasmania is too far south to experience tropical cyclones, however strong cold fronts can be generated off the Southern Ocean bringing strong winds and snow falls, including on occasion to low elevations. Tasmania also experiences a summer / autumn bushfire season correlating to the drier months of the year (summer and early autumn). The large rainfall disparity across Tasmania also impacts on the bushfire regime across the state. In drier seasons, the north and east of the state are susceptible to bushfires while the tall forests of the south-west generally only experiences bushfires in extreme drought conditions once the normally moist fuels in the forest understory have dried out sufficiently to facilitate fire spread.
15
South Australia
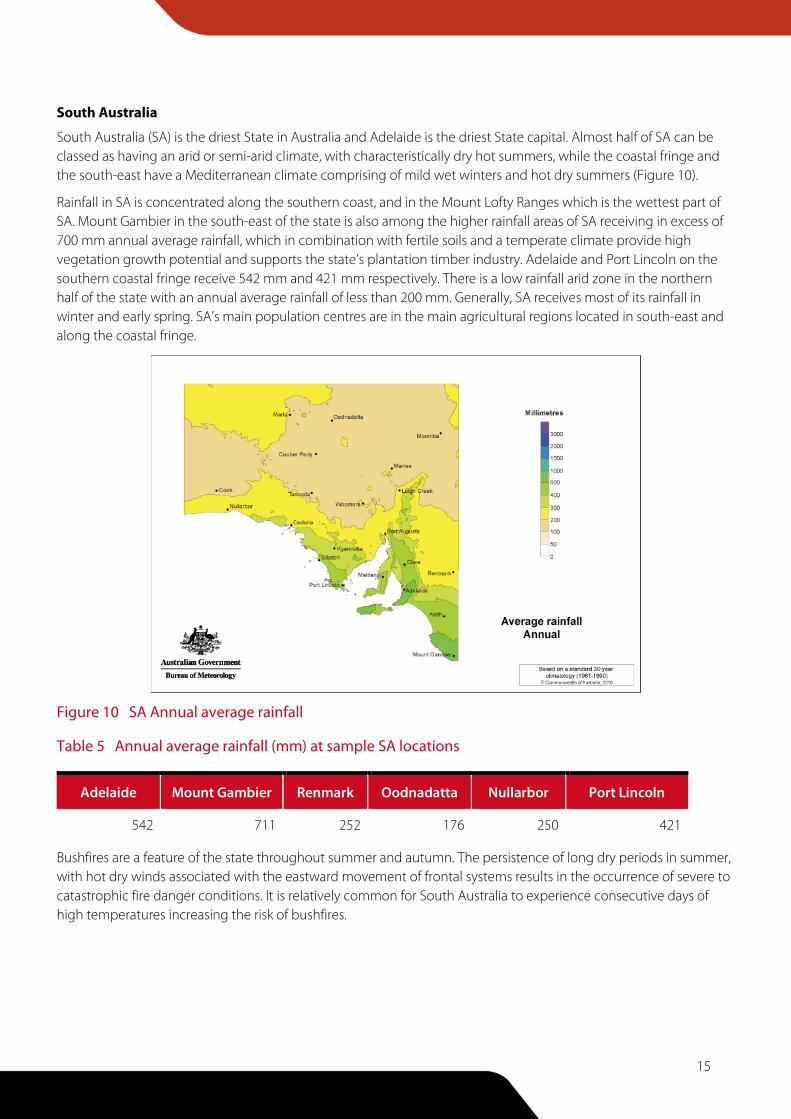
South Australia (SA) is the driest State in Australia and Adelaide is the driest State capital. Almost half of SA can be classed as having an arid or semi-arid climate, with characteristically dry hot summers, while the coastal fringe and the south-east have a Mediterranean climate comprising of mild wet winters and hot dry summers (Figure 10).
Rainfall in SA is concentrated along the southern coast, and in the Mount Lofty Ranges which is the wettest part of SA. Mount Gambier in the south-east of the state is also among the higher rainfall areas of SA receiving in excess of 700 mm annual average rainfall, which in combination with fertile soils and a temperate climate provide high vegetation growth potential and supports the state’s plantation timber industry. Adelaide and Port Lincoln on the southern coastal fringe receive 542 mm and 421 mm respectively. There is a low rainfall arid zone in the northern half of the state with an annual average rainfall of less than 200 mm. Generally, SA receives most of its rainfall in winter and early spring. SA’s main population centres are in the main agricultural regions located in south-east and along the coastal fringe.
Figure 10 SA Annual average rainfall
Table 5 Annual average rainfall (mm) at sample SA locations
Adelaide Mount Gambier Renmark Oodnadatta Nullarbor Port Lincoln
542 711 252 176 250 421
Bushfires are a feature of the state throughout summer and autumn. The persistence of long dry periods in summer, with hot dry winds associated with the eastward movement of frontal systems results in the occurrence of severe to catastrophic fire danger conditions. It is relatively common for South Australia to experience consecutive days of high temperatures increasing the risk of bushfires.

16
Western Australia
Due to its sheer size and latitudinal range, Western Australia (WA) has a diverse climate. Rainfall across the state is varied from a Mediterranean climate in the south, semi-arid and desert in the interior, and tropical monsoon climate in the north (Figure 11). The south-west corner of the state where population centres, forests and agricultural areas are located is the wettest non-remote area. Albany’s annual average rainfall of 932 mm is three times that of Eyre and Kalgoorlie. Perth has an annual average rainfall of 770 mm. The wheat-belt immediately to the east of Perth is the main dryland agricultural area of the state receiving between 400-600 mm of annual rainfall. Broome in the north experiences a tropical climate, receiving in excess of 600 mm, with January to March being the wettest time of the year.
Rainfall patterns in south-west WA are winter dominated, with relatively little rainfall throughout the summer months. In contrast, the Kimberley region in the north experiences two distinct seasons, a dry season in the winter months and a wet season extending from October – April.
Figure 11 WA Average annual rainfall
Table 6 Annual average rainfall (mm) at sample WA locations
Perth Albany Eyre Carnarvon Broome Kalgoorlie
770 932 314 226 614 267
WA is prone to a number of natural hazard events including tropical cyclones, flooding and bushfires. The far north-west coast of the state has the highest occurrence of category 3 and higher tropical cyclones within Australia. The majority of these tropical cyclones hit the coast between Exmouth and Broome, bringing strong winds, heavy rain and instances of flooding.
The bushfire season in WA is also linked to rainfall patterns. The Kimberley region has a winter-spring bushfire season, with the season getting later the further south. A number of bushfires have been recorded in recent years in the south-west of the state in summer–autumn when rainfall is the lowest.

17
Northern Territory
A strong rainfall gradient runs through the Northern Territory (NT), with high monsoon rainfall in the north decreasing toward the arid centre where rainfall is unreliable and highly variable (Figure 12). The NT can be split into two – very low rainfall semi-arid and arid zones in the south, and higher rainfall monsoon dominated climate in the north which supports tropical savannahs and areas of closed forest in the wettest parts along the coast. Like the northern parts of Western Australia and Queensland, tropical NT has a distinct wet and dry season. The dry season extends from May to October with temperatures ranging from 14°C to 32°C and minimal rainfall. The wet season occurs from October to April, the northern part of the Territory has rainfall in excess of 1,000 mm with Darwin recording annual average rainfall of 1,727 mm, six times that of Alice Springs in the semi-arid region in the southern half of the Territory. Low overnight temperatures in the central and southern part of the Territory, particularly in winter, are quite common while temperatures can rise above 40°C throughout the summer months.
Figure 12 NT Average annual rainfall
Table 7 Annual average rainfall (mm) at sample NT locations
Darwin Nhulunbuy Katherine Brunette Downs
Tennant Creek
Alice Springs
1,727 1,304 973 417 471 282
Tropical cyclones and floods are common throughout the Northern Territory particularly in the summer months where increased humidity is followed by monsoonal rain and storms. The bushfire season in the Northern Territory follows the rainfall pattern, with a winter fire season in the northern part of the Territory followed by an early summer fire season in the central and southern parts of the Territory.
18
3.4 VEGETATION GROWTH DYNAMICS
Influenced by the widely varying climate and site factors such as elevation and soils, vegetation types and growth potential vary greatly. Vegetation form and growth potential varies between extremes - from areas in Tasmania and Victoria which are home to the tallest flowering trees in the world, to vast desert areas and treeless plains. Vegetation growth potential is obviously a major factor affecting the management burden, design and costs of NSP vegetation management programs. There are a range of important vegetation growth dynamics factors to be considered, including but not limited to vegetation types and forms, their regeneration dynamics, and the effects of inter-annual climate variability on their growth. Vegetation growth dynamics can also be altered through human interventions (e.g. adding fertiliser, irrigation, or pruning). These factors can alter the natural vegetation growth dynamics that would otherwise be expected.
3.4.1 Vegetation types and form/structure differences
In response to the great variety of climatic situations, and in combination with the wide variety of different soils and surface/ground water sources (rivers, wetlands, underground water tables and aquifers) a diverse range of vegetation has evolved across Australia with widely varying growth dynamics.
In some combinations of soils and climate (typically deep, well-structured, fertile soils in high and relatively even rainfall areas) very fast-growing tree species have evolved. There are dozens of genera and thousands of species, but the most dominant genera include the Eucalypts (and close relatives) and Acacias - commonly grouped as Gums and Wattles. The Eucalypts include the tallest-growing flowering trees on Earth, with very tall and fast growing species occurring in parts of Tasmania and Victoria, as well as NSW and south-west Western Australia. For established saplings and young trees, rates of growth can increase tree height by 2 to 3 metres per year. Where young vigorous well-established trees are cut but their lignotuber and/or well-developed root system remain intact, even faster rates of coppice regrowth is possible in favourable locations and seasons. In the wet tropics also vigorous tree growth is a factor affecting vegetation management programs.
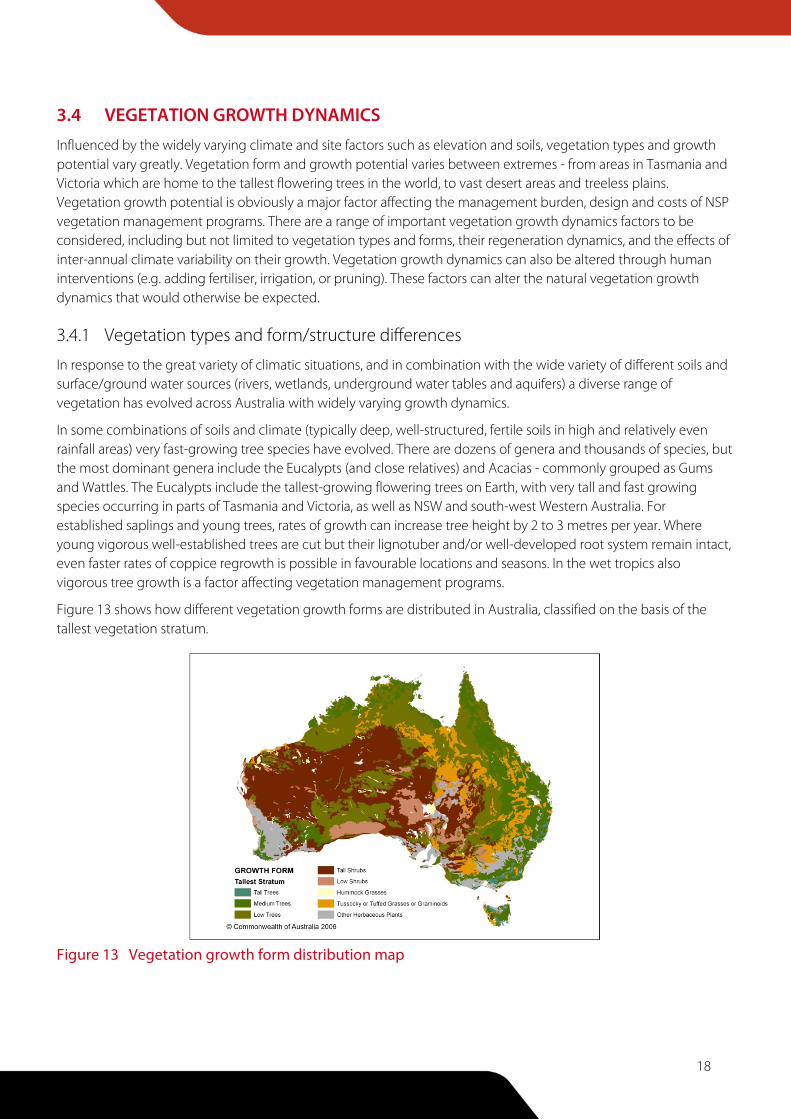
Figure 13 shows how different vegetation growth forms are distributed in Australia, classified on the basis of the tallest vegetation stratum.
Figure 13 Vegetation growth form distribution map

19
The tall tree category in Figure 13 corresponds to tall moist/wet eucalypt forests which can attain heights in the 60 to 80 metre range. These include Karri forest areas in SW WA, Ash forest communities in Tasmania, Victoria and southern NSW, and mixed species sub-tropical Eucalypt forests in northern NSW.
The medium tree category in Figure 13 corresponds to a very wide range of forest and woodland communities, including many relatively tall-growing dry and moist open forest and woodland communities which can grow to a height exceeding 30 metres, and others in the 10 to 30 metre range. Those forests and woodlands which grow to a height toward the upper end of this range can be well beyond the reach of commonly used elevated work platforms.
The low tree category in Figure 13 includes vast areas of tropical savanna, mallee, mulga and related communities. These can grow to 10 metres but many mallee and mulga communities are more commonly up to 6 metres. Tropical savanna height and stand structure varies along rainfall gradients and may reach a height in the 20 to 25 metre range in higher-rainfall areas.
Growth rates generally slow in line with declining annual rainfall. In semi-arid and arid areas rainfall can be too low to support extensive forests and woodland, with shrublands or grasslands dominating the landscape. Trees are mostly confined to areas fed by surface water flow or subterranean water sources.
Many Australian forest tree species including a substantial proportion of eucalypts are ‘crown shy’ and if they can will grow away from adjacent trees toward open space. At the edges of cleared maintenance corridors and road easements it is common to observe eucalypts growing away from the forest edge out in the direction powerlines and roads often with a significant lean towards these. As eucalypts grow, most species shed lower branches progressively, attaining a form with the tree crown held high above a largely branch-free stem, while others tend to have greater lateral spread retaining branches to their lower stem section.
The key point is that there is great diversity of tree genetics between and even within tree species, and together with the nature of tree growth potential in any particular area this variability has significant implications for vegetation management.
3.4.2 Vegetation regeneration dynamics
Most widely distributed Australian tree species are adapted to survive the significant variability in our climate. Many of the most common tree species are adapted to take advantage of infrequently occurring favourable conditions to regenerate, giving rise to pulse-regeneration events. In most years conditions will be unfavourable for regeneration (to dry for seed germination and/or too hot and dry over summer for emergent seedling cohorts to survive). However, during relatively uncommon periods when conditions are suitable for seed germination, and subsequently remain suitable for early seedling growth and establishment (sufficient for attaining resilience to normal seasonal drying cycles), new cohorts of trees can become established. Evidence of the occurrence of such events can be seen where large numbers of young seedlings or saplings are observed occupying cleared areas at the margins of forest and woodland, and around individual trees. These uncommon pulse-regeneration events can have substantial future impacts on vegetation management programs through reoccupation by trees of previously cleared easements or clearance zones near powerlines.
Such conditions were widespread in Australia in the 2010/2011 ‘big wet’ period, and it is common to see new cohorts of 2010/11 saplings becoming established in the southern and eastern States.
Additionally, anthropogenic factors such as soil disturbance or pruning can trigger natural regeneration or growth increase responses from vegetation to take advantage of the increased availability of resources (light, water, suitable seedbed conditions). Sometimes these factors can include activities networks need to perform as part of their broader operations (e.g. ground disturbance which results during asset maintenance, which then promotes a vegetation regeneration response).

20
3.4.3 Climate variability influence on vegetation growth dynamics
Vegetation growth rates are not reliably consistent from one year to the next. Australian trees have adapted to our variable climate, and have the ability to slow their growth to incremental rates in unfavourable years, and take advantage in favourable seasons by dramatically increasing their growth. Unfortunately, the inter-annual variability in rainfall is notoriously difficult to predict. While monitoring indicators of climate cycles such as El-Nino Southern Oscillation (ENSO) and Indian Ocean Dipole (IOD) can be used to generate event probabilities, as farmers well-know these are not reliable forecasts of what will happen. What is predictable is that the climate will continue to vary between substantially different extremes, and that the rainfall pattern and other weather variables are not reliably predictable in any year.
This unpredictable inter-annual variability in growth causes significant perturbations in NSP vegetation management programs. Last year’s program scope is not a reliable indicator of next year’s program.
3.5 REGULATORY FRAMEWORKS AND STANDARDS APPLYING THE VEGETATION MANAGEMENT
Different regulatory frameworks and standards have been developed and evolved over many decades in the different Australian State and Territories. Even though the national electricity market (NEM) commenced more than 15 years ago now interconnects five regional market jurisdictions (Queensland, New South Wales, Victoria, South Australia and Tasmania), significant variation in frameworks and standards remains.
3.5.1 Regulatory Obligations
Within the National Electricity Market, the AER provides economic regulation of NSPs primarily by reviewing revenue proposals lodged every 5 years. The revenue allowed by the AER is intended to be sufficient to allow an efficient NSP to maintain their network in a safe, reliable and affordable manner, consistent with technical compliance obligations determined by State technical regulators. While the AER provides economic regulation, vegetation management technical compliance requirements are set and regulated by State governments through technical regulators or government departments. Each jurisdiction’s drivers for their variation to other jurisdictions may have arisen for a range of reasons including political, historical and from experience/performance review processes.
It should be noted that there is a wide range of other predominantly State-based Acts and Regulations (but also some Commonwealth legislation) that affects vegetation management program design, management and cost to different degrees in different jurisdictions. Among many other examples are Acts and Regulations pertaining to:
» native vegetation clearance/protection;
» protection of threatened flora and fauna;
» protection of Aboriginal cultural heritage;
» soil protection and erosion/water pollution prevention;
» biosecurity management (e.g. weeds and soil-borne pathogens);
» significant tree preservation;
» chemical handling and use;
» road use management/safety.

21
The various exemptions, exclusions, risk assessment requirements, licensing or permit requirements, and offence provisions contained in different Acts and Regulations vary significantly between jurisdictions and are too complex to summaries here. Suffice to say that the range of different Acts and Regulations applying in different jurisdictions impact NSP vegetation management systems and practices to different extents and degrees, in many cases substantially so, adding significantly to the variability in operating environments between NSPs.
The offence provisions contained in the various Acts do get applied to NSPs, and at various times NSPs have been subject to prosecutions and legal actions, particularly under environmental legislation (including instances of major actions). In relation to such legal actions, the financial penalties imposed for breaches can amount to just a small fraction of the much greater costs incurred by NSPs to re-design aspects of their vegetation management programs and systems, so that laws and regulations are not inadvertently breached. Major systems and process changes may be implemented such as revising environmental risk/impact assessment processes, introducing new training and competency requirements for workforces and contractors, introducing additional data collection and reporting requirements, obtaining highly prescriptive licenses with substantially increased compliance costs, and specifying more costly work systems requirements or equipment restrictions.
A key consideration is that following regulatory breaches and investigations/prosecutions, decisions regarding the adoption of more onerous, labour and skill/training-intensive and costly work systems often have dependencies on the risk appetite of NSP Boards, and/or the expectations of technical regulators. Decisions taken do not necessarily have one-off impacts, often they can result in step-change increases in costs that impact vegetation management programs on an ongoing basis. A non-exhaustive list of Acts and Regulations that affect vegetation management is provided at Appendix B.
A summary of the requirements for maintaining electricity supply network line clearance and safety in each State is provided in the following sections. This information was obtained through a search of relevant legislation for each jurisdiction, and/or through the relevant NSP’s websites.
Australian Capital Territory (ACT)
The Utility Act 2000 regulates key technical and regulatory aspects of the provision of utility services in ACT. As per this Act, tree clearance around power lines in ACT is the responsibility of the lease holders for leased land and of ACT Government for unleased land except urgent circumstances to maintain the safe operation of the power lines.
The Utility Networks (Public Safety) Regulation 2001 indicates that “a lessee of territory land must not, without reasonable excuse, allow any part of a tree or other vegetation on the land to be too close to an aerial line.”
“For this regulation, the minimum distance from any part of an aerial line is to be measured from the nearest point to which the line sags or swings.” These Regulations stipulate the clearances required depending on powerline voltage. The Regulations specify a minimum distance from the aerial conductor that must be maintained at all times. There is no reference to allowance for growth into the clearance zone.
ActewAGL undertake cyclic inspections of their assets and vegetation clearances, and where necessary, issues notice to the landowners advising of the requirement to clear the vegetation within 28 days (Section 125 notice).
In 2009, in order to implement an effective bushfire mitigation measure, an agreement (Code of Practice) was made between ActewAGL and ACT Parks, Conservation and Lands to include tree clearing in ActewAGL’s scope only for rural areas in ACT. Currently based on this agreement, ActewAGL inspects and clears all the trees around power lines in rural areas but inspects and only notifies to relevant owners of the trees in other areas for safe clearance. A notification management process is also in place to control any emergency clearance of trees by ActewAGL as necessary.
No clearance or inspection cycle is prescribed.
22
New South Wales (NSW)
In New South Wales, vegetation management compliance metrics are not prescribed in legislation or regulation. The Electricity Supply Act 1995 provides for the network operator to trim or remove trees that have the potential to interfere with electricity works, or be a potential cause of bush fire, or potential risk to public safety. Some exclusions apply in protected areas or trees covered by protection or heritage orders. Tree preservation orders do not apply.
Compliance metrics are applied via a Code. The relevant Code is the Industry Safety Steering Committee Guidelines ISSC3 – Guideline for Managing Vegetation near Powerlines (2005) which has been prepared and provide guidance for vegetation management practices as well as clearances required. It also describes the factors influencing vegetation management options. This Guideline permits the removal of any inappropriate species (those with a mature height of more than 3m) that would require trimming to maintain clearances. Provision is also made to remove trees located outside the clearance of transmission towers if they will require regular maintenance. The Guideline also specifies clearances from streetlights. This Guideline is quite out of date with respect to legislative references.
The Electricity Supply (Safety and Network Management) Regulation 2014 requires NSPs to not remove or trim a tree in a way that substantially damages the tree unless it is of the opinion that it is necessary to do so to protect its powerlines or the safety of people or property. The NSP is also required to establish a tree management program for the staged removal and replacement of those species of trees that have a propensity to interfere with powerlines.
The Regulations describe the requirement for preservation of trees. Under this regulation, a distributor may establish a tree management plan for the trimming, or staged removal and replacement of trees that may interfere with powerlines. Alternative methods (including use of ABC and relocation of powerlines) must be considered.
Northern Territory (NT)
In the NT, the responsibility for vegetation management is prescribed in the Electricity Reform Act (as in force at 2 June 2014). The legislation only makes reference to the notifications required to landowners.
Power and Water is the utility responsible for vegetation management near powerlines. They appear to have their own requirements documented, although while reference was found to Network Policy NP 013 Management of Vegetation Near Overhead Power Lines, this document could not be found on the internet.
Queensland (QLD)
The Electricity Act 1994 Part 2: Power to Prevent Fire or Electric Shock, gives Utilities the ability to enter a place to remove vegetation that is affecting, or may affect the safety. The Electrical Safety Regulation 2013 require an electricity entity to ensure that trees and other vegetation are trimmed, and other measures taken, to prevent contact with an overhead electric line that is likely to cause injury or damage to property.
Utilities are required to have internal standards for vegetation clearance. For example, Ergon Energy internal standards provide for a ‘corridor’ in rural areas only, the width of which depends on the powerline voltage, and within which vegetation should be removed or chemically treated to ensure there is no potential to enter the clearance zone. It also discusses the need to control saplings and regrowth. Energex has determined clearance zones by an engineering study and risk analysis.
South Australia (SA)
In South Australia the Electricity Act 1996 imposes a duty on SA Power Networks to take ‘reasonable steps’ to:
» Keep vegetation of all kinds clear of public powerlines under its control, and
» Keep naturally occurring vegetation clear of all private powerlines under its control in accordance with the principles of vegetation clearance.
23
The Electricity (Principles of Vegetation Clearance) Regulations 2010 prescribe vegetation management requirements. These Regulations stipulate the clearances required depending on powerline voltage and configuration. The Regulations specify a maximum inspection and clearance cycle of three years, a “clearance zone” (CZ) that must be maintained at all times, and a “buffer zone (BZ)” which limits the distance that vegetation can be cleared away from the powerline. Buffer Zones are not applicable on public land in non-bushfire risk areas.
No provision is made to remove vegetation without the permission of the owner.
Tasmania (TAS)
Chapter 8A of the Tasmanian Electricity Code (TEC) relates to distribution powerline vegetation management.
This chapter prescribes clearance spaces and describes other requirements including regrowth spaces, hazard spaces and clearing cycle, all of which are required to be specified in the NSP’s Management Plan. The Management Plan must include the NSP’s risk assessment approach used in determining these requirements. The TEC advocates the removal of vegetation where judged appropriate following the assessment of the vegetation’s’ conservation value, where it cannot be cleared on a regular cycle without impacting the health of the vegetation. The TEC also recommends removal of saplings where the mature height will infringe the clearance space.
TasNetworks’ Vegetation Management Strategy ensures that the program is aimed at achieving an efficient maintenance cycle, (as opposed to a trimming cycle). Trimming cycle refers to the practice of removing the minimum vegetation to comply with TEC 8A, whilst maintenance cycle removes additional vegetation reducing the cycle (and cost) over time despite its initial higher cost.
TasNetworks carries out an annual pre-summer vegetation inspection and cutting program in High Bushfire Loss Consequence Areas to ensure required clearances are achieved prior to the onset of each annual bushfire season.
All transmission lines are inspected via helicopter annually (which includes High Bushfire Loss Consequence Areas).
Victoria (VIC)
In Victoria, the Electricity Safety Act 1998 (Electricity Safety Act) requires distribution companies to keep the whole or any part of a tree clear of an electric line within its distribution area, unless another person is responsible for the maintenance of the line or keeping of the whole or any part of a tree clear of the line (s84). Other persons who may be responsible for the maintenance of the line, or keeping the whole or any part of the tree clear of the line, are set out in s84A to s84D of the Electricity Safety Act and include, in particular circumstances, councils or occupiers of land. DNSPs have obligations to ensure Councils are meeting safe clearance requirements.
The Electricity Safety (Electric Line Clearance) Regulations 2015 prescribe the specific vegetation management requirements. The 2015 Regulations prescribe the Code of Practice for Electric Line Clearance and provide for other matters authorised under the Electricity Safety Act relating to electric line clearance.
These Regulations stipulate the clearances required depending on powerline voltage and configuration. The Regulations specify a clearance zone (CZ) that must be maintained at all times. For the required clearance space, an additional distance must be added to the minimum clearance space to allow for regrowth during the period between cutting times. The vegetation removal contractors are required to determine the additional clearance required to allow for sag and swing of the powerline. Removal of trees is permitted as required.
NSPs (and Councils for declared areas) are required to have an Electrical Line Clearance Plan which is approved by the safety regulator (Energy Safe Victoria). The regulator can influence or even direct what is in this plan. Such plans may specify Regrowth Zone dimensions and planned clearance cycles.

24
Western Australia (WA)
In Western Australia, vegetation management is governed by a number of Regulations / Codes which Energy Safety, WA’s energy industry technical and safety regulator has developed and applies to the power lines owned and operated by network operators in throughout the state.
The focus of these regulations / codes is on the safe operating distance requirements for working in the vicinity of power lines, the minimum clearance for control of vegetation and the specific responsibilities of tree owners with respect to the location and type of tree in proximity of power lines. The key Regulations are:
» Electricity Regulations 1947– Part IX;
These regulations provide the vegetation control work safety requirements for those undertaking vegetation control work within the vicinity of power lines, articulating danger zones and safe clearance working distances.
» Energy Operators (Powers) Act 1979;
Clause 54 of this Act stipulates that it is the duty of the occupier of any land on or over which vegetation is growing to manage the vegetation as necessary to prevent it from interfering with the safe use of any supply system. Where this has not been undertaken in a reasonable way, the NSP can undertake the works and recover the costs from the land occupier. This law is unique to WA as property occupiers currently manage and assume responsibility for vegetation on their property.
» Energy Safety (WA) – Guidelines for the management of vegetation near power lines (2012)
This guideline clarifies the responsibilities for controlling and clearing vegetation around overhead power lines. Management includes pruning, cutting and trimming, removing vegetation and disposing of vegetation endangering power lines.
» Code of Practice for Personnel Electrical Safety for Vegetation Control Work near Live Power Lines
This Code details the requirements for vegetation control work carried out near the live conductors of power lines and is to be read in conjunction with the Electricity Regulations 1947. It has been developed to establish the principles applicable to safe vegetation management work near power lines, specifically in the danger zone, articulating minimum standards and safety information to be used.
3.5.2 Summary
A summary of the framework for vegetation management across each State is provided in Table 8 and Table 9. It can be clearly seen that no two states have the same framework.

25
Table 8 Summary of vegetation management frameworks
ACT NSW NT QLD SA TAS VIC WA Utility responsibility No Yes Yes Yes Yes Yes Yes Part Legislation prescribed Clearance Zone Yes No No No Yes No Yes No Legislation prescribed Buffer Zone No No No No Yes No No No Legislation prescribed maximum clearance cycle
No No No No Yes No No No
Other specified Clearance Zone No Yes Yes Yes N/A Yes N/A No Other specified Buffer Zone No No No Yes N/A No No No Other specified clearance cycle No No No No N/A Yes N/A Yes Applicable Code or Management Plan (where legislation does not prescribe clearances)
No Yes No Yes N/A Yes N/A Yes
Corridors No Yes Yes Yes No Yes Yes No Tree removal allowed Yes Yes Yes Yes No Yes Yes Yes Herbicide allowed N/A Yes N/A Part No Yes Yes Yes Clearances from Streetlights No Yes No No No No No No Utility responsible for service line No No No Yes Part Part Part No Clearances inclusive or exclusive of swing/sag
Ex In - - In In Ex In
Management of Council clearance programs
No No - No No No Yes Yes
Table 9 Clearance Cycles (either Legislative or from Management Plans)
Cycle ACT NSW NT QLD SA TAS VIC WA
Urban (NBFRA) NA 1 (Ausgrid) 1 (Endeavour) 1-3 (Essential)
NA 1 (Energex) 1-2 (Ergon)
1-3 (Powerlink)
3* 1 3*
½ (Horizon Power)
Rural (BFRA) NA 1 (Ausgrid) 1 (Endeavour) 2-5 (Essential) 1-3 (Transgrid)
NA 2-4 (Energex) 1½ - 6 (Ergon) 1 (Powerlink)
3* 1 3* ½ - 1 (Horizon Power)
* Table 9. Note: The clearance cycles denoted with a * are legislated maximum cycle periods. NSPs adopt a range of cycles, mostly considerably shorter than the allowable maximum, and in bushfire-prone areas annual cycles are a common practice.
3.5.3 Comparative analysis
It is not possible to directly compare the NSPs, as no two have the same regulatory obligations. Legislation is both a driver and a constraint for each NSP, but additionally each business has to decide how it will meet its obligations. These legislative drivers and business decisions will impact the cost of vegetation management. Key differences include the treatment of sag and swing. In SA for example, the legislated clearance distances include an allowance for swing and sag, while in Victoria, additional clearance needs to be calculated by the contractor and added the legislated clearances. Depending on the experience of the contractor and the technology employed, this can lead to additional time required and hence affect the efficiency.

26
There is also variability in the clearance distances required in each jurisdiction. In some states, the clearances are prescribed by legislation, some are prescribed in Codes, while others are at the discretion of the NSP and their individual Vegetation Management Plans. In ACT, the clearances prescribed by Regulations provide for a minimum clearance distance to be measured from the nearest point to which the line sags or swings. This clearance distance is 3m for all voltages greater than 33kV and up to 132kV. This range of voltages would have a very large range of span lengths, and hence swing and sag. It is thus not possible to be able to compare the actual clearances against the requirements of other jurisdictions.
There are also differences across the jurisdictions in span length categories used in regulating clearance. In NSW and SA for example, span lengths (and hence the clearances) are nominated in 50m lengths. Other states, like Victoria and Tasmania use spans up to 40m, then 40m-70m, 70-100m, and then exceeding 100m. This again makes it difficult to be able to compare clearance requirements across NSPs.
The way in which the spans are ‘broken up’ also differs. In SA, the middle half of the span has the maximum clearance, while the required clearance for the quarter of the span on either end increases from the pole to the maximum clearance. In NSW and QLD, the span is split in sixths, with the middle two thirds having the maximum clearance, and the sixth on either end increases from the pole.
In Tasmania, the clearances are prescribed for the size of conductor, rather than the voltage. This would have an impact on the efficiency, as the contractor would need to be able to identify the conductor as small/medium/large and apply the appropriate clearance.
There are also differences depending on the allocation of bushfire risk areas. SA is very prescriptive, and provides clearances for both bushfire risk areas and non-bushfire risk areas. NSW provides clearances for urban and non-bushfire risk areas only, with the nominated clearances not including “ any allowance for regrowth or additional clearances in Non-Urban/Bushfire prone areas”2
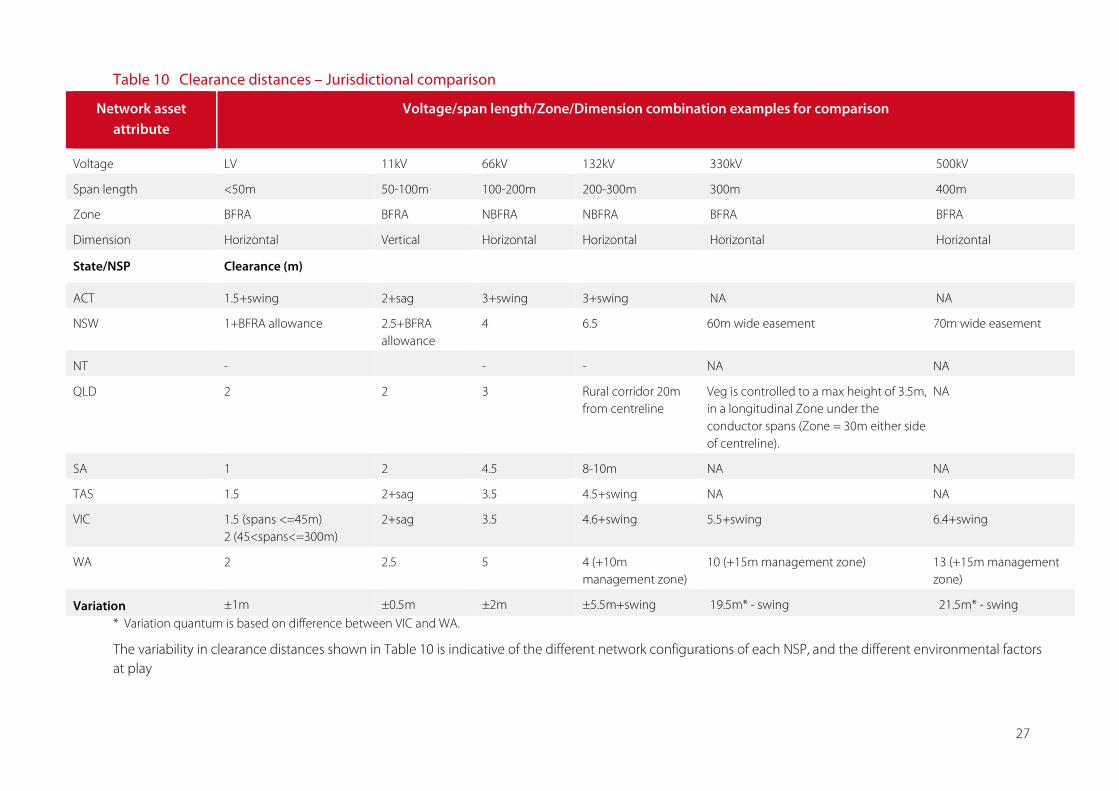
A sample comparison to show some of the differences in shown in Table 10 on the following page
2 ISSC 3 Guideline for Managing Vegetation near Power Lines, Dec 2005
27
Table 10 Clearance distances – Jurisdictional comparison
Network asset attribute
Voltage/span length/Zone/Dimension combination examples for comparison
Voltage LV 11kV 66kV 132kV 330kV 500kV
Span length <50m 50-100m 100-200m 200-300m 300m 400m
Zone BFRA BFRA NBFRA NBFRA BFRA BFRA
Dimension Horizontal Vertical Horizontal Horizontal Horizontal Horizontal
State/NSP Clearance (m)
ACT 1.5+swing 2+sag 3+swing 3+swing NA NA
NSW 1+BFRA allowance 2.5+BFRA allowance
4 6.5 60m wide easement 70m wide easement
NT - - - NA NA
QLD 2 2 3 Rural corridor 20m from centreline
Veg is controlled to a max height of 3.5m, in a longitudinal Zone under the conductor spans (Zone = 30m either side of centreline).
NA
SA 1 2 4.5 8-10m NA NA
TAS 1.5 2+sag 3.5 4.5+swing NA NA
VIC 1.5 (spans <=45m) 2 (45<spans<=300m)
2+sag 3.5 4.6+swing 5.5+swing 6.4+swing
WA 2 2.5 5 4 (+10m management zone)
10 (+15m management zone) 13 (+15m management zone)
Variation ±1m ±0.5m ±2m ±5.5m+swing 19.5m* - swing 21.5m* - swing * Variation quantum is based on difference between VIC and WA.
The variability in clearance distances shown in Table 10 is indicative of the different network configurations of each NSP, and the different environmental factors at play

28
3.6 COMMUNITY VALUES AND EXPECTATIONS
Vegetation plays an important role in the community and environment providing visual appeal and shade, as well as wildlife habitat. NSPs also recognise that the community is a significant stakeholder in vegetation management, particularly in the urban environment where the aesthetic amenity of the trees is often a significant factor.
Vegetation can form part of the identity of some local government areas and townships. As such there can be a level of frustration with the perceived “butchering” of trees necessary to meet the required clearances. In the urban environment, there is a general trend to view trees not just as a risk and cost but as an asset and opportunity, reflecting the community and environmental importance, and cultural, historical and streetscape value. In rural areas, there is generally less emphasis on the aesthetic issues arising from “poor cutting”, although many townships can encounter similar community issues as urban locations, particularly in tourist towns.
As TNSPs usually have wide maintenance corridors, they do not experience the level of community concern as encountered by DNSPs. However TNSPs have their own different issues. It is a relatively common situation that transmission lines run through areas of National Park. The wide open maintenance corridors in which the lines are situated are quite obvious interventions in the landscape, and being in conservation reserves can attract the attention of stakeholders and the general public. Expectations of minimal impact management can be very challenging in remote, difficult to access, steep areas that are difficult to operate safely in. These issues serve to raise costs above those of less challenging environments.
There is general acceptance that improvements in tree and vegetation management needs to be considered in relation to risk (bushfire, safety, reliability) and this will vary from region to region based on a range of different factors, including location, species, growth rates and rainfall for example. While communities, in the main, understand that the NSPs are driven by regulatory imperatives, it is through stakeholder consultation conducted by NSPs that they increase their understanding of the limitations that arise from the need to meet regulatory obligations.
Some of the key guiding principles and objectives that need to be considered include:
» Balancing legislative requirements with customer and community expectations;
» Moving away from a ‘one size fits’ all approach to a range of approaches that suit different regions or environments and aligns with risk;
» Community and local government engagement;
» Collaborative partnerships and programs;
» Public education and awareness;
» Sustainability – tree removal or planting the right trees, and having a positive net impact on the environment;
» Whole of lifecycle cost consideration (including vegetation management) approach for new infrastructure planning.
Notwithstanding the above, where there is a conflict between risk mitigation and tree amenity, NSPs are obliged, either through legislation (compliance) or duty of care, to err on the side of risk mitigation.
29
3.7 SYNTHESIS OF ‘VARIABILITY’ DIMENSIONS
As discussed in the previous sections, there are many factors driving variability in the operating context for each NSP, and for each factor the degree of variability can be substantial. For example, even on matters where it might be assumed that there should be reasonably close alignment – the clearance distance standards for a particular combination of asset class and span length, there are very substantial differences in standards. In some categories the standard variance from least to most clearance exceeds 100%. When network operating environment differences are factored in for consideration, such as the range of types and extents of different vegetation types with widely varying growth potential, the issues arising from variability come further into focus. Further complicating variability considerations is temporal variation in rainfall – while some NSP service areas may be in drought (adverse vegetation growth potential conditions), others may be experiencing well above average rainfall conditions favouring rapid growth, and others still more average conditions. It is not uncommon within a single NSP service area for some parts to be in drought and others to be experiencing wet conditions, and one half of a year might be wet and the other half dry, so even characterising what the conditions have been like in any one NSP area can be problematic.
3.8 IMPLICATIONS FOR ATTEMPTS TO BENCHMARK
The range and degree of variability issues discussed conspire to make benchmarking between NSPs highly problematic. Over any benchmarking period chosen it will be extremely difficult to conduct an apples-to-apples comparison for all the reasons outlined in the foregoing sections.
In attempting any form of comparative analysis of vegetation management outcomes, contextual information applying to the areas is vital. The following contextual information is important:
» Any differences in legislative prescriptions and clearance standards between areas being compared;
» Any differences in environmental regulatory requirements, training and competency framework requirements, and other jurisdictional influences not necessarily specific to the electricity supply sector;
» Quantitative information on the proportion of spans that require recurrent treatment, and at least some qualitative information (at least using coarse classification systems) of the density and attributes of vegetation in spans;
» Qualitative information about vegetation growth characteristics and volumes (based at least on annual rainfall and soils);
» Qualitative information about antecedent seasonal climate conditions as a proxy of growth rates (or a more direct measure);
» Details of the vegetation management work specifications being applied during the treatments;
» Qualitative information in relation to access/site difficulty in relation to applying treatment;
» The extent to which funding sources provided outside of NEM regulation (e.g. State government funded programs in response to political inquiries and Royal Commissions) create step changes in network condition potentially skewing inter-jurisdictional differences.
As set out in this section, limitations for comparing vegetation management data exist due to the differences in climate, legislation and operating environments. These differences reduce the confidence with which any comparison of rates per service across NSPs can be undertaken. The level of confidence in this information is further reduced where an NSP has not implemented a consistent vegetation management program over at least a three year period (for example, due to transitioning to compliance with new obligations during that period).
30
The Economic Benchmarking and Category Analysis RIN data that was supplied by all NSPs to the AER included statistics for the average number of trees per vegetation maintenance span for both rural and urban/CBD areas. While differences in the average number trees per span will be one influence on the average cost of clearance treatment per span, it alone does not adequately account for the wide ranging variability in vegetation dynamics.
Other factors such as bushfire risk also play a large part in vegetation clearance practices. The legislation for each State/Territory specifies different clearance requirements depending on the level of bushfire risk. This risk is greater in the southern States than in the northern and north-eastern States. This has a direct correlation to the risk of, and hence the costs for, maintaining compliance in these areas.
Whilst the granular data provided in the RIN responses can be relevant to each specific NSP for revealing trends in their own efficiencies (with the limitation that areas being compared have comparable operating environments), it provides little benefit across NSPs due to the vast differences highlighted in this report. Given the limitations in being able to compare rates per service across NSPs with any level of confidence, forecasting vegetation management expenditure therefore requires the development of a model to reflect the specific requirements of NSPs. The only valid benchmarking methodology to adopt across NSPs would be at the system level.
4. GENERAL CONCLUSION
As evidenced from the analyses in this report, there is substantial variability in the vegetation management operating context for each NSP. There are many factors driving this variability, with substantial spatial and temporal differences (from place to place, span to span, tree to tree, and year to year) and for each relevant factor the degree of variability can be substantial.
NSPs should consider these elements of significant variation when pursuing program efficiencies through gap analysis or peer review.
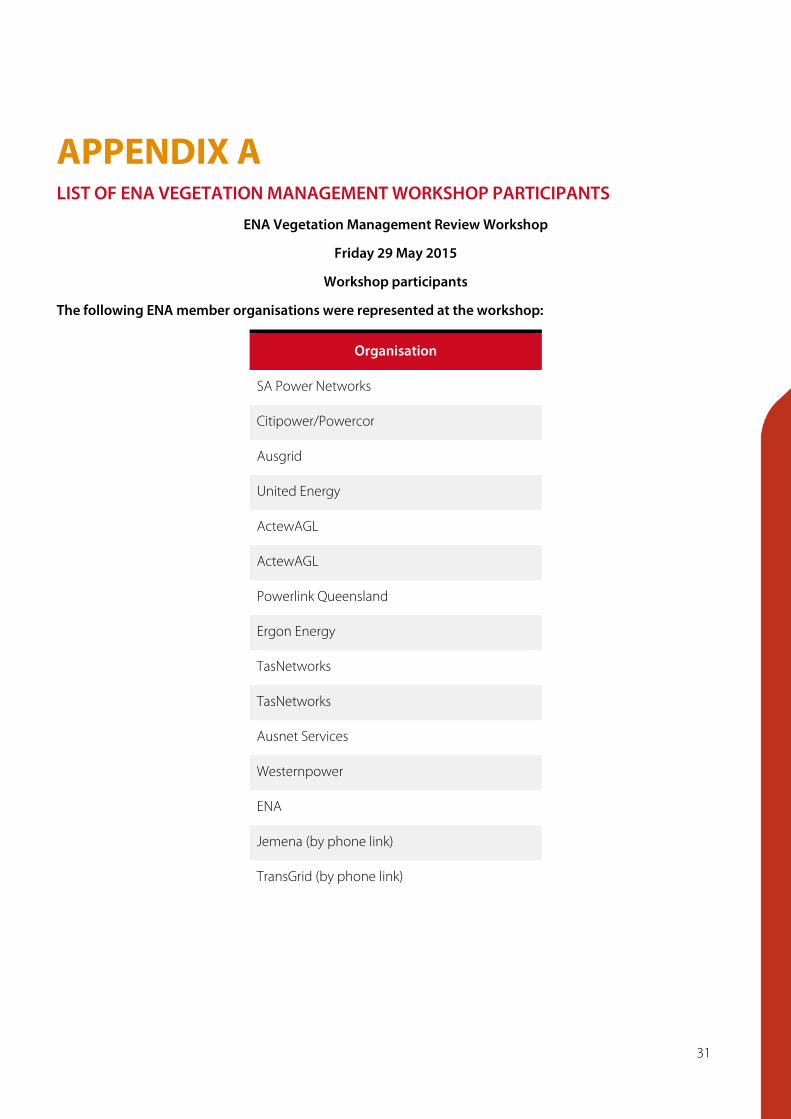
31
APPENDIX A LIST OF ENA VEGETATION MANAGEMENT WORKSHOP PARTICIPANTS
ENA Vegetation Management Review Workshop
Friday 29 May 2015
Workshop participants
The following ENA member organisations were represented at the workshop:
Organisation
SA Power Networks
Citipower/Powercor
Ausgrid
United Energy
ActewAGL
ActewAGL
Powerlink Queensland
Ergon Energy
TasNetworks
TasNetworks
Ausnet Services
Westernpower
ENA
Jemena (by phone link)
TransGrid (by phone link)

32
APPENDIX B LIST OF ACTS AND REGULATIONS SIGNIFICANTLY IMPACTING VEGETATION MANAGEMENT
Legislation and Regulations potentially affecting Vegetation Management program activities
NSW Environmental Legal and Other Requirements
Contaminated Land Management Act 1997 (NSW)
Dangerous Goods (Road and Rail Transport) Act 2008 (NSW)
Electricity Supply Act 1995 (NSW)
Energy Services Corporation Act 1995 (NSW)
Environmental Planning and Assessment Act 1979 (NSW)
Environmentally Hazardous Chemicals Act 1985 (NSW)
Fisheries Management Act 1994 (NSW)
Heritage Act 1977 (NSW)
Land Acquisition (Just Terms Compensation) Act 1991 (NSW)
National Parks and Wildlife Act 1974 (NSW)
Native Vegetation Act 2003 (NSW)
Noxious Weeds Act 1993 (NSW)
Ozone Protection Act 1989 (NSW)
Pesticides Act 1999 (NSW)
Protection of the Environment Operations Act 1997 (NSW)
Rural Fires Act 1997 (NSW)
Soil Conservation Act 1938 (NSW)
Threatened Species Conservation Act 1995 (NSW)
Water Act 1912 (NSW)
Water Management Act 2000 (NSW)
Wilderness Act 1987 (NSW)
Aboriginal and Torres Strait Islander Heritage Protection Act 1984 (Cth)
Corporations Act 2001 (Cth)
Environment Protection and Biodiversity Conservation Act 1999 (Cth)
Hazardous Waste (Regulation of Exports and Imports) Act 1989 (Cth)
National Greenhouse and Energy Reporting Act 2007 (Cth)
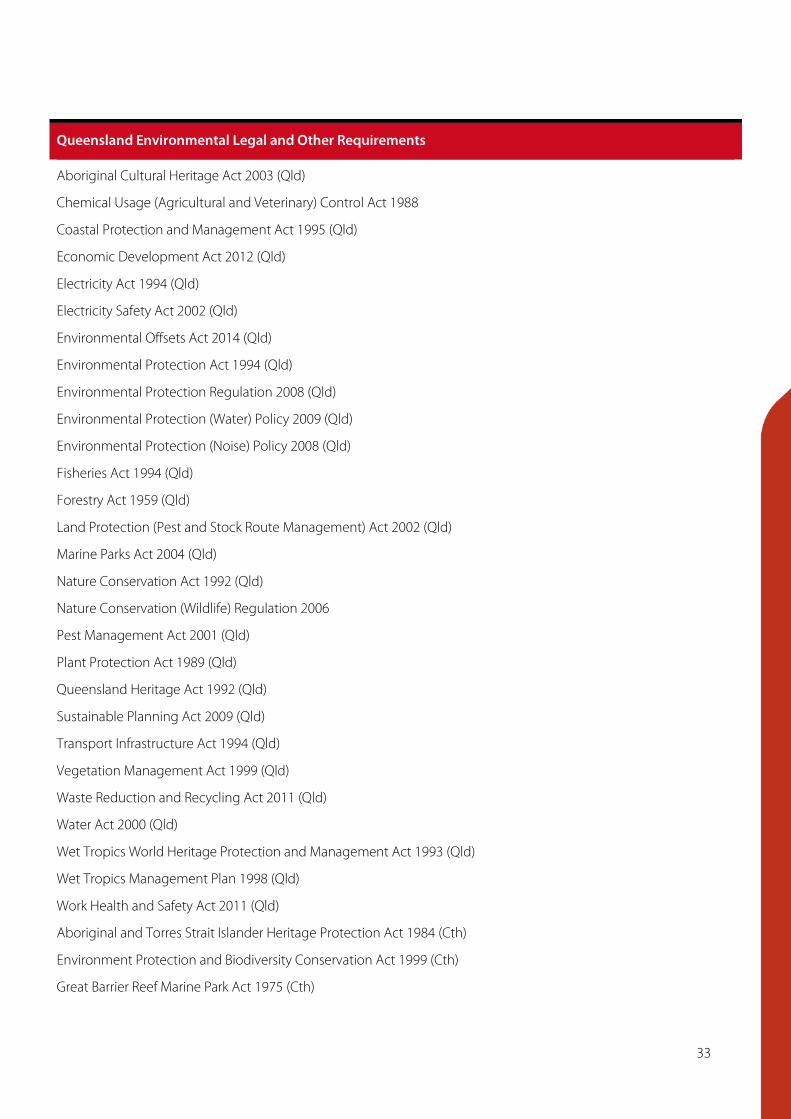
33
Queensland Environmental Legal and Other Requirements
Aboriginal Cultural Heritage Act 2003 (Qld)
Chemical Usage (Agricultural and Veterinary) Control Act 1988
Coastal Protection and Management Act 1995 (Qld)
Economic Development Act 2012 (Qld)
Electricity Act 1994 (Qld)
Electricity Safety Act 2002 (Qld)
Environmental Offsets Act 2014 (Qld)
Environmental Protection Act 1994 (Qld)
Environmental Protection Regulation 2008 (Qld)
Environmental Protection (Water) Policy 2009 (Qld)
Environmental Protection (Noise) Policy 2008 (Qld)
Fisheries Act 1994 (Qld)
Forestry Act 1959 (Qld)
Land Protection (Pest and Stock Route Management) Act 2002 (Qld)
Marine Parks Act 2004 (Qld)
Nature Conservation Act 1992 (Qld)
Nature Conservation (Wildlife) Regulation 2006
Pest Management Act 2001 (Qld)
Plant Protection Act 1989 (Qld)
Queensland Heritage Act 1992 (Qld)
Sustainable Planning Act 2009 (Qld)
Transport Infrastructure Act 1994 (Qld)
Vegetation Management Act 1999 (Qld)
Waste Reduction and Recycling Act 2011 (Qld)
Water Act 2000 (Qld)
Wet Tropics World Heritage Protection and Management Act 1993 (Qld)
Wet Tropics Management Plan 1998 (Qld)
Work Health and Safety Act 2011 (Qld)
Aboriginal and Torres Strait Islander Heritage Protection Act 1984 (Cth)
Environment Protection and Biodiversity Conservation Act 1999 (Cth)
Great Barrier Reef Marine Park Act 1975 (Cth)
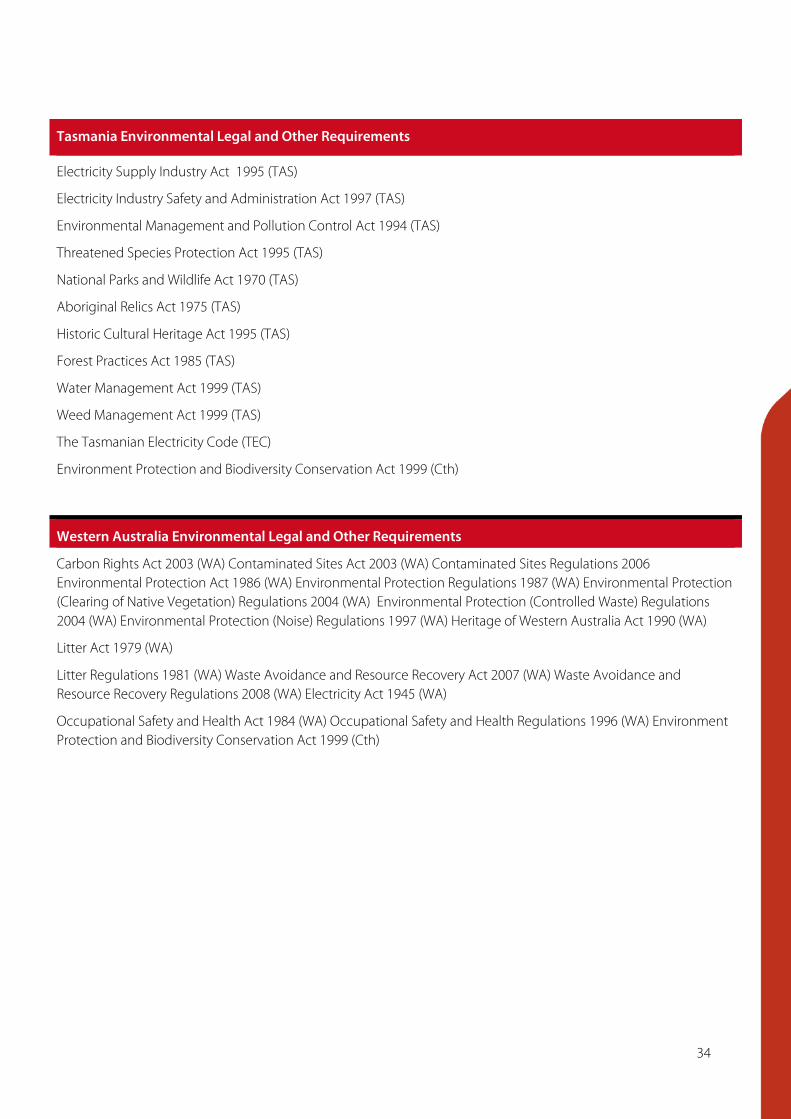
34
Tasmania Environmental Legal and Other Requirements
Electricity Supply Industry Act 1995 (TAS)
Electricity Industry Safety and Administration Act 1997 (TAS)
Environmental Management and Pollution Control Act 1994 (TAS)
Threatened Species Protection Act 1995 (TAS)
National Parks and Wildlife Act 1970 (TAS)
Aboriginal Relics Act 1975 (TAS)
Historic Cultural Heritage Act 1995 (TAS)
Forest Practices Act 1985 (TAS)
Water Management Act 1999 (TAS)
Weed Management Act 1999 (TAS)
The Tasmanian Electricity Code (TEC)
Environment Protection and Biodiversity Conservation Act 1999 (Cth)
Western Australia Environmental Legal and Other Requirements
Carbon Rights Act 2003 (WA) Contaminated Sites Act 2003 (WA) Contaminated Sites Regulations 2006 Environmental Protection Act 1986 (WA) Environmental Protection Regulations 1987 (WA) Environmental Protection (Clearing of Native Vegetation) Regulations 2004 (WA) Environmental Protection (Controlled Waste) Regulations 2004 (WA) Environmental Protection (Noise) Regulations 1997 (WA) Heritage of Western Australia Act 1990 (WA)
Litter Act 1979 (WA)
Litter Regulations 1981 (WA) Waste Avoidance and Resource Recovery Act 2007 (WA) Waste Avoidance and Resource Recovery Regulations 2008 (WA) Electricity Act 1945 (WA)
Occupational Safety and Health Act 1984 (WA) Occupational Safety and Health Regulations 1996 (WA) Environment Protection and Biodiversity Conservation Act 1999 (Cth)
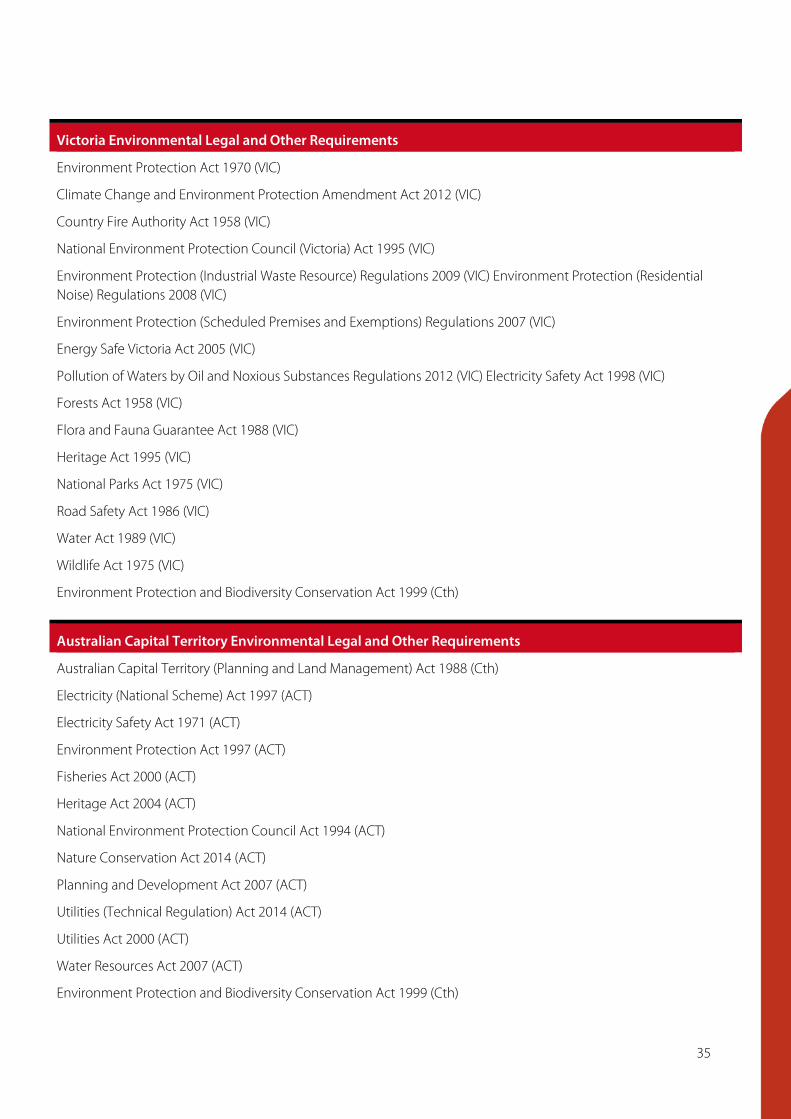
35
Victoria Environmental Legal and Other Requirements
Environment Protection Act 1970 (VIC)
Climate Change and Environment Protection Amendment Act 2012 (VIC)
Country Fire Authority Act 1958 (VIC)
National Environment Protection Council (Victoria) Act 1995 (VIC)
Environment Protection (Industrial Waste Resource) Regulations 2009 (VIC) Environment Protection (Residential Noise) Regulations 2008 (VIC)
Environment Protection (Scheduled Premises and Exemptions) Regulations 2007 (VIC)
Energy Safe Victoria Act 2005 (VIC)
Pollution of Waters by Oil and Noxious Substances Regulations 2012 (VIC) Electricity Safety Act 1998 (VIC)
Forests Act 1958 (VIC)
Flora and Fauna Guarantee Act 1988 (VIC)
Heritage Act 1995 (VIC)
National Parks Act 1975 (VIC)
Road Safety Act 1986 (VIC)
Water Act 1989 (VIC)
Wildlife Act 1975 (VIC)
Environment Protection and Biodiversity Conservation Act 1999 (Cth)
Australian Capital Territory Environmental Legal and Other Requirements
Australian Capital Territory (Planning and Land Management) Act 1988 (Cth)
Electricity (National Scheme) Act 1997 (ACT)
Electricity Safety Act 1971 (ACT)
Environment Protection Act 1997 (ACT)
Fisheries Act 2000 (ACT)
Heritage Act 2004 (ACT)
National Environment Protection Council Act 1994 (ACT)
Nature Conservation Act 2014 (ACT)
Planning and Development Act 2007 (ACT)
Utilities (Technical Regulation) Act 2014 (ACT)
Utilities Act 2000 (ACT)
Water Resources Act 2007 (ACT)
Environment Protection and Biodiversity Conservation Act 1999 (Cth)

36
Northern Territory Environmental Legal and Other Requirements
Crown Lands Act (NT)
Crown Lands Regulations (NT)
Crown Lands (Commonage) Regulations (NT)
Crown Lands (Recreation Reserve) Regulations (NT)
Environmental Assessment Administrative Procedures (NT)
Environmental Offences and Penalties Act (NT)
Environmental Offences and Penalties Regulations (NT)
Heritage Act 2012 (NT)
National Environment Protection Council (Northern Territory) Act (NT)
National Trust (Northern Territory) Act (NT)
Northern Territory Environment Protection Authority Act (NT)
Planning Act (NT)
Planning Regulations (NT)
Waste Management and Pollution Control Act (NT)
Waste Management and Pollution Control (Administration) Regulations (NT)
Electricity Reform (Safety And Technical) Regulations (NT)
National Electricity (Northern Territory) (National Uniform Legislation) Act 2015 (NT)
Utilities Commission Act (NT)
Environment Protection and Biodiversity Conservation Act 1999 (Cth)

37
South Australia Environmental Legal and Other Requirements
Climate Change and Greenhouse Emissions Reduction Act 2007 (SA)
Crown Land Management Act 2009 (SA)
Crown Land Management Regulations 2010 (SA)
Electricity Act 1996 (SA)
National Energy Retail Law (South Australia) Act 2011 (SA)
National Parks and Wildlife Act 1972 (SA)
Native Vegetation Act 1991 (SA)
Native Vegetation Regulations 2003 (SA)
Natural Resources Management Act 2004
Water Resources Act 1997 (SA)
Wilderness Protection Act 1992
Wilderness Protection Regulations 2006 (SA)
Environment Protection and Biodiversity Conservation Act 1999 (Cth)