eleana near-surface heater experiment final report. distribution unlimited release category uc-70...
TRANSCRIPT
. Wm -?
SAND80-2137Unlimited ReleaseUC-70
-- ja
r
.k..-
Eleana Near-Surface HeaterExperiment Final Report
: . . . ......
.. ^ . .- . .- .. .
* . , - .
- 7
....
;- -.: * *-. . . .
. .
.... . . -;
.. . . . . . .
Allen R. Lappin, Robert K. Thomas, David F. McVey
I
aid LmoreCalfonr" 94550 for the UntdstatesOptetof Enmg twdw Cwnat DE AO478DPQ0789_
0r0
0
0
.11z
zIF 2900-0E34O0) C
I
-. ,~~~~ ~ ~ ~ .- "--,- - -~~~~~~~~~~ ~ ~ ~ c. - ,.~~~~~~~ - -I - ..~~~~~r-

Iued by Sandia National Laboratories, operated for the United States Department of*nergy by Sandia Corporation.
NOTICZ: This report wars prepared as an account of work sponsored by an agency of theUnited States Government. Neither the United States Govermnent nor any agency thereof,nor any of their employees, nor any of their contractors. subcontractors. or theiremployee makes any warranty. expres or implied or asiumes any legl libility orreeponibillty for the accuracy, compbtene rn efub e m of any Information, apparatusproduct, or Proes disclosed, or rePeents that Its use would not infringe privatelyond rights. Reference heredn to any specific commercial product, process, or serviceby trade name, trademarn, manufacturer, or otherwise does not necessarily constitute orbnply Its endorsement, recommendation, or favoing iby the United States Government.ny ancy thereof or any of their contractor or subcontractors. The views and opinions
expresed herein do not neceerlly state or reflect those of the United StatesGovernment, any agency thereof or any of their contractors or subeontractors.
Printed in the United States of AmericaAvailable from
National Technical Information ServiceU. S. Department of Commerce5285 Port Royal RoedSpringfield, VA 22161
NTIS price codesPrinted copy: $6.00Microfiche copy: A0
-- - A . t,:4 . .
-��

SANDSO-2137 DistributionUnlimited Release Category UC-70Printed April 1981
Eleana Near-Surface HeaterExperiment Final Report
Allen R. LappinGeological Projects Division 4537
Robert K. ThomasApplied Mechanics Division 1 5521
David F. McVeyFluid Mechanics and Heat Transfer Division 11 5512
Sandia National LaboratoriesAlbuquerque, NM 87185
AbstractThis report summarizes the results of a near-surface heater experimentoperated at a depth of 23 m in argillite within the Eleana Formation onthe Nevada Test Site (NTS). The test geometrically simulated emplace-ment of a single canister of High-Level Waste (HLW) and was operatedat a power level of 2.5 kW for 21 days, followed by 3.8 kW to 250 days,when the power was turned off. Below 850 to 100'C, there was goodagreement between modeled and measured thermal results in the rockand in the emplacement hole, except for transient transport of water inthe heater hole. Above 1000 C, modeled and measured thermal resultsincreasingly diverged, indicating that the in-situ rock-mass thermalconductivity decreased as a result of dehydration more than expected onthe basis of matrix properties. Correlation of thermomechanical model-ing and field results suggests that this decrease was caused by strongcoupling of thermal and mechanical behavior of the argillite at elevatedtemperatures.No hole-wall decrepitation was observed in the experiment; this factand the correlation of modeled and measured results at lower tempera-tures indicate that there is no a priori reason to eliminate argillaceousrocks from further consideration as a host rock for nuclear wastes.However, the phenomenological complexities apparent in the test,especially those related to rock-mass dehydration, make it obvious thatadditional in-situ testing must be done before shales can be adequatelycharacterized for this purpose.
3
- II

AcknowledgmentsThis report represents the final communication
for a project some 3 years in duration. It incorporatesthe work of many people and involves conclusionsand interpretations reached in many discussions.Special thanks, however, are due J. R. Cuderman,who initiated the fielding, and D. R. Waymire (4537/1116), who joined the project in the middle of initialfielding efforts and did an excellent job of continuingthis work and of interfacing with fielding and instru-mentation personnel.
4

ContentsIntroduction ................................................................................................. 7Test Objectives ...................................................... 7Geology of the Eleana Formation ...................................................... 8
General................................................................................................8Syncline Ridge ................................................................................... 8Heater Site .......... 11
Test Geometry and Instrumentation ........................... 11Modeling ..... 18Operational History, Test Results, and Comparison WithModeling ..... 24Conclusions and Discussion ..................................................... 37APPENDIX A - Estimated Field Accuracy of Measurements ............. 39References ...................................................... 42
IllustrationsFigure
1 Index Map of Nevada Test Site (NTS) ........................................... 72 Geologic Map of the Syncline Ridge Region ................ ............... 93 X-Ray Powder Diffraction Results, Sample UE17e-3000
(The three curves are normalized to the quartz peaksat 4.26 and 3.34 A) .................. .................................... 10
4 Plan View of the Heater Site, Eleana Near-Surface HeaterExperiment......................................................................................... 13
5 Schematic Cross Section of Heater ................................................. 146 Schematic Cross Section of Heater-Emplacement Geometry..... 167 Data-Acquisition System ...................................................... 178 Finite-Element Mesh Used in Thermal Analysis ......................... 199 Heat Capacity as a Function of Temperature,
as Assumed in Thermal Model ..................................................... 1810 Assumed Constitutive (A) and Failure (B) Behavior
of Eleana Argillite ................ ..................................... 2011 Ambient-Pressure Thermal Expansion Measurements
on Eleana Argillite ................. .................................... 2112 Details of Assumed Thermal Expansion Behavior
of Eleana Argillite ................ ..................................... 2113 Calculated Zones of Tensile Fracturing at 5, 42, and
250 Days ..................................................... 2214 Calculated Radius of the Zone of Tensile Fracturing as a
Function of Time ..................................................... 2215 Calculated Radial Stress at 5, 21, and 42 Days .............. ............... 2316 Calculated Tangential Stress at 5, 21, and 42 Days ...................... 2417 In-Hole Thermal Results of the First 120 Hours of Operation
of the Full-Scale Heater ..................................................... 2518 In-Hole Thermal Results of the Full-Scale Heater Test,
Except Side-Wall Thermocouples ................................................... 2619 Argillite Temperatures at the Heater Center Plane as a
Function of Time ..................................................... 2820 Comparison of Modeled and Measured Temperatures
Parallel to Strike, 21 Days Into the Experiment ........................... 29
5
-:F- . - _ - - - -_ _ - _ ; - - _

Illustrations (cont)Figure21 Comparison of Modeled and Measured Temperatures Parallel
to Strike, 230 Days Into the Experiment ....................................... 2922 Comparison of Measured Temperatures Parallel and
Perpendicular to Strike, 230 Days Into the Experiment ............. 3023 Stresses Measured at 0, 45, and 90 Degrees to the Line
Between SI-8 and the Heater, at the Center Plane ..................... 3024 Relative Displacements of Vertical Extensometers,
Measured Relative to the Anchor at a Depth of 24.4 m ............. 3125 Volatile-Pressure Data for Holes S1-1, S1-3, and Sl-6 ................. 3326 Apparent Water-Generation Rates as a Function of Time .......... 3327 X-Ray Powder Diffraction Results, Posttest Sample Sla-. 75.7 ... 3528 X-Ray Powder Diffraction Results, Posttest Sample Slb-
77.8-78.0 ......................................................... 3529 Posttest Condition of Heater-Hole Wall at a Depth of
23.5 ......................................................... 3630 Calculated Depth-Joint Opening Relationship for
Argillaceous Rocks ......................................................... 38
TablesI Carbon Analyses of Argillite From the Eleana Formation,
Hole UE17e, NTS ......................................................... 102 Bulk Chemical Analyses of Argillaceous Rocks (Wt%) ............... 123 Trace-Element Analyses of Argillaceous Rocks (ppm) ................ 124 Drill Hole Function Summary ........................................................ 145 Instrumentation Descriptions and Method of Emplacement ..... 156 Summary of Estimated Precision in Experimental
Measurements.................................................................................... 177 Measured and Modeled Thermal Conductivities of Eleana
Argillite (W/m 0 C) ......................................................... 188 Pre- and Posttest Gas Transmissivity Measurements at Eleana
Heater Site ......................................................... 349 Posttest Bulk Chemical Analyses, Eleana Argillite ...................... 36
10 Compatibility Results of Corrosion Coupons Exposed Duringthe Eleana Heater Experiment ........................................................ 36
6

Eleana Near-Surface HeaterExperiment Final ReportIntroduction
Argillaceous rocks, i.e., those rocks containing amajor fraction of clay minerals, have long been con-sidered a potential host medium for disposal of radio-active wastes. In 1957 the National Academy of Sci-ences considered shales appropriate for this purpose.'There are several apparent advantages to using argil-laceous rocks:
1. Many argillaceous rocks, shales, and clay min-erals are known to sorb a broad range ofcations strongly.2 3
2. The in-situ permeability of many argillaceousrocks is very low.4
3. Most, but not all, shales are incapable of sup-porting open fractures at depth.56
4. Shales are largely insoluble.Two major complexities are inherent in the effort
to evaluate shales for waste management:1. Shales are mineralogically complex, contain-
ing broadly varying proportions of quartz,clay minerals, carbonates, sulfides, and organ-ic or carbonaceous material.
2. They contain appreciable volumes of water.In addition, while much is known about some
properties of argillaceous rocks, in other areas knowl-edge and experience are clearly inadequate. Only afew field tests have been operated in shales, to exam-ine their thermomechanical response to emplace-ment of a heat source, and all have been conductednear-surface. Two tests were run in the Conasauga.Formation of Tennessee,7'3 and one in the Tertiaryclays of southern Italy.' In addition, a test is underway in the Boom Clay of Belgium.
This report describes and summarizes the resultsof a near-surface heater test by Sandia National Labo-ratories in argillite from the Eleana Formation on theNevada Test Site (NTS), Nevada (Figure 1), as part ofthe Nevada Nuclear Waste Storage Investigations(NNWSI). Detailed objectives of the report are to
1. Place the Eleana Near-Surface Heater Test inperspective as regards both test objectives andgeologic setting
2. Describe the test geometry, instrumentation,and limitations
3. Describe the modeling studies ma de as part ofthe test evaluation
4. Describe experimental results and comparethem with modeled behavior
5. Compare and contrast the results of this testwith those of the Conasauga tests
Ni LincoinI County
I Clarkcounty
kmn
Figure .- Index Map of Nevada Test Site (NTS)
Test ObjectivesBecause the Eleana Near-Surface Heater Test was
the first field test in the Eeana Formation, its objec-tives were phenomenological and limited in scope,i.e., in most cases only qualitative information wassought, and only those objectives that could be ad-dressed by instrumentation extending to the surfacecould be pursued. These objectives were to
7
- - - 1 - - _ -_ _ _ -- - - ----------

1. Evaluate the possibility of compressive de-crepitation of the heater-hole wall at powerlevels representative of those expected from asingle conventional high-level waste (HLW)canister. Hole decrepitation was of concernbecause it might either decrease the in-situthermal conductivity to the point where unac-ceptable temperatures resulted from constant-power operation or might mechanically ham-per retrieval of the heater, and by inference, awaste canister.
2. Compare laboratory- and field-measuredthermal responses of argillite in the EleanaFormation. This was of interest because onlythe in-situ response would include the effectsof joints, inclined layering, and possiblesteam transport near the emplacement hole;the potential extent of these effects was un-known.
3. Identify phenomenological surprises-for ex-ample, how water contained in the rockwould behave on heating.
4. Examine some of the instrumentation needsthat would arise in a further effort to evaluateargillaceous rocks by means of in-situ tests.
Geology of the Eleana Formation
GeneralThe Eleana Formation'0 is one of a series of lateral-
ly equivalent formations deposited during and as aresult of the Antler Orogeny.1' Rocks in this forma-tion range from Upper Devonian to Lower Pennsyl-vanian in age, occur within an elongate trough ex-tending from southern California to the Canadianborder, and include a broad range of shales, argillites,siltstones, sandstones, conglomerates, and limes-tones. Although the Eleana Formation itself is de-fined over only a limited area,' 0 equivalent rocksoccur widely in Nevada and Utah.'2
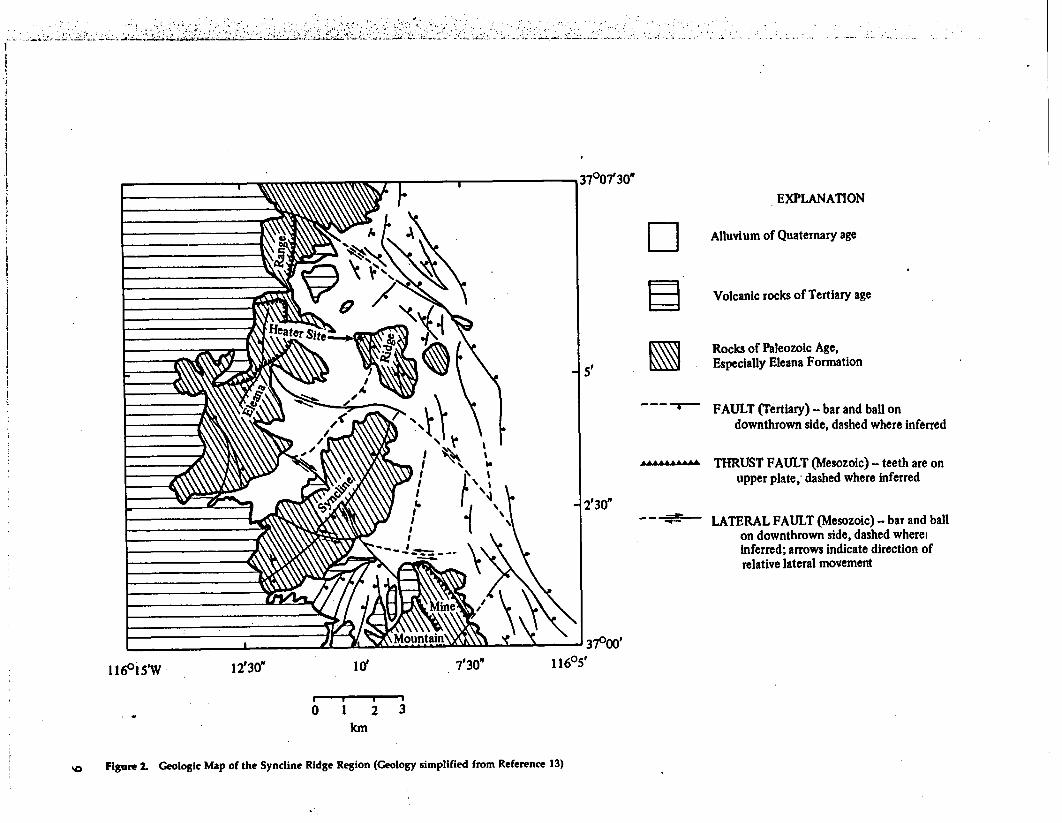
Syncline RidgeWithin the area on and near NTS, the Eleana
Formation outcrops abundantly. In the SynclineRidge area (see Figures 1 and 2), two structuralblocks, possibly of repository size, are underlain bythick sections of the Eleana Formation.'3 For thisreason, a program was launched in FY 1976 to investi-gate the feasibility of emplacing nuclear wastes in theEleana Formation on NTS, with major emphasis onSyncline Ridge.
On NTS, the Eleana Formation is subdividedinto ten units designated A through J (from thebottom up), and totaling some 3000 m or more inthickness." 3 Of the various units, units A through D,F, and G are predominantly quartzites and conglom-erates, and contain only minor argillite and limes-tone. Subunit I is made up of thin-bedded limestones.
Units E, H, G, and J are predominantly argillite, afine-grained metamorphic equivalent of siltstone orshale. High-quartz argillites are metamorphosed silt-stones, while high-clay argillites (argillaceous argil-lite) are metamorphosed shales. In general, argillitein these units is highly siliceous and relatively low inclays, apparently because of its derivation from Pa-leozoic cherts to the west.'3 The major exception is theuppermost unit of the Eleana, Unit J. It is this unitthat underlies most of the Syncline Ridge area of NTSand is dealt with in the rest of this report.
As part of the exploration program in argillite,Drillhole UE17e was drilled on the west flank ofSyncline Ridge during early FY 1977.4 Hole UE17e iswithin 100 m of the near-surface experiment de-scribed here. In UE17e, the first 74 m of drillingencountered a quartzite subunit of high- and low-quartz argillites interbedded with limestones, silt-stones, and quartzites. From a depth of 74 to 914 m(the total depth), the hole was in the argillite subunitof Unit J. This subunit is made up of more than 99%argillite and contains only a very few minor quartzitebeds.4
The overall mineral assemblage of argillite fromHole UE17e was:
quartz + illite' +/- kaolinite (chamosite)+ - pyrophyllite + /- siderite + /- chlorite+ /- plagioclase + /- potassium feldspar+ /- pyrite + /- calcite + /- vermiculite.' 5 16
Quartz contents of 15 samples, as determined byX-ray analysis, ranged from a low of 15 to a high of48 wt%.' 7 Based on these results, Hodson and Hooverarbitrarily distinguished between high- and low-quartz argillite at 25 wt% quartz. Using this criterion,they reported that 80% of the argillite in UE17e washigh-quartz, and 20% is low-quartz.
In almost all samples, the dominant clay mineralwas a poorly crystalline mixed-layer clay, as indicatedby the tracings in Figure 3. The 001 (basal) peak of theillite was generally at a spacing of 10.2 A to 10.4 A.The peak was lowered and shifted to lower basalspacing by treatment with ethylene glycol, because ofinteraction of the 001 reflection of illite with the 002(-8.5 A) reflection of expanded montmorillonite.Heating of samples at 400°C for 24 hours resulted inmarked sharpening and increased height of the basalpeak at a spacing of 9.9 A to 10.1 A, which suggests
8
37O07'30"~\\\\\\WRY$~ 1~1.EXPLANATION
El1 Alluvium of Quaternary age
Volcanic rocks of Tertiary age
Al Rocks of Paleozoic Age,Especially Eleana Formation
-~ *- ' FAULT (Tertiary) - bar and ball ondownthrown side, dashed where inferred
THRUST FAULT (Mesozoic) - teeth are onupper plate, dashed where inferred
~ ~ = LATERAL FAULT (Mesozoic) - bar and ballon downthrown side, dashed whereiinferred; arrows indicate direction ofrelative lateral movement
1160°S'W 12'30" 10' 7'30" 1160S'
* ,
01 2 3km
so0 Figure 2. Geologic Map of the Syncline Ridge Region (Geology simplified from Reference 13)

that the mixed-layer illite in the Eleana containsvariable amounts of expandable phase. Since thebasal spacing also varied after heating, the illiteapparently often includes chloritic material as well.
kaolinite alone, coupled with the fact that peaks wereoften present at the 002 positions for both kaolinite(3.58 A) and chamosite (3.51 A to 3.53 A). The pres-ence of chamosite is consistent with the widespreadpresence of siderite, (FeCO3 ), generally the dominantor only carbonate present.
Pyrophyllite was quite common in samples fromthe lower part of UE17e. This phase, which indicatesat least local instability of the assemblage kaoliniteplus quartz, is common in many of the Paleozoic"shales" of Nevada and Utah. 8 19 The basal spacing ofthe pyrophyllite in UE17e generally exceeded thetextbook value; it was from 9.2 A to 9.4 A, rather thanfrom 9.14 A to 9.21 A (see Figure 3). Based on the verysmall shifts in 001 peak position on heating, it isconcluded that any rectorite-type interlayering in thepyrophyllite is quite minor.
The Eleana argillite from Hole UE17e also con-tains appreciable amounts of carbonaceous material. 2 0
Table 1 presents the results of carbon analyses of 10samples from depths of between 472 and 914 m. Theargillite frequently contained -0.5 wt% organic car-bon, as verified by qualitative gas chromatograph-mass spectrometer scans in which heavy organicswere consistently evolved at temperatures above1000 to 150'C. Secondly, the similarity between totalcarbon contents at 10000 and 1500'C indicates thatthere is no well-crystallized or pyrolitic graphite inthe Eleana; however, the average difference of0.9 wt% between total carbon contents measured atthese temperatures and at 500'C indicates that par-tially or poorly crystallized graphitic material wasgenerally present. This is apparently responsible forthe strong sorption of technetium (Tc) exhibited bysome argillite. 21
3.5 4 5 7 91011 1416 29d (A)
Figure 3. X-Ray Powder Diffraction Results, Sample UE17e-3000(The three curves are normalized to the quartz peaks at 4.26 and3.34 A)
Many samples appeared to contain the septochlor-ite chamosite, as well as kaolinite. This interpretationis based on the frequent position of a broad 7 A peakat slightly lower '20 than would be expected for
Table 1. Carbon Analyses of Argillite From the Eleana Formation, HoleUE17e, NTS (Data from Reference 20.)
AnalysisTemperature
(0C)Type of CarbonMeasured
wt%(average
10 samples)
StandardDeviation
(wt%)
80 Mineral carbon, evaluatedby CO2 evolution
500 Organic carbon, may includeslight relict mineral carbon
1000 Total carbon, exceptpyrolitic graphite,if present
* 1500 Total carbon, includingpyrolitic graphite
0.48
0.49
1.83
1.87
0.27
0.11
0.38
0.36
10

Chemical analyses of several samples of Eleana,both from Hole UE17e and from the heater site, arecompiled and compared with compositions of otherargillaceous rocks in Table 2. The alumina content ofanalyzed samples from the Eleana was higher thanfor all other rock types except residual clay. Becauseof the presence of siderite, the Fe2O3/FeO ratio waslower than for any other rock type. The Eleana'scontent of potentially leachable cations such as Mg,Ca, Na, and K is lower than for any other rock typeexcept residual clay. It thus appears that the bulkcomposition of argillite from the Eleana Formation istransitional between that of representative normalshales and that of a residual clay. This fact almostcertainly reflects the provenance of the formation;i.e., its derivation from first- and/or second-genera-tion silicic rocks to the west.
Trace-element data for the Eleana are given inTable 3 and compared with data for average shalesand the Pierre Formation. Except for Ba and C1, thetrace-element contents of both the at-depth and thenear-surface Eleana appear to be within the range forother argillaceous rocks. The Eleana's markedly low-er content of Cl would appear explainable by itsmetamorphism and resultant depletion of pore-waterCl.29
Fracturing and jointing are pervasive in HoleUE17e.14 The majority of fractures are subparallel tothe bedding, which dips between 120 and 80°. Frac-ture frequencies range from 3.4 to 9.4/m in the upper153 m of cored interval. In the lower portion of thehole, fracture frequency ranges from 1.4 to 5.91m,averaging 3.5. In general, sections of predominantlyhigh-quartz argillite have lower fracture frequenciesthan those that are mainly low-quartz argillite (argil-laceous argillite). Portions of the high-quartz argillitemight be competent for construction purposes; thebulk of the argillaceous argillite would not.1'4
Syncline Ridge has been affected by Paleozoic,Mesozoic, and Tertiary deformations.13 Paleozoic de-formations, too large in scale to be evident over sucha small area, are related to periodic deformations andshifts in the position of the axis of the Antler Fore-deep." Mesozoic deformation appears responsiblenot only for the major folding, thrust faulting, andlateral faulting, but also for some highly inclinedfaulting (see Figure 2). Relatively minor Tertiaryfaults (largely normal) form the eastern boundary ofthe area, and lie near or just beyond other boundariesof defined structural blocks.'3 It is in part this com-plexity, which became apparent in structural andgeophysical investigations,3 w that caused deferral offurther exploratory activity in the Syncline Ridgearea.
Heater SiteAs shown in Figure 1, the site for the Eleana Near-
Surface Heater Experiment was on the western flanksof Syncline Ridge. The experiment was verticallyemplaced at a heater center-plane depth of 22.9 m.
The experimental site is capped by thin-beddedquartzites -5 m thick; these quartzites are underlainto a depth of 16 M3n by a gradational unit of quartzite,siltstone, claystone, and argillite. This capping byquartzites probably accounts for the fact that obviousmacroscopic iron staining of the argillite at the heatersite extends to a depth of only 16 to 17 m; argillite atother locations is weathered to much greater depths.The lower limit of this staining was used to deter-mine a minimum experiment depth, since it approxi-mately delineates the depth where groundwaters areno longer strongly oxidizing. In fact, the mineralogyof samples from the near-surface instrumentationholes was indistinguishable from that of samplescollected at depth in Hole UE17e, except that pyro-phyllite and pyrite were absent in the shallow holes.Pyrophyllite was also absent in other relatively shal-low holes in the area, as well as in Hole UEI, whichextended to a depth of 1524 m. Its absence may becontrolled by either stratigraphic compositional vari-ations or by near-surface weathering. The absence ofpyrite appears to indicate that, although downward-moving groundwaters no longer precipitate iron ox-ides at the depth of the experiment, they are stilloxidizing enough to make pyrite unstable.
From a mechanical point of view, argillite fromthe lower portions of the experimental holes is simi-lar to that from the upper portion of Hole UE17e. Thepredominant joint orientation is subparallel to bed-ding, which dips to the southeast at about 30°.
Test Geometry andInstrumentation
Figure 4 shows drill-hole locations for the heaterexperiment. A 6 x 7.3 m concrete pad was poured overthe site, and drill collars set before drilling. All drillholes were cased and cemented to a depth of 18 m.The holes were first drilled to casing depth andcasings cemented in place. After the grout set, theholes were extended to nominal depth. The uncasedportions of drill holes were carefully sealed fromwater migration through the obviously weatheredzone. This procedure did not prevent penetration ofsurface waters to experiment depths presumably be-cause at least some joints remained open to depthsbelow the bottom of the casing.
11
., . .. r .. _ .... b . ..

Table 2. Bulk Chemical Analyses of Argillaceous Rocks (Wt%) (Argillite from Eleana Formation)
Oxide
sio2A1 2 03
Fe03FeOMgOCaONa2pK2 0
M 8 0+ C.O+
K2 0+Na2OH2 0+C02 (tot)TiO2P2 05
MnOS
Hole UE17eI2Average Standard
(8 samples) Deviation
58.33 3.7320.20 3.67
0.75 0.344.92 1.581.79 0.260.70 0.280.89 0,191.49 0.36
Heater Site23Average Standard
(5 samples) Deviation
59.48 1.6519.40 1.050.77 0.153.99 0.311.35 0.060.80 0.050.33 0.011.44 0.08
AveragePaleozoicShale2 '
(51 samples)
60.1516.45
4.042.902.321.411.013.60
8.346.170.760.15trace
0.58(SO3)
ResidualClay 2 ' on
Norton Gneiss
55.0726.14
3.722.530.330.160.050.14
0.6810.75
1.030.110.030.04
Pierre Shale(232 Samples)25
StandardAverage Deviation
60.8 7.914.4 2.5
3.4 1.41.1 1.22.2 1.02.6 0.451.1 0.562.4 0.57
4.879.490.850.260.070.24
0.960.070.060.040.26
3.9210.880.890.200.09
<0.1
0.380.160.010.01
8.37.50.0.580.14
0.37
1.770.120.07
1.1
a Does not include carbon
Table 3. Trace-Element Analyses of Argillaceous Rocks (ppm)
Hole UE17e26Average Standard
(8 Sa) DeviationElementBaCl -
CoCrCuMoPbVZn
3636
154248
23177112
134
45174
4228
HeaterAverage
(6 Sa)994029
112202
1512561
Site"StandardDeviation
17109
33617
2820
AverageShale2 8
580180
1990453
2013095
OrdinaryPierreShale"
730130138036
I22
170130

0 TH *3 ( kW Scale Test)
TH'Z (3.5kW Scate Test)O 6 m (44')
i -
Figure 4. Plan View of the Heater Site, Eleana Near-Surface Heater Experiment
Drill holes along the radius between Sl-l andS1-13 are parallel to the strike of the argillite (N1O0 E)and contained the primary thermal instrumentationfor the experiment. The heater was installed in SI-i.Thermocouples installed normal to strike and alongthe radius between Si-i and S1-15 provided a limitedmeasurement of anisotropic thermal behavior. Holesalong the radius between Si-i and S1-14 were used tomonitor volatile pressures, while vertical rod exten-someters were emplaced in Holes S1-7, S-9, andSi-li. Hole S1-8 was used for emplacing vibrating-wire stress gauges. Table 4 specifies the detailedfunctions of each drill hole; Table 5 gives instrumen-tation details for all instrumentation except the heat-er.
Hole S-1 is nominally 0.36 m in diameter. Allother holes are 0.10 m in nominal diameter. The
nominal depth of the holes is between 24.4 and 28 m.Exceptions were Si-1, which was extended at 0.20 mdiameter to 33.5 m, and S1-3, extended at 0.10 mdiameter to 35 m.
The heater used, shown schematically in Figure 5,consisted of a sealed cylinder of 304 stainless steelcontaining radiative heating elements. Nominal in-side diameter of the cylinder was 0.30 m; the outsidediameter was 0.32 m. The heating elements weretubular Chromalux units 0.013 m in diameter, eachrated at 6 kW maximum power. The elements consist-ed of nichrome resistance wire twisted into a helicalcoil, embedded in MgO ceramic, and ehclosed in astainless-steel sheath. Each element was in the formof a hairpin loop -3.7 m long. In this configuration,the heated length of each loop was 2.9 m. A heavyconductor on the last 0.75 m at each end of each
13

element replaced the nichrome wire; thus the electri-cal connections at the ends of the elements were notheated directly. The heater contained six elementloops wired in two sets of three for three-phase,240-V operation.
Table 4. Drill Hole Function Summary
Hole FunctionSI-I Heater hole, sump for water collection,
with rock-wall thermocouples at 22.9 mS1-2 Measure temperature at 18.6, 19.2, 20.1,
21.0, 21.95, 22.9, 23.8, 24.7, 25.6, and 27.1 mS1-3 Measure volatile pressure at 18.3 m (bot-
tom of casing), emplace pump for waterremoval, monitor water temperature
S1-4 Measure temperatures at same depths as inSi-2
SI-5 Measure temperatures at 19.2, 20.1, 21.0,21.95, 22.9, 23.8, and 24.7 m
S1-6 Measure volatile pressure at bottom of cas-ing (18.3 m)
51-7 Measure vertical displacement betweensurface and depths of 19.8, 21.3, 22.9, and24.4 m; record temperatures at 19.8 and24.4 m
S1-8 Measure radial, tangential, and intermedi-ate stresses at 22.9 m
S1-9 Same as S1-7Si-lo Measure temperatures at 19.2, 21.0, 21.95,
22.9, 23.8, and 25 mSi-11 Same as S1-7 and S1-9Sl-12 Measure temperatures at 19.2, 21.0, 21.95,
and 22.9 mS1-13 Same as S1-10S1-14 Same as S1-6S1-15 Same as S1-12S1-16 Measure background temperatures at 22.6
and 23.2 m
. I 6
0
B
00
3
Heater Skin, 2.91 m
- Heater Skin, 2.26 m
Heater Skin, 1.52 m
- . Heater Skin, 0.76 m
- , Heater Skin, 0.09 m
L . Heater Skin, 3.75 m
= = --- I-Junction Section
i< Cold Section
Figure 5. Schematic Cross Section of Heater (Positions of diag-nostic thermocouples are also shown)
14

Table 5. Instrumentation Descriptions and Method of Emplacement
MeasurementTemperature
Transducer TypeThermocouples
Thermocouples
Thermocouples
Volatile orGas Pressures
VerticalDisplacement
Stress
GasTransmissivity
Gulton TypeGS613 Diaphragm0 to 100 psi range
Invar RodExtensometers
Irad-Crearevibrating-wire gaugewith short-term200'C capability.
Geiger-Muller tubes
DescriptionChromel-Constantan Type-E, in(Mg-O filled) stainless-steel sheath.TCs were strapped to rigid PVCtubing for installation and thengrouted in place by injection grout-ing through tubing. Alignment con-trolled by alignment of tubing.Same as above except clamped tointernal heater parts or in singlevertical channel (covered) on heatersurface.Chromel-Alumel Type K mountedon top and bottom verticalextensometer anchors.Installed either at drill collar or atbottom of packers. Packers locatedjust above the bottom of casing inholes designated for pressure data,and also in the heater hole.Four extensometer rods used in eachhole. Each rod was stainless steel tobottom depth of casing, and thenInvar to TD, where it was anchored tohole wall. The top end of each rodwas attached to an LVDT, the electri-cal readout of which was calibratedagainst displacement.Gauges emplaced in aluminumtubing, calibrated, and potted beforeinstallation. They were grouted indrill holes with an expandablegrout, thus relieving some of thepreapplied stress.Kr's was injected in main heaterhole, or surroundinginstrumentation hole. A string offour probes installed in aneighboring drill hole detected timeof arrival and relative intensity oftracer gas. Experiment performedboth pre- and posttest.
Specific PurposeThermal fieldmeasurementsin formation
Heater diagnostics andskin temperatures
Extensometer datacorrection as a functionof temperatureMonitor gas pressures inthe formation
Measurements of changesin vertical distances inthe formation as a resultof heat.
Obtain qualitativeinformation of thermallyinduced horizontalstress charges
Obtain qualitative dataon amount and locationof test-inducedfracturing of rock
15

The overall heater assembly consisted of (1) theheated region, (2) the cold section, and (3) the junc-tion section. The region containing the heated por-tion of the elements was backfilled with air at ambi-ent pressure; the cold section containing theunheated portions of the heating elements was filledwith expanded vermiculite. (This high-porosity ma-terial had a low thermal conductivity and was used tolimit heat losses from the end of the heater.) Electricalpower connections to the heater elements were madein the junction section. Two pipes 0.05 m in diameter,extending to the surface, were connected to the junc-tion section. One carried the power leads; the otherwas a conduit for diagnostic thermocouples insideand on the surface of the heater. Air was forced downthe power lead conduit and back out the thermocou-ple conduit, cooling the junction section.
Figure 6 is a generalized schematic of the heater-emplacement geometry. The heater was initially sus-pended -0.03 m above the top of sump hole, but maywell have been resting on the shoulder after heating,because of stretching of the suspension cable. Em-placement in an open hole permitted removal of theheater in case of electronic failure, and also permittedposttest heater removal and examination of theheater-hole wall.
A batt of fiberglass insulation bound with stringwas located just above the heater. At emplacementthere was a gap of 0.15 m between the bottom of theinsulation and the top of the heater. The fiberglasswas released to expand against the holewall by burn-ing through the string with a heated nichrome wireafter heater installation. The insulation was intendedto limit not only end losses of heat from the heater,but also convective transport of heat and/or fluidsabove the heater. A pneumatic packer installed nearthe bottom of the casing isolated the uncased part ofthe heater hole from the surface.
The data-acquisition system used in the experi-ment is shown schematically in Figure 7. A JohnFluke data logger was the central element. Mostthermocouple data were read directly into the loggerat preset intervals ranging from minutes to hours.The data logger printed out these data for all chan-nels in sequence at each print time and entered themon magnetic tape. Vertical-displacement, pressure,and heater-diagnostic data entered a low-level scan-ner that fed into the data logger; the function of thelow-level scanner was to increase the total number ofdata channels to 120. The Creare-IRAD stress-gaugedata were digital and needed to be converted toanalog form before printout. A microprocessor con-trolled a printout terminal; thus data for successiveprintouts of each channel appeared in sequence.
The data-acquisition system was mounted in a vanand powered by a diesel generator with a backupdemand-start generator. A telephone dialer systeminterfaced with the data logger called the operatoroff-hours in the event of heater malfunction. A Var-iac power control unit for manually controlled con-stant power operation of the heater was also locatedin the van. Data processing of the magnetic tapes wasdone at Sandia's Data Reduction Center in Albuquer-que.
Table 6 lists the estimated precision of the variousinstrumentation used in the heater test. The valuesgiven, however, do not include possible field-relatedeffects, nor temperature effects in the case ofextensometer and stress data. Accuracy of the variousmeasurements in the field is considered in AppendixA. Estimated limitations are such that all measure-ments, except for the temperatures within the argil-lite, must be regarded as qualitative.
Figure 6. Schematic Cross Section of Heater-Emplacement Geom-etry
16

Figure 7. Data-Acquisition System
Table 6. Summary of Estimated Precision in Experimental Measurements.'
MeasurementHeater Power
TemperatureStress Change
Vertical Displacement
Gas Pressure
TransmissivityWater Collection
TransducerMagtrol Model 4610Digital Power AnalyzerThermocouplesCreare VibratingWire CagesPotentiometer-extensometers
Gulton GS613 DiaphragmGagesKR 85 Flow IntensitiesBucket
Experimental Error±0.3% of reading±0.05%±10 C± 15% at ambienttemperature±13x 10-5matambient temperature±1%
±? qualitative only? apparently variable
The experimental errors listed are estimates of precision, and do not include anestimate of emplacement-related limitations.
17

ModelingIt is assumed that the results of field tests can be
evaluated only through description and modeling ofthe phenomena observed during testing. Therefore,it is necessary to describe the modeling carried outfor the Eleana heater test before discussing results.
Thermal calculations were made with the finite-element code COYOTE.32 The axisymmetric modelconfiguration consisted of 360 quadrilateral ele-ments, each with eight nodal points (Figure 8). Theregion included in the analysis was a cylinder 13.5 min radius and 42.6 m in length, with the 0.178-m-radius heater hole in the center; outer boundarieswere assumed adiabatic. Initial temperature was set at18'C. The argillite was assumed uniform throughoutthe modeled volume, with the orthotropic, tempera-ture-dependent thermal conductivities listed inTable 7. Heat capacity values used are shown inFigure 9.
Note that the data in Table 7 and Figure 9 ignoretwo potentially important factors. Thermal conduc-tivity parallel to the axis of core material was mea-sured by means of guarded-end-plate measurements.Radial measurements were made with transient-line-source techniques. The fact that layering was in-clined at - 30° was ignored. In radial measurements,the data reduction scheme assumes that the materialis radially symmetrical. Thus the conductivity data,while gathered in a manner consistent with the mod-eling approach used, involved some compromise.
Specific heat data shown in Figure 9 were modi-fied from experimental data by removing the spikenear 1000 C, caused by vaporization of water remain-ing after pulverizing of the samples, and replacing itwith the heat of vaporization of 3% by weight water.For compatibility with the computer code, vaporiza-tion was assumed to occur between 50° to 105'C. Thistreatment of water volatilization had two implica-tions. First, it assumed that dewatering is not instan-taneous at 100'C. This is consistent with more recentwork on welded tuffs, which indicates that much ofthe water loss from the matrix of water-bearing rocksmay occur by vapor-pressure-driven diffusion ratherthan by simple boiling. 3 3 The temperature rangesover which such a mechanism operate depend onboth the local geometry and heating rates. Secondly,the heat capacity treatment used here assumedde facto that the water vapor was instantaneouslyremoved from the system after generation, since nofurther account was kept of its behavior. This obvi-ously makes the treatment incomplete in any portionof the model where there is appreciable fluid tran-port.
Table 7. Measured and Modeled ThermalConductivities of Eleana Argillite (W/m 0 C)
MeasuredT(0 C)
255075
100150200250300350
ModeledT(C)
20<T'8080<T<150T- 150
A
1.741.73- 1.62*1.491.421.361.311.29
C2.15
2.15-0.0089(T-80)1 .53-0.0010(T-150)
B2.432.17
2.061.801.671.691.731.61
D2.75
2.75-0.0143(T-80)1.75
Key to Letter CodingA Average of two samples measured parallel to core
axisB Average of four samples measured radial to core axisC Perpendicular to modeled layeringD Parallel to modeled layering
'Decrease results from holding sample near 100'C for24 hours
0.60
0.40-
0.20
O LalI 100 200 300
T (C)
Figure 9. Heat Capacity as a Function of Temperature, as As-sumed in Thermal Model
18

4
E Et
o 63r mm
E0
6a'S
.EM
Si
S
r'oNof
E
II
x
19.8m
c;a
EO-ro
F xm E
to
' I04-
.8m c
0I0K
\0
K_
I
(NOT TO SCALE)
19
I-F - 13.5 m - .Radius
Figure 8. Finite-Element Mesh Used in Thermal Analysis
19
Heat transfer across the air gap between the heat-er and the rock was assumed to be by means ofcombined radiation and conduction. Vertical and ra-dial convection was ignored in the air gap oppositethe heated section of heater because the ratio be-tween heat transferred across a gap by convectionplus conduction to that transferred by conductionalone is near unity for the range of gap Rayleighnumbers in the experiment configurations In addi-tion, the ratio of gap length to gap width was largeenough to preclude significant vertical transport byconvection. It was assumed that all of the powerinput into the heater was radiated and/or conductedradially across the gap between the heater and rock.The modeled results should, therefore, result inmaximum estimated temperatures. A literature-de-rived temperature-dependent heater surface emissi-vitv was also used. Details of the effective conductiv-ity formalism are given in References 35 and 36.
In the thermal model, it was assumed that theinsulation at the top of the heater was at a uniformtemperature of 90'C from the beginning of the test,as was the top surface of the heater. The conductivityof the cold section of the heater was assumed to be1 W/m0 C, and conductive heat transfer from the topof the heated section to the top of the heater wasallowed. The top surface of the insulation batt andthe hole wall at all points above this level wereassumed adiabatic. Results of thermal modeling aredescribed at the same time as experimental results,since temperature measurements were the mostabundant measurements made during the test.
An analysis of thermal stresses was made usingSandia's modification of the ADINA code.37 Thisgeneral-purpose linear and nonlinear finite-elementprogram for static and dynamic problems contains anelement library with 1-D, 2-D, and 3-D continuumelements, in addition to an extensive materials li-brary. Transient temperature distributions calculatedwith the COYOTE code were input to the stresscalculation. Hence, the overall geometry and dimen-sions of the analysis regions were the same. Themechanical model had 459 four-point quadrilateralelements, with 500 nodal points. Initial in-situ stress-es were in most cases not considered in the analysis.The outer and bottom boundaries of the model wereassumed fixed with regard to radial and verticaldisplacements, respectively. The ground surface andborehole surfaces were assumed traction-free.
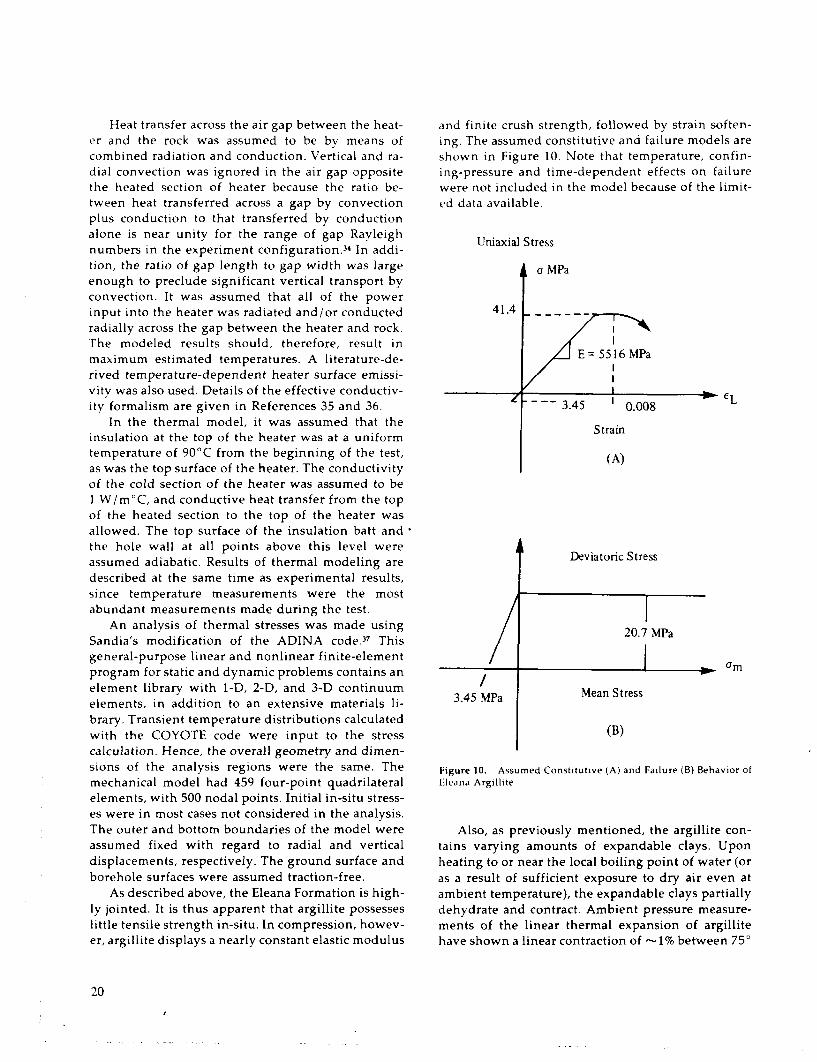
As described above, the Eleana Formation is high-ly jointed. It is thus apparent that argillite possesseslittle tensile strength in-situ. In compression, howev-er, argillite displays a nearly constant elastic modulus
and finite crush strength, followed by strain soften-ing. The assumed constitutive and failure models areshown in Figure 10. Note that temperature, confin-ing-pressure and time-dependent effects on failurewere not included in the model because of the limit-ed data available.
Uniaxial Stress
a MPa
EL
Strain
(A)
JiDeviatoric Stress
20.7 MPa
IG arm1'
3.45 MPa Mean Stress
I (B)
Figure 10. Assumed Constitutive (A) and Failure (B) Behavior ofEleana Argillite
Also, as previously mentioned, the argillite con-tains varying amounts of expandable clays. Uponheating to or near the local boiling point of water (oras a result of sufficient exposure to dry air even atambient temperature), the expandable clays partiallydehydrate and contract. Ambient pressure measure-ments of the linear thermal expansion of argillitehave shown a linear contraction of 1% between 750
20

and 125'C, followed by a nominal expansion at high-er temperatures (Figure 11).38 Based on these data, thethermal expansion behavior shown in Figure 12 wasassumed for the argillite.
Figure 11. Ambient-Pressure Thermal Expansion Measurementson Eleana Argillite (Behavior assumed in mechanical modeling isshown by heavy dashed line)
dehydration. Second, it was assumed that the argil-lite, once dehydrated, did not rehydrate and there-fore did not follow in reverse the same curve oncooling as on heating. Also note the assumption thatthe argillite would begin to dehydrate near 750Cregardless of the local heating rate.
Tensile failure was calculated to occur in specificstress-dependent orientations if a principal tensilestress exceeded the tensile failure stress of the argil-lite. In this case, it was assumed that a plane of failuredeveloped perpendicular to the stress direction, inde-pendent of preexisting joints. The calculated effect ofthis failure was to reduce both the normal and shearstiffnesses across the plane of failure, and to releasethe corresponding normal stress. This calculationalprocedure markedly limited the propagation of ten-sile stress relative to similar calculations that did notinclude a tension cutoff.
In summary, the thermal and mechanical modelsused for modeling the Eleana Near-Surface HeaterExperiment were current, but did not result fromextensive code development. Anisotropic thermalproperties were considered only to a limited extent.Dehydration of the rock mass was considered only bymodifying the terms of the heat capacity and thermalconductivity. No consideration was given to the va-porized water because of the implicit assumption thatit left the system immediately after generation.
No attempt was made to couple the mechanicalcalculations with potential changes in thermal prop-erties resulting from mechanical deformation. Suchcoupling might prove of major importance, but itsunderstanding awaits further code development andanalysis of field data. In the approach used here,joints were predicted to form only as a result ofthermal contraction and were always oriented eitheralong conical or cylindrical sections centered on theheater or on plane surfaces parallel to the heater axis.In reality, given the inherently complex jointing ofargillaceous rocks, radial anisotropy could probablybe imposed on in-situ thermal response independentof bedding orientation, as a result of radially aniso-tropic joint distributions Because they are so strong-ly linked to overall interpretation of the experiment,yet could not be directly verified or contradicted byfield measurements, the results of mechanical model-ing studies are described below.
It was assumed that argillite began to contract at750C, and that calculated tensional stresses resultingfrom contraction were accommodated by the openingof joints within the volume of rock at temperatures> -850 C. The calculated extents of such zones atthree different times in the experiment are shown inFigure 13.
Figure 12. Details of Assumed Thermal Expansion Behavior ofEleana Argillite
It was further assumed that the thermal expan-sion/contraction behavior of argillite is isotropic.This restriction is not inherent in the code, but wasmade in the light of the paucity of available data.There is good evidence, in fact,39 that some argilla-ceous rocks undergo anisotropic contraction upon
21

E2 0
- I1 5
D. 0 1
I
- 5 -
/7
I
I
*I
10 100 1000
T-me (Dcr.)
Radius (m)
Figure 13. Calculated Zones of Tensile Fracturing at 5, 42, and250 Days
At a time of 5 days, only a very small area aroundand at the bottom of the heater was predicted to havecontracted, and to contain newly formed tensionaljoints. At 42 days the radius of the zone of contractionwas calculated to extend beyond the 0.61-m radius ofthe first instrumentation holes. At 250 days, thecontracted volume extended slightly beyond the1.22-m radius of the second set of instrumentationholes. By this time, the rock was also calculated tohave fractured to a depth of -0.7 m immediatelybelow the heater, and for nearly as far along the holeabove the heater. Figure 14 shows the calculatedradial extent of the contracted zone as a function oftime.
Reduction of the assumed Young's modulus of theargillite from 6896 to 2068 MPa had no discernibleeffect on the calculated radius of the cracked volumeat a time of 150 days. Variation of the maximum linearthermal contraction between 0.2% and 2% also hadlittle effect. The calculated radius of the crackedvolume at 150 days was 1.2 m if 0.2% contraction wasassumed, and 1.5 m if 2% was assumed.
Figure 14. Calculated Radius of the Zone of Tensile Fracturing asa Function of Time
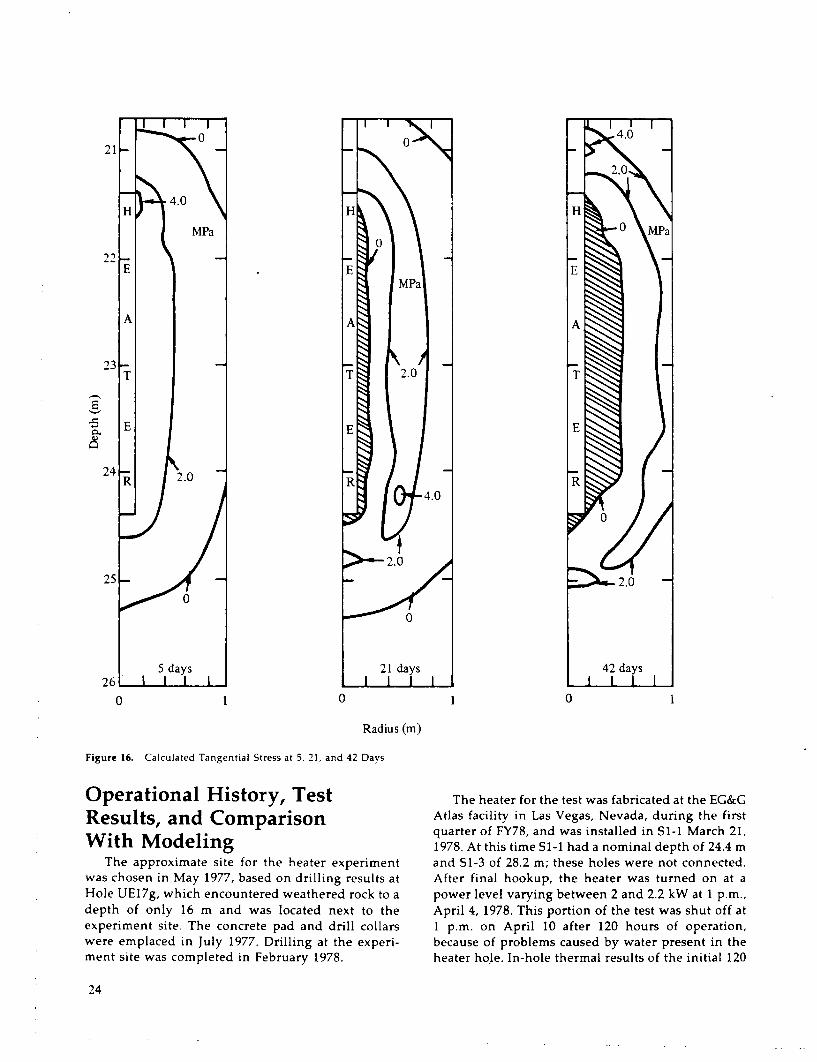
One major effect of the postulated contraction ofthe argillite was to greatly reduce predicted compres-sive stresses near the emplacement hole. Figures 15and 16 show the modeled radial and tangential stressdistributions to a radius of 1 m at times of 5, 21, and 42days, respectively. At 5 days, compressive radialstresses were at a maximum between 0.5 and 0.7-mradius opposite the center plane of the heater anddecreased both away from and towards the heater. Astress concentration was also present near the base ofthe heater.
At 21 days, the maximum calculated compressivestress zone moved out to a radius of between 0.8 and1 + m and interconnected with the zone at the bot-tom of the heater. An irregular zone of volumetriccontraction was present along the hole wall, extend-ing to a maximum radius of -0.25 m. Stress gradientsnear this boundary were so sharp that the contracted-volume boundary would virtually coincide with theslightly positive isobar shown. At 42 days, apparentlybecause of radial relief into the contracted volumearound the heater hole, the 1.5-MPa isobar oppositethe heater center plane disappeared, and was repre-sented only by isolated remnants above the top of theheater and at the base. Similar results have beenfound in large-scale or global modeling studies inargillite.41
Predicted tangential stresses behaved like radialstresses in many respects, as shown in Figure 16. At 5days, stress contours were quite smooth and the onlymarked concentration was in a small zone near thetop of the heater. At 21 days, the 2.0-MPa contourformed a zone opposite the heater center plane with aradius of 0.4 to 0.8 m and lower stresses on both sides.At 42 days, this contour moved out to between 0.8and 1 + m, and tangential relief of volumetric con-traction occurred out to a radius of -0.5 m. One
22

difference between the radial and tangential resultswas that tangential stress concentrations tended tooccur above the top of the heater, while radial stressconcentrations occured at the bottom. The resultsindicate that at a representative location (say at a
radius of 1 m opposite the heater center plane), theradial stress maximum should have been reachedbefore the tangential, but that neither stress shouldhave been anywhere near the assumed compressivefailure stress of 41.4 MPa.
sq , -
21
22
23
0.3
T
1.5E
0.3
MN
R
1 5
0.3
5 daysI I I B
24
25
,9 . . . .
0 l
Radius (m)
Figure 15. Calculated Radial Stress at 5,21, and 42 Days
23
0 I 0 I 0 I
Radius (m)
Figure 16. Calculated Tangential Stress at 5, 21, and 42 Days
Operational History, TestResults, and ComparisonWith Modeling
The approximate site for the heater experimentwas chosen in May 1977, based on drilling results atHole UE17g, which encountered weathered rock to adepth of only 16 m and was located next to theexperiment site. The concrete pad and drill collarswere emplaced in July 1977. Drilling at the experi-ment site was completed in February 1978.
The heater for the test was fabricated at the EG&GAtlas facility in Las Vegas, Nevada, during the firstquarter of FY78, and was installed in S1-1 March 21,1978. At this time Si-1 had a nominal depth of 24.4 mand SI-3 of 28.2 m; these holes were not connected.After final hookup, the heater was turned on at apower level varying between 2 and 2.2 kW at 1 p.m.,April 4, 1978. This portion of the test was shut off at1 p.m. on April 10 after 120 hours of operation,because of problems caused by water present in theheater hole. In-hole thermal results of the initial 120
24

hours of operation of the heater are shown inFigure 17.
160
0.76 m140
2.26 m
120
100o ~ ~ ~ ~ ~ ~ ~ ---~~~~2.91 n
1.52m80 Hole Pressurized ) ockI I ~~Wall
E60 0~~~~~~~~~~.09 m
sulatior3.75m40
20A 21 2 34 6810 20 30 4060 80100
Time (Hours)
Figure 17. In-Hole Thermal Results of the First 120 Hours ofOperation of the Full-Scale Heater (At the end of this time, theheater was removed. Distances are heights above the base of theheater.)
About 20 hours into the test, it became apparentthat the bottom portion of the heater was covered bywater. This conclusion was reached because the bot-tom thermocouple on the heater (at a height of0.09 m) had reached a temperature of only -60'Cand was rapidly becoming steady-state. At the time ofinitial heater installation it was noticed that a verysmall amount of water was still present after tampingthe drilling debris. This water appeared only as a fewsmall puddles between remaining uneven areas ofthe hole bottom. At this stage of the test, lowering theheater onto the hole bottom apparently further com-pacted the drilling debris, with concomitant rise ofliquid water in the annulus between the outside ofthe heater and the emplacement-hole wall. The waterlevel at the beginning of the test is unknown, butmust have exceeded 0.1 m. When the heater waspulled after 6 days of operation, scale deposits on theexternal surface indicated that the peak water heightwas -0.35 m.
At 20 hours operating time, the portion of SI-1below the packer was pressurized to 0.014 MPa for 5hours in an attempt to drive the water from thebottom of the hole. The unsuccessful results of thiseffort are included in the figure. Heater-skin tem-peratures above 0.76 m were depressed by as much as4VC as a result of the pressurization, while tempera-tures recorded by the rock-wall thermocouples at the
heater center plane increased during the same timeinterval by as much as 80C. The temperature recordedby the lowermost thermocouple on the heater alsoincreased, by 4VC.
The increase in temperature near the bottom ofthe heater is consistent with the interpretation thatthe air pressure partially succeeded in removing thewater from the hole, if there was a steady-state ther-mal gradient in the standing water in the hole. Analternative explanation is that the slight increase ingas pressure decreased water evaporation rates in thebottom of the hole by raising the boiling point, andtherefore allowed a slightly higher steady-state tem-perature to be reached.
The opposing senses of response of the heaterskin temperatures at the center plane and the rock-wall thermocouples is evidence of an increase in theeffective thermal conductivity between the heaterand the rock-wall. This increase could be caused byseveral mechanisms: induced convection from theforced flow of vapor into the formation; a decrease inabsorption of radiant heat from a decrease in watervapor concentration within the gap; or a change inrock emissivity caused by a change in the rate ofwater evaporation. Whatever the reason, the changein effective conductivity was small.
In general, the short-term effect of standing waterin SI-i was to lower most heater temperatures slight-ly. The temperature at the heater center plane was1560C after 48 hours during the first period of oper-ation, and 1740C in the main period. This differenceis very nearly the same as the relative difference inpower levels of the two runs (2 to 2.2 kW versus2.5 kW). Thus, there is little early-time effect at thecenter plane. Thermal gradients along the heater skinwere markedly affected by the presence of the wateronly in areas near the standing water. At 48 hours,the difference between the temperature at 0.09 m andat 0.76 m was 930 C with the bottom of the heatersubmerged, versus 520C with the bottom of the holedry. Long-term effects of such water remain unclear.
The heater was removed from SI-1 on April 18,1978, and deepening of S1-1 and S1-3 begun. Deepen-ing and cross-connecting these holes required about1 month. Cross-connection between the holes wasestablished by ise of a side-cutting water jet operat-ing at nozzle pressures of 100 MPa.
The heater was reinstalled in S1-i on May 9, 1978.Instrumentation was checked, a short period of back-ground data obtained, and the heater turned on at2.5 kW at 1 p.m., May 16, 1978. Power was increasedto 3.8 kW at 1 p.m., June 6, 1978, and held at this leveluntil the experiment was shut off January 22, 1979.The heater was removed from the emplacement hole
25
- - -- --- � - _. ----- -- -- - � .1 -1- _--__'____-___.______._

March 6, 1979, and dismantling of the experimentbegun. After gas transmissivity testing, the experi-mental site was decommissioned April 19, 1979, ex-cept for posttest coring completed in May.
Measured and modeled in-hole temperatures (ex-cept for sidewall thermocouples) during the mainportion of the experiment are compared in Figure 18.Modeled temperatures at the center plane of theheater reached a peak value of 3110 C, compared to ameasured value of 350'C, a 11% difference relative tothe experimental value. Up to -30 days into the test,modeled and measured temperatures agreed to with-in 100 C or less. After this time, the two values in-creasingly diverged, possibly because the surfaceemissivity of the heater did not increase as fast uponheating as assumed.
Modeled temperatures were asymmetric about theheater center plane, presumably because perfect ther-mal contact between the heater and the argillite inthe bottom of the hole was assumed in the model andresulted in some drawdown of temperatures on thelower half of the heater. This asymmetry was mostmarked by calculated temperatures at the bottom andtop corners of the heated zone: the peak calculatedtemperature at the bottom corner of the heater was2590 C while that of the top of the heated zone was2960 C, or only 15'C below the temperature at thecenterline. Measured temperatures at 0.76 m height,except during the last 90 days of the experiment,exceeded those at the centerline, at times by nearly20'C. This sense of difference is contrary to modeledresults.
I
I4
t
4)-
Measured TemperaturesCalculated Temperatures - - -
Time (Days)
Figure 18. In-Hole Thermal Results of the Full-Scale Heater Test, Except Side-Wall Thermocouples (Heights are given in distances above thebottom of the heater)
26

Measured temperatures at 2.26 m were erratic. Atearly times they lagged behind expected results.Shortly after the power was increased, the tempera-ture at this height was effectively limited to onlyslightly above 1000C. After about 60 days into thetest, temperatures at this height paralleled expectedvalues of 2900 to 300'C, and appear to have reachedcalculated temperatures by the end of the test.
Intermittent inflow of water between 21 andabout 30 days into the test may have been responsiblefor the anomalously low temperatures measured atthis height. Examination of the heater after it wasremoved from the emplacement hole revealed aslight scale deposit between the surface of the ther-mocouple shield and the body of the heater, thatextended from 2.1 to 3 m, but not to the top of theheater. That temperatures were never decreased tothe local boiling point of water (940C) probablymeans the water was able to affect this sheathedthermocouple only indirectly. Intermittent inflow ofwater, such as that proposed here, was also apparent-ly responsible for intermittent damping of tempera-tures measured during one of the scaled heater testsmade before the full-scale experiment.40
The difference between measured and modeledheater temperatures was most striking at 0.09 and2.9-m heights. Measured temperatures at 0.09 m(2530C maximum) lagged only slightly behind mod-eled temperatures (2590C maximum). Measured tem-peratures at 2.91 m, however, lagged more than100'C behind those expected for the entire test.Again, this appears to have been caused by periodicinflow of water. At late stages in the test, measuredtemperatures at 2.9 m became even more erratic,although they generally increased, as in the case ofthe measurements at 2.26 m.
The thermal history of the insulation was com-plex. At early times, temperatures of both the top ofthe heater and the insulation increased regularly.Shortly after the increase in heater power, both ther-mocouples in this area reached temperatures near100'C, but never went any higher. Between about 25and 40 days, both temperatures appeared to exceedthe local boiling point of water.
After peaking at 30 days, temperatures at both thetop of the heater and the bottom of the insulationdecreased very slowly for the rest of the test. After-40 days, the temperature at the insulation wasbelow 94°C, eventually reaching a value of only850C. This cooling trend is consistent with the inter-pretation that input air served as a continuous heatsink in cooling the insulation. If so, then the coolingtrend would indicate a continuously decreasing rate
of water precipitation and condensation in the insu-lation after -40 days.
Calculated and measured temperatures on thehole wall and in the rock, both at the elevation of theheater center plane, are compared in Figure 19. Mea-surements at radii 2.13 and 3.35 m indicated verylittle thermal anisotropy caused by layering, andagreed with calculated results to within 50C or betterfor the duration of the experiment. Temperatureswere slightly higher parallel to strike than perpen-dicular to it. Temperatures measured parallel to strikeat 1.22 m agreed quite well with the modeled results,but were slightly higher; there were no temperaturemeasurements at 1.22 m perpendicular to strike.
At 0.61-m radius, thermal anisotropy was increas-ingly evident, especially at temperatures > 1000 C.Above - 120'C, measured temperatures both paralleland perpendicular to strike exceeded modeled tem-peratures, indicating that in-situ thermal conductiv-ity at these temperatures was less than that used asinput for the modeling. Temperatures at this radiuswere also greater parallel to strike than perpendicu-lar to strike, implying that thermal conductivity washigher at some inclination to the layering than paral-lel to it, in contrast to the model input data. At theend of the test, there was a difference of 30% betweenmeasured and calculated temperatures parallel tostrike at 0.61 m.
Temperature measurements at the hole wall dis-played a variable relationship to modeled, and wereconsistently more erratic than measurements ingrouted holes. Measured temperatures respondedmore rapidly than modeled temperatures to heaterturnon. Between -6 and 40 days, modeled tempera-tures exceeded measured temperatures by as much as30'C. When the power was increased at 21 days,modeled temperatures increased more rapidly thanthose measured. In addition, as indicated in the fig-ure, the response of one rock-wall thermocouple wasirregular for -10 days after the increase in powerlevel.
The lagging of measured temperatures of side-wall thermocouples behind modeled temperaturesduring most of the first 40 days of the test wasattributable to at least two causes. It may be that thenear-field effective conductivity was greater thanestimated. Comparison of measured and modeledtemperatures at a radius of 0.61 m indicates that thiswas not the case, however. It may be that the side-wall thermocouples were somehow cooled by con-vection or transport of water vapor that was in theemplacement hole.'This is consistent with the re-sponse of side-wall temperatures to hole pressuriza-tion, and with the fact that measured temperatures
27

first begin to lag behind those predicted at 80 to90'C. If such a cooling process was active, thencooling was apparently relatively constant up to -40days before decreasing. This response is also consis-tent with the decrease in water precipitation andcondensation rate inferred from the temperatures ofthe heater insulation at times later than about 40days.
At times > 40 days, measured temperatures atthe hole wall consistently exceeded calculated values.The difference was -20° between 40 and 170 days,consistent with the sense and estimated magnitude oferror resulting from incomplete shielding of thethermocouple, conduction down the mountingspring, and/or contact resistance between thermo-couple and rock. At - 170 days there was a qualitativechange in slope of the hole-wall data and an increase
300 , , ,
Measured TemperaturesCalculated Temperatures
200
E
0
in difference between measured and modeled tem-peratures to a maximum of >400 C.
There are at le'ast two explanations for this behav-ior. First, contact resistance between the rock walland the thermocouples may have increased. It ap-pears unlikely, however, that a marked decrease incontact would take place at the same time at twoseparate thermocouples separated by -0.3 m. Sec-ondly, in-situ thermal conductivity may have de-creased in the region monitored by the two thermo-couples. This is the most likely explanation,especially since the measured and modeled tempera-tures at a radius of 0.61 m also increasingly diverge atabout the same time. The decrease in in-situ thermalconductivity is also consistent with the predictedpropagation of the zone of tensile fracturing.
Time (Days)
Figure 19. Argillite Temperatures at the Heater Center Plane as a Function of Time (Temperatures at 0.178 m are for sidewall thermocouples,measured parallel to strike)
28

Measured and modeled temperature profiles par-allel to strike at two different times are compared inFigures 20 and 21. At 21 days into the experiment,there was good agreement on and near the elevationof the heater center plane. Above this level, andespecially above a depth of 21 m, measured isothermswere consistently displaced upwards relative to mod-eled. The results appear to indicate that at least someupwards transport of heat was not fully accounted forin the modeling. For heater experiments in the Cona-sauga Shale, the displacement of isotherms showedthat some continuous convection was taking placeduring this experiment,' since measured isothermsboth above and below the centerplane of the heaterwere consistently displaced upwards. As shown inFigure 20, however, measured isotherms below theheater center plane here lay either on or outside thecalculated isotherms, except in a small region verynear the bottom of the heater. In light of this distribu-tion, it appears that any water or steam responsiblefor the upward displacement of isotherms above theheater must not have formed a convective cell, butinstead originated within the heated zone itself.
Radius (m)
Figure 21. Comparison of Modeled and Measured TemperaturesParallel to Strike, 230 Days Into the Experiment
The situation was different at 230 days, as shownin Figure 21. The 50° and 75°C isotherms still agreedwell at the heater center plane. Above the centerplane, measured temperatures still exceeded modeledtemperatures. However, measured temperatures onthe center plane also markedly exceeded those mod-eled at higher temperatures. Also, while the sense ofoffset of the measured 100 C isotherm was consistentwith earlier results, that of the 150'C isotherm is not.In the case of this isotherm only, modeled rock-masstemperatures near the top of the heater exceededmeasured values. Below the center plane of the heat-er, as in the 21-day case, measured temperaturesslightly exceeded modeled temperatures, except di-rectly below the heater.
Contours of measured temperatures parallel andperpendicular to strike at 230 days are compared inFigure 22; definition of contours perpendicular tostrike is hampered because no temperatures weremeasured in this orientation at a radius of 1.22 m. At agiven point on the center plane, temperatures paral-lel to strike consistently exceeded those perpendicu-lar to strike. This is also generally true both aboveand below the center plane.
Radius.(m)
Figure 20. Comparison of Modeled and Measured TemperaturesParallel to Strike, 21 Days Into the Experiment
29

In summary, there is general agreement betweenmeasured and modeled temperatures in the heaterexperiment. This is especially true near the heatercenter plane and below - 1000C. Rock-mass tempera-tures measured at a given radius parallel to strikeconsistently exceeded those measured at an analo-gous position perpendicular to strike. In most cases,temperatures on either side of the center plane ex-ceeded modeled temperatures more than do thosenear the center plane. Comparison of measured tem-peratures parallel and perpendicular to strike at 230days indicated generally higher conductivity perpen-dicular to strike. One consistent feature of the resultswas that, while modeled and measured temperaturesgenerally agree well below 1000 C, the two tem-peratures increasingly diverge above this tempera-ture.
450, at a 450 angle to this plane; and 900, perpendicu-lar to the plane. The measurements in the 00 and 90°orientations thus attempted to track the response ofthe radial and tangential stresses, respectively, aboutthe heater.
2
1
~/ /Calculated Radial(0)..-
./
I~
IC
2
22
oL
1--1
-20 10 20 30
Radius (in)Figure 22. Comparison of Measured Temperatures Parallel andPerpendicular to Strike, 230 Days Into the Experiment
The stress response in Hole S1-8 is shown inFigure 23 and compared with modeled results. Mea-sured data are represented both directly as stressesand indirectly as relative deformations of an original-ly cylindrical hole. As indicated, measurements weremade in three horizontal directions: 00, in the planecontaining both the stress hole and the heater hole;
Time (Days)
Figure 23. Stresses Measured at 0, 45, and 90 Degrees to the LineBetween S1-8 and the Heater, at the Center Plane (Calculatedstresses are also shown at 5 and 21 days)
For the first 3 days of the experiment, the amountof radial compression increased. Measured peak com-pressive radial stress was -0.25 MPa. At this time,measurements in both the 450 and 90° orientationsindicated expansion and relative tensional stresses ofthe same order of magnitude as the radial compres-sion. Eight days into the test the radial stresses be-came tensional, and the circumferential stress becamethe only compressional stress. The maximum mea-sured compressive circumferential stress was-0.1 MPa. After 14 days, the hole containing thestress meters appeared to expand in all directions,with greatest expansion in the 00 orientation, in aplane pointing towards the heater. At 14 days into
30

the test, the peak temperature measured at the 1.22-mradius was 360C, at 22.9 m depth in Si-5.
Calculated stresses at 5 and 21 days are includedin Figure 23. Initial response of the measurementswas consistent with modeled results, indicating com-pression in the radial direction and expansion in thetangential. Within 3 days, however, measuredstresses began to be much smaller than calculatedstresses. Measured radial and tangential stresses of+ 0.25 and -0.20 MPa at 3 days compare with calculat-ed stresses of +0.8 and -0.5 MPa at 5 days.
Both measured and calculated stresses changed10 days into the experiment, when tangential stress
became compressive. However, the measured dataindicate that only the tangential stress was positiveduring this period, while the modeled results indi-cate that both radial and tangential stresses shouldhave been positive.
The emplaced stress-meter assemblage thus pro-vided useful qualitative data only for -3 days. After
this time, while the change in the sign of tangentialstresses was picked up, the constantly compressiveradial stresses were fully relieved. It is not clearwhether the long-term behavior of the stress assem-bly was caused by expansion of the meter and alumi-num tube into the grout surrounding them, or totemperature instability of the gauge itself.
Modeled and measured vertical displacementsrelative to the extensometer anchor at 24.4 m arecompared in Figure 24. Modeled displacements,shown by the dashed lines, were determined bysubtracting the calculated displacements at 24.4 mfrom those at higher levels. As shown, the calculateduplift of the anchors at levels of 22.9, 21.3, and 19.8 mincreases with increasing height above the referencelevel, with 0.76 mm the maximum uplift, for theanchor at 19.8 m. One interesting aspect of this resultis that the total behavior of material at a radius of1.22 m was expansive even though this radius is nearthe margin of the zone that has experienced calculat-ed volumetric contraction by the end of the test.
Time (Days)
Figure 24. Relative Displacements of Vertical Extensometers, Measured Relative to the Anchor at a Depth of 24.4 m

Experimental results in Hole S-7 parallel tostrike, shown by solid lines, agreed with the calculat-ed results in that all anchors above the reference levelappear to move upwards. However, the amount ofmeasured uplift decreased rather than increased withgreater distance above the reference. Note that theapproach of the contracted zone was apparently re-flected in decreasing relative uplifts towards the endof the experiment.
Results were more complicated perpendicular tostrike, as measured in S1-9 and shown by dotted linesin the figure. In this case only the anchor at 22.9 mappeared to move up relative to the reference depth,while those at 21.3 and 19.8 m appeared to subside. Asin the case parallel to layering, the anchor at 22.9 mmoved the most in relation to the reference level.
The potential effects of thermal uncertainties onthe data shown here would be to decrease apparentuplifts with respect to the reference level. Effectswould be greatest for the shallowest anchor (that at19.8 m) both because the longest length of rod mustbe compensated for, and because measured tempera-tures were highest at the level. It is possible, ifinstrumental and thermal uncertainties are combinedproperly, to make the experimental data parallel tostrike appear qualitatively consistent with modeledresults. Unfortunately, potential measurement errorsare of the same order of magnitude as apparentdisplacements. It is virtually impossible to make mea-sured results perpendicular to strike qualitativelyconsistent with modeled results. Given these results,we conclude that the vertical-displacement measure-ments in this experiment neither confirmed nor con-tradicted modeled displacements.
In selecting the gas-pressure instrumentation forthis experiment, we aimed to assess whether gas!steam pressures sufficient to result in volatile-induced fracturing of the argillite might be generat-ed during the test. Consideration was not given to thefact that the maximum volatile pressures generated inany hole would be limited by the coolest portion ofhole wall exposed. Thus, instead of approachingpressures required for volatile fracturing of the for-mation, the measured pressures shown in Figure 25rarely exceeded 1 psig (0.007 MPa). Nonetheless, theresults do indicate a local increase in permeability ofthe formation with time.
Removal of the cover on Hole S1-3 to allow peri-odic pumping of water always led to an immediatedrop in the pressure below the packer in Si-i, be-cause the holes were interconnected. In fact, in lightof this interconnection, it is surprising that volatilepressures in SI-i do not show the diurnal variationsof those in SI-3.
Before 37 days into the test, gas pressures in HoleSl-6 were independent of the state of S1-3. After thistime, however, the pressures in S1-6 immediatelyresponded to the uncapping of S1-3. This indicatesthat communication between S1-3 and S1-6 was es-tablished between 35 and 37 days into the test. Thiscommunication need not mean that the formationwas newly fractured by compression between theholes as a result of the test, but merely that enoughadditional joint opening occurred to allow full inter-connection of preexisting fractures in the region.
Apparent water-generation rates for the first 54days of the experiment, based on water levels in HoleS1-3, are shown in Figure 26. As indicated, the aver-age apparent rate was -1.4 x 10⁻⁴m 3 /h, and waseffectively constant for the entire period duringwhich the experiment was collecting water. Becauseof the crude nature of the water-collection system,however, there is one major exception. As shown bythe circled data in the figure, apparent water genera-tion rates were almost always higher than averageimmediately after a pump time when the pumpdownstarted at a water level 2.0 m. This correlationsuggests that the rock was serving as a local reservoir,and that the leaking of contained water back into thesump hole was time-dependent.
On the 52nd day of the test, the water levelactually declined overnight. The experiment neveragain collected water in S-3. Between days 52 and59, the water level was relatively stable between 1.6and 1.8 m. On day 59 this level lowered to 1.4 m; thenext day and, for the rest of the test the hole wascompletely dry. These data help support the interpre-tation of increasing hole-hole interconnection nearHoles S1-3 and S1-6.
Results of both pretest and posttest gas transmissi-vity testing are included in Table 8. Note that thenumbers shown, based on either the porous-mediumapproximation or the assumption that the two holesare connected by a single planar joint, are qualitative.
Pretest argillite permeability, both before andafter sumps were drilled in Si-i and S1-3, was in themillidarcy range. The average value was 5.6 mD,based on 10 measurements. Posttest measurementswithin a radius of 1.22 m indicate an average perme-ability of 2.6 D, three orders of magnitude greaterthan at pretest. Most of the increase in permeabilitywas local; i.e., caused by heating and not by simpledrying out of the entire experimental area. This isindicated because measurements of holes outside the1.22-m radius show a much smaller increase-fromthe millidarcy to 10-mD range. The dramatic increasein permeability inside a volume roughly correspond-ing to the modeled radius of volumetric contraction,
32
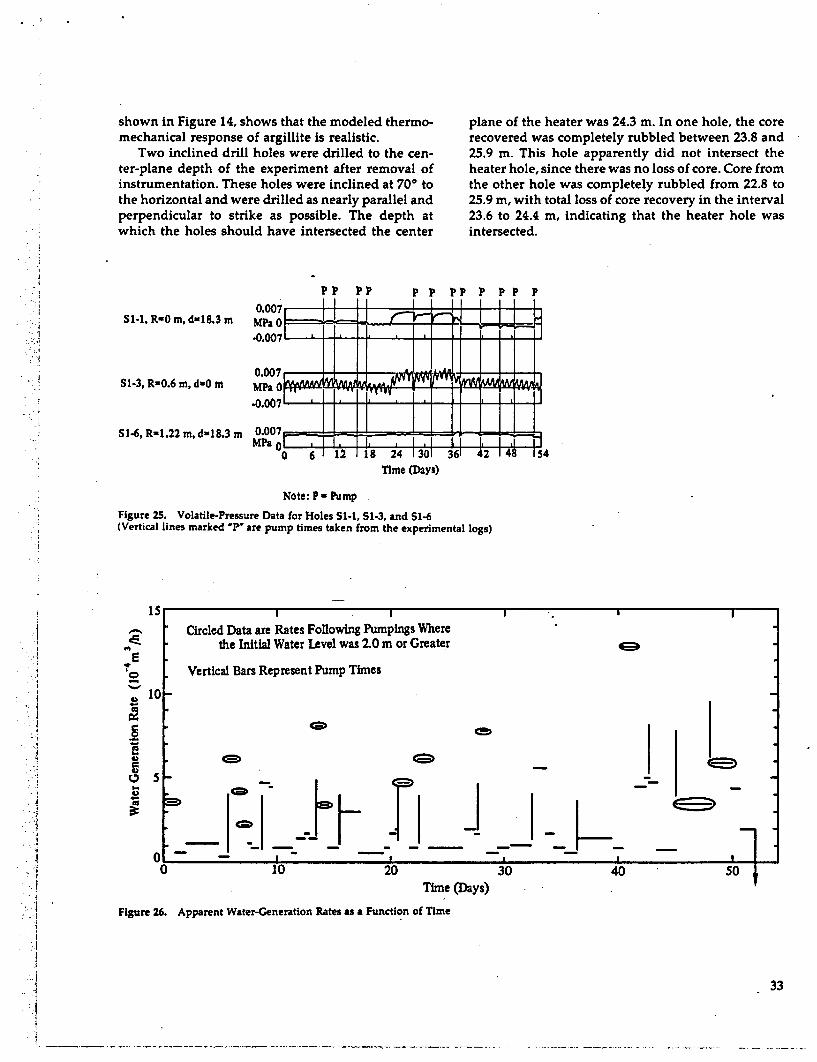
shown in Figure 14, shows that the modeled thermo-mechanical response of argillite is realistic.
Two inclined drill holes were drilled to the cen-ter-plane depth of the experiment after removal ofinstrumentation. These holes were inclined at 70 tothe horizontal and were drilled as nearly parallel andperpendicular to strike as possible. The depth atwhich the holes should have intersected the center
plane of the heater was 24.3 m. In one hole, the corerecovered was completely rubbled between 23.8 and25.9 m. This hole apparently did not intersect theheater hole, since there was no loss of core. Core fromthe other hole was completely rubbled from 22.8 to25.9 m, with total loss of core recovery in the interval23.6 to 24.4 m, indicating that the heater hole wasintersected.
PD P 10 V D I I b b D
SI-i, R*O m, d-18.3 m
Sl-3, R=0.6 m, duo m
* r r r r r rr K r K
0.007MlPa O _1 1 a _ 10.007
MPa o
0.007MP&O . I 1 .I 1. ,I . lI l
1 2 7 18 24 1 301 361 42 48 154i
S16, R-1.22 m, d-18.3 m
I
Time (Days)
Note: P - Pump
Figure 25. Volatile-Pressure Data for Holes Si-i, S1-3, and S1-6(Vertical lines marked PS are pump times taken from the experimental logs)
I
I
YEIf20
4)
0k
A:
A?
I ICircled Data are Rates Following Purnpings Where
the Initial Water Level was 2.0 m or Greater
Vertical Bars Represent Pump Times
I .. I
10_
5
l i Lc Ti -- I-. I1A0 10 20 30
Time (Days)40 SO 5
Figure 26. Apparent Water-Generation Rates as a Function of Time
33
- - - - ------

Table 8. Pre- andHeater Site
Posttest Gas Transmissivity Meaurements of Eleana
1. Before deepeningof S1-1 and S1-3S-1SI-6SI-6Si-9S-6si-11
- S1-3-5 s-1- S1-3- Sl-l- S1-14-5 S-1
K(10-'ft /s)Pre Post3.0 45405.7 4640
14.9 49702.3 3680
13.5 52.81.9 250
k(Darcy)Pre Post
0.002 2.60.003 2.70.009 2.90.001 2.10.008 0.030.001 014
R11(m)Post9 x 10-4
1 75 x 10-33 x 10-37 x 10-4
17 x 10-44 x 10-4
2. After deepeningof SI-1 and S1-3SI-3 - S-1S1-14 - S-1
8.313.8
4500 0.005 2.641.1 0.008 0.024
9 x 10-44 x 10-5
K = hydraulic conductivityk = permeability
RH = hydraulic radius
Observation of the core recovered from the post-test holes indicates only minimal macroscopic alter-ation. In the rubbled zone, the argillite is a darkgreenish black rather than the uniform grayish blackof pretest material. Limited mineralogical investiga-tion of material from the near-heater zone indicatessome alteration of the layer silicates, as shown by theresults in Figures 27 and 28. In Figure 27, X-rayresults are presented for a sample from a depth of23.1 m in the drill-backhole that did not intersect theheater hole. This is above the depth of the beginningof rubble. As shown, the basal spacing of the illitedecreased from 10.5 to 9.82 A on glycolation, andincreased to 9.93 A on heating at 350'C for 24 hours.Kaolinite is almost completely stable during thistreatment, and the illite peak increases in heightmarkedly upon heating.
Figure 28 presents results for a sample from therubbled portion of the hole that did intersect theheater hole. Here the basal spacings of the illite andkaolinite are virtually identical to those in the shal-lower one, but the response of both illite and kaolin-ite to heating is qualitatively different. In this sam-ple, the illite peak increases only slightly in heightafter heating, while the kaolinite peak is greatlyreduced. This indicates that the stability of bothphases, but especially that of kaolinite, has beenaffected by the experiment. It is not clear whether theapparent degradation of the kaolinite is caused sim-ply by an extended time (say 150 days) at elevatedtemperatures, or to chemical interactions in the rock.
Certainly, its degradation is consistent with the re-ported disappearance of this phase in metamorphicsequences at temperatures ranging from 70 to375°C.42 That mineralogical changes were noticedhere only in the layer silicate phases may well bebecause the major phases susceptible to nearsurfaceoxidation, such as siderite and pyrite, had alreadybeen removed by near-surface weathering. Chemicalanalyses of posttest material included in Table 9 donot indicate any significant oxidation resulting fromthe test when compared to at-depth or near-surfaceanalyses included in Table 3.
The metal coupons attached to the bottom of theheater showed little reaction (Table 10). Because ofthe removal of water from the bottom of the hole,only those materials that could undergo oxidation inhot, relatively dry air showed any significant reac-tion."
One final qualitative technique-borehole inves-tigation with a cable-mounted camera-indicatedsome volumetric contraction from heating the argil-lite. As shown in Figure 29, there was considerableopening of pre-existing joints or formation of newtensional joints as a result of heating. Such jointswere much less obvious and almost entirely closed inpretest observations. This phenomenon appeared totake place in Holes S-i and S-3, both well withinthe 100°C isotherm, but was not obvious in Hole S1-6, near the margin of the modeled zone of volumetriccontraction.
34

.. �. .
*20*20
I ' I l
7 9 1011 14 16 29
d (A)
Figure 27. X-Ray Powder Diffraction Results, Posttest SaumpleSla-75.7 (The curve is normalized to the quartz peak at 4.26 A)
7 9 10 11 14 16 29
d (A)
W(AFigure 28. X-Ray Powder Diffraction Results. Posttest SampleSib-77.8-78.0 (The curve is normalized to the quartz peak at 4.26 A)
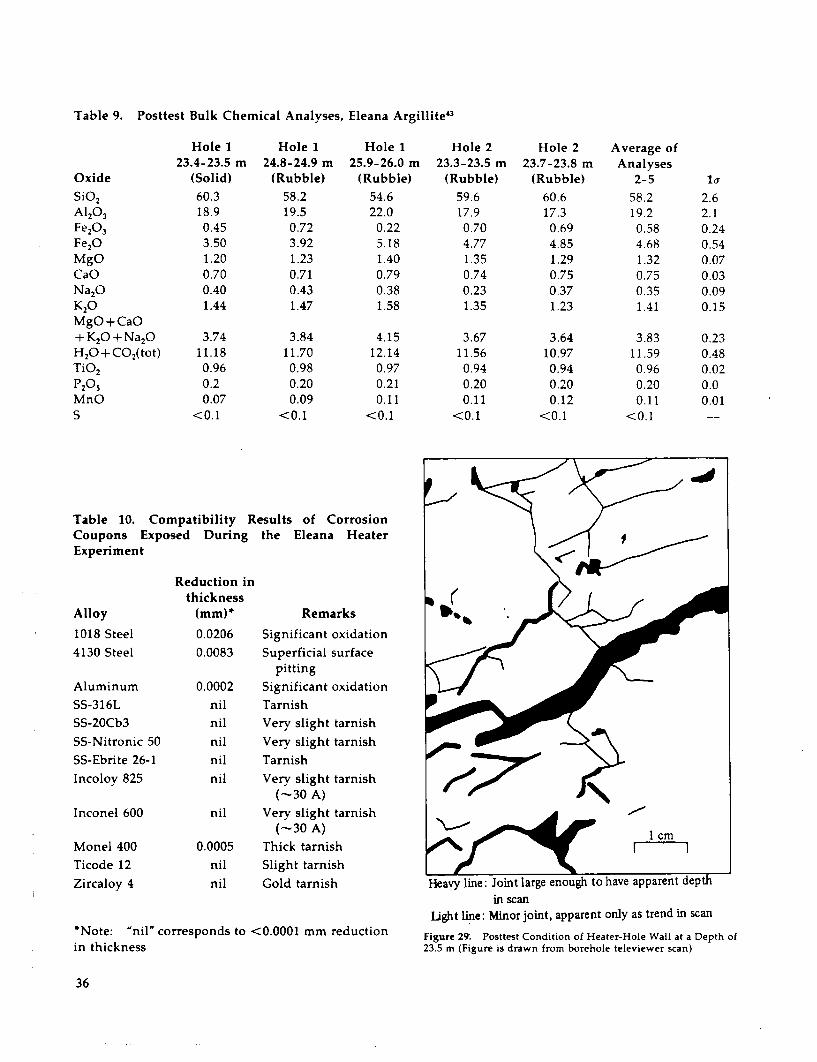
Table 9. Posttest Bulk Chemical Analyses, Eleana Argillite43
Oxidesio2Al203Fe2O3Fe 2OMgOCaONa2OK2 0MgO + CaO+ K2 0 + Na2 OH2 0 + C02 (tot)TiO2P205MnOS
Hole 123.4-23.5 m
(Solid)60.318.90.453.501.200.700.401.44
3.7411.18
0.960.20.07
<0.1
Hole 124.8-24.9 m
(Rubble)58.219.5
0.723.921.230.710.431.47
3.8411.70
0.980.200.09
<0.1
Hole 125.9-26.0 m
(Rubble)54.622.0
0.225.181.400.790.381.58
4.1512.140.970.210.11
<0.1
Hole 223.3-23.5 m
(Rubble)59.617.90.704.771.350.740.231.35
3.6711.560.940.200.11
<0.1
Hole 2 Average of23.7-23.8 m Analyses
(Rubble) 2-560.6 58.217.3 19.20.69 0.584.85 4.681.29 1.320.75 0.750.37 0.351.23 1.41
la
2.62.10.240.540.070.030.090.15
0.230.480.020.00.01
3.6410.970.940.200.12
<0.1
3.8311.590.960.200.11
<0.1
Table 10. Compatibility Results of CorrosionCoupons Exposed During the Eleana HeaterExperiment
Reduction inthickness
(mm)*Alloy
1018 Steel4130 Steel
AluminumSS-316LSS-20Cb3SS-Nitronic 50SS-Ebrite 26-1Incoloy 825
Inconel 600
Monel 400Ticode 12
Zircaloy 4
Remarks
0.0206 Significant oxidation0.0083 Superficial surface
pitting0.0002 Significant oxidation
nil Tarnishnil Very slight tarnishnil Very slight tarnishnil Tarnishnil Very slight tarnish
(-30 A)nil Very slight tarnish
(-30 A)0.0005
nil
nil
Thick tarnishSlight tarnish
Gold tarnish Heavy line: Joint large enough to have apparent depthin scan
light line: Minor joint, apparent only as trend in scan'Note: "nil' corresponds to <0.0001 mm reductionin thickness
Figure 2M. Posttest Condition of Heater-Hole Wall at a Depth of23.5 m (Figure is drawn from borehole televiewer scan)
36

Conclusions and DiscussionTwo main conclusions are reached as a result of
the Eleana Near-Surface Heater Experiment:1. Based on the general agreement between
modeled and measured temperatures and onthe lack of any compressive failure of theheater-hole wall, there is no a-priori reasonthat argillaceous rocks are not attractive forpurposes of nuclear-waste management.
2. Based on the increasing divergence of mod-eled and measured temperatures at high tem-peratures and the apparent coupling of ther-mal and mechanical properties in-situ,additional testing would be required to char-acterize adequately the in-situ response ofargillaceous rocks to the emplacement of heat-producing wastes. This is especially true ifthose rocks contain appreciable expandableclays, and if temperatures resulting fromwaste emplacement lead to any large amountof rock-mass dehydration.
Note that the first conclusion necessarily includessome limitations. The experiment described here wasnear-surface. As a result, initial in-situ stresses werenegligible, and the entire experiment took place wellabove the water table. Creep of the argillite, whichcould be a major factor at depth, was not a factorbecause of the absence of in-situ stresses. The poten-tial for compressive stresses around the emplacementhole was also minimized. That the entire experimenttook place well above the water table means thatrock-mass dehydration occurred at very near ambientpressures, and that refluxing of water was transient.
Observations also indicate that the response ofEleana argillite to heating involves volumetric con-traction of the rock at the test depth, accommodatedby either opening of preexisting joints or creation ofnew fractures. This conclusion is based on the follow-ing:
1. While measured and modeled temperaturesin the argillite below 1000C agreed well,there was increasing difference between thetwo values at higher temperatures. This be-havior indicates a process was operative bymeans of which in-situ thermal conductivityat higher temperatures decreased more thansimple matrix conductivity.
2. Posttest gas transmissivity testing indicatedthat formation permeability within a radius of-1.2 m increased by roughly three orders ofmagnitude as a result of the test. This radiuscoincided approximately with the 85'C iso-therm.
3. Pre- and posttest observation of the heater-hole wall indicated that many joints openedup during the course of the experiment. Thisphenomenon was also evident at 0.6 m radius,but not at 1.2 m.
4. The observations above are consistent withmechanical modeling based on the argillitethermal expansion behavior observed in thelab, in which argillite undergoes 1% con-traction between temperatures of -75° and125°C.
The results of this experiment contrast in partwith results of the Conasauga Near-Surface HeaterTests operated below the water table, in which in-situthermal conductivity did not decrease markedly withincreasing temperature, and in-situ permeabilitynear the heater holes decreased during the course ofthe test.$
If time-dependent effects are ignored, the extentof volumetric contraction on rock-mass dehydrationand the relationship between rock-mass propertiesand in-situ stress should control the presence orabsence of zones of absolute contraction resultingfrom in-situ heating. Compilation of several me-chanical-modeling results for the experiment de-scribed here allows the one-dimensional approxima-
. tion of this relation (Figure 30) to be made. In Figure30 the estimated linear tensile stress (AL/L) at thetime of maximum thermal contraction is comparedwith the overburden or in-situ stress, assuming a rockdensity of 2.6 Mg/m3. If peak tensile stress exceedsin-situ stress. by more than the assumed tensilestrength of the rock, joints open; if not, they do not.The stronger a rock mass is, the greater the depth towhich tensional joints would remain open at constantpercent contraction. Temperature-dependent soften-ing of a rock mass, and especially creep, would tendto offset or limit the opening of tensional joints atdepth. In the case of the Conasauga tests, the in-siturock-mass modulus may have been so low that therock mass collapsed around the contracted zone, evenat near-surface stress levels.
As pointed out above, one apparent result of in-situ volumetric contraction aside from a possiblecollapse is a marked increase in formation permeabil-ity. This was observed in the Eleana test, but not inthe Conasauga experiments. In addition to the possi-bility of general formation collapse, mineralogicalreactions in the Conasauga tests may have precipitat-ed new phases in existing joints and reduced perme-ability. Although not obvious in limited posttestobservations within the rock mass,' precipitation ofgypsum and anhydrite definitely occurred in theheater hole during this test.
37

80
eo/
0
Open Joints No Open Joints
o30
E 20 )/ E
20
0 0 1 2 3
Depth (kin)
Figure 30. Calculated Depth-Joint Opening Relationship for Ar-gillaceous Rocks
Additional complexities affect extrapolation ofexperimental results across the water table. In thepresent study, it was necessary to assume a constanttemperature at which argillite began to contract onheating. In real application, this temperature wouldbe controlled below the water table by the interactionof in-situ mechanical stresses, permeability, fluidpressures, and heating rates. This potential couplingcannot be adequately modeled at present, nor are therequired data available.
Concerning the coupling of in-situ thermal con-traction and conductivity, it was originally assumedthat any near-hole failure would probably resultfrom compressive failure. If so, the time scale overwhich failure would occur would be brief and theresponse of heater/canister temperatures rapid. Inthe actual test, however, dehydration of the entire
volume within a radius of -1.22 m resulted in agradual decrease in average thermal conductivity,and in a gradually increasing divergence of measuredand modeled temperatures. In retrospect this behav-ior indicates that instrumentation should have beenplaced in the rock at radii that were uniform ratherthan exponentially increasing away from the holewall. Only in this way could the marginal degrada-tion of an entire volume of rock be adequately docu-mented.
Although fluid flow was not directly measured inthe area of the heater during the test, experimentalresults indicate additional contrasts to emplacementof heat sources in the response of argillaceous rocksbelow and above the water table. In the Eleana test,the displacement between measured and modeledisotherms appears to indicate that only fluid evapo-rated out of the heated volume of rocks was active inheat transfer, and that the effect of this water de-creased as the radius of the contracted volume in-creased. The limited recycling of water did not resultin any appreciable mineralogical reactions, except forapparent degradation of some layer silicates. In thecase of the Conasauga tests, refluxing of water wasapparently continuous, resulting in the precipitationof a shale-anhydrite boot around the base of oneheater. The overall mineralogical response of argilla-ceous rocks to waste emplacement might thus bemuch simpler above than below the water table.
The Eleana Near-Surface Heater Experiment didnot qualify either argillaceous rocks as a whole orargillite specifically as a repository medium, nor wasit intended to do so. The experiment did not revealany mechanism that should eliminate argillaceousrocks a priori from further consideration, but diddisclose considerable phenomenological complexityin the response of argillaceous rocks to heating. Thisis especially true at temperatures above those atwhich appreciable rock-mass dehydration begins.
38

APPENDIX A
Estimated Field Accuracy ofMeasurements
The main portion of the heater experiment wasstarted at a power level of 2.5 kW rather than thedesign level of 3.8 kW because of simple misinterpre-tation of power-meter data. After 21 days of oper-ation, the heater power was increased to the desiredlevel. This does not imply, however, that 3.8 kW wasactually put into the rock immediately opposite theheater.
Concern about the lifespan of electrical connec-tions in the junction section of the heater led to adecision to force air down the access pipe containingthe power leads and out the one containing thethermocouple wires. This air flowed at a velocity of-230 m/min, a volumetric flow rate of 0.03 m3 /s.Temperatures of both inlet and exhaust air werecontinuously measured at the surface and averaged30'C during the main portion of the test, thoughthere were diurnal variations of 150 to 18'C in theinlet temperature and -3 0 C in'the outlet. The airtemperature at the bottom of the packer was also near30'C. Temperatures within the junction section ofthe'heater averaged 50'C. Therefore, by the time theinput air was within the junction section of theheater, its temperature had increased by -200 C fromthat at the bottom of the packer.
One obvious possibility is that the heating wascaused by conductive heat loss out of the upper endof the heater. However, assuming a thermal conduc-tivity of 15 W/m°C for the heater skin and elements,and 2 W/m°C for expanded vermiculites the totalconductive heat loss into the junction section of theheater was estimated at only -50 W. If this is true,the calculated rise in the temperature of the input aircaused by heating in the junction section is onlyl.5*C.
Before it reached the junction section, the inputair went through a 0.61-m-long section tightlywrapped with fiberglass insulation. The air tempera-ture at the bottom of this insulation rapidly increasedto between 930 and 97°C after the heater was turnedto full power. The stable temperature was at or slight-ly below 940C, the local boiling point of water. At theend of the experiment, the entire batt of insulationwas saturated with water, much like a sponge. It istherefore initially assumed that the entire mass of
insulation was maintained at a constant temperatureof near 90'C. With this assumption, a heat-transfercoefficient of 100 kcal/m 2-h-°C between the pipeand the inlet air, and an initial air temperature of30'C, -0.7 kW could have been continuously trans-ferred from the insulation batt and inlet pipe to theinlet air before the air reached the junction box.45This amount of heat would increase the temperatureof the inlet air by -20'C; i.e., almost exactly to themeasured temperatures inside the junction section. Ifthe air was assumed to exit the junction section at50'C, with the insulation a constant 90'C, then simi-lar calculations indicate that an additional 0.4 kW ofheat could be added to the exiting air by the time itreached the top of the insulation. Because the exit airat the surface was only at 30'C, however, the tem-perature of the exhaust air had to be buffered towardthe ambient temperature of the emplacement holealong the 20-m flow path to the surface.
.It thus appears possible to account for heating ofthe input air to measured junction-box temperaturessolely by heat transfer from the fiberglass insulationto the inlet air. Three factors must be kept in mind,however. First, the heat-transfer coefficient usedhere, 100 kcal/m 2-h-°C, is at the upper end of theapparent range for heat transfer to flowing gases." Atthe other extreme, 10 kcal/m2-h-°C, only 0.07 kWwould be transferred to the inlet air, and the tem-perature rise would only be -2 0 C. Secondly, thetemperature within the insulation was assumed uni-form. However, the thermocouple at the bottom ofthe packer and -1.3 m above the top of the insulationread only -30'C. Therefore, there must have beeneither a substantial gradient across the insulation, oracross the air gap between the top of the insulationand the bottom of the packer. Thirdly, that the tem-perature of the exit air at the surface was near 30'Crequired heat loss by this air between the top of theinsulation and the surface. If the exiting air gave offheat over this interval, there is no reason the input aircould not have been partially heated on its down-ward trip. If so, then the temperature of the input airas it entered the insulation-wrapped section of pipecould have been -50'C, and the heat losses in theregion of the heater quite slight.
II, 39
* I

It thus appears that a maximum uncertainty of-1 kW remains in the thermal power input into theargillite directly from the heater during this experi-ment. Under the approach resulting in 1 kW estimat-ed uncertainty, it appears that the forced cooling airserved as a continuous heat sink, while the fiberglassinsulation above the heater served as a continuousheat source. It remains to explain the heat-sourcebehavior of the fiberglass.
As mentioned above, the fiberglass appeared to bea fully saturated "sponge" at the end of the experi-ment. In addition, the 0.005-m-deep flange at the topof the heater was filled with water. One potentialmechanism for controlling temperatures at the top ofthe heater and for maintaining the bottom of thefiberglass at a temperature near 940C is continuouscondensation/evaporation of water.
Condensation in the fiberglass, accompanied byheat loss to inlet/exhaust air, would need to accountfor a heat input into the fiberglass of 1 kW at most.Given that the heat of vaporization of water is517 cal/cm3 at 1000 C, a heat release rate of 1 kWcorresponds to a water condensation rate of0.46 cm3/s of liquid water, or 1.8 x 10⁻³ m3 /h. In aclosed emplacement hole, this volume of water couldbe derived from recycling from the lower portions ofthe emplacement hole. After deepening of Si-1 thewater condensing on the fiberglass insulation wouldhave to have been derived from water driven out ofthe rock by heating.
The approximate average water-collection rate inS1-3 was -1.4 x 0-4m 3H 2O/h, one order of magni-tude lower than the required rate. This may havebeen caused by water losses in S1-1 and S1-3, or to thefact that only local refluxing occurred between thetop of the heater and the fiberglass batt. It may alsoindicate that most heat transfer relating to heatingand cooling of inlet and exhaust air was taking placeabove the insulation, and that heat losses in thevicinity of the heater were much less than I kW.
Thus considerable uncertainty remains about theamount of heat actually transferred to the rock direct-ly from the heater in this experiment. However, sincethe net differential in temperature between inlet andexhaust air was generally •2°C, all but -50 W of the3.8 kW was being put into the argillite between adepth of 24.4 m and the surface.
It was stated that there were large potential errorsin all measurements except temperature. Indeed, con-sideration of potential temperature errors caused byhole-hole shielding and differences between groutproperties and argillite properties47 indicates that themaximum credible temperature error in the groutedinstrumentation holes attributable to these factors is
< 1 C; the estimated precision of the thermocouplesis also + 1 C. Possible rotation of the PVC tubing thatthe thermocouples were strapped to could accountfor up to 0.05 m inaccuracy in placement. This is ofpotential concern only in the case of the innermostinstrumentation hole, which is at a radius of 0.61 m.Even in this case, however, the maximum potentialradial error is < 10 % of the nominal radius, and is notconsidered further.
Two thermocouples were mounted on the skinsurface of the heater in an attempt to measure rock-wall temperatures. These thermocouples were placedat the end of a spring of Inconel 750 and shielded by athin plate of Inconel 600 wrapped in gold foil. So thatthey would not drag against the hole wall duringheater insertion, the thermocouples were heldagainst the side of the heater by a washer consistingof a eutectic-composition alloy, Pb32 Bi1 5Sn 5 5. Thisalloy has a melting point of 950 C. When the heaterskin temperature reached approximately this tem-perature, the washers melted and the thermocoupleswere freed to spring out against the hole wall. Pre-liminary calculations48 considering conductive heattransfer down the spring, radiative transfer to thethermocouple bead, and convective transfer alongthe hole wall, indicate that the two thermocouplesshould have read temperatures -200 C too high. Thisanalysis, however, ignored the major contact resis-tance-between the spring and thermocouple sheath.In addition, the actual contact between the argilliteand thermocouple bead, given the softness of theargillite, may well have been greater than assumed inthe calculations. In light of these two factors, thecalculated 200 error is interpreted as a maximum. Atany rate, the potential errors appear to be such thatthe temperatures recorded by the side wall thermo-couples should be maximum.
Stress changes in a soft rock such as the Eleanaargillite are best measured by means of a soft-inclu-sion gauge. No reliable gauge of this type existed atthe time of fielding; therefore, an attempt was madeto modify standard Creare gauges for application insoft rocks. The Creare gauge is a vibrating wire gaugeactivated by a solenoid. Stress changes from thesetting stress (15 MPa) are then monitored to-+ 15% accuracy by measuring frequency changes of
the wire. For application to the Eleana test, however,it was felt that the setting stress, applied across therelatively small anchors of the gauges, would renderstress readings meaningless. To avoid or minimizethis effect, the stress gauges were first emplaced in a3.8-cm-OD aluminum tube with 1.5-mm-thick walls.The inside of this tube was then potted to provideenvironmental protection for the gauges. The entire
40

_. l .
assemblage was emplaced in the hole, and fixed inplace with an expanding grout, which generated-0.5 MPa pressure on the outside of the tube. It wasnot possible to calibrate this entire assemblage. Atambient temperature and for short periods of time,this approach should allow collection of reliablequalitative data. However, the thermal expansionand creep properties of the complete expanding-grout/pipe/Creare-gauge/argillite system are totallyunknown. Therefore, the data from the Crearegauges must be considered only qualitative, and use-ful only near ambient temperature.
The vertical extensometer assemblies used in thisexperiment each contained four rods, and were em-placed in an open but capped hole. Anchors were setat intervals of 1.5 m in each hole, with the bottomanchor at a depth of 24.4 m, and the top one at 19.8 m.Each rod was 0.013 m in diameter and consisted ofstandard Invar alloy from one of the anchors up to adepth of 18.3 m. From this depth to the surface, eachrod was made of stainless steel (SS304). Thermocou-ples were attached to the anchors at 24.4 and 19.8 m.
To be useful, extensometer data must be correctedfor the thermal expansion of the extensometer rods inthe heated region. Since thermocouples were em-placed only at the highest and lowest anchor posi-tions, this cannot be done directly in the intermediatedepths near 22.9 m, where it was assumed the tem-peratures would be greatest. The highest temperaturereached at the centerplane in Hole S1-5 (a groutedthermocouple hole) was 830C, an increase of 650Cabove the ambient temperature. The highest tem-peratures at 24.7 and 20.1 m in this hole were 640 and450C, respectively. Peak temperatures recorded at the24.4- and 19.8-m extensometer-anchor depths in S1-7were 400 and 680C, respectively. It iz 'vis impossibleto transfer temperatures from S1-5 to SI-7 for pur-poses of data reduction. Thermal convection in anopen hole (S1-7) is probably responsible for the dif-ference in the profile asymetry for the two holes.Upward convection was possible in S-7, since theonly material present in the hole (0.10-m dia) wasfour 0.01-m-dia rods. This type of heat transfer wasprohibited in Hole S1-5 by the fact that thermocou-ples in this hole were grouted in place.
Some sense can be made out of relative extensom-eter displacements, however, especially the move-ment of shallower anchors relative to the anchor at
24.4 m. Considered in this way, the thermal effects atall depths less than that of the shallower anchor arepresumably the same along both rods. Thus, only thethermal expansion of the extensometer rod betweenthe two anchor positions need be removed from thedata. For example, if it is assumed that the anchor at24.4 m is at 40'C, and that the anchor at 22.9 m is at900C, then the maximum credible differential ther-mal expansion effect is only about 7.6 x 10- m. Thisvalue is calculated by assuming a thermal expansioncoefficient of 1 x 1046C-i at 90 0C for the Invar rod,49 aconstant temperature differential of 50*C, and aninitial differential length of 1.52 m. Since the thermalexpansion coefficient chosen is the highest listedover the temperature range involved, and the tem-perature difference is assumed at its maximum alongthe entire length of rod, this calculated value shouldbe a maximum. Note that, since the estimated thermalcorrection for measurements between 24.4 and 22.9 mis only about one-half the estimated instrumentalerror of 13 x 10-' m, no temperature corrections areneeded at these depths. Maximum thermal expansionerrors between 24.4 and 19.8 m in Hole S-7 aregreater, and are calculated to be 2.4 x 10⁻⁴ m, abouttwice the inherent instrumental error. Thus, the ver-tical extensometer measurements even with the tem-perature uncertainties should be qualitatively correctif viewed as displacements relative to the anchor atthe 24.4-m depth, and if reported relative displace-ments exceed -2.4 x 10⁴ m.
Measurements of volatile pressures, though great-ly affected by permeability variations in the rockmass, are probably as accurate as instrumentationcapability limitations allow, except for the possibilityof leaks. The effects of such leaks cannot be mea-sured, except to say that the field measurements arealmost certainly minimal and of only qualitative val-ue. The same can be said of gas transmissivity testing,since the data reduction in an inherently fracturedmedium must use greatly simplifying assumptionsabout gas flow between holes.
In summary, all measurements made as part ofthis test except temperature measurements in grout-ed thermocouple holes were accompanied by field-related uncertainties that make the data obtainednecessarily qualitative.
41
1.__1._1_'___.':!___ _ _ - ------

ReferencesIThre Disposal of Radioactive Waste on Land, Report of the Com-
mittee on Waste Disposal of the Division of Earth Science, NASPublication 519 (Washington, DC: National Academy of Sciences -National Research Council, 1957).
2R. G. Dosch and A. W. Lynch, Interaction of Radionuclides with
Argillite from the Eleana Formation on the Nevada Test Site, SAND78-0893 (Albuquerque, NM: Sandia National Laboratories, 1979).
3T. Tamura, Sorption Phenomena Significant in Radioactive-Waste Disposal,' in Underground Waste Management and Environ-mepital Applications, Am Assn Petr Geol Mem. 18, 1973, pp 318-330.
41. W. Marine, Geohydrology of Buried Triassic Basin atSavannah River Plant South Carolina,' Am Assn Petr Geol Bull.58:1825-1837, 1974.
5J. B. Droste and C.J. Vitaliano, Geologic Report of the MaquoketaShale, New Albany Shale, and Borden Group Rocks in the Illinois Basin onPotential Solid Waste Repository Sites, prepared for the Office ofWaste Isolation, Oak Ridge, TN, 1977.
6C. E. Neuzil, 'Fracture Leakage in the Cretaceous Pierre Shaleand Its Significance for Underground Waste Disposal" (unpubl.PhD thesis. John Hopkins University, 1980).
7J. L. Krumhansl, Preliminary Results Report Conasauga Near-Siirface Heater Experiment, SAND79-0745 (Albuquerque, NM:Sandia National Laboratories, 1979).
8J L. Krumhansl, Final Report: Conasauga Near-Surface HeaterExperiment, SAND79-1855 (Albuquerque, NM: Sandia NationalLaboratories, 1979).
9 E. Tassoni, An Experiment on the Heat Transmission in aClay Rock,' pp 23-46 in Proceedings of the NEA Workshop on the Use ofArgillaceous Materials for the Isolation of Radioactive Waste, held atParis, France, September 10-12, 1979 (Paris, France: NEA/OECD,1980).
10F. G. Poole, F. N. Houser, and P. 0. Orkild, Eleana Formation ofNevada Test Site and Vicinity, Nye County, Nevada, USGS Prof. Paper424-D, pp D104-DI (Washington: Government Printing Office,1961).
"F. G. Poole, Flysch Deposits of Antler Foreland Basin, West-ern United States,' pp58-8 2 in Tectonics and Sedimentation, Soc.Econ. Paleon. Min. Special Publ. 22, W. R. Dickinson, ed (Tulsa,OK: 1974).
1 2 H. E. Simpson, J. W. Weir, and L. A. Woodward, Inventory ofClaW-Rich Bedrock and Metamorphic Derivatives in Eastern NevadaErcluding the Nevada Test Site. USGS Open File Report 79-760(Denver, CO: 1979).
13D. L. Hoover and J. N. Morrison, Geology of the Syncline RidgeArea Related to Nuclear Waste Disposal, Nevada Test Site, Nye County,Nevada, USGS Open-File Report, 1980.
14j. N. Hodson and D. L. Hoover, Geology of the UE17e Drill Hole,Area 17, Nevada Test Site, USGS Open-File Report USGS-1543-2,1979.
15Memo from G. T. Gay to A. R. Lappin, SNL, "X-Ray Analysisof Eleana Shale," March 8, 1977.
16 Memo from G. T. Gay to A. R. Lappin, SNL, X-Ray Analysisof Eleana Shale," May 9, 1977.
1 7Memo from G. T. Gay to A. R. Lappin, SNL, "X-Ray Analysisof Eleana Shale," July 14, 1977
18G. V. Henderson, The Origin of Pyrophyllite - Rectorite in Shalesof North Central Utah. Utah Geol. and Mineralogical Surv. SpecialStudies 34, 1971.
190. D. Christensen, 'Metamorphism of the Manning Canyonand Chairman Formations (PhD thesis, Stanford University,1975).
2 0 Huffman Laboratories, Inc. Analytical Report No. 4487701 toA. R. Lappin, SNL, dtd May 24, 1977 (Huffman Laboratories, Inc.,3830 High Court, P.O. Box 350, Wheat Ridge, CO 80033).
21R. G. Dosch, Assessment of Potential Radionuclide Transport inSite-Specific Geologic Formations. SAND79-2468 (Albuquerque, NM:Sandia National Laboratories, 1980).
2 2 Memo from J. Husler, UNM analyst, to A R. Lappin of SNL,"Shale Analyses," May 5, 1977.
2 3 Memo from J. Husler, UNM analyst, to A. R. Lappin of SNL,"Whole-Rock Analyses, Main Heater Hole, Eleana Experiment Site,SI-I,' May 24, 1978.
24F. J. Pettijohn, Sedimentary Rocks, 3rd ed. (New York: Harperand Rowe, 1975).
2 5 Personal communication with L. G. Schultz, USGS.2 6 Memo from J. Husler, UNM analyst, to A. R. Lappin of SNL,
'Trace Element Analysis, PPM,- June 25, 1977.2 7 Memo from J. Husler, UNM analyst, to A. R. Lappin of SNL,
"Trace Element Analyses, Main Heater Hole, Eleana ExperimentSite, 51-1 (PPM)," May 22, 1978.
2 8K. B. Krauskopf, Introduction to Geochemistry (New York:McGraw-Hill, 1967).
2 9C. E. Weaver and K. C. Beck, Clay-Water Diagenesis DuringBurial: How Mud Becomes Gneiss, Geol Soc Am Spec Paper 134, 1971.
30 L. A. Anderson, R. J. Bisdorf, and D. R. Schoenthaler, Resistiv-ity Sounding Investigation by the Schlumberger Method in the SynclineRidge Area, Nevada Test Site, Nevada, USGS Open File Report 80-466,1980.
31B. J. Murphy, M. Charnack, and D. L. Hoover, EngineeringGeology of the Eleana Heating Experiment Site, Area 17, Nevada Test Site,USGS Open-File Report USGS-464265 (in press).
32D. K. Gartling, COYOTE-A Finite Element Computer Programfor Nonlinear Heat Conduction Problems, SAND77-1332 (Albuquer-que, NM: Sandia National Laboratories, 1978).
3 3 G. R. Hadley and J. E. R. Turner, Jr., Evaporation Water Lossfrom Welded Tuff, SAND80-0201 (Albuquerque, NM: Sandia Na-tional Laboratories, 1980).
34D. F. McVey, A. R. Lappin, and R. K. Thomas, Test Resultsand Supporting Analysis of a Near-Surface Heater Experiment inthe Eleana Argillite," pp93-110 in Proceedings of the Use of Argilla-cious Materials for the Isolation of Radioactive Waste, held at Paris,France, September 10-12, 1979 (Paris, France: NEA/OECD, 1980).
3 5 Memo from D. F. McVey of SNL to Distribution, ThermalPredictions-Large-Scale Eleana Heater Test," April 13, 1978.
3 6 Memo from D. F. McVey to A. R. Lappin, SNL, RevisedThermal Predictions-Large-Scale Eleana Heater Test." January 22,1979.
3 7 K. J. Bathe, ADINA, A Finite Element Program for AutomaticDynamic Incremental Nonlinear Analysis, MIT Report 82448-1, 1977.
3 8 A. R. Lappin and W. A. Olsson, 'Material Properties of EleanaArgillite-Extrapolation to Other Argillaceous Rocks, and Implica-tions for Waste Management," pp75-91 in Proceedings of the Use ofArgillaceous Materials for the Isolation of Radioactive Waste, held atParis, France, September 10-12, 1979 (Paris, France: NEA/OECD,1980).
42

3 9 W. A. Braddock and M. Machette, Experimental Deformation ofPierre Shale, Document AFGL-TR-76-0086 (Hanscom AFB, MA: AirForce Geophysical Laboratory, Air Force Systems Command,USAF, 1976).
40D. F. McVey, R. K. Thomas, and A. R. Lappin, Small ScaleHeater Tests in Argillite of the Eleana Formation at the Nevada Test Site,SAND79-0344 (Albuquerque, NM: Sandia National Laboratories,1979).
4 1D. F. McVey, R. K. Thomas, and A. R. Lappin, Farfield Thermo-mechanical Response of Argillaceous Rock to Emplacement of a Nuclear-Waste Repository, SAND79-2230 (Albuquerque, NM: SandiaNational Laboratories, 1980).
42C. E. Weaver, Geothermal Alteration of Clay Minerals and Shales:Diagenesis, ONWI-21, 1979.
4 3 Memo from J. Husler, UNM analyst, to A. R. Lappin of SNL,'Chemical Analyses of Posttest Eleana Samples,' September 14,1979.
44Memo from J. W. Braithwaite and W. L. Larson of SNL toDistribution, Metallurgical Examination of Metals Used in EleanaHeater Experiment, June 1, 1979.
4 5 Memo from A. R. Lappin of SNL to Distribution, Junction-Section Heat Losses of Eleana Heater Due to Forced Cooling,' July26, 1978.
4 6R. B. Bird, W. E. Stewart, and E. N. Lightfoot, TransportPhenomena (New York: John Wiley and Sons, Inc., 1960).
4 7 Memo from D. F. McVey of SNL to J. F. Cuderman of SNL,Influence of Grout Thermal Conductivity and Density on Mea-sured Temperatures in Nevada Eleana Shale Thermal Experiment,'July 29, 1977.
4 8 Memo from B. M. Bulmer of SNL to D. F. McVey of SNL,'Eleana Heat-Transfer Experiment: Thermocouple Analysis,'November 30, 1977.
4 9 Y. S. Touloukian, et al, Thermophysical Properties of Matter, vol12 of Thermal Expansion (of) Metallic Elements and Alloys (New York:IFI/Plenum, 1975).
43-44

DISTRIBUTION:
US Department of EnergyAssistant Secretary
for Defense ProgramsMail Stop SF-066Washington, DC 20545Attn: D. C. Sewell (DP-1)
US Department of EnergyAssistant Secretary Nuclear EnergyMail Stop 6E-09SWashington, DC 20545Attn: G. W. Cunningham (NE-1)
US Department of Energy (9)Office of Nuclear Waste ManagementMail Stop B-107Germantown, MD 20767Attn: S. Meyers (NE-30)
R. G. Romatowski (NE-30)C. A. Heath (NE-330)D. L. Vieth (NE-332)R. Stein (NE-330)C. R. Cooley (NE-330)M. W. Frei (NE-332)G. P. Dix (EV-12)C. D. Newton (NE-30)
US Department of Energy (2)Richland Operations OfficePost Office Box 550Richland, WA 99352Attn: F. Standerfer
D. J. Squires
US Department of EnergyAlbuquerque Operations OfficePost Office Box 5400Albuquerque, NM 87115Attn: D. T. Schueler, Jr.
US Department of EnergySan Francisco Operations Office1333 Broadway, Wells Fargo Bldg.Oakland, CA 94612Attn: L. Lanni
Rockwell InternationalAtomics International DivisionRockwell Hanford OperationsRichland, WA 99352Attn: R. Deju
B. Dietz
US Department of Energy (27)Nevada Operations OfficePost Office Box 14100Las Vegas, NV 89114Attn: M. E. Gates
R. W. TaftR. W. NewmanJ. B. CotterM. P. KunichH. L. MelanconC. P. BromleyR. H. RichardsF. C. HoodA. J. RobertsR. M. NelsonD. F. MillerP. J. MudraR. H. Marks, CP-1, M/S 210S. R. ElliottB. W. ChurchT. H. BlankenshipR. R: Loux (10)
US Department of Energy (3)NTS Support OfficePost Office Box 435Mercury, NV 89023Attn: J. H. Dryden, M/S 701
F. Huckabee, M/S 701L. P. Skousen, M/S 701
US Department of EnergyDOE-IXDirector of External Affairs333 Market Street, 7th FloorSan Francisco, CA 94105Attn: D. J. Cook
US Department of EnergyNational Program Office505 King AvenueColumbus, OH 43201Attn: J. 0. Neff
Nuclear Regulatory Commission (3)Washington, DC 20555Attn: J. C. Malaro, M/S SS-674
R. Boyle, M/S P-522D. Alexander, M/S 905SS
I
45

DISTRIBUTION (cont):
Holmes & Narver, Inc.Post Office Box 14340Las Vegas, NV 89114Attn: A. E. Gurrola, M/S 158
Lawrence Livermore National Laboratory (8)University of CaliforniaPost Office Box 808Livermore, CA 94550Attn: L. D. Ramspott, L-204
A. Holzer, L-209L. B. Ballou, L-204R. L. Wagner, L-1K. Street, L-209W. C. Patrick, L-204A. B. Miller, L-204D. J. Isherwood, L-224
Los Alamos National Laboratory (5)University of CaliforniaPost Office Box 1663Los Alamos, NM 87545Attn: K. Wolfsberg, M/S 514
L. S. Germain, M/S 570L. Lanham, M/S 755B. R. Erdal, M/S 514J. R. Smyth, M/S 978
Westinghouse (8)Post Office Box 708Mercury, NV 89023Attn: A. R. Hakl, M/S 703
Westinghouse - AESD (11)Post Office Box 10864Pittsburgh, PA 15236Attn: J. B. Wright (6)
W. R. MorrisT. E. CrossR. J. BahorichC. R. BolmgrenW. A. Henninger
Nuclear Fuel Cycle ResearchUniversity of ArizonaTucson, AZ 85721Attn: J. G. McCray
US Geological Survey (3)National CenterRestor, VA 22092Attn: G. D. DeBuchananne, M/S 410
P. R. Stevens, M/S 410D. B. Stewart, M/S 959
US Geological Survey (3)Post Office Box 25046Federal CenterDenver, CO 80301Attn: W. S. Twenhofel, M/S 954
G. L. Dixon, M/S 954D. L. Hoover, M/S 954
Geologic Society of America3300 Penrose PlaceBoulder, CO 80301Attn: J. C. Frye
Kansas Geological SurveyUniversity of KansasLawrence, KS 66044Attn: W. W. Hambleton
Battelle (17)Office of Nuclear Waste Isolation505 King AvenueColumbus, OH 43201Attn: N. E. Carter
S. C. MatthewsW. E. NewcombW. M. HewittR. J. HallS. J. BashamG. E. RainesN. J. HubbardJ. E. MonseesJ. A. CarrONWI Library (5)R. A. RobinsonW. A. Carbiener
State of NevadaCapitol ComplexCarson City, NV 89710Attn: R. Hill,
State Planning Coordinator
Fenix & Scisson, nc.Post Office Box 498Mercury, NV 89023Attn: F. D. Waltman, M/S 940
State of NevadaCapitol ComplexCarson City, NV 89710Attn: N. Clark,
Department of Energy
46
II
DISTRIBUTION (cont):
.1
4
I
.1 __
Western Region LibraryNo. 3 Embarcardero CenterSan Francisco, CA 94111Attn: Woodward-Clyde Consultants
Department of ChemistryIdaho State UniversityPocatello, ID 83201Attn: J. L. Thompson
Holmes & Narver, Inc.Post Office Box IMercury, NV 89023Attn: C. E. Christensen, M/S 605
John A. Blume EngineersSheraton Palace Hotel130 Jessie StreetSan Francisco, CA 94105Attn: P. Yanev
Harvard UniversityDepartment of Earth SciencesCambridge, MA 02138Attn: R. Siever
Department of Earth SciencesDartmouth CollegeHanover, NH 03755Attn: J. Lyons
International Atomic Energy AgencyDivision of Nuclear Power & ReactorsKarntner Ring 11Post Office Box 590, A-1011Vienna, AustriaAttn: J. P. Colton
Fenix & Scisson, Inc.Post Office Box 15408Las Vegas, NV 89114Attn: J. A. Cross, M/S 514
Princeton UniversityDepartment of Civil EngineeringPrinceton, NJ 07540Attn: G. Pinder
California Energy ResourcesConservation & DevelopmentCommission
1111 Howe AvenueSacramento, CA 95825Attn: A. Soinski
University of CaliforniaLawrence Berkeley LaboratoryEnergy & Environment DivisionBerkeley, CA 94720Attn: P. Witherspoon
Hanford Engineering Development.Laboratory
Post Office Box 1970Richland, WA 99352Attn: D. Cantley
Arthur D. Little, Inc.Acorn ParkCambridge, MA 02140Attn: C. R. Hadlock
Brown UniversityDepartment of Geological
SciencesProvidence, RI 02912Attn: B. Giletti
Texas A&M UniversityCenter for TectonophysicsCollege Station, TX 77840Attn: J. Handin
Law Engineering Testing Co.2749 Delk Road, S.E.Marietta, GA 30067Attn: B. Woodward
Subcommittee on EnergyResearch & Production
Room B-374Rayburn House Office Bldg.Washington, DC 20575Attn: S. Lanes, Staff Director
Bureau of Radiation ControlDepartment of Health and EnvironmentForbes FieldTopeka, KS 66620Attn: G. W. Allen, Director
State of ConnecticutEnergy Research and Policy80 Washington StreetHartford, CT 06115Attn: F. N. Brenneman
47

DISTRIBUTION (cont):
Executive OfficeLansing, MI 48909Attn: W. C. Taylor,
Science Advisor
Director for Policy and PlanningRoom 300, 325 West Adams StreetSpringfield, IL 62706Attn: A. Liberatore
Nuclear Projects CoordinatorNuclear Energy DivisionPost Office Box 14690Baton Rouge, LA 70808Attn: L. Hall Bohlinger
Oregon Department of EnergyLabor & Industries Bldg.Room 111Salem, OR 97310Attn: D. W. Godard
Radiation Protection Division1000 Northeast 10th StreetPost Office Box 53551Oklahoma City, OK 73152Attn: R. L. Craig, Director
Federal Agency Relations1050 17th St., N.W.Washington, DC 20036Attn: 0. H. Davis, Director
Environmental Program Supervisor903 Ninth Street Office Bldg.Richmond, VA 23219Attn: K. J. Buttleman
Energy AdministrationDepartment of Natural ResourcesTawes State Office Bldg.Annapolic, MD 21401Attn: P. Massicot, Acting Director
State of Ohio EnvironmentalProtection Agency
Box 1049, 361 E. Broad St.Columbus, OH 43216Attn: J. F. McAvoy, Director
State of ConnecticutHouse of RepresentativesOne Hundred and Sixth District24 Rock Ridge RoadNewton, CT 06470Attn: J. W. Anderson
Reynolds Electrical & Eng. Co., Inc. (7)Post Office Box 14400Las Vegas, NV 89114Attn: H. D. Cunningham, M/S 555
W. G. Flangas, M/S 615G. W. Adair, M/S 154V. M. Milligan, M/S 765C. W. Dunnam, M/S 745R. L. Powell, M/S 634R. B. Land, M/S 585
i
I
iiI
Ii
i
i
Ii
i
Missouri Department of Natural ResourcesPost Office Box 176Jefferson City, MO 65102Attn: T. D. Davis
Mississippi Department of Natural ResourcesSuite 228, Barefield Complex455 North Lamar StreetJackson, MS 39201Attn: P. T. Bankston
Tennessee Energy AuthoritySuite 708 Capitol Blvd. Bldg.Nashville, TN 37219Attn: J. A. Thomas, Associate Director
Council Member374 South Rock River DriveBerea, OH 44017Attn: G. A. Brown
Radiation Health Information ProjectEnvironmental Policy Inst.317 Pennsylvania Ave., S.E.Washington, DC 20003Attn: E. Walters
Nuclear Safety Associates, Inc.5101 River RoadBethesda, MD 20016Attn: J. A. Lieberman
48

. I I 9
*1.2&i
*1
DISTRIBUTION (cont):
Public Law Utilities GroupOne American Place, Suite 1601Baton Rouge, LA 70825Attn: D. Falkenheier,
Assistant Director
Associate Dean for ResearchGeorgia Institute of TechnologyAtlanta, GA 30332Attn: R. Williams
Fenix & Scisson, Inc.Post Office Box 498Mercury, NV 89023Attn: D. A. Robins, M/S 940
Reynolds Electrical & Engineering Co., Inc.Post Office Box 14400Las Vegas, NV 89114Attn: E. H. Weintraub, M/S 625
US Department of Energy (2)Division of Waste IsolationGermantown, MD 20767Attn: . W. Rowen, (DP-342)
M. E. Langston, (ME-512), MIS B-107
Energy Facility SiteEvaluation Council
820 East Fifth AvenueOlympia, WA 98504Attn: N. D. Lewis
University of Texas at AustinUniversity Station, Box XAustin, TX 78712Attn: E. G. Wermund
Department for Human ResourcesCommonwealth of KentuckyFrankfort, KY 40601Attn: R. M. Fry
Office of Energy Resources73 Tremont StreetBoston, MA 02108Attn: L. Morgenstern
Department of Environmental RegulationTwin Towers Office Bldg.2600 Blair Stone RoadTallahassee, FL 32301Attn: D. S. Kell
Holmes & NarverPost Office Box IMercury, NV 89023Attn: V. L. Angell, MIS 605
WestinghousePost Office Box 708Mercury, NV 89023Attn: R. L. Malloy, M/S 703
EG&G, Inc.Post Office Box 295Mercury, NV 89023Attn: W. C. Roper, MIS 570/N24
Office of Nuclear Waste Isolation505 King AvenueColumbus, OH 43201Attn: M. J. Golis
Hanford EngineeringDevelopment Laboratory
Post Office Box 1970Richland, WA 99352Attn: D. L. Garland
Rockwell Hanford OperationsPost Office Box 800Richland, WA 99352Attn: D. A. Turner
Westinghouse Electric Corp.Post Office Box 40039Albuquerque, NM 87106Attn: D. I. Hulbert
Oak Ridge National LaboratoriesPost Office Box XOak Ridge, TN 37830Attn: H. C. Claiborne
Rockwell Hanford OperationsEnergy Systems GroupPost Office Box 800Richland, WA 99352Attn: K. R. Hoopingarner,
Manager, Master Planning
Battelle Pacific Northwest LaboratoryPost Office Box 999Richland, WA 99352Attn: J. L. McElroy
49

DISTRIBUTION (cont):
RE/SPEC, Inc.Post Office Box 725Rapid City, SD 57709Attrv J. D. Osnes
Science Applications, Inc.Post Office Box 843Oak Ridge, TN 37830Attn: L. D. Rickertsen
E. 1. DuPont de Nemours & CompanySavannah River LaboratoryAiken, SC 29801Attn: N. E. Bibler
US Department of EnergyNuclear Environmental Application BranchMail Station E-201 (Gtn)Washington, DC 20545Attn: R. W. Barber, Acting Chief
Gesellschaft fur Strahlen-undUmweltforschung MBH MunchenInstitut fur Tieflagerung3392 Clausthal-ZellerfeldBerliner Strasse 2Federal Republic of GermanyAttn: K. Kuhn
Hahn-Meitner-Institut fur KernforschungGlienicker Strasse 1001000 Berlin 39Federal Republic of GermanyAttn: K. Eckart Maass
Bundesanstalt fur Geowissenschaftenund Rohstoffe
Postfach 510 1533000 Hannover 51Federal Republic of GermanyAttn: M. Langer
Kernforschung KarlsruhePostfach 36407500 KarlsruheFederal Republic of GermanyAttn: R. Kraemer
Phvsikalische-TechnischeBundesanstalt
Bundesalle 100, 3300 BraunschweigFederal Republic of GermanyAttn: H. Rothemeyer
Bundesministerium fur Forschungund Technologie
Postfach 200 7065300 Bonn 2Federal Republic of GermanyAttn: Rolf-Peter Randl
Georgia Institute of TechnologySchool of Nuclear EngineeringAtlanta, GA 30332Attn: M. Carter
1417 F. W. Muller1417 G. F. Rudolfo1762 M. R. Zimmerman4413 N. R. Ortiz4500 E. H. Beckner4510 W. 0. Weart4530 R. W. Lynch4537 L. D. Tyler (10)4537 A. R. Lappin (50)4538 R. C. Lincoln4540 M. L. Kramm4550 R. M. Jefferson5510 D. B. Hayes5511 J. W. Nunziato5512 D. F. McVey (10)5521 L. W. Davison5521 R. K. Thomas (10)5532 B. M. Butcher5532 W. A. Olsson5541 W. C. Luth5541 J. L. Krumhansl8214 M. A. Pound3141 L. J. Erickson (5)3151 W. L. Garner (3)
For DOE/TIC (Unlimited Release)DOE/TIC (25) (C. H. Dalin, 3154-3)
50

Org. Bldg. Name PRec'd bY Org. Bldg. Name Rec'd
f _____________