egypt economic report 2016 - bank audi · at the banking sector level, the banking system has been...
TRANSCRIPT

1February 24, 2016
ECONOMICS
EGYPT
FEBRUARY 24, 2016
TABLE OF CONTENTS
CONTACTS
Executive Summary 1
Introduction 2
Economic Conditions 4
Real Sector 4
External Sector 8
Public Sector 10
Financial Sector 11
Concluding Remarks 18
The Egypt Economic Report can be accessed via internet at the following web address: http://www.bankaudigroup.com
EGYPT ECONOMIC REPORTBETWEEN THE RECOVERY OF THE DOMESTIC ECONOMY AND THE BURDEN OF EXTERNAL SECTOR CHALLENGES
• Economy recovering after four years of slow activityThe Ministry of Planning issued real GDP figures for 2014/15, showing that the economy grew by 4.2% at market prices, the best performance since 2009/10. There is a reasonable chance of a similarly strong growth performance in 2015/16, if the government can address the hard-currency shortage, which has weakened business sentiment in recent months. The government will be assisted in this task by an influx of multilateral assistance from the IMF and the World Bank, which will help to offset some of the recent setbacks to tourism, following the bombing of a Russian airliner in Sinai in October. Egypt’s economic outlook remains positive for the years to come, with this optimism reinforced by the Zohr gas discovery.
• Significant surge in current account deficitEgypt’s external accounts registered over the past year a surge in the current account deficit on the back of deteriorating surpluses in the services and transfers balances. Exports dropped by a significant 25.0% over the first nine months of 2015, despite the currency depreciation of 8.8% registered between 9M 2014 and 9M 2015, mainly due to the drop in the value of petroleum exports. In parallel, imports decreased by 10.4% year-on-year. Subsequently, Egypt’s current account deficit more than tripled to reach US$ 11.9 billion in the first nine months of 2015, up from US$ 3.3 billion in the same period of 2014.
• Fiscal reforms paving the way for fiscal softlandingThe Egyptian government took positive steps towards fiscal reforms in the past year that have boosted the confidence in the economy since their announcement and helped reposition Egypt on an enhanced fiscal trajectory. The overall budget deficit has narrowed gradually from 13.0% of GDP in FY 2013 to 12.2% in FY 2014 and to 11.5% in FY 2015, helped by lower energy subsidies and tight limits on wages and employment. There are signs that the government will consolidate its austerity drive in the current fiscal year, as the FY 2016 budget registers ambitious targets. Fiscal deficit is expected to decrease both in absolute terms and as a percentage of GDP in FY 2016, as it is expected to narrow to 8.9% of GDP in FY 2016.
• New era of monetary policy amidst foreign exchange shortages and high inflationThe fiscal year 2016 saw several important milestones so far after a new Central Bank Governor assumed office in November 2015, introducing a shift from an accommodative monetary policy to a tight one amidst a stubbornly high inflation, easing capital controls and initiating new import rules in the aim of solving Egypt’s chronic foreign exchange shortages. This came along pressures on the Central Bank of Egypt’s gross official reserves despite GCC deposits. Inflation remains stubbornly high, largely due to supply bottlenecks and the Egyptian Pound depreciation. The Headline Consumer Price Index for urban areas rose by 11.0% on average in FY 2015 and by 9.6% on average during the first half of FY 2016.
• Healthy banking activity growth and adequate financial standing despite currency pressures Egyptian banks managed to record healthy activity growth rates over the course of the year 2015, supported by an improved macroeconomic environment on the overall despite local currency depreciation against the greenback and tough regional conditions in neighboring countries. Measured by the total assets of banks, sector activity grew by 27.6% in local currency terms (16.4% in US dollar terms) over the first 11 months of 2015 to reach the equivalent of US$ 320.6 billion at end-November 2015. The US$ 45.3 billion assets increase proved 31% higher than the growth registered during the 2014 corresponding period.
• Capital markets under downward price pressures amidst weaker investor sentiment across the regionEgypt’s capital markets followed a downward trajectory over the year 2015, mainly dragged by weaker investor sentiment across the MENA region, lingering local security and geopolitical concerns and speculation about an interest rate hike by the US Federal Reserve. Accordingly, the Egyptian Exchange price index of the 30 most highly capitalized and liquid stocks saw its first contraction in four years. The fixed income market registered sharp price declines that swept out the previous year’s gains, and the cost of insuring debt expanded significantly. The bourse main benchmark index (EGX 30) tumbled by 21.5% in 2015 to close at 7,006.01 at year-end. In parallel, Egyptian sovereign debt papers saw downward price movements in 2015, with Z-spreads widening significantly, tracking price falls across the region. Egypt’s five-year CDS spreads, a reflection of market perception of country risks, widened significantly by 196 bps over the year to close at 478 bps at end-2015, following a notable contraction of 323 bps in 2014.
Bank Audi sal - Group Research Department - Bank Audi Plaza - Bab Idriss - PO Box 11-2560 - Lebanon - Tel: 961 1 994 000 - email: [email protected]
Research
Marwan S. Barakat(961-1) [email protected]
Jamil H. Naayem(961-1) [email protected]
Salma Saad Baba(961-1) [email protected]
Fadi A. Kanso(961-1) [email protected]
Sarah F. Borgi(961-1) [email protected]
Gerard H. Arabian(961-1) 964047 [email protected]
Farah N. Nahlawi(961-1) [email protected]

2February 24, 2016
ECONOMICS
EGYPT
FEBRUARY 24, 2016
Over the past year, the Egyptian economy has considerably recovered after four years of slow activity. The Ministry of Planning issued real GDP figures for 2014/15, showing that the economy grew by 4.2% at market prices, the best performance since 2009/10. There is a reasonable chance of a similarly strong growth performance in 2015/16, if the government can address the hard-currency shortage, which has weakened business sentiment in recent months. The government will be assisted in this task by an influx of multilateral assistance from the IMF and the World Bank, which will help to offset some of the recent setbacks to tourism, following the bombing of a Russian airliner in Sinai in October. Egypt’s economic outlook remains positive for the years to come, with this optimism reinforced by the Zohr gas discovery. The recent major gas recovery by the Italian firm ENI, together with improved terms, has encouraged development of previously discovered fields.
At the monetary level, headline inflation remains stubbornly high at 11.1% in December 2015 due largely to supply bottlenecks. Egypt did not seemingly benefit from lower international oil prices, as prices continue to trend upwards especially within the context of the Egyptian Pound depreciation against the US dollar. Increased downward pressure on the Pound has prompted State-owned banks to increase interest rates on some of their local-currency savings products, in an indication of significant changes in monetary policy that are likely to be made under the newly appointed Central Bank Governor. The increase in deposit rates offered by State-owned banks appears to be a signal that the Central Bank is likely to announce a significant rise in rates in the coming months.
The tightly managed currency is coming under increasing scrutiny. Ongoing security concerns and economic uncertainty continue to provide a challenging backdrop for the Central Bank. Under the leadership of the former CBE Governor whose term ended on November 26th, the Pound was allowed to depreciate against the US dollar, crossing the LE/US$ 8 line for the first time in mid-October, before strengthening slightly thereafter. This was the third time in 2015 that the CBE has effected a limited devaluation, and comes only weeks after the IMF urged the authorities to adopt a more flexible approach towards exchange-rate policy. The Egyptian Pound has accordingly depreciated by 9.6% in 2015, moving from LE/US$ 7.15 at December-end 2014 to LE/US$ 7.83 at December-end 2015, while the black market rate is quoted at LE/US$ 8.50. Foreign currency reserves have fallen from US$ 36 billion before the 2011 uprising to US$ 16.5 billion (3.4 months of imports) in December, leaving the Central Bank with little scope to defend the Pound from mounting downward pressure.
At the public finance level, fiscal reforms pave the way for narrower deficits. The fiscal deficit narrowed to 11.5% of GDP, helped by lower fuel subsidies and tight limits on wages and employment. The sharp fall in oil prices is providing some further breathing space to the 2015/16 budget. The introduction of the smart card last year has been successful in monitoring consumption and limiting smuggling. In addition, a draft
Sources: IMF, Bank Audi’s Group Research Department Sources: Central Bank of Egypt, Bank Audi’s Group Research Department
GROSS DOMESTIC PRODUCT GDP BREAKDOWN BY ECONOMIC ACTIVITY (FY 2015)

3February 24, 2016
ECONOMICS
EGYPT
FEBRUARY 24, 2016
VAT law is ready and officials are hopeful that this will be ratified by the new Parliament so that it can be launched by July 2016. With these measures, it is hoped that the deficit would narrow further to less than 10% of GDP in FY 2015/16.
Egypt’s capital markets were at the image of regional tensions and the adverse effects of the drop in oil prices. Egypt’s 5-year CDS spreads, a reflection of market perception of country risks, reported a 196 basis points expansion to reach 478 basis points. The Egyptian Stock Exchange saw a 27.5% drop in prices in 2015, driven by weaker investor sentiment across the region, some adverse local security developments and lingering geopolitical concerns after the terrorist act that brought down the Russian passenger plane in Egypt on October 31, 2015. The latter according to Moody’s would have credit negative implications for the country’s balance of payments and pose downside risks to the country’s outlook. These unfavourable market spillovers were partly offset by Saudi Arabia’s pledge towards the end of 2015 to raise its investments in Egypt and to contribute to providing Egypt with petroleum needs for the next five years.
At the banking sector level, the banking system has been relatively resilient to the regional turmoil amidst a tough operating environment. In details, over the first 11 months of 2015, bank assets grew by the equivalent of 27.6% in local currency terms (16.4% in US$ terms), while deposits grew by 20.6% in local currency terms (10.1% in US$ terms). In parallel, bank loans grew by 24.7% in local currency terms (13.9% in US$ terms), suggesting growing lending opportunities in a recovering economy. Net profits for 11 listed banks reported a yearly growth of 35% over the first nine months of 2015 (24% in US$ terms). Financial soundness indicators remain satisfactory, with a non-performing loan ratio of 7.2% of total loans along with a provisioning ratio of 99% of non-performing loans, a capital adequacy ratio of 13.2% and a return on average assets of 1.3% and a return on average equity of 18.9%. The anticipated sound economic growth in Egypt is likely to translate into a double-digit growth in monetary and banking aggregates over the years ahead supporting the improvement of earnings growth of banks operating in Egypt.
The detailed developments in the real sector, external sector, public sector and financial sector follow next, while the concluding remarks are meant to address the main challenges facing the near term outlook.

4February 24, 2016
ECONOMICS
EGYPT
FEBRUARY 24, 2016
1. ECONOMIC CONDITIONS1.1. REAL SECTOR
1.1.1. Agriculture
Stable growth in the sector and a number of its components
The agricultural sector, considered one of the significant contributors to the Egyptian economy, took over a share of 11.2% in the country’s GDP in FY 2015, down from 14.5% in FY 2014. Maintaining a constant growth from FY 2014, the agriculture, forestry and fishing sector grew by 3.0% in FY 2015. A similar trend took over the first quarter of 2016. In this context, the sector contribution to GDP at factor cost using current prices, stood at LE 27.5 billion in FY 2015, up by 13.9% from LE 24.1 billion in FY 2014. The credit facilities to the sector accounted for 1.2% of total credit facilities at end-November 2015, unchanged from the previous year.
On a side note, the country’s implemented investments in the agriculture and irrigation sectors grew by 10.8% from US$ 1.6 billion in FY 2014 to US$ 1.8 billion in FY 2015. In contrast, the share of implemented investments in agriculture and irrigation to total investments declined from 4.3% in FY 2014 to 4.0% in FY 2015. This followed two consecutive increases between FY 2012, FY 2013 and FY 2014.
Wheat production stood at 8.3 million tons in 2015, up by 0.6% from 8.25 million tons in the previous year, which came after a yearly decline of 2.9% in 2014. Corn production was on an increasing path as well, growing by 2.8% from 5.8 million tons in 2014 to 5.96 million tons in 2015. This followed two years of constant production levels. Sugar production encountered a slight improvement, edging up by an annual 1.8% from 2.0 million tons in 2014 to 2.1 million tons in 2015. However, rice production fell from 4.75 million tons in 2014 to 4.53 million in 2015, a yearly decrease of 4.6%. This came after three years of positive growth, specifically 37.1%, 10.1% and 1.6% in 2012, 2013 and 2014 respectively. In this context, the Egyptian government’s decision to break the ban enforced since November 2013 and allow rice exports from the country would boost output.
The development of the sector, which is the fourth largest contributor to the Egyptian economy’s GDP, suffers from a few weaknesses. Currently, a small share of Egypt’s landmass mostly surrounding the Nile delta qualifies as agricultural land, putting strong pressure on output growth. However, the Egyptian government aims to continue investing in land reclamation projects, raising the area available for
Sources: Central Bank of Egypt, Bank Audi’s Group Research Department
IMPLEMENTED INVESTMENTS IN AGRICULTURE & IRRIGATION SECTOR

5February 24, 2016
ECONOMICS
EGYPT
FEBRUARY 24, 2016
agricultural output. The sector is a priority for the government which is ensuring continued levels of investment.
1.1.2. Industry
Manufacturing sector posts further improvements in 2015
Egypt’s extractive and manufacturing industries witnessed mixed performances in FY 2015, with the country’s extractive industries remaining on a downward trend while the manufacturing industries further improved from the levels seen in the previous fiscal year.
In details, the industries of extractions contracted by 4.1% in FY 2015, relative to a 3.8% decline in growth in the previous fiscal year. Extractive industries comprise petroleum industries, gas industries, and other extractions. Petroleum industries grew by 1.7% in FY 2015 against a 1.8% expansion in FY 2014. Gas industries contracted by 10.4% in FY 2015 compared to a 9.4% contraction in the previous year. The last sub-sector of extractive industries is other extractions, which witnessed a growth of 3.5% in FY 2014 against 2.1% in the past fiscal year.
In contrast to the country’s extractive industries, the Egyptian manufacturing industries further capitalized on their growth in the previous fiscal year, growing by 2.9% in FY 2015 against 4.8% in FY 2014. Manufacturing industries consist of the petroleum refining and other manufacturing sub-sectors. Egypt’s petroleum industries contracted by 3.3% in the past fiscal year, compared to a growth rate of 2.4% in FY 2014. Other manufacturing industries posted an expansion of 5.0% in FY 2015, relative to a 5.6% rise in the previous fiscal year.
Moving on to implemented investments in the country, crude oil, natural gas and other manufacturing industries witnessed rises in FY 2015 compared to the previous year. Crude oil projects implemented investments increased by 33.0% in FY 2015, against a contraction of 90.5% in FY 2014. Furthermore, implemented investments in natural gas expanded by 32.0% in FY 2015, compared to a contraction of 28.6% in the previous fiscal year. Other manufacturing industries also grew by 4.0% from FY 2014.
In fact, as part of investments in Egypt, Russia selected the East Port Said area to establish its industrial zone. The Russian industrial zone would include tailored industries such as engineering, machineries, equipments, ship manufacturing and food. The value of Russian investments in Egypt was estimated at US$ 107.8 million, equivalent to 398 firms in various sectors notably tourism, services and construction.
It is worth noting that the Egyptian government has done well in supporting and stimulating various industries in the country. For instance, the Industrial Development Authority (IDA) at the Egyptian Ministry of Industry announced plans to build 21 specialized industrial clusters for small and medium industries costing more than LE 2 billion (US$ 260 million) across 14 governorates. The clusters for furnishings, readymade garments, handicrafts and hand-made carpets would be located in the governorates of Kafr El Sheikh, Marsa Matrouh, Aswan and Red Sea.
Moreover, investments worth US$ 30 billion in the country’s coal industry are expected to be conducted within the next five years, as per Egypt’s Investment Minister. The latter added that using coal as a source of energy would decrease the country’s dependency on natural gas as a prime source of energy, and also decrease its dependency on petroleum products in steel and cement production.
Additionally, Egypt opened the 35-kilometer expansion to the Suez Canal in August 2015, which runs parallel to the existing waterway and a widening of almost 40 kilometers of the existing canal. The expansion is part of a wider program to increase the Suez Canal’s economic contribution, including the establishment of an economic zone for manufacturing and logistics. The total cost for the expansion of around US$ 8 billion was raised entirely from domestic sources via the issuance of five-year non-tradable Suez Canal investment certificates.

6February 24, 2016
ECONOMICS
EGYPT
FEBRUARY 24, 2016
Last but not least, Egypt’s industrial sectors are expected to witness further growth in the upcoming year, supported by the Egyptian authorities’ encouraging initiatives. The government is counting on import rationalization and boosting FX resources to attain the larger goals of stimulating domestic demand. Tariff and non-tariff barriers are being used by the authorities to reshuffle it to more strategic sectors, while encouraging domestic demand and protecting the local industry.
1.1.3. Construction
Construction sector builds further on strong performance from previous year
Egypt’s construction and building sector, which accounted for 4.8% of Egypt’s GDP, was on track in FY 2015, building on its strong performance from the previous fiscal year. The sector grew by 9.7% in the past fiscal year, further expanding from a 7.4% growth in FY 2014.
Within the context of investments in construction and building activity, the value of investments rose by 43.2% in local currency terms in FY 2015 to reach LE 3.7 billion (US$ 506.2 million), following a contraction of 19.1% in FY 2014, as per Central Bank data. The share of investment in construction out of total investments in the country rose from 1.0% in FY 2014 to 1.1% in FY 2015.
It is worth noting that the bulk of investments in the construction sector came from the private sector. In effect, the private sector’s share out of total investment in the construction and building sector moved up to 75.2% in the past fiscal year from 70.0% in FY 2014. Nonetheless, one factor constraining the further growth of the construction sector is the government’s inability to provide a favorable investment environment for developers. Egypt is short of dollars and local banks are unable to offer developers opportunities to locally raise the finances required for both luxury high-end and low-cost real estate schemes.
CONSTRUCTION & BUILDING SECTOR OUTPUT
Sources: Central Bank of Egypt, Bank Audi’s Group Research Department
IMPLEMENTED INVESTMENTS IN CONSTRUCTION & BUILDING
Sources: Central Bank of Egypt, Bank Audi’s Group Research Department
CEMENT PRODUCTION AND DELIVERIES
Sources: Central Bank of Egypt, Bank Audi’s Group Research Department

7February 24, 2016
ECONOMICS
EGYPT
FEBRUARY 24, 2016
The Egyptian government and the private sector must work in sync to implement long-term plans that include integrated communities outside of densely populated areas. Egypt’s population reached 90 million in November 2015, and with much of the population residing along the Nile Delta area and in Cairo, it is no surprise the government selected housing and de-urbanization as a main priority. Egypt’s Ministry for Housing estimated that 500,000 new homes need to be built every year for the next five years to keep pace with a population expanding at a rate of 2% per year.
The Egyptian authorities supported the construction sector through several initiatives in 2015. The most significant one is the Tahya Masr Fund, which includes LE 1 billion, for the social housing scheme tailored for the youth. The funds would finance the building of 100,000 housing units.
Moreover, the largest investment in Egypt’s construction sector was by UAE-based Arabtec. The firm agreed terms with Egypt’s Ministry of Housing for the first phase of a LE 280.0 billion (US$ 36.7 billion) plan to construct one million homes across the country. The project would include 100,000 units to be built in Egypt’s El Obour and Badr districts. In parallel, the Ministry signed a construction deal with local real estate developer Arabia Group, worth LE 35.0 billion (US$ 4.6 billion), to develop a mixed-use project in Cairo. The project would include schools, hotels and medical facilities, spanning 2.34 sq km for which the government would provide land.
Furthermore, the Egyptian Housing Ministry signed preliminary deals with four real estate developers for four projects. The deals, worth US$ 12.7 billion, were signed with Mountain View, Palm Hills, Sisban Holdings and a consortium of Arab firms. The projects include the development of 500 acres in New Cairo, and the development of 470 acres in Sixth of October City.
In conclusion, with the pace of growth accelerating gradually in 2015 and improved stability leading to a recovery in domestic demand, the outlook for Egypt’s construction sector is positive. According to the Ministry of Finance, the country’s construction sector is projected to grow by 8% in 2016, amidst strong public-private partnerships and the growing infrastructure project pipeline in Egypt.
1.1.4. Tourism
Activity rebound interrupted
After Egypt’s tourism sector witnessed some renewed confidence starting mid-2014, unfortunate security events interrupted the already moderate revived activity. Egypt’s nascent tourism recovery was dealt a blow in November with the downing of a Russian airliner, which resulted in tourism arrivals falling considerably since then. As a matter of fact, figures on the numbers of tourists show an overall one-digit deceleration during the first 11 months of 2015, as compared to the same period of the year before.
On the overall, numbers show that 8.9 million tourists visited Egypt during the first 11 months of 2015, compared to 9.1 million tourists in the same period of 2014. This is equivalent to a yearly drop of 2.3%.
EVOLUTION OF SUEZ CANAL ACTIVITY
Sources: Central Bank of Egypt, Bank Audi’s Group Research Department

8February 24, 2016
ECONOMICS
EGYPT
FEBRUARY 24, 2016
Similarly, tourist nights witnessed a year-on-year drop of 9.0% from 89,824 thousand nights to 81,728 thousand nights in the first 11 months of 2015. It is yet worth mentioning that Egypt used to receive an average of 15 million tourists annually in the years preceding the events of 2011.
In fact, the 2.3% drop registered during the first 11 months of 2015 is mainly due to the deceleration registered in the month of November. In details, numbers for this month show a year-on-year deceleration of 37.8% compared to the same month of 2014. This is explained by the refrain of tourists from visiting Egypt in the aftermath of the Russian plane crash in Sinai in end-October. When disregarding the month of November, figures for the first ten months of 2015 show the numbers of tourists registering a year-on-year increase of 1.6%. On another level, the contribution of the tourism sector to GDP decreased to 1.8% in the FY 2014/2015, against 2.2% in the previous year. However, those figures, ending in June 2015, do not account for the deceleration registered in the last months of 2015.
The average stay per tourist reached 9.2 days in 11M 2015, compared to 9.9 days in 11M 2014. At the same time, numbers by Ernst & Young show the hospitality sector in Cairo as less active than other Middle Eastern counterparts. In fact, it came in the 11th spot out of a list of 14 MENA cities, with the occupancy rates in four and five star hotels at 49% in 2015, albeit going up from a low base of 37% registered in 2014. On a positive note, both the average room rate and the room yield within Cairo registered the highest increases among surveyed MENA cities in 2015, both at double-digit levels, of 20% and 58%, respectively. Lodging within the Egyptian capital’s luxury hotels remained, however, the most affordable among Middle Eastern cities.
1.2. EXTERNAL SECTOR
Significant surge in current account deficit
Egypt’s external accounts registered over the past year a mixed performance. Indeed, the current account deficit surged on the back of deteriorating surpluses in the services and transfers balances. At the same time, the capital and financial accounts improved drastically, causing the balance of payments to move into surplus again.
In details, exports dropped by a significant 25.0% over the first nine months of 2015 to reach US$ 14.5 billion. This comes despite the currency depreciation of 8.8% registered between 9M 2014 and 9M 2015, and is mainly due to the drop in the value of petroleum exports. The latter category, mostly consisting of crude oil, went down by 41.6% in US$ terms year-on-year, and is alone responsible for 74% of the drop in export value over the first nine months of 2015. Consequently, its share of total exports dropped from 45% to 35%. At the same time, other exports decreased by 11.7% over the covered period. This was driven by lower exports of chemicals, soaps, fertilizers, carpets and floorings, articles of iron and steel, aluminum articles, ready made clothes, and cotton textiles.
TOURISTS BREAKDOWN BY REGION (11M-15)
Sources: Central Bank of Egypt, Bank Audi’s Group Research Department
EVOLUTION OF TOURISM ACTIVITY
Sources: Central Bank of Egypt, Bank Audi’s Group Research Department

9February 24, 2016
ECONOMICS
EGYPT
FEBRUARY 24, 2016
A look at the exports distribution by geography shows that the biggest share of exports went to the European Union (34%), followed by Arab countries (27%), Asian countries (13%), USA (9%), other European countries (5%), and African countries (3%).
Imports decreased by 10.4% year-on-year to reach US$ 43.1 billion in the first nine months of 2015, within the context of weaker private consumption. Petroleum imports went down by 24.2% over the covered period and imports of other items, accounting for about 84% of the total, decreased by 7.1% year-on-year.
A look at the imports’ countries of origin shows that the biggest share originates from the Arab countries (30%), followed by European Union (21%), Asian countries (21%), Russian Federation & CIS (7%), other European countries (6%), and USA (6%).
As a result, the export-to-import coverage ratio went down, moving from 40.7% in 9M 2014 to 33.6% in 9M 2015. As to the trade deficit, it remained almost constant, dropping by a slight 0.5% in the covered period of 2015, moving from US$ 28.8 billion in 9M 2014 to US$ 28.6 billion in 9M 2015.
In contrast, the services balance surplus declined by 30.2% to reach US$ 2.5 billion. This is mostly due to a drop in government receipts, by a significant 66.8%, mainly due to lower value of receipts in the third quarter. In addition, tourism revenues went down by 3.8% during the aforesaid period due to an overall slightly decelerated tourism activity.
Another factor affecting Egypt’s external accounts proved to be the transfers balance, which posted a lower surplus of US$ 14.2 billion (-35%) during the first nine months of 2015. While the remittances from Egyptian workers abroad to their homeland went down by 4% (equivalent to a drop of US$ 0.6 billion), the main contributor to the deterioration in the transfers balance over the covered period was the official transfers. The latter has indeed moved from US$ 7.2 billion in the first nine months of 2014 to as low as US$ 0.1 billion in the corresponding period of 2015.
As the shrinking in the surpluses of both the transfers and services balance surpluses was accompanied by quasi-stagnation in the trade deficit, Egypt’s current account deficit more than tripled to reach US$ 11.9 billion in the first nine months of 2015, up from US$ 3.3 billion in the same period of 2014.
Along the same lines, the capital and financial account surplus increased by more than seven-folds to reach US$ 18.3 billion in 9M 2015, up from US$ 2.2 billion in 9M 2014. This was notably due to higher direct investment in Egypt, from US$ 3.4 billion in 9M 2014 to US$ 5.0 billion in 9M 2015, on account of higher inflows in the period between January and March 2015. All in all, Egypt’s overall balance of payments moved from a deficit of US$ 0.1 billion in 9M 2014 to a surplus of US$ 1.1 billion in 9M 2015.
Sources: Central Bank of Egypt, Bank Audi’s Group Research DepartmentSources: Central Bank of Egypt, IMF, Bank Audi’s Group Research Department
BREAKDOWN OF EXPORTS AND IMPORTS BY REGION (9M 2015)FOREIGN SECTOR INDICATORS

10February 24, 2016
ECONOMICS
EGYPT
FEBRUARY 24, 2016
1.3. PUBLIC SECTOR
Fiscal reforms pave the way for narrower deficits
The Egyptian government took positive steps towards fiscal reforms in the past year that have boosted the confidence in the economy since their announcement and helped reposition Egypt on an enhanced fiscal trajectory, achieving better results than the previous fiscal year. Consequently, the overall budget deficit has narrowed gradually from 13.0% of GDP in FY 2013 to 12.2% in FY 2014 and to 11.5% in FY 2015 according to the Ministry of Finance, helped by lower energy subsidies and tight limits on wages and employment.
Going further into details, total budget revenues grew by a tiny 1.9% in local currency terms during FY 2015 as compared to FY 2014, to reach LE 465.2 billion (or US$ 63.3 billion) at end-June 2015 or 19.1% of GDP, according to pre-actual figures issued by the Ministry of Finance. The moderate rise in budget revenues was due to an increase in tax revenues by 17.5% that came in line with the five-year program (introduced in 2014) to improve tax buoyancy and widen the tax base. But the increase in tax revenues was offset by a retreat in non-tax revenues by 18.9%, as a result of a decline in external grants from US$ 13.7 billion in FY 2014 (following the influx of aid from GCC countries) to US$ 3.5 billion in FY 2015.
Total budget expenditures were up by 4.5% in local currency terms during FY 2015 relative to FY 2014 (compared to a 19.3% hike during FY 2014), to reach LE 733.4 billion (or US$ 99.8 billion) at end-June 2015 or 30.2% of GDP. Public outlays were to a significant extent the result of an increase in workers’ wages and compensations by 11.1% (compared to a 24.9% rise in FY 2014) which included the raises effective as of the beginning of the fiscal year, from the costs of minimum wage raise to the allowance of teachers’ occupational burdens and incentives to special cadre employees. In addition, interest payments on external and domestic debt increased by 11.5%, representing 27.0% of total expenditures. In parallel, subsidies, grants and social benefits decreased by 13.1%, in line with raising fuel and electricity prices to phase out energy subsidies, which contributed to offsetting the increase in budget expenditures. As such, this resulted into a moderate expansion in the overall deficit in local currency terms of 9.4% in FY 2015 to reach the equivalent of US$ 38.0 billion, accounting for 11.5% of GDP in FY 2015, down from 12.2% of GDP in FY 2014 given the government initiatives towards fiscal consolidation.
The gross domestic debt rose by 16.5% in local currency terms in FY 2015 following an 18.9% expansion in FY 2014, to reach the equivalent of US$ 277 billion at end-June 2015. This was mainly triggered by a 16.5% growth in the balances of bonds and bills, within the context of sovereign debt sale aiming at funding the country’s fiscal deficit. Within this context, the total domestic debt to GDP went up from 86.4% in FY 2014 to 87.1% in FY 2015, as per the Central Bank of Egypt. In parallel, the total external debt increased by 4.3% in FY 2015 compared to a 6.6% increase in FY 2014, to reach US$ 48.1 billion at end-June 2015. As such, total external debt fell from 15.6% of GDP at end-June 2014 to 14.9% at end-June 2015.
Sources: Central Bank of Egypt, Bank Audi’s Group Research DepartmentSources: Central Bank of Egypt, Bank Audi’s Group Research Department
GOVERNMENT INDEBTEDNESSSELECTED PUBLIC FINANCE INDICATORS
11February 24, 2016
ECONOMICS
EGYPT
FEBRUARY 24, 2016
Last but not least, there are signs that the government will consolidate its austerity drive in the current fiscal year. As such, the FY 2016 budget registers ambitious targets. The government targets to collect LE 622.3 billion of revenues, 34% more than the level in FY 2015, mainly on the back of a 38% rise in tax revenues which is based on the expected pickup in economic conditions, the continuation of the second phase of reforms and the adoption of more measures to counter tax evasion. Within this context, the introduction of the smart card last year has been successful in monitoring consumption and limiting smuggling. In addition, a VAT law draft is ready and officials are hopeful that it will be ratified by the new Parliament so that it can be launched by July 2016. On the other hand, public expenditures are expected to reach LE 864.6 billion in FY 2016, 18% more than FY 2015, on the back of an expected rise in interest payments by 26%. Additionally, stimulating investments has been one of the current government’s most important policies to create jobs and upscale the nation’s infrastructure base. In fact, public investments in the new budget are expected to reach LE 75.5 billion (2.6% of the GDP), of which LE 55 billion are financed from the State’s resources, and the rest through grants and self-financing.
Accordingly, the fiscal deficit is expected to decrease both in absolute terms and as a percentage of GDP in FY 2016, as it is expected to stand at LE 251.1 billion (a decline of 10.1%), and consequently to narrow from 11.5% of GDP in FY 2015 to 8.9% of GDP in FY 2016. As such, Egyptian authorities are set to move ahead with further reforms to contain the country’s budget deficit and ensure sustainability in a recovering economy after four years of slow activity.
1.4. FINANCIAL SECTOR
1.4.1. Monetary Situation
New era of monetary policy amidst foreign exchange shortages and high inflation
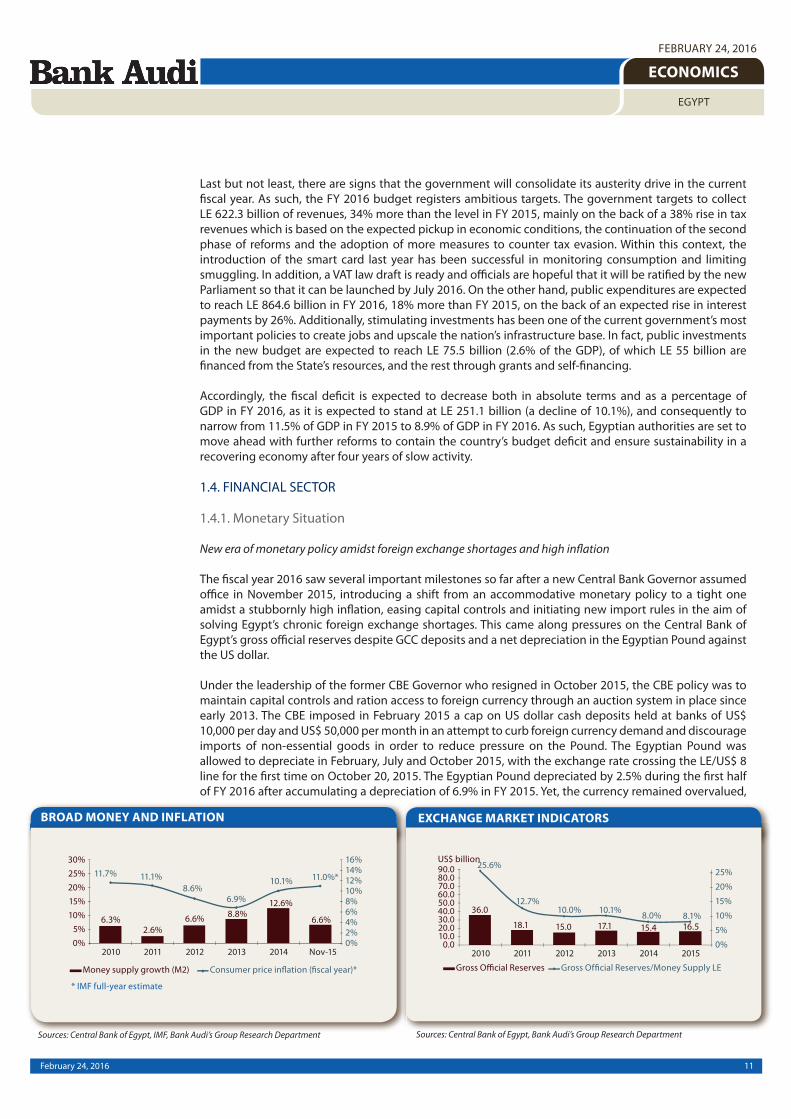
The fiscal year 2016 saw several important milestones so far after a new Central Bank Governor assumed office in November 2015, introducing a shift from an accommodative monetary policy to a tight one amidst a stubbornly high inflation, easing capital controls and initiating new import rules in the aim of solving Egypt’s chronic foreign exchange shortages. This came along pressures on the Central Bank of Egypt’s gross official reserves despite GCC deposits and a net depreciation in the Egyptian Pound against the US dollar.
Under the leadership of the former CBE Governor who resigned in October 2015, the CBE policy was to maintain capital controls and ration access to foreign currency through an auction system in place since early 2013. The CBE imposed in February 2015 a cap on US dollar cash deposits held at banks of US$ 10,000 per day and US$ 50,000 per month in an attempt to curb foreign currency demand and discourage imports of non-essential goods in order to reduce pressure on the Pound. The Egyptian Pound was allowed to depreciate in February, July and October 2015, with the exchange rate crossing the LE/US$ 8 line for the first time on October 20, 2015. The Egyptian Pound depreciated by 2.5% during the first half of FY 2016 after accumulating a depreciation of 6.9% in FY 2015. Yet, the currency remained overvalued,
BROAD MONEY AND INFLATION
Sources: Central Bank of Egypt, IMF, Bank Audi’s Group Research Department
EXCHANGE MARKET INDICATORS
Sources: Central Bank of Egypt, Bank Audi’s Group Research Department

12February 24, 2016
ECONOMICS
EGYPT
FEBRUARY 24, 2016
with the Real Effective Exchange Rate appreciating substantially at a time when other emerging market currencies have weakened. The policy of capital controls to defend an overvalued exchange rate has created shortage of foreign currencies, while an overvalued Pound has cost the economy in terms of competitiveness, hurting economic activity and deterring investments.
After the new Central Bank Governor took office on November 26, 2015, the CBE witnessed a shift in its monetary policy. The Central Bank eased on January 20, 2016 restrictions on US dollar cash deposits blamed for exacerbating a foreign currency shortage and driving up premiums to buy the US dollar on the black market. The CBE raised the monthly US dollar cash deposit limit fivefold to US$ 250,000 from US$ 50,000 for importers of “essential goods” that source foodstuff, capital machinery, manufacturing components and medicines. Policy makers also removed the daily limit provided that the monthly cap is met, while keeping the US$ 50,000 monthly cap for individuals and other types of companies. This was followed by another move on February 15, 2016 when the CBE decided to raise the US dollar monthly cash deposit limit for importers of “essential goods” to US$ 1 million from US$ 250,000, yet signaling that firms would have three months to show their export proceeds are at least equal to the amount deposited. Losing capital controls would boost FX liquidity for these important sectors, but only to a limit, as a cap continues to remain in place. This was mirrored by only a limited weakening of the Pound’s parallel market rate following the CBE’s decision.
Also, the CBE issued a number of measures to introduce more stringent guidelines for imports of finished consumer goods in December 2015, aiming to favor local manufacturers and ease a foreign exchange squeeze. The CBE doubled the cash cover trading companies need to open letters of credit to 100% effective 1 January 2016 and imposed a bank-to-bank relation in imports. The Ministry of Trade and Industry complimented CBE’s decisions to control the imports of consumer goods by issuing a decree establishing a new registry of approved foreign manufacturers of those goods imported into Egypt. The registry imposes a number of conditions including stricter quality, safety standards and scores for impact on labor and the environment. On the other hand, a Presidential decree was issued in January 2016 raising customs tariffs on a large number of imports in the purpose of protecting the national industry and lessening pressures on foreign currency demand.
These measures were taken at a time when foreign currency reserves represent a limited buffer to absorb any further downward pressure on the Egyptian Pound. In details, the Central Bank of Egypt’s gross official reserves reached US$ 20.1 billion at the end of FY 2015, up by US$ 3.4 billion since the end of FY 2014, mainly helped by US$ 6 billion in deposits received from GCC States in April 2015. Yet, they followed a downward trajectory during the first half of FY 2016 to reach US$ 16.5 billion at end-December 2015, mainly due to the redemption of US$ 2.3 billion in external debt and the Central Bank’s interventions on the foreign exchange market to support the Pound. Within this context, the Central Bank’s gross official reserves covered 8.1% of local currency money supply at end-December 2015. This compared to a coverage ratio of 10.5% at end-June 2015. In parallel, the Central Bank’s gross official reserves covered 3.4 months of imports at end-2015 as compared to 4.0 months of imports at end-June 2015.
In parallel, inflation remained stubbornly high, largely due to supply bottlenecks and the Egyptian Pound depreciation against the US dollar. The Headline Consumer Price Index for urban areas which include Cairo, Alexandria, urban Lower Egypt, urban Upper Egypt, Canal cities and frontier governorates rose by 11.0% on average in FY 2015 and softened to 9.6% on average during the first half of FY 2016, according to the Central Bank of Egypt, owing to a more helpful base effect as the impact of the government’s increase in the price of subsidized petroleum products in July 2014 began to drop out of the consumer price index. Also, core CPI, which excludes the impact of temporary price shocks on inflation that could result from weather conditions, supply disruptions or infrequent resetting of prices by the government, giving better implications about future inflation trends, fell from 8.1% on average in FY 2015 to 6.4% on average during the first half of FY 2016.
In an attempt to address inflationary pressures and anchor inflation expectations, the CBE started to pursue a tight monetary policy late December 2015, raising its key benchmark rates by 50 bps. The CBE sees that while upside risks to the inflation outlook are mitigated by contained imported inflation in light of broad-based declines in international commodity prices, underlying domestic inflationary pressures could push up inflation expectations. Accordingly, the overnight deposit rate was raised from 8.75% to

13February 24, 2016
ECONOMICS
EGYPT
FEBRUARY 24, 2016
9.25%; the overnight lending rate was lifted from 9.75% to 10.25%; and the discount rate moved up from 9.25% to 9.75%.
The broader money supply (M2) expanded by 6.6% in US$ terms during the first eleven months of 2015, the equivalent of US$ 14.9 billion, moving up from US$ 224.7 billion at end-2014 to US$ 239.7 billion at end-November 2015. This followed a lower growth of 12.6% in 2014. Money supply in its narrow sense (M1) widened by 5.5% during the first eleven months of 2015, following a higher growth of 16.1% in 2014, to hit US$ 65.8 billion at end-November 2015.
Looking forward, the CBE would continue to prioritize safeguarding the depleting stock of foreign reserves particularly amid uncertainty over the size of inflows from GCC countries which are facing fiscal cutbacks, while inflation may decline gradually as infrastructure bottlenecks are addressed and fiscal consolidation reforms take root.
1.4.2. Banking Activity
Healthy activity growth and adequate financial standing despite currency pressures
Egyptian banks managed to record healthy activity growth rates over the course of the year 2015, supported by an improved macroeconomic environment on the overall despite local currency depreciation against the greenback and tough regional conditions in neighboring countries. Measured by the total assets of banks, sector activity grew by 27.6% in local currency terms (16.4% in US dollar terms) over the first 11 months of 2015 to reach the equivalent of US$ 320.6 billion at end-November 2015. The US$ 45.3 billion assets increase even proved 31% higher than the growth registered during the 2014 corresponding period which had seen the Egyptian Pound depreciate as well, albeit at a slower pace.
On the funding side, the major activity driver over the covered period was customer deposits, which have been a traditional major contributor to sector activity growth and accounted for three quarters of total balance sheets at end-November 2015. Total deposits at banks in Egypt grew by 20.6% in local currency terms (10.1% in US dollar terms), and proved responsible for close to 60% of total activity growth in the first 11 months of 2015.
A glance at the deposit structure reveals that 23% of the registered growth was due to higher government deposits in local currency (those in foreign currencies slightly retreated), and the remaining bulk to non-government deposits. Among the latter, retail deposits (i.e. the household sector) rose the most, likely bearing witness to higher consumer confidence and improved economic growth in the country. Retail deposits have proven resilient in the past, being supportive for banks and partly due to continued remittance inflows. In terms of currency structure, local currency deposits accounted for 88% of total deposit growth in the first 11 months of 2015, leading to a decline in the deposit dollarization ratio to
BANKING SECTOR INDICATORS
Sources: Central Bank of Egypt, Bank Audi’s Group Research Department
BANK CREDIT FACILITIES BY ECONOMIC ACTIVITY*
Sources: Central Bank of Egypt, Bank Audi’s Group Research Department

14February 24, 2016
ECONOMICS
EGYPT
FEBRUARY 24, 2016
19.4% at end-November 2015.
It is worth noting that a large proportion of adult Egyptian nationals still do not have a bank account, despite banks’ efforts in this respect in recent years. A recent move by authorities to pay public sector salaries into banks rather than in cash is likely to increase deposits in government-owned financial institutions and help deepen financial intermediation.
On another note, and in light of the ongoing shortage of foreign currencies in the country, the sector regulator has eased restrictions on foreign currency deposits held at banks early this year, increasing the monthly limit from US$ 50,000 to US$ 250,000 and to US$ 1 million, while removing the previously set daily cap (US$ 10,000) on the condition that the monthly cap is met. This move aims to help a select group of importers of essential goods (foodstuffs, capital machinery, pharmaceuticals and manufacturing components).
Egyptian banks do not rely that much on foreign funding, whether on the interbank market or through longer-term borrowings, noting that the sector’s bonds and long-term loans represent less than 2% of total balance sheets. This actually shields them from potential swings in global sentiment affecting credit markets.
On the asset utilization side, the major activity drivers were three-fold. As a matter of fact, securities and investment in Tbs were responsible for 30% of the total activity growth, credit facilities for 29%, and balances with banks in Egypt (i.e. interbank deposits) for 26%.
In details, with additional liquidity at hand and a relative return of confidence to the domestic scene, banks and borrower appetite for risk ameliorated. Consequently, lending activity grew by 24.7% in local currency terms (a lower but still healthy 13.9% in US dollar terms) over the first 11 months of 2015. For comparison purposes, we note that the lending activity growth in US dollar terms proved 1.7x higher than that of the previous year’s corresponding period despite the larger local currency depreciation during 2015.
Credit facilities to the government more than doubled in the first 11 months of 2015 and contributed to 34% of total lending activity growth, while the private sector accounted for 66% of growth, mostly due to higher credit extended to the services, household and industrial sectors respectively. From a currency standpoint, local currency lending contributed to 67% of total lending activity growth, leaving 33% to foreign currencies.
BANKING SECTOR ASSET COMPOSITION
Sources: Central Bank of Egypt, Bank Audi’s Group Research Department

15February 24, 2016
ECONOMICS
EGYPT
FEBRUARY 24, 2016
Despite lending activity growth, banks in Egypt continue to benefit from a large financial flexibility as the credit facilities to deposits ratio remains low at a mere 42%, in part as a small chunk of retail and corporate bases actually have a creditor/debtor bank account. In an effort to prop up economic activity and raise financial inclusion, authorities are working with banks to boost SME credit, bearing in mind that the SME segment is the backbone of the domestic economy. In fact, banks were lately directed to increase lending to SMEs to 20% of their loan portfolios over the next four years, noting that the Central Bank, together with the EBRD and EIB, placed funds with banks to be channeled unto SMEs and lowered reserve requirements for SME loans.
In parallel, banks’ core liquidity remains adequate. Their core liquid assets, i.e. cash and balances with the Central Bank and banks in Egypt and abroad, accounted for around 23% of total deposits at end-November 2015, up from 19% at end-2014 and above regulatory requirements, as higher placements with banks in Egypt outstripped deposit growth over the covered period.
The remaining major driver of banks’ activity growth was the securities and investment in Tbs category. The latter has consistently grown in the past few years as Egypt faced wider budget gaps and sought banks’ help in financing them. The year 2015 was no exception and saw exposure to this category rise by 18.0% in local currency terms (7.7% in US dollar terms), the bulk of which is attributed to higher sovereign exposure. Exposure to the government sector (securities wise) accounted for 40% of total assets, which sheds light on significant concentration risks. Then again, this remains somewhat tempered by the fact that Egyptian banks can continue to fund the sovereign given that they benefit from continued liquidity.
With economic activity improving, banks’ asset quality metrics have ameliorated, as the stock of NPLs as a percentage of total loans declined further to 7.2% at end-September 2015 (8.5% at end-FY 2014 and near double-digit levels in FY 2012). Similarly, provisioning levels are comfortable, and NPLs are almost fully covered by provisions (up to 99%), though it is useful to recall that banks could be indirectly impacted by Egypt’s hard currency shortage as disruptions to imports could cause asset quality issues.
Egyptian banks are more or less adequately capitalized, with their capital base to risk-weighted assets ratio at 13.2% at end-September 2015, the bulk of which comprised of Tier 1 capital. But pressures on capital buffers linger, as banks’ large holdings of local currency government securities are zero risk-weighted in the calculation of capital buffers under the regulatory framework in Egypt.
Last but not least, banks’ profitability was on the rise last year, as high-yielding government securities, coupled with higher lending activity growth, have supported banks’ bottom lines. In the absence of frequent consolidated sector statistics, we aggregated the results of 11 listed banks. Those aggregated net profits rose by 35% in local currency terms on a yearly basis in the first nine months of 2015 (24% in US dollar terms).
1.4.3. Equity and Bond Markets
Egypt’s capital markets under downward price pressures amidst weaker investor sentiment across the region
Egyptian capital markets followed a downward trajectory over the year 2015, mainly dragged by weaker investor sentiment across the MENA region, lingering local security and geopolitical concerns and speculation about an interest rate hike by the US Federal Reserve. Accordingly, the Egyptian Exchange price index of the 30 most highly capitalized and liquid stocks saw its first contraction in four years. The fixed income market registered sharp price declines that swept out the previous year’s gains, and the cost of insuring debt expanded significantly.
The Egyptian Exchange came under downward price pressures in 2015, tracking weaker investor sentiment across the region on the back of an oil price slump, and driven by some adverse local security developments and lingering geopolitical concerns after a terrorist act brought down a Russian passenger plane in Egypt on October 31, 2015, which according to Moody’s would have credit negative implications for the country’s balance of payments and pose downside risks to the country’s growth outlook.

16February 24, 2016
ECONOMICS
EGYPT
FEBRUARY 24, 2016
Sources: Egypt Stock Exchange, Bank Audi’s Group Research Department
CAPITAL MARKETS INDICATORS
These unfavorable conditions more than counterbalanced the benefits reaped from the Economic Development Conference held mid-March 2015, and Saudi Arabia’s pledge towards the end of 2015 to raise its investments in Egypt to above SR 30 billion (US$ 8 billion) and to contribute to providing Egypt with petroleum needs for the next five years.
That being said, the Egyptian Exchange posted significant price falls in 2015 and extended its downward trajectory early-2016 amidst rising geopolitical tensions and exacerbated concerns over a prolonged global oil glut following the lifting of international sanctions against Iran. In details, the bourse’s main benchmark index (EGX 30) tumbled by 21.5% in 2015 to close at 7,006.01 at year-end. The breakdown of the index by sector shows that all sectors have seen contractions in 2015. The telecommunications sector led the decline, dropping by 47.0%, followed by the construction and material sector (-40.1%), the financial services sector excluding banks (-39.4%), the travel and leisure sector (-39.4%), the basic resources sector (-36.6%), the chemicals sector (-27.8%), the personal and household products sector (-25.9%), the real estate sector (-23.2%), the industrial goods, services and automobiles sector (-20.9%), the food and beverage sector (-17.5%), the healthcare and pharmaceuticals sector (-10.0%) and the banking sector (-2.3%). It is worth mentioning that the Egyptian Exchange was the worst performing market in the MENA region in 2015, registering a 27.5% plunge in the S&P Egypt BMI USD index as compared to a drop of 17.2% in the S&P Pan Arab Composite index.
The significant drop in prices over the year 2015 was coupled with an increase in the number of listed companies on the Egyptian Exchange from 214 at end-2014 to 221 at end-2015. Under these conditions, the market capitalization fell by 21.5% year-on-year in foreign currency terms, moving down from US$ 69.9 billion at end-2014 to US$ 54.9 billion at end-2015. The ratio of market capitalization to GDP decreased from 24.4% at end-2014 to 17.5% at end-2015, noting that the Egyptian bourse’s contribution in the economy remained relatively low in comparison with the high market capitalization to GDP registered in the MENA region (around 62%).
On the back of undermined investor sentiment, the total volume of traded shares fell from 57,230 million shares in 2014 to 45,078 million shares in 2015. The total number of transactions dropped by 33.5%, moving from circa 7.3 million transactions in 2014 to circa 4.9 million transactions in 2015. Lower equity prices coupled with decreased number of traded shares led to a drop in the total trading value of 21.8%, with the latter moving from US$ 41.0 billion in 2014 to US$ 32.1 billion in 2015. Individuals captured 61% of activity in 2015, while institutional investors accounted for the remaining 39%, noting that the latter were net sellers after being net buyers in the previous year. Within this context, the turnover ratio, measured by total trading value to market capitalization, retreated slightly from 58.7% in 2014 to 58.5% in 2015.
In parallel, Egyptian sovereign debt papers saw downward price movements in 2015, with Z-spreads widening significantly, tracking price falls across the region, and on weaker investor sentiment amidst ongoing local security concerns and economic uncertainty, and worries that the strong external support that Egypt has received over the past few years could be affected by fiscal pressures in GCC countries

17February 24, 2016
ECONOMICS
EGYPT
FEBRUARY 24, 2016
Sources: Egypt Stock Exchange, Bank Audi’s Group Research Department
STOCK MARKET PERFORMANCE
given an oil price slump, in addition to growing speculation about an interest rate hike in the US over the year that triggered some capital flight towards riskless US assets over the year.
In details, Egypt’20 closed down by 7.00 pts, recording a 184 bps expansion in Z-spreads. Egypt’40 posted sharp price declines of 21.50 pts, posting a 227 bps expansion in Z-spreads. As to the cost of insuring debt, Egypt’s five-year CDS spreads, a reflection of market perception of country risks, widened significantly by 196 bps over the year to close at 478 bps at end-2015, following a notable contraction of 323 bps in 2014. This came along an expansion in Middle East’s five-year CDS spreads of 118 bps in 2015. Regarding new issues, Egypt tapped the international bond markets for the first time in five years in June 2015 through the issuance of a senior unsecured US$ 1.5 billion 10-year bond at a coupon of 5.875% that was three times oversubscribed, in the aim of financing the country’s budget deficit.
As to credit rating changes, international credit rating agencies took several actions in 2015. Moody’s upgraded in April 2015 Egypt’s issuer and senior unsecured bond ratings to “B3” from “Caa1”, with a “stable” outlook. Key drivers for rating action are improving macroeconomic performance, reduction in external vulnerabilities, and ongoing commitment to fiscal and economic reform, as per Moody’s. Standard & Poor’s Ratings Services affirmed in November 2015 Egypt’s long-term and short-term foreign and local currency sovereign credit ratings at “B-/B”, and revised its outlook to “stable” from “positive”. The outlook revision reflects S&P’s view that the economic recovery will not outperform its previous expectations, and that Egypt’s external imbalances would persist. It also reflects S&P’s expectation that Egypt will largely remain politically stable, its economy will continue to progressively grow in the face of important macroeconomic headwinds, and that fiscal deficits will improve but remain at high levels. Finally, Fitch affirmed in December 2015 Egypt’s long-term foreign and local currency Issuer Default Ratings at “B” with a “stable” outlook. Egypt’s ratings balance a high fiscal deficit and debt/GDP ratio, low foreign reserves coverage of imports and recent volatile political history, with low external debt and progress in implementing a wide-ranging economic reform program, as per Fitch.

18February 24, 2016
ECONOMICS
EGYPT
FEBRUARY 24, 2016
2. CONCLUDING REMARKSThere is no doubt that despite the widening regional turmoil and the spillover effects of low oil prices, there are noticeable favorable economic developments. Macroeconomic aggregates point to some improvement, with growth almost at double its four-year trend since the 2011 revolution. Egyptian authorities succeeded in reducing the budget deficit on the back of a wide ranging set of reforms including energy subsidy reforms and progress in containing the wage bill and increasing tax revenues. A considerable deal of pledges made at the Egypt Economic Development Conference are being implemented.
A number of recent financing developments were in favor of Egypt’s ailing external sector. Saudi Arabia agreed to lend Egypt US$ 20 billion to finance the purchase of oil products over the next five years. This was the latest in a series of financial pledges by Saudi Arabia, China and multilateral development banks (MDBs) since December 2015 to shore up Egypt’s foreign exchange reserves. Such pledges will support the country’s balance of payments, which lately have been under pressure from a widening merchandise trade deficit and weakness in tourism at large.
As a matter of fact, the recent financing agreements point to the fact that the donor composition is broadening. Gulf countries are facing increasing fiscal pressures because of the prolonged period of low oil prices, so although Saudi Arabia remains committed to supporting Egypt, increased commitments this year from China and several MDBs broaden the available pool of support. Not less importantly, external financial support is shifting to loans and investment commitments from quasi-sovereign sources from predominantly government grants, resulting in an increase in future repayment obligations. But the risks this entails are somewhat mitigated by Egypt’s low levels of total external debt of 14.9% of GDP at the end of the past fiscal year and general governmental external debt of 8.5% of GDP as of the same date.
The external financial support promised for 2016 actually comes at a crucial time for Egypt, which has been facing increasing balance-of-payments pressures. Merchandise export revenues have been hit by low oil prices, driven by a significant drop in petroleum exports. Egypt’s trade balance has posted a growing deficit, which is actually set to worsen further on the back of the observed further decline in oil prices. In parallel, weak global trade growth is adversely affecting Suez Canal revenues, as income from the canal fell by 5% to US$ 5.2 billion in 2015. Egypt’s nascent tourism recovery was dealt a blow in November with the downing of a Russian airliner, with tourism receipts falling 15% to US$ 6.1 billion in 2015.
The negative result of these balance-of-payments pressures is visible in Egypt’s net international reserves. Egypt’s foreign reserves fell by more than half since the beginning of 2011 to about US$ 16.45 billion at the end of December (8.1% of Egyptian Pound Money Supply), against 25.6% at end-2010. That is just about enough to cover about three months of imports against nine months at end 2010. In response to low reserve levels and depreciation pressure on the Egyptian pound, the authorities implemented tighter controls on imports. Rules to curb so-called unnecessary imports may save about US$ 20 billion this year, improving the balance of payments. The average of international forecasts for the LE/US$ exchange rate at end-2016 is 8.75, which represents a depreciation of 12%, close to that of 2015.
When assessing the outlook for Egypt, it is important to have a glance on strengths and challenges. Strengths actually revolve around a large and diversified economy, comparatively strong growth dynamics, the low external debt with medium and long term nature, the good financial soundness of the banking sector and the wide ranging fiscal and economic reform program. Challenges are tied to the persistently elevated security risks, the sizable fiscal deficits entailing large borrowing requirements, the high unemployment and high inflation, notwithstanding the deterioration in the external position.
While strengths outpace challenges and opportunities exceed threats, there is a need to continue implementing ambitious structural reforms. At the public finance level, there is a need to optimize the balancing act between rationalizing current spending and maintaining social spending commitments, while reinforcing further resource mobilization. More importantly, there is a need to further improve the business environment in order to increase economic activity, which will in turn help job creation and curb the persistently high unemployment rates. Finally, there is a need to reinforce institutional strength, improve Egypt’s governance indicators and strengthen the government’s capacity to conduct sound economic policies that foster economic growth and prosperity.

19February 24, 2016
ECONOMICS
EGYPT
FEBRUARY 24, 2016
DISCLAIMER
The content of this publication is provided as general information only and should not be taken as an advice to invest or engage in any form of financial or commercial activity. Any action that you may take as a result of information in this publication remains your sole responsibility. None of the materials hereinconstitute offers or solicitations to purchase or sell securities, your investment decisions should not be made based upon the information herein. Although Bank Audi Sal considers the content of this publication reliable, it shall have no liability for its content and makes no warranty, representation or guarantee as to its accuracy or completeness.
Bank Audi sal - Group Research Department - Bank Audi Plaza - Bab Idriss - PO Box 11-2560 - Lebanon - Tel: 961 1 994 000 - email: [email protected]