efficient water management for sustainable agriculture · efficient water management for...
TRANSCRIPT

ISSS Bulletin No. 29
Efficient Water Managementfor Sustainable Agriculture
Edited byRaj Kumar Rattan
Dipak Ranjan Biswas
Indian Society of Soil ScienceNew Delhi
2014

Efficient Water Management for Sustainable AgricultureNovember 2014
© 2014, Indian Society of Soil Science
Correct Citation. Rattan, Raj Kumar and Biswas, Dipak Ranjan (Editors)(2014) Efficient Water Management for Sustainable Agriculture. Bulletinof the Indian Society of Soil Science 29, 1-86.
All rights reserved. Except for brief quotation in a review, this publicationor parts thereof, must not be reproduced in any form without writtenpermission in writing from the publisher.
The views expressed in this publication by the authors are their own andthese do not necessarily reflect those of the Indian Society of Soil Science
Published on behalf of the Indian Society of Soil Science by:
Dr. D.R. BiswasSecretaryIndian Society of Soil ScienceNational Agricultural Science Centre ComplexDev Prakash Sastri Marg, Pusa, New Delhi -110 012Phone : 0091-11-25841991; 25841529Email: [email protected]; [email protected] page : www.isss-india.org

Contents
Sustainable Management of Water Resources: Issuesand Strategies
ANIL KUMAR SINGH .............................................................. 1
Status and Management of Water Resources in IrrigatedAgriculture — Punjab as an Illustrative Example
G.S. HIRA AND S.S. KUKAL ................................................. 27
Status and Management of Water in Rainfed AgriculturePRADEEP K. SHARMA AND MUNISH KUMAR .............. 41
Sodic Irrigation Management for Sustaining ProductivityM.S. BAJWA AND O.P. CHOUDHARY ............................... 59


PrefaceAdoption of high yielding varieties, expansion of area under irrigation and enhanced
use of fertilizers has contributed to increase in food production in India which increasedfrom merely 50.8 million tonnes (Mt) in 1950--51 to 263+ Mt in 2013-14. Irrigation waternot only meets the physiological water needs of superior genotypes but also ensuresefficient utilization of plant nutrients. Agriculture sector, the largest consumer of water(82.8%), is facing competition from other sectors due to the ever increasing demands ofthe burgeoning population and accelerated pace of urbanization and industrialization in thecountry. It is expected that reduction in the average size of land holding, declining percapita water availability, deterioration of water quality etc. will seriously affect the sus-tainable use of water resources and will make it difficult to accomplish the target ofproducing 345 Mt in 2030 and 494 Mt in 2050 AD. To achieve the targeted foodproduction, increase in the crop productivity from the present 2.3 t ha-1 to 4.0 t ha-1 underirrigated conditions and from 1.0 t ha-1 to 1.5 t ha-1 in rainfed area, water use efficiencyand productivity will have to be increased at individual field level. To address these issues,the Indian Society of Soil Science (ISSS) in its meeting held on 23 June 2012 decided toorganize a symposium on “Efficient Water Management for Sustainable Agriculture” on 4December 2012 as a part its 77th Annual Convention. A Committee constituted under theChairmanship of Dr. A.K. Singh, DDG (NRM), ICAR, New Delhi developed the detailedstructure of the symposium .
In a session of 180 minutes on the forenoon of 4 December 2012, symposium washeld with four speakers namely, Dr. A.K. Singh, DDG (NRM), ICAR, New Delhi; DrG.S. Hira, Former Additional Director of Research, Ludhiana; Dr. Pradeep K. Sharma,VC, CSAUAT, Kanpur; and Dr. M.S. Bajwa, Former Director of Research, PAU, Ludhiana.It was chaired by Dr. S.S. Prihar, Former Head, Department of Soils, PAU, Ludhiana andDr. V.K. Arora, Senior Soil Physicist, Department of Soils acted as the Rapporteur.Grateful thanks are placed on record to all the speakers, Chairperson and Rapporteur forsuccessful organization of the symposium.
This bulletin is a complete treatise on status and management of water in irrigatedand rainfed agriculture and sustainable utilization of the poor quality irrigation waters.Special feature of this bulletin is the inclusion of inaugural address given by SardarParminder Singh Dhindsa, Finance Minister, Government of Punjab which dealt withnatural resource management in general and water and soils in particular. Efforts made byall the authors in collating, synthesizing and presenting the information are gratefullyacknowledged. It is our sincere hope that this bulletin will act as the reference and basematerial for those engaged in water management research.
Raj Kumar Rattan10 November 2014 Dipak Ranjan Biswas


Inaugural Address at the 77th Annual Conventionof Indian Society of Soil Science
S. Parminder Singh DhindsaHon’ble Finance Minister, Punjab Government
Honorable Dr. J.S. Kanwar, Former DDG, ICRISAT; Dr. D.R. Bhumbla, FormerVice Chancellor, HAU, Hisar; Dr. B.S. Dhillon, Vice Chancellor, PAU, Ludhiana; Dr. B.P.Singh, President, Indian Society of Soil Science; Dr. D.S. Cheema, Dean, COA, PAU,Ludhiana; Dr. R.K. Rattan, Secretary, ISSS; Dr. U.S. Sadana, Head, Department of SoilScience, PAU, Ludhiana, distinguished guests, delegates, ladies and gentlemen. It givesme immense pleasure to be here at Punjab Agricultural University which has a history ofserving the nation with pride and glory for 50 years and is celebrating its Golden Jubileethis year. I deem it an honour and privilege to be amongst you this morning duringinaugural ceremony of 77th Annual Convention of the Indian Society of Soil Science beingorganized by the Department of Soil Science, Punjab Agricultural University, Ludhiana.
Punjab Agricultural University has played a key role in increasing agriculturalproduction in Punjab through breeding high-yielding crop varieties and matching produc-tion and protection technologies. Across all field crops, vegetables, fruits, fodders andornamentals, PAU has so far released more than 700 varieties / hybrids of which 115including 32 of wheat have been released at national level. The impact of PAU’s contribu-tions is evident from the fact that wheat variety PBW 343, at one time occupied about70% of area under wheat crop in Indo- Gangetic Plains. University has contributedequally in strengthening human resource base of the country. Punjab Agricultural Univer-sity has given as many as 39 Vice Chancellors who have significantly contributed in thenation building in their own ways in different parts of the country. For its notable role,PAU was nationally recognized as the Best University by the Indian Council of Agricul-tural Research (ICAR) New Delhi in 1995. It was also granted special grant of 100 Croreby the Central Government in 2006.
Indian agriculture has witnessed impressive growth since independence. The GreenRevolution era of 1960s and 70s helped in increasing food grain production of thecountry from 82 million tonnes (Mt) in 1960-61 to around 257 Mt in 2011-12. This hasbeen responsible not only in sustaining growing population of the country, but also ingenerating exportable surpluses. However, population pressure on the country’s naturalresources is immense. India has only 4.2% of world’s fresh water and 2.4% of world’sland area to support 17% of world’s human and 11% livestock population. Of its totalcultivated area of 141 million hectares (Mha), about 45% is irrigated with an average

cropping intensity of 138%. The role of chemical fertilizers for increasing agriculturalproduction is well established. In India, fertilizer use has increased from 0.29 Mt in 1960-61 to over 28 Mt of NPK fertilizers during 2010-11. However, average intensity offertilizer use in India remains low and is highly skewed with wide inter- regional, inter-state and inter-district variations. Average fertilizer consumption in India stands at 144 kgha-1. Some states like Orissa, Himachal Pradesh, Rajasthan, and Goa report averagefertilizer consumption less than 60 kg ha-1. On the other hand, states like Punjab andAndhra Pradesh consume more than 240 kg ha-1.
Development of relevant technologies by the PAU, subsequent transfer of thesetechnologies to the farmers by the university and state department of agriculture, agricul-tural development-oriented state government policies and enterprising nature of Punjabfarmers have made Punjab the most intensively cultivated state. On an average more thantwo crops are harvested per unit area per year. The food grain production increased from3.2 Mt in 1960-61 to 29.2 Mt in 2011-12 that helped to ensure food security of thenation. With just 1.53% geographical area of the country, Punjab now produces about19% of wheat, 11% of rice and 5% of the cotton of the country. At world level, Punjabcontributes 2% of rice and cotton each and 3% of the wheat production. The state hasrightly earned the name ‘Granary of India’ by contributing 45-70% of wheat and 35-40%of rice to national buffer stock of food grains. Punjab, in general, and PAU, in particular,deserves all appreciation for making substantial contribution of wheat and rice to thecentral food grain bowl. In recognition of its outstanding contribution to wheat produc-tion, the Punjab state was chosen for the set-up of institute in the memory of late NormanE. Borlaug, Father of Green Revolution, to cater to the needs of South Asian region.
However, these developments have been accompanied by negative impact onwater resources of the state as indicated by alarming fall in groundwater caused by over-withdrawal by 1.37 million tubewells. There has been an average decline of ground watertable by 95 cm year-1 (2000-07) in the central region of the state that has now reduced to50 cm year-1 due to introduction of Preservation of Sub-soil Water Act-2009. The ground-water data indicate that out of 142 blocks in the state, 110 blocks are over-exploited.Water table decline has necessitated replacement of centrifugal pumps with submersiblepumps. This development has added to the indebtedness of Punjab farmers. Depletingwater resources indicated by alarming fall of groundwater in central region and poorquality groundwater in the south-west region imply that agriculture in years to come willbe water-limited. We will have to focus on supplementing or substituting existing tubewellswith sprinkler and drip irrigation methods. These technologies have been helping farmersin moving towards cultivation of high value crops.
High productivity due to intensive cropping has caused over-mining of soil nutrientreserves leading to deterioration of soil fertility, emergence of multi-nutrient deficienciesand lowering of fertilizer use efficiency. Non-judicious use of fertilizers and dumping ofmunicipal solids and industrial wastes containing large amounts of heavy metals in soilsand emission of greenhouse gases in agricultural systems is emerging a potent environ-mental threat. In addition, climate change effects in terms of increased air temperatureand erratic rainfall are likely to influence the resource base and crop productivity. Thesituation prevailing at present underlines a need for sincere efforts to carefully managethese resources in order to meet the increasing food demand besides sustaining ourenvironment for future generations.

The shrinking and degrading land and water resources are main constraints tosustained agricultural production, and time has come to produce more from less ofresources. Deficiencies of major and micro-nutrients in Indian soils have been on the riseand likely to worsen in future, if not corrected soon. These deficiencies influence not onlycrop yields but also mineral content of seed and feed, and affect crop, animal and humanhealth. Towards this end, new and emerging concepts like conservation agriculture, site-specific nutrient management including balanced and integrated plant nutrition, soil healthenhancement and water management need to be evaluated and propagated. Burning ofcrop residues is another problem that needs to be tackled urgently. I am fully confidentthat PAU will continue to offer more options for environment-friendly residue manage-ment.
I am sure that this Convention will provide an opportunity to soil scientists of thecountry to deliberate on the soil and water related issues and come up with usefulrecommendations. I extend best wishes for the success of the annual convention of thesociety. I declare the 77th Annual Convention of Indian Society of Soil Science open.
Best wishes for grand success. Jai Hind


Bulletin of the Indian Society of Soil Science, No. 29. pp 1-26 (2014)
Sustainable Management of Water Resources:Issues and Strategies*
Anil Kumar SinghIndia has a very formidable and challenging task of feeding 17.5% of the world’s humanpopulation from a meagre 2.3% of land area which is further constrained by the fact thatthe country has only 4% of the global water resources at its disposal. In addition to thesecond largest human population, the country has to also provide feed and fodder to 11%of the world’s livestock population. Combination of high yielding varieties, enhancedavailability of water and fertilizers, the three key inputs in agriculture, transformed Indiafrom a country of begging bowl to one with over-flowing granaries (Singh, 2013). It hasimparted stability and resilience to the agricultural production system in the country.
With a food grain production touching an all-time record level of 263 plus milliontonnes (Mt) in 2013-14, Indian agriculture has made stupendous progress in ensuring foodsecurity to its vast population. The new emerging demands of the relatively more-affluentIndian population, particularly its middle class, coupled with a net cultivated area unlikelyto exceed 143 Mha in 2050 as well as an estimated rainfed agriculture to cover around45% of the net sown area, are further compounded with the harsh reality that highlyproductive agricultural land is being continuously lost out to the industry and urban sec-tors. How will the country meet the target of 400 Mt of food grain production is the mutequestion, in a situation where the natural resources base is continuously degrading andclimate change with its attendant impacts is adversely affecting the agricultural productionsystem.
WATER RESOURCES DEVELOPMENT AND UTILIZATION
Undoubtedly, one of the pillars of the Green Revolution has been the Government ofIndia’s focus on development of water resources in the country. Today at 63 Mha (2009-10), India has one of the largest net irrigated areas in the world but if one examines theproductivity of irrigated areas at the national level, it is only around 3 t ha-1. The efficiencyof surface irrigation systems is around 30-40% which implies that at least 60% of thewater being supplied is being lost at various stages in the system.
Status of Water Resources
Total utilizable water resource in the country has been estimated to be about 1123billion cubic metres (BCM) (690 BCM from surface and 433 BCM from ground water),
Vice Chancellor, Rajmata Vijayaraje Scindia Agricultural University, Gwalior 474002, India*Part of this was presented in Annual FAI Seminar held in December, 2013

2 Bulletin of the Indian Society of Soil Science, No. 29
which is just 28% of the water derived from precipitation (Table 1). About 80% of thewater (688 BCM) is being diverted for irrigation, which may increase to 1072 BCM by2050. On the basis of the available water resources, the total irrigation potential fromsurface and ground water resources is estimated to be 139.9 Mha. The major source forirrigation is groundwater. Annual groundwater recharge is about 433 BCM of which 212.5BCM is used for irrigation and 18.1 BCM for domestic and industrial use (CGWB 2011).By 2025, demand for domestic and industrial water usage may increase to 29.2 BCM. Thesector-wise estimated demand is given in table 2.
Water is a finite resource the availability of which is declining with each passingday. If the international yardstick of 1700 m3 per capita availability of water is taken as acriterion, then the whole country became “Water stressed” in the year 2007 with per capitawater availability declining to 1656 m3 from 5200 m3 in 1951 (Figure 1). The reported percapita availability of water was 1545 m3 in 2011. It is estimated that the per capitaavailability of water is likely to reach a level of around 1100 m3 in 2050 but in reality wemay reach this threshold much earlier considering the wasteful ways of water usage. Itmay be noted that per capita availability of <1000 m3 indicates “Water scarcity”. If the percapita availability is scrutinized basin-wise than a significant number of basins in the
Table 1. Water resources of India
Estimated Annual Precipitation (including snow fall) 4000 BCMEstimated Utilisable Water
Surface 690 BCM*Ground 433 BCMTotal 1123 BCM
Irrigation Potential*Major and Medium (Surface Water)Ultimate 58.5 MhaCreated (upto 2009-10) 44.4 MhaUtilized (upto 2009-10) 34.4 Mha
*Minor IrrigationUltimate 81.4 MhaCreated (upto 2009-10) 62.8 MhaUtilized (upto 2009-10) 52.5 Mha
Total (Major and Medium+Minor)Ultimate 139.9 MhaCreated (upto 2009-10) 107.2 MhaUtilized (upto 2009-10) 96.9 Mha
Area Irrigated (2009-10)Gross 86.42 MhaNet 63.25 Mha*BCM=Billion Cubic Metre = 1 km3
Source: CWC (2013)

Efficient Water Management for Sustainable Agriculture 3
Table 2. Projected water demand in India by different sectors
S. Sector Water Demand in km3 (or BCM*)No. Standing Sub-Committee of MOWR NCIWRD
2010 2025 2050 2010 2025 2050Low High Low High Low High
1 Irrigation 688 910 1072 543 557 561 611 628 8072 Drinking water 56 73 102 42 43 55 62 90 1113 Industry 12 23 63 37 37 67 67 81 814 Energy 5 15 130 18 19 31 33 63 705 Other 52 72 80 54 54 70 70 111 111
Total 813 1093 1447 694 710 784 843 973 1180Note : NCIWRD: National Commission on Integrated Water Resources Development; MOWR: Ministryof Water Resource*BCM: Billion cubic metreSource: CGWB. (2011)
Fig. 1. Per capita availability of water in India

4 Bulletin of the Indian Society of Soil Science, No. 29
Fig. 2. The per capita water availability of water in the river basin of India in 2010
country were either in the “water scarcity zone” or worse in 2010 (Figure 2). The statisticsrelated to the per capita storage or the days of average flows are equally disturbing. Thedata available indicate that the per capita storage in India at 220 m3 is one fifth that ofChina (1110 m3). The scenario in terms of “days of average flow” at the national level isaround 20 days compared to Colorado in USA which is 850-900 days.
It has been reported that the current annual expansion in the irrigation sector is muchless than the maximum growth achieved in the past. Deceleration in irrigation potentialcreated through major and medium schemes started during 1980s as a consequence ofreduction of government expenditure in real terms. Amidst competition from non-agricul-tural uses in households, industry and environment, supply of irrigation will have to keeppace with the targeted annual agricultural growth rate of over 4% set in the Tenth FiveYear Plan. To achieve this growth rate, irrigation sector should grow by at least 5% perannum, given 1% growth in rainfed sector, This would be possible only when demand–supply management occurs in tandem with enhanced efficiency in water use at all thelevels because until and unless water security is ensured food and nutrition security willremain a distant dream.
In general, providing water at subsidized rates for irrigation has remained a vitalpolicy issue for ensuring food production. Currently, irrigation accounts for more than 1/3rd of states’ revenue deficits. In many states, O&M expenditure is adequate for staffsalaries only and no funds for works [Report of the Working Group on Urban and Indus-trial Water Supply and Sanilation for the Twelfth Five – Year Plan (2012-2017) November2011]. Low water charges and poor cost recovery, therefore, result in a decline in fundingfor maintaining water infrastructure, inefficient water allocation and increasing conflictsover water-sharing in many regions. Current status of O&M expenditure and cost recoveryin some major states which hovers around 25%, viewed in conjunction with the physicalcondition of the irrigation system, points towards an unsustainable scenario evolving inwater sector, both physically and financially (Selvarajan 2001).

Efficient Water Management for Sustainable Agriculture 5
Low water rates, under assessment of irrigated area and water rate demand, and poorcollection rate continue to deprive the irrigation sector from realizing potential revenue,critical for system’s financial sustainability. Sustained efforts are needed for rehabilitatingthe irrigation infrastructure and initiating institutional reforms in water sector. Only thenirrigation management transfer will become effective with system wide impacts to providewater security needed for sustainable food security.
Accelerated Irrigation Benefits Programme
The Government of India initiated the accelerated irrigation benefits programme(AIBP) in 1996-97 with a special emphasis on accelerating the rate of creation of addi-tional irrigation potential in the major and medium irrigation (MMI) sector, which in-creased from 2.2 Mha per Plan till the Eight Plan to 4.10 Mha during the Ninth Planfollowing the introduction of AIBP and further rose to 5.30 Mha during the Tenth Planand 4.28 Mha during the Eleventh Plan. The achievements have so far fallen short of thetargets fixed. A study completed in late 2011 revealed that the gap between the irrigationpotential created and utilized in these projects was substantial and is growing. It is notonly the demand–supply mismatch in the major and medium irrigation projects but also thefact that the gap between the irrigation potential created and utilized has been wideningcontinuously and today it stands at more than 25 Mha (Figure 3). Top most priority shouldbe given to bridge this gap considering the fact that the Government of India currentlyspends more than Rs. 1.25 lakhs to develop one hectare of irrigated land in the major andmedium projects. This is a huge amount of investment. Major reasons are low waterdischarge, insufficient water distribution mechanism, unequal water distribution across
Fig. 3. Plan–wise irrigation potential created and utilized over the years.
Pote
ntia
l cre
ated
, util
ised
(Mha
) and
Per
cen
t util
isat
ion

6 Bulletin of the Indian Society of Soil Science, No. 29
farmers located at different points, loss of water during distribution, incorrect recording ofirrigated area and diversion of cultivable land to other purposes within the command area.The conclusions of a study carried out on 28 major/medium irrigation projects in thecountry have indicated that the overall water use efficiency was 38% with the conveyanceefficiency pegged at 69% and on-farm application efficiency at 52%.
The most important initiative for bridging the gap between irrigation potential cre-ated (IPC) and irrigation potential utilized (IPU) is the Command Area DevelopmentProgramme (CADP) that has been running since 1974-75. The statistics indicate that up to2012, CADP could only manage 20.02 Mha of field channels and construct only 2.25 Mhaof field drains, again leaving a lot to be desired in terms of execution.
GROUND WATER DEVELOPMENT
Development of ground water resources which was a low key affair in the earlystages, is now contributing to more than 60% of the irrigation demand and playing acritical role in ensuring food security to the millions in the country. However, its overexploitation is now a very serious cause of concern and the potential of judicious exploita-tion of ground water resources is now confined only to some states in the eastern part ofthe country. Out of the 5842 assessed blocks, 4277 are safe while the rest are in the semi-critical (523), critical (169) and a large number of over-exploited (802) blocks (Figure 4).India has a dubious distinction of having the highest ground water abstraction (Figure 5).Considering the availability of the ground water resources, Government of India (GOI) has
Fig. 4. Block–wise status of ground water exploitation.
SafeSemi-criticalCriticalOver-exploitedSalineNot assessed

Efficient Water Management for Sustainable Agriculture 7
rightly decided to focus on Eastern India and has implemented a programme aptly titled“Bringing Green Revolution to Eastern India (BGREI)”. In view of the seriousness of theproblem, the Government is, therefore, putting a lot of emphasis on artificial recharge ofground water. A project for setting up 225 thousand recharge structures at an estimatedcost of approximately Rs. 20,000 crores has been launched with this objective and a cleardefined goal that it has to be implemented in a participatory mode with involvement oflocal communities, locally elected bodies like Panchayats, and Non Government Organi-zations (NGOs).
The National Water Policy had clearly enunciated that to meet the required foodgrain production of 2050, the efficiency of surface water use has to increase to 60% and ofground water to 75%. The National Water Mission, one of the eight missions launched asa part of the National Action Plan on Climate Change of the Government of India, envis-ages an increase in water use efficiency by 20 % by the year 2017 (end of XII plan).
As stated earlier in the National Water Policy regarding increase in the efficienciesof surface and ground water usage, figure 6 clearly indicates that a combination of in-creased efficiency in both ground water and surface water usage can enable meeting theproduction targets with the current quantum of water resources available.
Fig. 5. Groundwater abstraction trends in selected countries (in km3/year)

8 Bulletin of the Indian Society of Soil Science, No. 29
RAINFED AGRICULTURE
Although India has the largest irrigated area in the world, it has a very sizeable areaunder rainfed agriculture (nearly 80 Mha) which caters largely to pulses, oilseeds, minormillets, cotton and even rice (~45%) but the productivity of which is very low (<1 t ha-1).The average annual rainfall in India is 117 cm which is higher than the global average of110 cm but there is a wide spatial and temporal variation in its distribution and intensity.The ratio of the minimum, average and maximum is of the order of 1:10:100 with themaximum being around 11000 mm in Cherrapunji (Meghalaya) to 100 mm in the Thardesert. The number of rainy days can vary from 4 days to over 300 days a year and theintensity can vary anywhere from <1 cm hr-1 up to 15 cm hr-1. It has also been estimatedthat almost 80% of the rain occurs in only 100 hr in a year. Soil and nutrients loss due torun off is of the order of 5.34 billion tonnes and 6 million tonnes, respectively, resulting inproduction losses estimated to be in excess of Rs. 115 billion.
A comprehensive assessment of district level water harvesting potential by Sharma etal. (2010) revealed that the potential to realize the rainfed agriculture lies in the harvest ofsmall part of available surplus runoff and reutilize it for supplemental irrigation at criticalcrop growth stages. The study identified about 28.5 Mha of potential rainfed area coveringa large number of districts in central and eastern India that can generate sufficient runoff(114 BCM) for harvesting and reutilization. It is possible to raise the rainfed crop produc-tion by a total of 28-36 Mt from an area of 20-25 Mha during normal monsoon yearswhich could result in about 12% increase over the present production. With adoption ofimproved technologies (much likely possible once ‘critical water requirements’ are as-sured), the benefits could be still higher as shown (Figure 7). Extensive area coverage
Fig. 6. Irrigation efficiency and water demand scenarios. (Amarasinghe et al. 2007)
Waterdemandin 2000
Water demand in 2050: Surfaceirrigation efficiency - 50%
Water demand in 2050: Surfaceirrigation efficiency - 60%
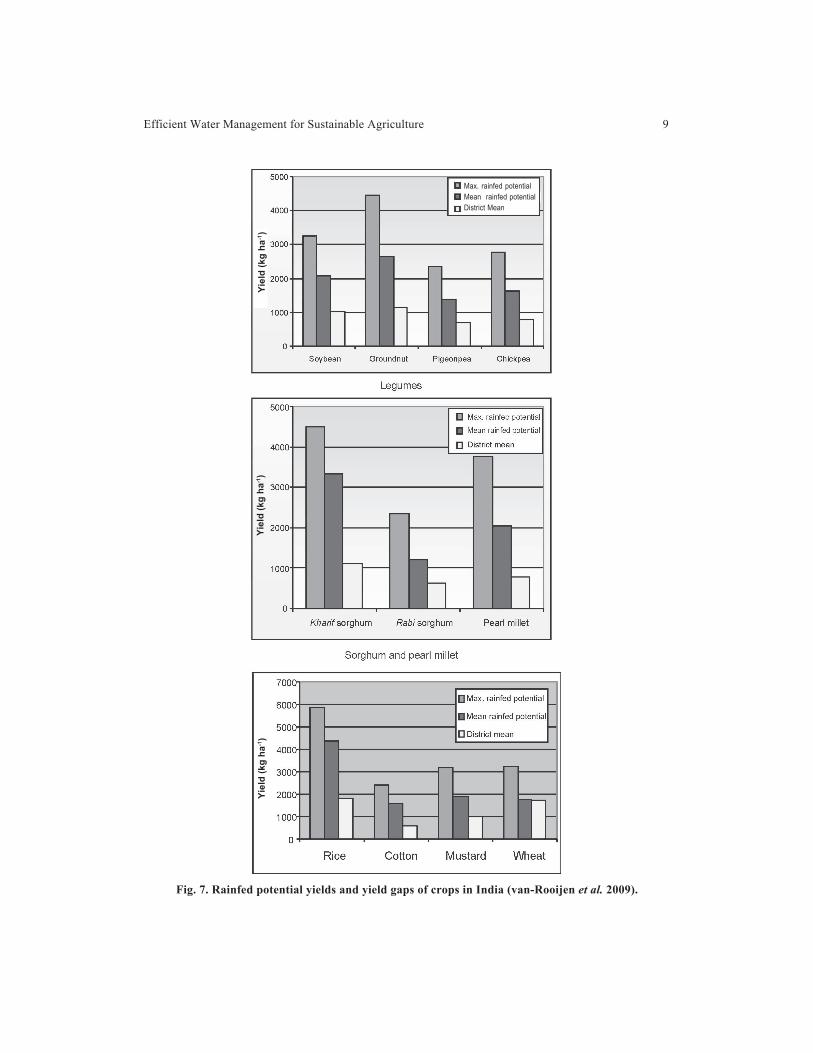
Efficient Water Management for Sustainable Agriculture 9
Fig. 7. Rainfed potential yields and yield gaps of crops in India (van-Rooijen et al. 2009).
Max. rainfed potentialMean rainfed potentialDistrict Mean
Yiel
d (k
g ha
-1)
Yiel
d (k
g ha
-1)
Yiel
d (k
g ha
-1)

10 Bulletin of the Indian Society of Soil Science, No. 29
rather than intensive irrigation needs to be followed inregions with higher than 750 mm yr-1 rainfall, since thereis larger possibility of alleviating the in-season droughtspells and ensuring a second crop with limited water appli-cation. This may be made an integral component of the on-going and new development schemes in the identified ruraldistricts.
The descriptive summary of multiple benefits derivedfrom the 636 watersheds as shown in table 3 reveals thatwatershed programmes are impacting the rain-fed areaswith a mean benefit-cost ratio of 1:2.03. The results haveindicated that even in such fragile eco-systems, theseprogrammes generated benefits which were more thandouble of their costs. About 18% watersheds generatedbenefits cost-ratios above 3. However, 68% of watershedshad a below average B:C ratio of 1:2.03 which indicatesthat there exists a large scope for proper watershed man-agement. Only 0.6% of the watersheds studied failed tocommensurate with cost of the project (Joshi et al. 2008).The mean internal rate return of 27.43% was significantlyhigher and comparable with any successful governmentprogramme (Table 3). The internal rates of return in 41%watersheds were in the range of 20 to 30% whereas about27% watersheds yielded IRR of 30 to 50%. The water-sheds with IRR below 10% were only 1.9%.
Another important purpose of the watershedprogrammes is to generate employment opportunities toaddress the equity concerns of landless labourers and mar-ginal and small farmers. The results of meta-analysis haveclearly established that watershed programmes resulted ingenerating substantial employment opportunities in the wa-tershed areas. The mean additional annual employment gen-eration was about 154 person-days ha-1 yr-1. This also im-plies that the investment in watershed developmentprogrammes can be considered as poverty alleviationprogrammes for those areas (Wani et al. 2011).
Focus on rainwater harvesting is important becauseglobal warming is likely to result in a decrease in the num-ber of rainy days and a consequent increase in intensityconsidering the prediction of GCM’s that rainfall will ei-ther increase or remain constant over the Indian subconti-nent. Historical data analysis has also indicated that thelow intensity rainfall events have decreased while the me-T
able
3. S
umm
ary
of b
enef
its fr
om th
e sa
mpl
e w
ater
shed
s us
ing
met
a an
alys
is
Parti
cula
rsU
nit
No.
of s
tudi
esM
ean
Mod
eM
edia
nM
in.
Max
.t-v
alue
Effic
ienc
yB
:C ra
tioR
atio
311
2.01
1.70
1.70
0.82
7.30
35.0
9
IRR
Per c
ent
162
27.4
325
.90
25.0
02.
0310
2.70
21.7
5Eq
uity
Empl
oy-m
ent
Pers
on d
ays/
ha/y
ear
9915
4.53
286.
6756
.50
0.05
900.
008.
13Su
stai
nabi
lity
Incr
ease
in ir
rigat
ed a
rea
Per c
ent
9351
.55
34.0
063
.43
1.28
204
10.9
4In
crea
se in
cro
ppin
g in
tens
ityPe
r cen
t33
935
.51
5.00
21.0
03.
0028
3.00
14.9
6
Run
off r
educ
edPe
r cen
t83
45.7
243
.30
42.5
30.
3896
.00
9.36
So
il lo
ss s
aved
t ha-1
yr-1
721.
120.
910.
990.
112.
0547
.21
Sour
ce: S
reed
evi a
nd S
hahe
en (2
008)

Efficient Water Management for Sustainable Agriculture 11
dium and high intensify rainfall events have increased over the hundred years (Figure 8), atrend which is likely to intensify as a consequence of climate change. As mentionedearlier, it is also a fact that even when all the water resources for irrigation have beendeveloped, almost 45% would still be rainfed. There is a distinct possibility of enhancingthe productivity of these areas by a minimum of 50% through rainwater harvesting andsupplemental irrigation.
Fig. 8. Changes in the frequency of extreme rainfall events over central India (Goswami et al. 2006)
EFFICIENT WATER MANAGEMENT TECHNOLOGIES
The National Agricultural Research System (NARS) through its vast network ofState Agricultural Universities (SAUs), Indian Council of Agricultural Research (ICAR)institutions and All Indian Coordinated Research Projects (AICRPs) have developed aplethora of technologies focusing on enhancing water use efficiency at all levels. They arebriefly described below.
Land Leveling
Proper land leveling is one of the management options which is generally ignored. Itincreases the water application efficiency which leads to higher yields as well as increasein water use efficiency (Table 4). It also has a direct impact on the nutrient use efficiency.
Methods of Irrigation
Check basin and border strip irrigation: Over the years many surface methods ofirrigation have been developed. Among them, the check basin method of irrigation is themost popular. It is very important to employ the correct method of water application to

12 Bulletin of the Indian Society of Soil Science, No. 29
minimize the adverse effects of irrigation. The selection of the right method of irrigationis influenced by the soil type, land topography, crops to be grown, quality and quantity ofwater available for irrigation and other site-specific variations. It is essential to follow theprescribed guidelines to improve productivity per unit quantity of water applied. Consider-able amount of work has been done on these aspects but the guidelines for selecting theappropriate method of irrigation water application are largely ignored. Farmers go in forsurface flooding which is an inefficient manner of using this precious natural resource. 10to 15% efficiency in water use can easily be achieved by adopting the appropriate method.
Furrow irrigation: The furrow method of irrigation is generally used to irrigate rowcrops and vegetables, and is suited to soils in which the infiltration rates are between 0.5and 2.5 cm hr-1. It is ideal for slopes varying from 0.2 to 0.5% and a stream size of 1-2 l s-
1. Many of the field crops in which water is applied through flooding, check basin orborder strip methods, can easily be adapted for furrow irrigation or its modified versioni.e. raised bed system. Table 5 shows how savings in irrigation water can be achieved byswitching over to raised bed furrow irrigation systems. In areas where water for irrigation
Table 4. Benefits of laser leveling
Crop Grain yield (t ha-1) Water savingLaser leveled Without laser over without laser
field leveling leveled field (%)
Paddy 6.79 6.50 38Wheat 4.75 4.55 20Sugarcane 112.0 98.75 24Summer mungbean 0.55 0.38 20Potato 10.0 9.00 25Onion 10.0 9.00 20Sunflower 2.25 2.00 20
Table 5. Benefits of bed planting observed in India
Crops Yield on beds Yield on flat Water savings Yield increase (t ha-1) (t ha-1) (% over flat) (% over flat)
Cauliflower 25.9 18.9 36.4 37.0Green peas 11.9 10.4 32.4 14.5Okra 34.4 29.1 33.3 18.2Carrot 36.3 28.6 31.8 26.9Radish 34.7 26.7 29.4 30.0Cabbage 33.0 27.8 26.8 18.7Maize 3.3 2.4 35.5 37.4Urd bean 1.8 1.4 26.9 33.6Mungbean 1.6 1.3 27.9 21.8Wheat 5.1 4.8 26.3 6.4Pigeonpea 2.2 1.5 30.0 46.7Gram 1.9 1.6 27.3 17.1Average 30.3 25.7
Source: Connor et al. (2013)

Efficient Water Management for Sustainable Agriculture 13
purposes is scarce, the practice of alternate or skip furrow irrigation can save considerablequantity of water without significantly affecting the yields. In areas requiring surfacedrainage or where the cultivated crops are sensitive to water logging, the furrows areeffective in removal of excess water.
Surge flow irrigation: Excessive water intake and deep percolation losses are majorlimitations for irrigation through furrows and border strips. Surge flow irrigation, theintermittent application of water in a series of on and off modes of constant or variabletime spans has the potential of reducing intake and percolation losses, increasing theirrigation efficiencies and conserving irrigation water. Experiments conducted at severallocations have corroborated that surge flow furrow irrigation results in faster water frontadvance and reduces the volume of water required to complete the advance phase. Thestudies also confirmed that it increases water distribution efficiency, reduces infiltrationrate and the cumulative infiltration depth, and consequently reduces the percolation losses.
Pressurized irrigation systems: To encourage adoption of water efficient technolo-gies, the Government has provided subsidy to popularize pressurized system of irrigationlike sprinklers and drip (Trickle) which both together now occupy more than 6 Mha(Table 6). The pressurized method of irrigation gives many advantages over the gravitysurface irrigation methods in terms of water savings and yields (Table 7). The quality of
Table 6. Statewise area (ha) under micro-irrigation on March 2012
State Drip Sprinkler Total
Rajasthan 55715 1098133 1153848Maharashtra 778660 347623 1126283Andhra Pradesh 665661 323457 989118Karnataka 293593 385675 679268Haryana 17772 542431 560204Gujarat 309520 246222 555742Madhya Pradesh 110550 176223 286774Tamil Nadu 206756 28217 234973West Bengal 589 150576 151165Chattishgarh 11328 136310 147638Orissa 12320 46090 58410Sikkim 3460 1339 4799Punjab 27615 11559 39174UP 13973 17328 31301Kerala 17301 4280 21581Bihar 752 36628 37381Nagaland 0 3962 3962Jharkhand 1273 8842 10115Goa 874 761 1635HP 116 581 697Arunachal Pradesh 613 0 613Assam 116 129 245Mizoram 72 106 178Uttranchal 38 6 44Manipur 30 0 30

14 Bulletin of the Indian Society of Soil Science, No. 29
produce through drip irrigation is generally superior to conventionally irrigated crops.These pressurized irrigation systems are very useful particularly in undulating and unevenlands or very coarse textured soils. The use of these techniques can be promoted for use inirrigation commands for specific conditions.
Fertigation: It is also possible to supply the nutrients to the crops through the pres-
Table 6. Continued...
State Drip Sprinkler Total
Others 15000 30000 45000Total 2543696 3596479 6140176Source: NCPAH (2012)
Table 7. Relative performance of drip and flood traditional irrigation
Crop Yield q ha-1 Irrigation Water (cm) WUE q ha cm-1
Surface Drip Surface Drip Surface Drip
Vegetables (16) 17.22 23.83 64.1 35.3 3.98 8.84(Av. of 34 cases) (38%) (45%) (122%)Fruits (7 types) 16.11 28.51 83.3 57.8 2.62 7.5(Av. of 16 cases) (77%) (31%) (186%)Cotton 2.38 3.13 85.7 41.1 0.28 0.81(Av. of 3 cases) (32%) (51.8%)Ground nut 3.54 9.4 74.6 51.4 0.54 1.78(Av. of 4 cases) (157%) (31%) (230%)Sugarcane 107.7 139.0 165.1 109.9 7.16 13.06(Av. of 7 cases) (29%) (33%) (82%)All Crops 29.38 40.72 94.56 59.1 2.92 6.39(Av. of 64 cases) (38%) (37%) (119%)Source: Compiled from several reports.
surized system of irrigation popularly called as fertigation. Supplying liquid soluble fertil-izers through a drip system can lead to savings in fertilizer applied to the extent of at least40% without affecting the yield and a much higher application efficiency compared to theconventional methods. This is in addition to the savings in water applied which could beanywhere from 50 to 70%. The quality of produce is also superior.
USE OF POOR AND MARGINAL QUALITY WATERS FOR IRRIGATION
Due to intense competition with domestic, industrial and power sectors, agriculturewill also have to depend more and more on the use of marginal/poor quality of water as itis projected that the share of water allocated to agriculture is likely to decrease by 10-15%in the next 20-30 years. Sprinkler and drip irrigation methods of water application aretechniques in which such water can be used effectively. However, the long-term impact ofprolonged use of such waters has to be always kept in mind while recommending suchoptions.

Efficient Water Management for Sustainable Agriculture 15
In regions where good quality (fresh) water is available even in limited quantities,conjunctive use offers a safe way of utilizing a combination of poor and good qualityeither through mixing (dilution) or cyclic uses (Table 8). In a detailed study aimed atevaluating the use of paper mill effluent for irrigation in the farmers’ fields, it was ob-served that in all the crops namely, maize, wheat, rice and mustard, highest grain yieldswere obtained with mixed irrigation (Tube well + effluent in 1:1 ratio) as compared toirrigation with tube well and effluent waters only (Table 9).
Table 9. Effect of paper mill effluent on yield
Characteristics Tubewell Tubewell Effluentirrigation effluent
RiceGrain Yield (q/ha) 43.7 46.7 36.5Dry Matter (q/ha) 130.5 134.1 124.4Harvest index 31.2 34.9 28.9
MaizeGrain Yield (q/ha) 31.5 36.8 30.5Dry Matter (q/ha) 102.5 115.7 98.5Harvest index 30.8 31.5 30.5Source: Yadav et al. (2004)
Table 8. Conjunctive use of good and poor quality water
Water quality Average yield of 6 years (t ha-1)Rice Wheat
Canal water (CW) 6.8 5.4Sodic water (SW) 4.2 3.12 CW-SW 6.7 5.2CW-SW 6.3 5.1CW-2SW 5.7 4.8
The water savings associated with the various interventions developed are summa-rized below:
• Proper scheduling of canals (matching supply with demand): 40-60%
• Precision leveling through laser levelers: 15-20%
• Scientifically designed check basins/border strips: 10-30%
• Zero tillage: 20-30%
• Adoption of pressurized irrigation systems: 40-70%
• Land configuration changes-ridge/furrow or raised/sunken beds: 20-25%
• Use of tissue cultured eucalyptus, banana, sugarcane, papaya etc. 30%
Simple measures like banning transplanting of paddy before second week of June inHaryana and Punjab have made a significant impact on the ground water extraction in the

16 Bulletin of the Indian Society of Soil Science, No. 29
two states. Such policy decisions can convey a message that unnecessary and wasteful useof water is a non-sustainable and non-negotiable issue.
ROLE OF DRAINAGE IN CROP PRODUCTION
The problem of waterlogging and soil salinisation is increasing in the commands ofmany irrigation projects, especially in the arid and semi arid areas. It is estimated thatalmost 2.5 Mha has become waterlogged and 3.3 Mha has been affected by salinity in thevarious irrigation commands. Inefficient use of irrigation water is the primary cause forconverting these highly productive lands into wastelands. Therefore, scientific irrigationscheduling, appropriate water application method, and correct cropping pattern suited tothe local conditions are important for combating the problem. Under some situations,microirrigation like drip method is extremely useful for reducing water losses, increasingwater use efficiency, and minimizing environmental degradation without affecting the cropyields.
In waterlogged areas, for improving the soil environment and making it more condu-cive and favourable for crop growth, surface or subsurface drainage is the only effectivealternative (Table 10). Investigations have revealed that the cost of restoring the productiv-ity of these affected lands is very high and can totally upset the economy and durability ofthe projects.
Table 10. Impact of land drainage on crops yields at various locations in the country
Place Crop Crop production (t ha-1)Before After Increase over
drainage drainage pre-drainage(%)
Sampla (Haryana) Cotton 0 1.4-1.8’ -Wheat 0 2.5-4.9’ -Barley 0 2.1-4.2’
Ismaila (Sampla) Wheat 0.9 1.9 111Konanki (Andhra Pradesh) Paddy 3.7 5.6 51Uppugunduru (Andhra Pradesh) Paddy 3.6 5.2 45Segwa (Gujarat) Sugarcane 78-104 105-140 35Islampur Cotton 3.3 10.4 215
Paddy 1.4 5.5-6.2 290-340Sunflower 3.0 7.4 146Sorghum 6.8 11.6 70Wheat 4.0 6.7 68
Gohana Wheat 3.1 3.6 18Paddy 1.4 1.7 21Pearl millet 0.9 1.23 40
Vaddarathi Rice 3.5 8.4 140Gundur Rice 2.8 8.1 189Siddapur Rice 2.4 7.3 204Gangavathi Rice 4.0 7.9 98Sindhanur Rice 2.2 3.7, 6.7-7.5 223Gorebal Rice 2.3 7.2 213

Efficient Water Management for Sustainable Agriculture 17
In many coastal areas, excessive pumping of ground water through tube wells leadsto deterioration of water quality due to sea water intrusion. For skimming fresh water,Dorouv technology/infiltration gallery methods have been found to be beneficial to pre-vent sea water intrusion. Similarly, in many island areas overdrawal of good quality groundwater leads to lowering of water table and acute water shortage. Scientific regulation ofthe intensity of tube wells according to local aquifer characteristics is highly essential toensure proper water balance.
WASTEWATER PRODUCTION, TREATMENT AND MANAGEMENT
With the projected scenarios of water availability compounded by global warming,increasing urbanization (circa 55% of India’s estimated 1.6 billion would be urban by2050) and industrialization, huge volumes of waste waters will be generated. These wastewaters would be of varying qualities depending upon the source. In developing countrieslike India, the problems associated with wastewater reuse arise from its lack of treatment.On the whole only 60% of industrial water and 26% of domestic water is treated in India.Considering the size, its vast population and various sectoral demands, India is a growingmarket for water and wastewater treatment. It includes both sewage treatment and effluenttreatment. Industrial and municipal sectors account for almost 90% of the estimated US$2000-2100 million water treatment market in India. Currently, 75% of the rural populationand 85% of the urban population have access to the public water supply. However, mu-nicipal agencies in many Indian towns and cities are unable to increase their water supplycapacities to match population growth, especially in the urban areas. The challenge, thus,is to find low-cost, low-tech and user friendly methods, which on one hand avoid threaten-ing our substantial wastewater-dependent livelihoods and on the other hand protect degra-dation of our valuable natural resources.
With rapid expansion of cities and domestic water supply, quantity of gray/wastewa-ter is increasing in the same proportion. As per CPHEEO estimates about 70-80% of totalwater supplied for domestic use gets generated as wastewater. The per capita wastewatergeneration by the class-I cities and class-II towns, representing 72% of urban population inIndia, has been estimated to be around 98 lpcd while that from the National CapitalTerritory-Delhi alone (discharging 3,663 MLD of wastewaters, 61% of which is treated) isover 220 lpcd (Conner 2003). As per CPCB estimates, the total wastewater generationfrom Class I cities (498) and Class II (410) towns in the country is around 35,558 and2,696 MLD, respectively (Table 11), while, the installed sewage treatment capacity is just11,553 and 233 MLD, respectively thereby leading to a gap of 26,468 MLD in sewage
Table 11. Waste treatment capacity in Indian cities
Class I Class II city Total(0.1–1 million) (50,000–99,999)
Waste water generated (MLD) 35,558 2,697 38,255Waste treatment capacity (MLD) 11,554 234 11,788Missing capacity (MLD) 24,004 2,463 26,467Untreated waste (%) 68 92 70

18 Bulletin of the Indian Society of Soil Science, No. 29
treatment capacity (CPCB 2009). Maharashtra, Delhi, Uttar Pradesh, West Bengal andGujarat are the major contributors of wastewater (63%; 9). Further, it has been estimated(Singh 2013; WWAP 2006) that the industrial water productivity (IWP) of India is thelowest (i.e. just 3.42) and about 1/30th of that for Japan and Republic of Korea (Table 12).It is projected that by 2050, about 48.2 BCM (132 billion litres per day) of wastewaters(with a potential to meet 4.5% of the total irrigation water demand) would be generatedthereby further widening this gap (Bhardwaj 2005). Thus, overall analysis of water re-sources indicates that in coming years, there will be a twin edged problem to deal withreduced fresh water availability and increased wastewater generation due to increasedpopulation and industrialization.
Table 12. Industrial water use and productivity in some selected countries
Country Industrial value added Industrial water Industrial water(IVA):a 2001 (in billion use 2000 productivity (TWP)
constant 1995 US$) (km3 yr-1) (US$ IVA m-3)
Japan 1890 16 119.62Republic of Korea 286 3 93.66UK 340 7 47.28The Netherlands 120 5 25.17Germany 748 32 23.43USA 2148 221 9.73China 594 162 3.67India 120 35 3.42
As stated earlier, more than half of the country would be living in cities and towns by2050, a very sizeable amount of domestic as well as industrial waste waters will begenerated. Since these wastewaters also contain a significant amount of nutrients and theirdisposal is an environmental issue, they should be considered as resource for irrigation andsystematic efforts should be made for their primary treatment as it is cost effective. Peri-urban agriculture needs to be given high priority to meet the specific demands of the urbanpopulation particularly vegetables and flowers.
Therefore, it is time to declare these wastewaters as a “resource” so that one can startto scientificantly develop cost-effective and eco-friendly solutions to meet the domestic,industrial, agricultural and environmental demands of the country which would be themost populous nation of the world in a couple of decades.
The conventional wastewater treatment processes are expensive and require complexoperations and maintenance. It is estimated that the total cost for establishing treatmentsystem for the entire domestic wastewater is around Rs. 7,560 crores (CPCB 2005), whichis about 10 times the amount which the Indian government plans to spend (Kumar 2003).The sludge removal, treatment and handling have been observed to be the most neglectedareas in the operation of the sewage treatment plants (STPs) in India.
For agricultural purposes the use of constructed wetlands is now being recognized asan efficient technology for wastewater treatment (Kaur et al. 2011). Compared to the

Efficient Water Management for Sustainable Agriculture 19
conventional treatment systems, constructed wetlands need lesser material and energy, areeasily operated, have no sludge disposal problems and can be maintained by untrainedpersonnel. Further these systems have lower construction, maintenance and operation costsas these are driven by natural energies of sun, wind, soil, microorganisms, plants andanimals. They should be popularized.
Hence, for planned, strategic, safe and sustainable use of wastewaters there is a needfor policy decisions and coherent programmes encompassing low-cost decentralized wastewater treatment technologies, nano/bio-filters, efficient microbial strains, and organic/inorganic amendments, appropriate crops/ cropping systems, cultivation of remunerativenon-edible crops and modern sewage water application methods.
MULTIPLE USES OF WATER
Since the scarcity of water is going to worsen in the future, the emphasis has to shiftfrom the conventional land productivity approach to enhancing the water productivity on asystems basis. Multiple use of water provides opportunities for increasing water productiv-ity, enabling diversification to high value products, reducing risk, optimizing resource useand a regular flow of income as well as judicious utilization of water of poor/marginalquality. Integrated farming system (IFS)-based agriculture can enhance the water produc-tivity, reduce the amount of external inputs to be purchased by the farmers and increasehis income (Figure 9).
Fig. 9. Water productivity in different cropping/farming systems
REDUCING THE WATER FOOTPRINT
Obviously, availability of water will be the key driver for ensuring the food andnutrition security for the Indian population estimated to cross 1.6 billion in 2050. Theconventional or the “business as-usual” approach will not serve the purpose because in thenext two decades we need to produce around 25% more from 10 to 15% reduced share of
20 Bulletin of the Indian Society of Soil Science, No. 29
water. Focus on enhancing water use efficiency is absolutely essential to meet the targetwith the available water resources. In addition to land productivity, the emphasis has toshift to water productivity. Earlier the parameter used to estimate efficiency was referredto as “water use efficiency” i.e. the amount of produce per unit amount of water. This wasreplaced by the term “water productivity” which is essentially the reciprocal of “water useefficiency”. However, the denominator could be either the produce or the money spent orany other relevant parameters. From this emanated the concept of “Virtual Water”. Itessentially signifies the amount of water that is consumed (embedded) in the production ofa specific commodity whether it is an agricultural or industrial product. When products aretraded i.e. exported or imported, the amount of fresh water that goes into the productionwhich is “hidden” is also traded. That “hidden water” is referred to as “Virtual Water”.This may become an important consideration as water availability scenario worsens. Eventoday, rice is being produced in Punjab and Haryana which are relatively water scare andexported to other states of the country where water is relatively abundant.
However, the concept of Virtual Water has some shortcomings. It does not take intoaccount the source of water used in the production. It also ignores the environmentalimpacts of the water used or expelled during the process. Similar to the “carbon foot-prints” that are used as a criteria on for quantifying the impact and contribution of anactivity to global warming, “Water Foot Prints” are now being used to quantify the effi-ciency of water use by the different sectors as well as nations. It is an indicator whichquantifies fresh water consumption including both direct and indirect use, and also takesinto account where and when the water was used. It consists of three components, namely,green, blue and gray water footprints. The green water footprint refers to the consumptionof the rain water i.e. moisture stored in the soil. The blue water footprint relates to theconsumption of surface and ground water. The grey water footprint is the polluted waterreleased by the production system and described as the volume of fresh water that wouldbe required to assimilate the load of pollutants based on existing ambient water qualitystandards.
Water footprint assessment not only accounts for water consumed but also thesustainability of water use. It permits the production system to pinpoint the water-relatedimpacts, vulnerabilities and action that need to be taken for reducing the water footprint.Jain Irrigation System Ltd. (2010) conducted a study to quantify the water footprint ofonion production and highlighted the differences in water footprints of drip and floodirrigation systems. According to their report, the green water footprint in onion productionwas 9 L kg-1 in drip compared to 12 L kg-1 in flood irrigation. The blue water footprint was233 L kg-1 in drip and 359 L kg-1 in flood irrigation system. Interestingly, the gray waterfootprint was only 6 L kg-1 in drip compared to 57 L kg-1 in flood irrigation system (Figure10). This was a direct consequence of more efficient fertilizer use and almost negligibleleaching losses in drip system.
If we compare the water footprint of crop production for India and China (Mekonnenand Hoekstra 2011), it is interesting to note that overall water footprint of India (1047 bcmyr-1) in greater than China (967 bcm yr-1). When the break up is examined, India (716 bcmyr-1 representing 12.41% of the global green footprint and 231.4 bcm yr-1 representing

Efficient Water Management for Sustainable Agriculture 21
25.73% of the blue water footprint) has a large green and blue water footprint compared toChina (623.9 bcm yr-1 representing 10.81% of the global ocean water footprint and 118.9bcm yr-1 representing 13.22% of the global blue water footprint). But the contrast is vastlydifferent when it comes to the grey water footprint which for India is only 99.4 bcm yr-1
(13.56% of the global grey water footprint) compared to China’s 223.8 bcm yr-1 (30.53%of the global grey water footprint). With almost a similar net irrigated area but a muchhigher fertilizer application rate, China has the largest grey water foot print globally(Table 13).
Fig. 10. Water footprints for onions grown in Jalgaon region (Source: Water Footprint Assess-ments: Jain Irrigation Systems Ltd).
Table 13. Water footprints of crop production in selected countries (1996-2005)
Country Water footprint of crop production (Gm3 yr-1)Green Blue Grey Total
India 716.0 231.4 99.4 1047China 623.9 118.9 223.8 967USA 612.0 95.9 118.2 826Brazil 303.7 8.9 16.0 329Russia 304.8 10.4 11.6 327Indonesia 285.5 11.5 20.9 318Nigeria 190.6 1.1 0.6 192Argentina 157.6 4.3 5.0 167Canada 120.3 1.6 18.2 140Pakistan 40.6 74.3 21.8 137World 5771 899 733 7404

22 Bulletin of the Indian Society of Soil Science, No. 29
There is a significant change in the dietary habits of the Indian population with adistinct shift towards non-vegetarian and processed food products. This is going to imposeextra pressure on the already dwindling resources. The water footprint of any animalproduct (Mekonnen and Hoekstra 2012) is larger than the water footprint of crop productswhen compared on equivalent nutritional value. For example, the water foot print per gramof protein is higher by 1.5 times on case of milk, eggs and chicken compared to pulses. Itis actually the lower feed conversion efficiency which is the main factor responsible forlarger water footprints of meat based products.
It is, therefore, essential to reduce the water footprint. This can be achieved by theindustries through full water recycling so that the blue water footprint becomes negligibleand focusing on recycling of material and heat so that the grey water footprint becomeszero. In case of agriculture, enhancing water productivity of harvested rainwater willreduce green water foot print. Adoption of efficient water application technologies, laserleveling etc. would reduce the blue water footprint as illustrated by onion productionthrough drip and flood irrigation systems. Adopting integrated nutrient management ap-proach, organic farming and precision agriculture can lead to near–zero level of grey waterfootprint.
USE OF MODERN TOOLS IN WATER MANAGEMENT
The stupendous progress in information technology coupled with the rapid advance-ments made in Geographical Information Systems (GIS), simulation tools, sensors, preces-sion farming and remote sensing have opened up new vistas for water resources develop-ment and management. These tools should be an integral system of scientific managementof irrigation networks, water distribution, crop planning and related operational activitiesas they will enable the system managers to take correct and timely decisions. These toolscan be equally, if not more effectively utilized in assessment and monitoring of watershed-related development studies. Decision Support Systems (DSS) for real-time monitoringand decision-making with inputs from remote sensing and ground based inputs can con-tribute significantly in improving water use efficiencies in large irrigation projects andintegrated watershed management.
Developments in biotechnology have reached a level where gene flow has no bound-ary. Marker Assisted Selection (MAS), gene pyramiding etc. can enable identification aswell as introduction of genes (single/multiple) that can enhance water use efficiency aswell as increase tolerance to waterlogging, soil salinity or heavy metal toxicity. The poten-tial of this technology needs to be utilized fully.
In summary, issues that need to be addressed on priority are:
• Water use efficiency for surface water is low (30-40%)
• The gap between the irrigation potential created and utilized is substantial (currentlyaround 25%) and widening.
• Irrigation systems are supply-driven and canal schedules rigid.
• Supply/distribution of water is insufficient and unequal.

Efficient Water Management for Sustainable Agriculture 23
• There is diversion of cultivable land for other purposes within the command area.
• Poor O&M cost recovery
• Lack of adoption of water efficient technologies
• Inefficient use of water leading to waterlogging and secondary salinization
• Over-exploitation of ground water
• Poor quality of ground water
• Sea water intrusion in coastal areas
Strategies that need to be chalked out urgently
• There is a need to close the gap between the irrigation potential created and utilizedwhich now stands at more than 20 Mha.
• The irrigation systems should be demand-driven and not supply-driven.
• Emphasis should be on integrated and conjunctive use of rain, surface and groundwaters.
• Development of cost-effective and ecofriendly-technologies for sustainable high pro-duction of agricultural produce of competitive quality should receive top priority.
• The extension agencies should be geared up for speedy transfer of improved technolo-gies.
• Incentives may be provided to the farmers for adopting sufficient water use technolo-gies.
• Awareness has to be created among farmers about the value and scarcity of resourcesand negative fallouts of improper use.
• Fine-tuning of furrow-based irrigation systems (raised beds) for different crops andsoils.
• Development of low cost pressurized irrigation systems.
• Development of crop-specific fertigation schedules for enhancing nutrient use effi-ciency
• Use of agrochemicals which enhance water (and nutrient) use efficiency
• Development of a regulatory mechanism for ground water resource development andutilization
• Use of modern tools for developing cultivars of higher water productivity
• Institutional mechanism for full recovery of operation and maintenance costs throughrealistic pricing of water for different stakeholders
• Multi-disciplinary participatory management approach for surface/ground water irri-gated and rainfed areas.

24 Bulletin of the Indian Society of Soil Science, No. 29
• Focus on multiple use of water through identification of cropping /farming systemswhich can enhance water productivity.
• Planned waste water reuse with emphasis on peri-urban water use.
• Focus on bioremediation of waste waters.
• Use of renewable energy e.g., solar energy, for agricultural purposes.
• Development of user-friendly decision support systems (DSS) for real time decisionmaking.
The Government of India has initiated several large programmes focusing on developmentof water resources. Some of the major ones are:
• Flood Management Programme
• Artificial Recharge to Ground Water through Dug Well
• Command Area Development and Water Management Programme
• National Project for Repair, Renovation and Restoration (RRR) of Water Bodies
• Accelerated Irrigation Benefit Programme (AIBP)
• Farmer’s Participatory Action Research Programme (FPARP)
• Integrated Watershed Development Programme
• The National Mission on Water (part of National Action Plan on Climate Change)which has set a target of enhancing water use efficiency by 20% by the end of thecurrent plan
• National Bureau of Water Use Efficiency (NBWUE) is being constituted as an Au-thority for the purpose of promotion, regulation and control of efficient use of water inirrigation, municipality and/or industrial user.
• Establishment of State Water Resources Regulatory Authorities (SWRRA) being en-couraged.
CONCLUSIONS
Past research efforts have yielded valuable information on individual components ofwater management. Since the component responses are interlinked and interactive, anoptimized management strategy for the irrigation system as a whole, needs to be developedincluding the socio-economic aspects to evolve situation-specific on farm water manage-ment models.
Share of water to agriculture is going to decline in the future due to the stiff competi-tion from the industrial and domestic sectors and compounded further by global warmingand associated adverse impact of climate change. The pressure to produce more and morefrom less and less is intensifying with each passing moment. Since, water is a critical inputfor agriculture, therefore, adoption and upscaling of new technologies as quickly aspossible in the only viable solution.

Efficient Water Management for Sustainable Agriculture 25
REFERENCES
Amarasinghe, U.A., Shah, T., Turral, H. and Anand B.K. (2007) India’s water future to 2025-2050:Buisness-as-usual scenario and deviations. Research Report 123. International Water Manage-ment Institute, Colombo, Sri Lanka (1998). 41 pp.
Bandaragoda, D.J (1998) Need for institutional Impact Assessment for Irrigation SystemModermization, Research Report 21, International Water Management Institute, Colombo, SriLanka. 17 pp.
Bhardwaj, R.M. (2005) Status of Wastewater Generation and Treatment in India, IWG-Env JointWork Session on Water Statistics, Vienna, 20-22 June, 2005.
CGWB (2011) Ground Water Year Book – India 2010-11. Central Ground Water Board, Ministry ofWater Resources, Government of India. http://www.cgwb.gov.in/documents/Ground%20Water%20Year%20Book-2010-11.pdf.
Connor, D.I., Gupta, R.K., Hobbs, P.R. and Sayre, K.D. (2003) Bed planting in rice-wheat system.In Addressing Resource Conservation Issue in Rice-wheat System of South Asia: A ResourceBook. Rice-Wheat consortium for the Indo–Gangetic Plains. International Maize and WheatImprovement Centre, New Delhi, India, pp. 103-108
CPCB (1999) Status of water supply and wastewater collection treatment and disposal in class ICities – 1999. Control of Urban Pollution Series: CUPS/44/1999-2000.
CPCB. (2005) Parivesh Sewage Pollution – News Letter. Central Pollution Control Board, Ministryof Environment and Forests, Govt. of India, Parivesh Bhawan, East Arjun Nagar, Delhi 110032 http://cpcbenvis.nic.in/newsletter/sewagepollution /contentsewagepoll0205.htm.
CPCB. (2007) Evaluation of Operation and Maintenance of Sewage Treatment plants in India-2007,Control of Urban Pollution Series: CUPS/68/2007. Central Pollution Control Board, India.
CPCB (2009) Status of Water Supply, Wastewater Generation and Treatment in Class-I cities andClass-II towns of India, Central Pollution Control Board, Delhi.
CWC (2013) Water and related statistics. Central Water Commission, New Delhi. p. 201.
Hamumantha Rao, C.H. and Gulati, A. 1994. “Indian Agriculture: Emerging Prospectives and Policyissues:. Research paper under USAID Grant No. 386-0282-G-IN-8334, ICAR, New Delhi andIFPRI.
Jain Irrigation Systems Ltd. (2010) Water Foot Prints Assessments: Dehydrated Onion Products.Micro Irrigation Systems. 50 pp.
Joshi, P.K., Jha, A.K., Wani, S.P., Sreedevi, T.K. and Shaheen, F.A. (2008) Impact of watershedprogramme and conditions for success: A meta-analysis approach. Global Theme onAgroecosystems Report No. 46, ICRISAT Patancheru, Andhra Pradesh, India; 24 pp.
Kaur, R., Wani, S.P., Singh, A.K. and Lal, K. (2011) Wastewater Production, Treatment and Use inIndia. 13 p.
Kumar R.M. (2003) Financing of Wastewater Treatment Projects. Infrastructure Development, Fi-nance Corporation and Confederation of Indian Industries. Water Summit, Hyderabad, 4-5,December 2005.

26 Bulletin of the Indian Society of Soil Science, No. 29
Margat, J. (2008) Les eaux souterraines dans le monde. Paris, BGRM/Editions UNESCO.
Mekonnen, M.M. and Hoekstra, A.Y. (2011) The green, blue and grey water footprints of crops andderived crop products. Hydrology and Earth System Sciences 15: 1577-1600.
Mekonnen, M.M. and Hoekstra, A.Y. (2012) A global assessment of the water footprint of farmanimal products. Ecosystems 13, 401-415.
NCIWRD (1999) Report National Commission for Integrated Water Resources Development, Minis-try of Water Resources, Vol. I, 542 p.
NCPAH (2012) National Committee on Plasticulture Applications in Horticulture 2012.
Parthasarathy, R. (2000). Participatory Irrigation Management Programme in Gujara: Institutionaland Financial Issues. Economic and Political Weekly, Vol XXXV No. 35&S6. pp. 3147-3154.
Planning Commission (2013). Water. Twelfth five year plan (2012/2017). Planning Commission,Government of India, Vol. 1. 144-190
Report of the Working Group on Urban and Industrial Water Supply and Sanilation for the TwelfthFive – Year Plan (2012-2017) November 2011. p. 61 (Source: S.S. Hastak, 24×7 Water supplyproject of Nagpur, NESL, presentation made to Ministry of Urban Development, New Delhi,April, mimeo).
Selvarajan, S. (2001) Sustaining India’s Irrigation Infrastructure. Policy Brief 15, NCAP, NewDelhi, 7 p.
Sharma, B.R., Rao, K.V., Vittal, K.P.R., Ramakrishna,Y.S. and Amarasinghe, U. (2010) Estimatingthe potential of rainfed agriculture in India: Prospects for water productivity improvements.Agricultural Water Management 97, 23-30.
Singh, A.K. (2008) Making each drop count. Journal of Soil and Water Conservation India 7(2): 1-10.
Singh, A.K. (2013) Water management: Issues and strategies. In Fertiliser Sector at the Crossroads,FAI Annual Seminar Papers. New Delhi, pp. SII-3/1-15.
van-Rooijen D.J., Turral H., Biggs T.W. (2009) Urban and Industrial Water Use in the Krishnabasin. Irrigation and Drainage 58, 406-428.
Wani, S.P., Rockstrom, J., Venkateswarlu, B. and Singh, A.K. (2011) New paradigm to unlock thepotential of rain-fed agriculture in the semiarid tropics. Advances in Soil Science- World SoilResources and Food Security pp. 419-469.
WWAP (2006) Water – a shared responsibility. World Water Assesment Program, UNESCO, Paris.
WWAP (2012). The United Nations World Water Development Report 4: Managing Water underUncertainty and Risk. (World Water Assessment Programme, 2012), UNESCO, Paris. 866 p.
Yadav, B.R., Singh, S., Joshi, H.C. and Singh, A.K. (2004) Heavy metals content in rice and maizeplants irrigated with paper mills effluent. Journal of Water Management 12, 97-100.

Bulletin of the Indian Society of Soil Science, No. 29. pp 27-40 (2014)
Status and Management of Water Resources inIrrigated Agriculture — Punjab as an Illustrative
Example
G.S. Hira1 and S.S. Kukal2
India has a history of famines owing to rain-fed agriculture and rapid population growth.The Bengal famine of 1943 was the last to occur. After the era of Green Revolution thatbegan in 1960s, India never felt famine like situation though it experienced a worst droughtof the century in 1987. High irrigated northern states (Punjab, Haryana and western UttarPradesh) are contributing about whole of wheat and two-thirds of rice to the central poolof India. Punjab has the highest irrigated area (98%) and so is its food grain contributionto the central pool. The agricultural production of India needs to be increased by 23% by2023 to feed present projected population of 1.35 billion. At the same time it is predictedthat by 2023, agricultural production in Punjab might not even be sustainable at thecurrent level unless major steps are taken for the management of its fast-depleting ground-water.
The irrigated area in the country is just 39.5% with Punjab leading with its 98% areaunder irrigation, followed by Haryana at 83% and UP at 68%. All other states have lessthan 51% irrigated area. Because of the highest levels of irrigation in Punjab, Haryana andwestern UP, these states are contributing 98% of wheat and 66% of rice to the central poolof India. The Punjab irrigation system is the largest of its kind in the world. Punjab hasplayed a pivotal role in sustaining India’s food security and is referred to as the “Granaryof India” (Hira and Khera 2000). In sustaining agricultural production, Punjab has alreadydepleted its good quality groundwater resources (GWR). These GWR were conservedacross 105 years, i.e., from 1859 to 1964, with the introduction of a mighty canal network.Punjab agriculture is currently facing the problems of a declining groundwater table (Hiraet al. 2005), increased energy cost for pumping and deterioration of groundwater quality.These problems will be further aggravated unless interventions are made at this stage.
Water management in the northern states (Punjab, Haryana and UP) will be a keyfactor for the food security of India. In the current paper, past, present and future scenariosof GWR-related problems of Punjab have been analyzed. Solutions have been presented tosave GWR for sustaining the agricultural production in Punjab vis-à-vis food security ofIndia. Groundwater situation in Haryana and western UP being more or less similar to thatin Punjab, the remedial measures suggested in this paper will also be applicable to Haryanaand western UP.1Former Additional Director of Research (Agriculture)2Professor of Soil Conservation, Department of Soil Science, Punjab Agricultural University, Ludhiana,141 004, Punjab

28 Bulletin of the Indian Society of Soil Science, No. 29
HISTORICAL PERSPECTIVE OF GROUNDWATER
Historically, Punjab’s groundwater has been influenced by topography and multipurposeriver-valley projects, including the extensive canal network. Each aspect is discussed be-low.
Topography
Punjab is situated between 29’30" N to 32’32" N latitude and 73’55" E to 76’50" Elongitude. Most of the Punjab is a flood plain, i.e. adjacent to a river or other body ofwater. A belt of undulating hills extends along the northeast near the foothills of theHimalayas and three rivers, the Ravi, the Beas and the Sutlej, currently flow across thestate in the southwesterly direction. The topography is gentle, with an average slope/water-flow gradient of 0.3 m km-1. The annual rainfall in the state varies from 1100 mm in thenortheast to 300 mm in the southwest, across a distance of just 350 km. The salt concen-tration in the groundwater is low in the northeast and increases towards the southwestdirection. Because of relatively high rainfall, fresh groundwater reserves exist in flood-plain areas all along the foothills of the Himalayas. The depth of the fresh-water layerdecreases in the southwest direction. Deep groundwater in the southwest is saline, exceptalong the perennial flow channels. About 40% area of the state, mainly in the southwest,has saline groundwater.
The state of Punjab can broadly be divided into three regions (Fig. 1): Foot-hillregion with an average annual rainfall of 950 mm and undulating land, often subjected towater erosion and deep but good quality groundwater; Central region with flood plainsand an average annual rainfall of 650 mm and good quality groundwater covering 50%area of the state; and Southwest region accounting for 37% area of the state with anaverage annual rainfall of 400 mm and saline groundwater.
Multipurpose River-Valley Projects
The first headwork was constructed at Madhopur in 1859, along with the Upper BariDoab Canal network. The Ropar headworks on the river Sutlej was completed in 1873,along with the Sirhind canal and the Bist Doab canal network. The Haussainewallaheadworks (near Ferozepur) on the Sutlej was completed in 1927, along with the Easterncanal and the Bikaner canals. The Harike headworks (where river Beas joins Sutlej) wasconstructed in 1952, along with Rajasthan and Sirhind feeders. The Nangal headworks onriver Sutlej became operational in 1954, along with Bhakra Main canal and Hydel channel.The Talwara headworks on river Beas was completed in 1962, along with Shahpur Kandicanal (Fig. 1).
Canal Network and Groundwater Status
Before the inception of the mighty canal network, groundwater table (GWT) in thePunjab was very deep, except along the riverbeds. The GWT depth ranged from 30.3 malong the foothill zone to 51.5 m towards the southwestern end (Hira et al. 1998). Afterthe construction of the canal network, GWT started rising. Initially, the GWT rise was

Efficient Water Management for Sustainable Agriculture 29
slow but became rapid after the completion of additional canals. With the continuous riseof GWT, the problem of waterogging appeared in many parts of Punjab. The waterloggingfirst occurred in the foothill plains along the Upper Bari Doab canal in the early 20th
century. Subsequently, it spread to central Punjab. By 1964, about 23% of Punjab waswaterlogged. Most of the affected area fell into the central zone (Uppal 1966). Just beforethe arrival of the Green Revolution, GWT in most parts of Punjab was within 4.54 m fromthe surface, except in the southwestern zone (Fig. 2).
The groundwaters were recharged by the seepage of water from the canal network.This increased the good quality (fresh) ground-water reserves near the soil surface. Mostof the Punjab farmers had small land holdings. Shallow groundwaters were exploited byevery farmer for irrigation using centrifugal pump type tubewells. The arrangement wasvery efficient and cheap and was thus within the reach of the common farmer. Today,Punjab (5 Mha geographical area) has 1.38 million tubewells.
Continuous waterlogging prevailing in large parts of the Punjab in the mid-20thcentury resulted in a buildup of a high concentration of soluble salts in the surface soil(Uppal 1966). The salt-affected area in Punjab was 30,000 ha in 1950, 180,000 ha in 1955,350,000 ha in 1960 and 680,000 ha in 1965. Cultivation of rice was taken up initially inhigh-rainfall and waterlogged areas. Furthermore, as rice crop was the best agent for thereclamation of salt-affected soils (Singh et al. 1981), its cultivation rapidly spread acrosscentral Punjab during the Green Revolution era (Hira and Sidhu 1998). Presently, the ricecrop in Punjab is cultivated on 85% area of the central zone. The canal irrigation thus laid
Fig. 1. Agroclimatic regions, headworks and canal networks in Punjab

30 Bulletin of the Indian Society of Soil Science, No. 29
a strong foundation for blossonsing of the Green Revolution in this region of the world(Hira 1998).
In the early 1960s, high-yielding Mexican wheat varieties and later high-yielding ricevarieties from IRRI were introduced. The tube well irrigation, both diesel and electric,spread rapidly during this period. There were 0.98 lakh tubewells in Punjab in 1960-61.This number increased to 13.8 lakh in 2010-11. The cropped area irrigated was 54% in1960-61, which increased to 98% in 2010-11. Because of an increase in tube well irriga-tion, there was large-scale land leveling and a shift in cropping pattern. From 1960-61 to2010-11, the area under wheat increased from 37% to 83% and rice area increased from6% to 67%, at the expense of other crops. For example, the area under gram cultivationdecreased from 22% to 0.4% and under pulses from 24% to 1.3%. As a consequence of theaforementioned changes during the 30 years (1970-71 to 2010-11), the production ofwheat increased from 5.1 Mt to 16.5 Mt and of rice from 0.7 Mt to 10.8 Mt.
STATUS OF GROUNDWATER
A negative aspect of the Green Revolution vis-à-vis food security of India was disturbancein the groundwater balance of Punjab. The groundwater table has declined to dangerously
Fig. 2. Groundwater table depth in undivided Punjab during October 1964 (Uppal 1966).

Efficient Water Management for Sustainable Agriculture 31
low levels in many areas of Punjab, which, if not reversed, could turn Punjab into a barrenland sooner than later. The deficit of 1.2 million ha-m-1 yr-1 in water availability is beingmet by overexploiting the groundwater resource of Punjab.
The depletion of ground water has been drastic over the last couple of decades withthe groundwater table falling in all blocks of the state except a few blocks in the south-western part. On an average, the water table fall increased from 18 cm yr-1 in 1982-87 to74 cm yr-1 in 2004-05 (Fig. 3). The highest water-table fall occurred in the central Punjab(Hira 2005), where mean annual water-table fall ranged from 0.3-1.0 m. In some of theareas, the water-table fall was more than 1.0 m. By 2011, the water table had sunk todepths ranging between 24.3 and 34.7 m in the districts of Barnala (33.8 m), Sangrur (31.8m), Moga (28.0 m), Patiala (36.0 m), Fategarh Sahib (33.6 m), Jalandhar (32.6 m), Ludhiana(33.4 m), Kapurthala (29.4 m) and Amritsar (24.3 m).
At the present rate of fall in groundwater in central Punjab, the energy cost ofpumping groundwater from a depth of 42.5 m would increase by 93% in 2023 comparedwith that in 2006. During 2007, Punjab State Electricity Board (PSEB) supplied 7500million units of electricity (28% of total consumption of Punjab) to tube wells. Accord-ingly, by 2023, the PSEB will have to supply 14.5 billion units annually for pumpinggroundwater required for irrigation. For rice cultivation alone, electricity worth Rs. 14.4billion is supplied free of cost.
The Punjab farmers incur a huge cost every year for tube well irrigation. For cen-trifugal pumps, the cost involved relates to deepening/widening of tube well pit; purchase/repurchase of electric motor, pump, starter, cable, capacitor, voltage stabilizer, etc. Othercosts involved are the purchase of diesel generator sets, diesel, and installation of newsubmersible pumps to replace old centrifugal pumps for irrigation/hand pumps. It has beenestimated that the total annual expenditure on tube well infrastructure, both for irrigationand domestic purposes by Punjab farmers is about Rs 15 billion. During the same period,
-80
-60
-40
-20
01982-87 1987-92 1992-97 1997-01 2003-04 2004-05
Fall
in w
ater
tabl
e
42
2532
69
18
74
Fig. 3. Fall in water table over the years in Central Punjab

32 Bulletin of the Indian Society of Soil Science, No. 29
Punjab farmers’ indebtedness increased four-fold from Rs 57 billion to Rs 240 billion(Fig. 4). A large number of farmers have been reportedly committed suicide in the Sangrurdistrict, which has experienced the highest fall in water table during the last four decades.
The salt concentration in the groundwater of Punjab increases from the northeasternto the southwestern end. About 40% area of the state in the southwest part has salinegroundwater. By 2023, the groundwater table is expected to sink to a depth of 41.2 m inLudhiana, 44.5 m in Jalandhar, 46.7 m in Sangrur, 51.8 m in Moga, and 57.3 m in Patialadistricts in the central zone of Punjab where water is of good quality. Both Sangrur andMoga districts are very close to the southwest zone where ground waters are highly saline.In these districts, groundwater quality will deteriorate because of a reverse flow mecha-nism, which means the saline groundwater of the southwest part will flow in the directionof southwest to northeast (opposite of the natural flow direction) (Table 1). The land slopeis in the direction of northeast to southwest and the groundwater flow also flows in thesame direction. For the past many centuries, groundwater has been flowing from thenortheast to the southwest direction, with a gradient of 0.3 m km-1. Once the “reverse flowmechanism” starts, it will deteriorate groundwater quality of the central zone of Punjab,which can have disastrous consequences.
Table 1. Changes in groundwater quality with depth and time in Nihalsinghwala block of Moga districtof Punjab
Year Depth of Percent samplestubewell (m) Fit Marginal Unfit
1997 41 51 38 112004 71 28 43 29
Reasons for the Fall of the Water Table
The rise and fall of the groundwater table in any region depends upon the balancebetween the amount of withdrawal of groundwater and that of water recharged throughseepage. The net negative water balance in Punjab is for the following reasons:
(1) Early Transplantation of Rice
In the 1970s, rice transplanting used to start from June 30 after the onset of monsoonrains. The first fortnight of July was the recommended time for rice transplantation (Anony-mous 1985). Of late, the transplantation date had moved to May. This leads to hugeamount of evaporation losses and Hira (1996) reported that the evapotranspiration of ricetransplanted on May 20 was 76 cm, on June 10 was 60 cm, and on June 30 was 52 cm.
The mean relative humidity during the period of June 10 - July 10, measured inLudhiana from 1970-2005, increased from 58% in 1970 to 68% in 2013. During the sameperiod, the groundwater table showed an average fall in water table from 3 m to 12 m.Studies conducted by Hira (1996) and Hira and Khera (2000) have shown that no reduc-

Efficient Water Management for Sustainable Agriculture 33
tion in rice yield would occur even if rice were transplanted from the end of June onwards.The early transplanting should have been prohibited by law because a farmer who trans-plants his crop early is essentially committing a crime by reducing the yields of thefarmers who transplant their crop during the recommended time. Accordingly the stategovernment passed Preservation of Subsoil Water Act in 2008 whereby the transplantingof rice crop is prohibited before June 10.
(2) Ploughing of Water Courses and Less Availability of Canal Waters
The farmers in the central zone of Punjab have ploughed most of the canal watercourses. The canal irrigation in the central zone is applied to only 14% area and is muchless as compared with the southwest part (70%). This has led to lower recharge of ground-water in the central Punjab.
(3) Changes in Cropping Pattern
The assured tube well irrigation led to the replacement of low evapotranspiration(ET) crops with high ET crops (Hira 2005). Rice (ET 60 cm) replaced cotton (ET 54 cm),maize (ET 46 cm) and pulses (ET 40 cm), whereas wheat (ET 40 cm) replaced gram (ET30 cm) and oilseed crops (ET 32 cm). The total water demand is 37% for rice, 32% forwheat, 14.3% for other crops, and 13.3% for fodder, vegetables and forests (Hira et al.2005). Rice is cultivated on 60% area of Punjab during the kharif season, whereas incentral Punjab it occupies an area of 85% during this season.
Fig. 4. Relationship between farmers’ indebtedness and the water-table fall in the centraldistricts of Punjab
784
5700
9886
21064
24000
0
2
4
6
8
10
12
1992 1997 2003 2006 2007
Year
Wat
er ta
ble
fall,
met
er
0
5000
10000
15000
20000
25000
30000
Inde
bted
ness
, Rs.
Cro
re
Water table fallIndebtedness

34 Bulletin of the Indian Society of Soil Science, No. 29
(4) Early and Regular Supply of Electric Power for Tubewells
Sixty per cent of the annual electricity is supplied to tubewells for rice cultivationduring the months of June, July, August and September. Rice, which was never a tradi-tional crop of this area, is the main culprit for the fall of water table. Large-scale ricecultivation and its early transplanting into dry hot summer months (May and June) waspossible only because of early regular supply of subsidized power to tube wells. It isimportant to mention that 47% of total annual pan evaporation occurs during the dry hotsummer months of April, May and June (Hira 1996). Because of dry hot conditions duringthe summer months, most of diseases, insects and pests remain under control, but frequentirrigation encourages their spread. The problem of water management in Punjab has seri-ous repercussions for the future of farming, agricultural production, state economy andfood security of India.
(5) High Runoff from Urban Areas
Most of the rainwater in urban areas goes as runoff into the drainage system andultimately joins the rivers and oceans. The critical example of this is shown for Ludhianacity (Fig. 5). The Ludhiana city, though situated on the banks of Sutlej River, the depth ofwater table is highest (100 ft). All the adjoining blocks have higher water table depths,which indicate that the ground water is falling at much higher rate in Ludhiana city thanthe adjoining areas. The figure also indicates that ground water from adjoining rural areasis flowing towards the Ludhiana city because of fast depleting water table in the city areas.In general, due to concrete jungles prevailing in all the urban areas, the runoff rates from
Fig. 5. Ground water depletion under urban and non-urban blocks of Ludhiana district

Efficient Water Management for Sustainable Agriculture 35
these regions amount to even 100% of the rainfall, which otherwise could have joined thewater table.
MANAGING DEPLETING WATER TABLES
The falling water tables in Punjab can be arrested by (1) decreasing the withdrawal and (2)increasing the recharge of groundwater.
(1) Decreasing Ground Water Withdrawal
(a) Optimum time of rice transplanting: During 2006 and 2007, a mass campaign toeducate farmers was begun to delay rice transplanting to June 10 or later and to appeal toPSEB to provide 8 hour of regular supply of electricity to tubewells from this date on-wards. This resulted in 18 cm yr-1 arrest of the water table fall (WTF) in the central zone ofPunjab during 2005-07, as compared to the previous years (2003-05). This WTF is veryclose to the earlier predictions (Hira 1994, 1996) i.e. 16.4 cm yr-1. WTF can be arrested bydelaying rice transplantation to June 10.
Based on the actual WTF data of 2003-07, future projections of WTF were madeusing ET data of rice transplanted on June 15, 20, 25 and 30 (Hira 1996). It was found thatthe present WTF of 64 cm yr-1 could be reduced to 51, 39, 29 and 20 cm yr-1 by shiftingrice transplanting to June 15, 20, 25 and 30, respectively.
During 1998-2005, the rice transplantation was done before June 10 in Punjab. In98.5% area, water table in the state was falling, whereas in just 1.5% area there was a risein water table (Table 2). After taking up the mass campaign with the farmers during 2006onwards and supplying of electricity to the tubewells from June 10 onwards for 8 hoursper day, the farmers started delaying the rice transplantation. In 2008, an Ordinance wasalso issued in this direction. Later Punjab Preservation of Sub-Soil Water Act was passedin 2009. The falling water table area was thus reduced from 98.5% (1998-2005) to 75.2%(2005-11). Correspondingly the rising water table area increased from 1.5 to 24.8% in thestate.
Table 2. Effect of delaying rice transplantation to June 10 on water table depth
Water table Number of blocks after delaying rice transplantationfall/rise(m yr-1) 1998-2005 (Before June 10) 2005-11(After June 10)Fall > 0.3 104 (77.6%) 58 (42.4%)Fall = 0-0.3 28 (20.9%) 45 (32.8%)Total fall 132 (98.5%) 103 (75.2%)Rise = 0-0.3 2 (1.5%) 32 (23.4%)Rise > 0.3 0 (20.9%) 2 (1.5%)Total rise 2 (1.5%) 34 (24.8%)
It can thus be said with certainty that further delaying the rice transplanting date fromJune 10 to June 20 will decrease the falling water table area from 75.2% to 47.4% in thestate, whereas in rest of the area (52.6%), the water table is expected to rise. The decrease

36 Bulletin of the Indian Society of Soil Science, No. 29
in water table fall is expected to be more pronounced in the districts where annual fall inwater table is < 25 cm. If transplanting in these districts is started from 20th June onwards,the ground water table will start rising in the districts of Gurdaspur, Hoshiarpur, Ropar,Mohali, Muktsar, Ferozpur, Faridkot, Amritsar, Tarantaran and Jalandhar. The districtswith annual water table fall > 25 cm (Barnala, Sangrur, Patiala, Moga, Fatehgarh Sahib,Nawanshahar, Kapurthala, Ludhiana, Mansa and Bathinda) will still experience fallingwater table but with lesser severity.
Will it be possible to shift the time of rice transplanting to June 20 without affectingthe sowing time of wheat and its yield? The answer is an emphatic yes. The reasons areexplained below:
First, we need to develop high yielding and short duration cultivars of rice andsecond, large-scale successful demonstrations on farmers’ fields with Happy Seeder ma-chines need to be conducted. It has been found that wheat can be sown from October 16 toNovember 6 with Happy Seeder machine immediately after the combine-harvested paddycrop. The delay in rice transplanting to June 30 will not only help in arresting the fall ofthe water table but will also allow for an additional crop of summer moong after wheatharvest in areas of rising water tables. This, however, should be done with minimal use ofirrigation water, which is possible by mulching of the summer moong crop with wheatstraw followed by wheat sown with ‘Happy Seeder’ machine after rice harvest.
(b) Crop diversification: Delaying rice transplanting to June 30 will help in cropdiversification. Some areas under rice could be shifted to other crops, such as cotton,maize, and sorghum for fodder, etc. as sowing of these crops is done much earlier thanJune 30. In this way, the free time of the farmers after the wheat harvest could be used forthe sowing of other crops. Shifting some areas from rice (ET 60 cm) to cotton (ET 54 cm),maize (ET 46 cm) and sorghum for fodder (ET 45 cm) would reduce groundwater with-drawal and help in arresting the water table fall.
(c) Efficient use of irrigation water: The efficiency of irrigation water can be in-creased by using water-saving technologies, such as (i) optimum irrigation scheduling, (ii)laser land leveler, (iii) proper irrigation method, and (iv) mulching.
Scheduling irrigation to rice on the basis of soilmatric potential (which can be measured by simplefarmer-friendly tensiometer developed by PAU as shownin the plate) can save 25% irrigation water (Kukal et al.2005) without any reduction in yield of rice. Similarly,laser land leveler can save 25% of irrigation water inrice (Sidhu et al. 2007).
In cotton, broad-bed with spacing of 135 cm andplanting cotton in furrows in paired rows increased cot-ton yield by 44% and saved 40% irrigation water, ascompared with row spacing of 76.5 cm in flat/bed sys-tem (A.S. Sidhu, Personal Communication).

Efficient Water Management for Sustainable Agriculture 37
Planting of potato on both sides of narrow beds increased tuber yield (24 t ha-1) by25% and saved 20% irrigation water, as compared with the ridge-planting method (20 t ha-1)(Thind et al. 2007).
Mulching of chillies with paddy straw increased yield (17.2 t ha-1) by 15% and saved25% irrigation water, as compared with no mulching (14.8%) (Sekhon et al. 2008).
These water-saving technologies will certainly reduce the energy requirement forpumping groundwater and may not help much in arresting the falling water table(Humphreys et al. 2010).
(2) Increase Recharge of Groundwater
There is a great need to increase the recharge of groundwater in the central Punjab.Though the area of central Punjab is only 50%, it produces two-thirds of rice and wheat ofthe state and two-thirds of tubewells are located in this zone. The canal irrigation water isapplied to 14% area only and it should be increased to enhance the recharge of groundwa-ter in this water-thirsty zone. During monsoon season, all along the Himalayas, the foot-hills and flood plain area receive high rainfall and this can be used for enhancing rechargeof groundwater. There is a great scope for increasing the recharge of groundwater inPunjab by adopting the following measures:
(a) Increase the canal water supply and revive the old canal watercourses in theCentral Punjab: The major fall in the water table is in the central part of Punjab especiallyin the Malwa districts (Barnala, Sangrur, Patiala, Fatehgarh Sahib, Ludhiana, Mansa andBathinda). This region is primarily irrigated through Sirhind and partly by Bhakhra maincanals (Fatehgarh Sahib and Patiala). The Sirhind canal originates from Ropar headworkson Sutlej river. The Sirhind canal should be remodeled to enhance the canal water supplyto this water deficit region of Punjab. It is this region, the canal irrigation is insufficientand the farmers have ploughed the canal watercourses. An increase in canal water supplyand the revival of old canal watercourses in these areas will enhance the recharge ofgroundwater and thus help in arresting the falling water table.
(b) Construction of new Headworks on river sutlej: During July, August and Septem-ber, a large amount of water is released downstream of Haussainewala headworks. It hasbeen estimated that 0.1 to 1.0 M ha-m water per year is going to Pakistan during themonsoon season (Hira 1998). The headworks on Sutlej may be constructed betweenLudhiana and Ropar to create a large reservoir (series of lakes network) to store thefloodwater during the monsoon. The lake water could be diverted to rice fields throughexisting Sirhind canal networks and Bist Doab canal or drainage networks. The maximumfall in water table is occurring in Sirhind canal network areas. A larger drainage networkexists in the central Punjab. These drains were dug during the 1950s in waterlogged areasto drain the floodwater during the rainy season. Even if we harness 30% of the floodwater,it would increase groundwater table by 22 cm yr-1 in the central districts of Punjab. This isthe only way to store the floodwater and divert it to saturate the water-thirsty areas ofSangrur, Barnala, Moga, Ludhiana, Jalandhar, etc. The construction of new headworks onSutlej and establishment of a new city should be considered to be a multi-utility project

38 Bulletin of the Indian Society of Soil Science, No. 29
because a substantial decrease in river water flow has been observed during the last fewdecades. Possibly, this is the only way to increase canal water supply in the water-thirstycentral zone, i.e., Sirhind and Bist Doab canal command areas.
(c) Foothills : Areas along the lower Shiwalik hills of the Himalayas (Kandi area)receive about 100 cm rainfall (Hira 1998). There is a great scope for the recharge ofgroundwater from these areas. Rainwater, once it percolates into the soil, joins the ground-water and moves laterally towards the central zone. It has been estimated that 40% ofrainwater is lost as run-off in the Kandi areas. Run-off losses from this area can bereduced by adoption of in-situ soil-conservation measures and the construction of checkdams.
(d) Areas with restricted layer: Large areas in districts of Patiala and Fategarh Sahibhave a thick restricted layer below the soil surface. It does not allow the rainwater topercolate and join groundwater. Surface flow of floodwater is common in these areasduring the monsoon season. Dug wells could be made in these areas to divert the floodwa-ter from agricultural fields. However, care must be taken that this practice is adopted onlyfor the monsoon season. At times, farmers resort to such drainage from irrigated wheatfields that contain a lot of nitrate nitrogen in the winters. Flooding in wheat can be avoidedby sowing the crop using the bed-planting method (Kukal et al. 2008).
(e) Rainwater harvesting in cities: Rainwater harvesting projects should be imple-mented in cities, especially in high rainfall areas. Three-tier strategies could be adopted.First, areas along the roadside and parking lots can be put under grass-paver tiles. Com-mon grass can be planted in holes and it will allow the rainwater to percolate rapidly intothe soil. This will help in reducing the sewage water load and avoiding the floodedconditions on the city roads during monsoon rains. Second, adoption of rooftop and roadside rainwater-harvesting technology can be made mandatory in urban areas. Third, therain/runoff water from roadsides and other spaces should be diverted to grassed parks. Thelevel of such parks should be kept much lower than that of the roads.
(f) Renovation of village ponds: In central Punjab, before the Green Revolution,village ponds used to be a source of drinking water for animals. These ponds are nowmalodorous but contain many nutrients (Hira et al. 2001). It has been estimated that oneirrigation from village-pond water (7.5 cm) adds 17.2 kg N, 1.7 kg P and 75.3 kgK ha-1. These ponds also have a 4-5 foot thick layer of sediments, which are a rich sourceof nutrients and organic matter. Renovation of ponds, including diversion of the sedimentand water to agricultural lands, will be a good source of nutrients and will result in anincrease in the recharge of groundwater.
EPILOGUE
There is certainty that the water table in 2/3rd area of Punjab will rise if rice trans-planting is further delayed to 30th June. To arrest water table in rest of the area, the runoffin the urban areas needs to be decreased through rainwater harvesting/GW recharge. Theexcess rain water during the rainy season could be diverted to rice fields. To save uponenergy, the irrigation water saving techniques need to be adopted. The falling water table

Efficient Water Management for Sustainable Agriculture 39
cannot be arrested in some of the Malwa districts unless the canal water supply is in-creased to this region.
REFERENCES
Anonymous (1985) Package of Practices for Kharif Crops of Punjab. Punjab Agricultural Univer-sity, Ludhiana.
Hira, G.S., and Khera, K.L. (2000) Water resource management in Punjab under rice-wheat produc-tion system. Research Bulletin No. 2/2000. Department of Soils, Punjab Agricultural Univer-sity, Ludhiana.
Hira, G.S. (1996) Evaporation of rice and falling water table in Punjab. In Proceedings of Interna-tional Conference on Evapotranspiration and Irrigation Scheduling, USA, (C.R. Camp, E.J.Sadler and R.E. Yoder, Eds.). pp. 579-584.
Hira, G.S. (1998) Water management for crop production and ground water table in Punjab. InProceedings of International Conference on Ecological Agriculture: Towards SustainableDevelopment held at Chandigarh (G.S. Dhaliwal, N.S. Randhawa, R. Arora and A.K. Dhawan,Eds.) Vol. 1 pp. 240-251, Chandigarh.
Hira, G.S. (2005) Depleting ground water, causes and remedial measures in Punjab. Theme Paper,Seminar on Management and Conservation of Irrigation Water. Presented in Mohali on 27April 2005.
Hira, G.S. and Sidhu, A.S. (1998) Development of paddy cultivation in Punjab – Water table, soiland environmental effects. In Proceedings of the International Symposium on Lowland Tech-nology/Saga University, Japan, pp. 395-404.
Hira G.S., Sidhu, A.S. and Thind, S.S. (2001) Traditional soil nutrient management techniquespracticed in Punjab. In Indigenous Nutrient Management Practices – Wisdom Alive in India.(C.L. Acharya, P.K. Ghosh and A. Subba Rao, Eds.) pp. 13-30, Indian Institute of SoilScience, Nabibagh, Bhopal.
Kukal, S.S., Hira, G.S. and Sidhu, A.S. (2005) Soil matric potential-based irrigation scheduling torice (Oryza sativa). Irrigation Science 23, 153-159.
Kukal, S.S., Humphreys, E., Yadvinder-Singh, Balwinder-Singh, Sudhir-Yadav, Amanpreet-Kaur,Sudhir-Thaman, Timsina, J., Dhillon, S.S., Brar, N.K., Prashar, A. and Smith, D.J. (2008)Permanent beds for rice-wheat in Punjab, India. Part 1: crop performance. In Permanent Bedsand Rice-residue Management for Rice-wheat Systems in Indo-Gangetic Plains (E. Humphreysand C.H. Roth, Eds.). ACIAR Proceedings No. 127. PAU Ludhiana from 7-9 September 2006.
Sekhon, N.K., Singh, C.B., Sidhu, A.S., Thind, S.S., Hira, G.S. and Khurana, D.S. (2008) Effect ofstraw mulching, irrigation and fertilizer N levels on soil hydrothermal regime, water use andyield of hybrid chilli. Archives of Agronomy and Soil Science 54, 163-174.
Sidhu, H.S., Manpreet-Singh, Humphreys, E., Yadvinder-Singh, Balwinder-Singh, Dhillon, S.S.,Blackwell, J., Bector, V., Malkeet-Singh and Sarbjeet-Singh (2007) The Happy Seeder en-ables direct drilling of wheat into rice stubble. Australian Journal of Experimental Agriculture47, 844-854.
40 Bulletin of the Indian Society of Soil Science, No. 29
Singh, N.T., Hira, G.S. and Bajwa, M.S. (1981) Use of amendments in reclamation of alkali soils inIndia. Agrokemia ES Talajtan Tom. 30 (Supplementum), 158-177.
Thind, S.S., Sidhu, A.S., Sekhon, N.K., Singh, C.B., Tarinder-Kaur and Amanpreet-Kaur. (2007)Effect of different irrigation geometry on water and nutrient use efficiency of potato-sun-flower sequence. Proceedings of Environmental and Livelihood Security through ResourceManagement in Northern India (ELSTRM 2007).
Uppal, H.L. (1966) Reclamation of saline and alkali soils. International Commission on Irrigationand Drainage. 6th Congress 1, 381-440.

Bulletin of the Indian Society of Soil Science, No. 29. pp 41-57 (2014)
Status and Management of Water inRainfed Agriculture
Pradeep K. Sharma1 and Munish Kumar2
Rainfed agriculture is the future hope of food and nutritional security globally and atnational level. There are two reasons for it. One, large potential exists to meet present andfuture food demand through increased productivity, as a large gap exists between poten-tial and actually achieved rainfed crop yields, and there is a scope to narrow it downthrough proper water and soil management. Studies have shown that there is a 100% yieldincrease potential in rainfed agriculture in developing countries compared to only 10%increase potential in irrigated agriculture (Pretty and Hine 2001). However, productivityimprovement and expansion in rainfed agriculture in developing countries have remainedrather slow compared to irrigated agriculture (Rosegrant et al. 2002). Two, larger chunkof cultivated area is still rainfed, while irrigated areas have started showing fatigue interms of crop productivity. The most recent estimates put global rainfed croplands at1.75 billion ha at the end of the last millennium, which are about 5.5 times the irrigatedareas of the world (GIAM 2006). India ranks first among the rainfed agricultural coun-tries of the world in terms of both extent (86 Mha) and value of produce. Water is thekey constraint in rainfed areas. There are, however, several rainfed regions where over-allrainfall is sufficient to meet crop demands, but problem is about its erratic temporaldistribution. If properly harvested and utilized, crop productivity can be easily doubled.Livestock plays vital role in sustaining the livelihoods of poor in rainfed areas as theyabsorb shocks due to droughts; this sector also engages about 5% of the total workingpopulation in India. In order to maximize water productivity, it is imperative to follow aholistic approach, integrating crop production with horticulture, livestock and fisheries ina balanced way. Better soil and land management practices and adding a component ofirrigation water through smaller scale interventions such as rainwater harvesting canincrease water productivity.
STATUS OF WATER RESOURCES IN INDIA
India shares the responsibility of feeding 17% of world’s human and 14% of thelivestock population on 4% of the water resources and 2.4% of the land. It occupies 329
1Vice Chancellor, Sher-e-Kashmir University of Agricultural Sciences and Technology, Jammu2Associate Professor (SCWM), Chandra Shekhar Azad University of Agriculture & Technology, Kanpur

42 Bulletin of the Indian Society of Soil Science, No. 29
Mha geographical area, of which 141 Mha is under cultivation. The total utilizable waterresources of the country are assessed at 1086 km3.
India receives a total of about 4000 km3 precipitation annually. Out of this, monsoonrainfall is of the order of 3000 km3. Most of the rains in India are received from south-west monsoon (Table 1). The distribution of rainwater availability as per rainfall zones isgiven in Table 2.
Table 1. The seasonal distribution of rains in India
Season Months Quantum of rainfall (%)
Pre-Monsoon March-May 10.4South West Monsoon June - September 73.4South West Monsoon October- December 13.3Winter rains January- February 2.9Source: IMD
Table 2. Distribution of rainwater availability in India
Rainfall Geographical Rainwater available Net sown area Rain water used/zone area (Mha) (Mha-m) (Mha) received(mm) (Mha-m) (%)
100 - 500 52.07 15.62 29 8.70 5.46500 - 750 40.26 25.16 22 13.75 8.63750 - 1000 65.86 57.63 24 29.75 18.671000-2500 137.24 205.86 44 66.00 41.42>2500 82.57 95.73 14 41.15 25.82
The basin-wise average annual flow in Indian river systems, as estimated by theNational Commission for Integrated Water Resources Development, is 1953 km3. Theutilizable annual surface water of the country is 690 km3.
The annual groundwater recharge from precipitation in India is about 342.43 km3,which is 8.6% of total annual precipitation of the country. The annual potential ground-water recharge augmentation from canal irrigation system is about 89.46 km3. Thus, totalreplenishable groundwater resource of the country has been estimated to be 431.89 km3.After allotting 15% of this quantity for drinking, and 6 km3 for industrial purposes, theremaining can be utilized for irrigation purposes. Thus, the available groundwater re-source for irrigation is 361 km3, of which utilizable quantity (90%) is 325 km3.
Based on groundwater utilization, the districts are categorized into safe, semi-criti-cal, critical and over-exploited by Central Ground Water Board (CGWB). Major parts ofEastern India, Central India, Northern Parts of Andhra Pradesh are safe in terms ofexploitation of groundwater. Most parts of Punjab, Haryana, Rajasthan, Southern AndhraPradesh, and parts of Tamil Nadu are considered as over-exploited. Many districts underIndo-Gangetic Plains where the recharge is mainly through canal supplies are also over-exploited indicating the need for immediate remedial measures in terms of change incropping pattern.

Efficient Water Management for Sustainable Agriculture 43
WHY FOCUS ON RAINFED AGRICULTURE?Rainfed agriculture is practiced in 80% of the world’s physical agricultural area and
generates 62% of the world’s staple food (FAOSTAT 2005). Addressing malnourishmentand poverty requires a new green revolution (Conway 1997) in small-scale rainfed agri-culture in arid, semiarid, and dry sub-humid regions of the world (Falkenmark andRockström 2004). India would require an estimated food grain production of about 280Mt by 2020. As estimated by the Technical Committee on Watershed Development(2006), even in the best possible scenario of irrigation development, about 40% of theadditional supply of food grains needed to match future rise in demand will have to comefrom the rainfed agriculture. A breakthrough in rainfed agriculture, therefore, is an im-perative for poverty alleviation, livelihood promotion and food security in India.
The strategic reasons why rainfed agriculture should gain attention are:
1. Since the prospects for continued expansion of output from the irrigated areas arelimited, the logical option for improved food security is to turn to rainfed agriculture.
2. The land use pattern is changing. Rapid industrialization and urbanization are imping-ing on fertile agricultural lands, and mainly on irrigated areas. The answer to im-proved agricultural output and food security is again to focus on rainfed agriculture.
3. Rainfed areas support very fragile and extremely useful ecosystems. With the grow-ing demand for agricultural land, the pressure on rainfed areas has begun to increase.It has become essential that these fragile areas be managed in a sustainable manner.
4. Even after achieving the full irrigation potential, nearly 50% of the net cultivated areawill remain dependent on rainfall.
5. The last four decades of Indian agriculture which registered overall impressive gainsin food production, food security and rural poverty reduction in better endowed‘Green Revolution’ regions, bypassed the less-favoured rainfed areas which were notthe partners in this process of agricultural transformation. They deserve due attentionnow.
6. Rainfed areas support the poorest of the poor and are home to many indigenousethnic minorities who themselves are generally poor. The focus on rainfed areas is animportant strategy to support resource-poor farming communities and help in alleviat-ing the poverty.
In irrigated areas, on the other hand, the following factors, both alone or in differentcombinations, have contributed and may continue to affect the availability of good-qualityirrigation water in different regions of the world:
• Vertical expansion of irrigated agriculture i.e. increased cropping intensities on al-ready cultivated lands consuming more water per unit area cultivated
• Horizontal expansion of irrigated agriculture i.e. cultivation of crops on new landsrequiring additional amount of water
• Increased industrial and domestic use of good-quality water as a result of an increasein population coupled with higher living standards

44 Bulletin of the Indian Society of Soil Science, No. 29
• Contamination of surface and groundwater resources by a variety of point and non-point pollution sources
• Despite limited supply of freshwater, considerable amounts of water are lost throughmechanisms such as evaporation from soil surface during conveyance and irrigation;leakage during storage and transport to the fields; runoff; and uncontrolled drainage.
RAINFED AGRICULTURE IN INDIA
Rainfed areas currently constitute 55% of the net sown area of the country, and arehome to two-thirds of livestock and 40% of human population (NRAA 2012). These areasare vulnerable to drought conditions; about 50% of such vulnerable area is classified as‘severe’, where frequency of drought is almost regular.
Rainfed area is defined primarily on the basis of rainfall variability within the rangeof 400 to 1000 mm of rainfall. In majority of states, except for few districts in coastalareas of Andhra Pradesh, Tamil Nadu and Indo-Gangetic Plains, rainfed area is more than70%, covering both, dry and moist semi-arid and moist sub-humid climates. RecentlyNRAA (2012) developed a composite index called ‘Rainfed Areas Prioritization Index’(RAPI), based on ‘Natural Resource Index’ (NRI) and ‘Integrated Livelihoods Index’(ILI), for prioritizing rainfed areas for taking up crop and livestock-based interventions.Based on RAPI score, 167 among 499 districts in the country have been identified as theprioritized districts. Among the prioritized 167 districts, 50 deserve immediate attentionfor enhancing productivity and livelihood as resource-wise they are rich but the produc-tivity and livelihood status are poor.
Rainfed areas are highly diverse, ranging from resource-rich areas with good agri-cultural potential to resource-poor areas with much more constrained potential. Rainfedagriculture is practiced under a wide variety of soil types, agro-climatic and rainfallconditions. The distribution of rainfed areas can be broadly classified into arid, semi-arid,dry-sub humid and humid regions. As per available estimates, 15 Mha of rainfed crop arealies in the arid region which receives less than 500 mm annual rainfall, another 15 Mha isin 500-750 mm annual rainfall zone, and 42 Mha is in the 750-1100 mm rainfall zone. Theremaining area lies in annual rainfall zone of greater than 1100 mm. Out of the 127 AgroClimatic Zones (ACZs) in India defined by ICAR in 1979 under the National AgriculturalResearch Project (NARP), 73 are predominantly rainfed. Due to low opportunities andhigher population of landless households and agricultural labourers as well as low land andlabour productivity, poverty is concentrated in rainfed regions (Table 3).
Table 3. Comparison of important characteristics of predominantly rainfed and irrigated regions of India
Parameters Rainfed regions Irrigated regions All regions
Poverty ratio, head count (%) 37 33 35Land productivity (INR ha-1) 5716 8017 6867Labor productivity (INR ha-1) 6842 9830 8336Per capita consumption of food grains (kg year-1) 260 471 365Infrastructure development index 0.30 0.40 0.35Social development index 0.43 0.44 0.43Source: Singh (2001)

Efficient Water Management for Sustainable Agriculture 45
The crop productivity of rainfed crops is one of the lowest (< 1 t ha-1) in India.Rainfed agriculture accounts for 60% of total cropped area, 48% of the area under foodcrops and 68% of that under non-food crops. In terms of crop groups, 77% of pulses,66% of oilseeds and 45% of cereals are grown under rainfed conditions (Table 4). Asrainfed production is spread over different climatic regions, it offers great scope forraising a number of diversified crops. Rosegrant et al. (2002) using IMPACT modelestimated that even by 2025, one-third of India’s cereal production will be contributed byrainfed areas.
Table 4. Share of rainfed area in total area under crops
Crops Total area under crops Area under rainfed crops(Mha) % Mha
Rice 45.54 42 19.13Coarse cereals 27.45 85 23.33Jowar 7.53 91 6.85Bajra 8.75 91 7.96Maize 8.17 75 6.13Pulses 22.09 77 17.01Redgram 3.38 96 3.24Bengal gram 7.89 67 5.29Oilseeds 27.56 66 18.19Groundnut 6.16 79 4.87Rapeseed and mustard 6.3 27 1.70Soybean 9.51 99 9.41Sunflower 1.81 69 1.25Cotton 9.41 65 6.12Total 191.55 68 130.48Source: Indian Agricultural Statistics (2010)
PRODUCTION CONSTRAINTS IN RAINFED AGRICULTURE
Rainfed agriculture is generally characterized by low productivity, low agriculturalintensification, and instable production and the farmers’ income. The degree of limita-tions, constraints and potentials of rainfed areas vary over a wide range with the land-scape characteristics, climatic factors (precipitation and micro-climate) and socio-eco-nomic factors (ethnicity, type of economic activity, resource management pattern etc.).Ecologically, rainfed areas are diverse, ranging from deserts in plains to humid rainfedareas in hill and mountain ecosystems.
Traditional farming is practiced in the form of agri-silvicultural, agri-pastoral andagri-silvi-pastoral systems. Animal husbandry is an integral part of agriculture. Further,the traditional farming systems in drier and less favoured areas are more of a survivalmechanism rather than entrepreneurial activity. The rainfed farming generally dependsupon locally available inputs (seeds, manures, animal draft) and uses mixed cropping witha number of crops capable of withstanding drought/water stagnation-like situations.Thecrops mature at different timings. The cultivars may be individually poor in productivity

46 Bulletin of the Indian Society of Soil Science, No. 29
but collectively the crop mixes are reasonably productive. The problems associated withrainfed agriculture are more acute in degraded lands, which form a sizeable part of rainfedareas; almost fifty percent of the land in Asia today is classified as degraded.
The rainfed lands suffer from a number of biophysical and socio-economic con-straints which affect productivity of crops and livestock. These include:
• Low and erratic rainfall, land degradation, low level of input use, poor technologyadoption, inadequate fodder availability, low productive livestock, and resource poorfarmers and inadequate credit availability.
• Rainfall in India, although is 117 cm annually compared to the global average of 110cm, it is highly unreliable, both in time and space, with strong risks of dry spells atcritical growth stages even during good rainfall years. While absolute water scarcityis a constraint in arid regions, high rainfall variability in time and space is a constraintin semi-arid and sub-humid tropical regions. The probability of deficit rainfall (rainfall<25% of normal) during southwest monsoon period in India is (Sharma et al. 2008):
♦ Once in 2.5 yrs in West Rajasthan♦ Once in 3 yrs in Gujarat, East Rajasthan, Western Uttar Pradesh, Tamil Nadu,
Jammu and Kashmir, Rayalaseema and Telangana regions of Andhra Pradesh
♦ Once in 4 yrs in South-interior Karnataka, Eastern Uttar Pradesh and Vidarbha
♦ Once in 5 yrs in West Bengal, Madhya Pradesh, Chhattisgarh, Konkan region ofMaharashtra, Coastal Andhra Pradesh, Bihar, Jharkhand and Orrissa
♦ Once in 15 yrs in Assam and Kerala.
The droughts may be early season, mid season or terminal. It is easier to manageearly-season drought by growing short duration crops/modifying cropping pattern, butmid-season and terminal droughts are agriculturally very detrimental.
• In many rainfed regions, there is inherited shortage of water due to geographicallocation where rainfall is very low, groundwater use is not feasible due to economic,political and/or technical reasons, water treatment options have economic limitations,and transportation of good-quality water from other areas is not practical.
• Soils in rainfed areas are generally deficient in organic matter and other essential plantnutrients, and substantial gains (70 to 120%) are observed when crops were suppliedwith adequate quantities of these nutrients (Wani et al. 2003; Rego et al. 2005).
• The high risk for water-related yield loss makes farmers risk averse, influencing theirother investment decisions, including labour, improved seed, and fertilizers etc.
• Climate change (global warming) is further accentuating the problem by way ofincreasing rainfall uncertainties. Rainfall patterns are showing characteristic change inthe long-run in several regions. For example, decadal characteristics of rainfall varia-tion at Kanpur (UP) indicate a declining trend since 1971-80 (920.4 mm) until 2001-10 (818.6 mm) when these data were analyzed at an average decadal rainfall loss of101.8 mm (Fig.1).

Efficient Water Management for Sustainable Agriculture 47
Another example is from the state of Himachal Pradesh (Sharma et al. 2010) wherea study of annual rainfall data for the last about thirty years (1976-2006) have shownthree different trends in the state, viz.
i. Increasing trend in annual rainfall in districts of Lahaul-Spiti, Chamba, Una andKangra (Fig 2a)
ii. Unchanged trend in annual rainfall in districts of Kullu, Bilaspur, Hamirpur and Sirmour(Fig 2b)
iii. Decreasing trend in annual rainfall in districts of Kinnaur, Shimla, Mandi and Solan(Fig 2c)
Fig. 1. Source: Annual Report (2010), AICRP on Agrometeorology, Kanpur
Fig. 2a. Annual rainfall showing increasing trend in four districts of Himachal Pradesh (1976-2009)

48 Bulletin of the Indian Society of Soil Science, No. 29
Fig. 2b. Annual rainfall showing temporal constancy in four districts of Himachal Pradesh (1976-2008)
Fig. 2c. Annual rainfall showing decreasing trend in four districts of Himachal Pradesh (1976-2008)
WATER MANAGEMENT FOR SUSTAINABLE RAINFED AGRICULTURE
In view of the existing status of vital resource i.e. water, and increasing demands ofwater for meeting the needs of the burgeoning population of the country, a holistic, wellplanned strategy is required for sustainable productivity. The management and conserva-tion of water resources for sustainable productivity may be based on increasing the watersupply and managing the water demand under the stressed water availability conditions.Sharing, people’s participation, mass communication and capacity building are essentialtools for effective water resources management and conservation. The water manage-ment in rainfed areas needs focus along two lines:
1. Augmenting/strengthening of water resources
2. Efficient utilization of conserved water

Efficient Water Management for Sustainable Agriculture 49
1. Augmenting/Strengthening of Water Resources
Rainwater Harvesting
Rainwater harvesting is the process of collecting, concentrating and improving theproductive use of rainwater, and reducing unproductive depletion such as runoff, evapo-ration and seepage. Harvested rainwater may be used for providing pre-sowing irrigation,supplemental/life saving irrigation, recharging ground water and/or for domestic pur-poses. There is generally enough rainfall in most of the moist semi-arid and dry sub-humid zones to meet the crop water needs, and if local water balances were managedbetter then India should not have to suffer from droughts (Agarwal 2000). Of the totalprecipitation that falls in the country, less than 29% is harvested or utilized and 21% of itis lost to the sea. Several studies have shown (Kanwar 1999) that the acceptance forrainfed technologies has been only in those areas where rainwater harvesting and itssubsequent utilization in the field was made an important component of technologicalinterventions.
In-situ water harvesting
Utilization of rainwater as and when/where it falls on the land, i.e. the places ofavailability and utilization are the same. Options for in-situ rainwater harvesting include:
a. Land leveling and field bunding: leveled plots with thick, strong and raised bundsimpound rainwater in situ; land leveling helps rainwater distribution in the entire fieldevenly and uniformly.
b. Land shaping (trenching, providing directional slope etc): to concentrate runoff at thedesired location, such as tree basins in orchards land shaping for flowing water etc.
c . Micro-catchment water harvesting: by converting flat plots into ridge-furrow system,where crops are planted in furrows so that rainwater concentrates in planting areaand root zone. It improves moisture conservation and enhances crop yields.
d. Raised-sunken bed technology: for inter-plot rainwater harvesting. High water requir-ing crops (e.g. rice) are cultivated in sunken beds and low water requiring crops (e.g.maize, soybean, vegetables etc.) on raised beds. This technology has been found tobe useful in high rainfall areas also (Sharma 2003).
e. Terracing: on sloping landscapes, and cultivating crops requiring well drained condi-tions (maize, soybeans, vegetables etc.) on upper terraces and high water demandingcrops (rice, vegetables) on lower terraces where run-off concentrates. Divert waterfrom upper terraces to lower terraces.
Ex-situ water harvesting
Place of availability of water resource is away from the place of its utilization, forwhich a suitable storage structure and water conveyance system are necessary.
• Construction of a suitable reservoir to collect and store excess rainfall/runoff, streamflow, spring water, roof-top water etc. Design of a water storage structure at micro-

50 Bulletin of the Indian Society of Soil Science, No. 29
watershed level depends on the following factors: amount of rainfall, characteristicsof the catchment area that generates runoff, amount of runoff generated, commandarea to be irrigated with stored water, crop water requirement etc.
Effective utilization of stored water
In India normal period of southwest monsoon, delivering about 70% of total annualrainfall, is from June to September/October and it forms the main season (kharif) forcultivation of rainfed crops. As total rainfall is spread over few rainy days and intense butfewer rainfall events (may be about 100 hours in whole season), it results in surfacerunoff and erosion or causes temporary water stagnation on agricultural fields, resultingin higher evaporation from surface areas. In either case, water is not available for plantgrowth and has very low productivity. In order to raise better crops with higher produc-tivity, it is necessary to convert a part of this lost water (evaporation, excessive runoff)into a more productive use. Local harvesting of water and utilizing the same for supple-mental/protective irrigation to mitigate the impacts of devastating dry spells offers a goodopportunity in the fragile rainfed regions (Kapur et al. 1995; Rockstrom 2001, 2003;Sharma et al. 2005; Wani et al. 2003). Frequent occurrence of mid-season and terminaldroughts of 1 to 3-weeks consecutive duration during the main cropping season is thedominant reason for crop (and investment) failures and low yields. Provision of criticalirrigation during this period has the potential to improve the yields by 29 to 114% fordifferent crops. Studies show that practical harvesting of runoff is possible only when theharvestable amount is greater than 50 mm or greater than 10% of the seasonal rainfall(minimum utilizable runoff, CRIDA). Regions with lower mean annual rainfall experiencehigher variability in rainfall pattern, and hence in these regions rainwater harvesting as adependable source of water is likely to be low (Pisharoty 1990). The total harvestablesurplus rainfall for various rainfed crops is estimated around 11.4 Mha-m (114.02 billionm3) from an area of about 28.5 Mha which could be considered for water harvesting(Table 6). After meeting the irrigation requirement of crops there is runoff surplusavailable to meet river/ environmental flows.
Watershed Management
Watershed management is an effective technique of water harvesting. It aims toestablish a workable and efficient framework for the integrated use, regulation and devel-
Table 6. Harvestable surplus runoff available for supplemental irrigation to the rainfed crops in India
Crop/ Crop group Rainfed area Surplus Deficitcrop runoff needs
(‘000 ha) (ha-m) (ha-m)
Rice 6,329 4,121,851 0Coarse cereals (Finger millet, maize, pearl millet, sorghum) 7,502 2,057,393 0Oilseeds (Castor, groundnut, sesame, linseed, soybeans, sunflower) 6,273 2,421,222 1646Pulses (Chickpeas, green gram, pigeon peas) 5,288 2,044,145 9404Cotton 3,177 7,57,575 8848Grand total 28,568 11,402,186 19898

Efficient Water Management for Sustainable Agriculture 51
opment of land and water resources in a watershed for socio-economic growth. It is anapproach that aims at improving ecology of the region as well for resilience of climatechange impacts, more so on rainfall. Local communities play a central role in the plan-ning, implementation and funding of activities within participatory watershed developmentprogrammes. In these initiatives, people use their traditional knowledge, available re-sources, imagination and creativity to develop watershed and implement community-centered programme.
National network on Model Watersheds had convincingly established that runoff to alimited extent can be harvested and recycled to stabilize crop production across differentclimatic zones and production systems. This component of water harvesting has becomethe backbone in furthering the watershed programmes in rainfed areas in most states ofIndia (Sharma et al. 2005; Wani and Ramakrishna 2005). The last decade of the twentiethcentury has witnessed considerable activity focusing around watershed development.
Soil-moisture Conservation
It is a technique to increase soil moisture storage, decrease evaporative losses, andenhance duration of water availability to crops. Timely and satisfactory crop establish-ment is a serious constraint in rainfed areas due to inadequate soil moisture at the time ofsowing. If through soil moisture conservation timely sowing of crop is assured, theprobability of a good crop harvest is increased. Following are some of the several optionsof in-situ soil moisture conservation.
Mulching
Mulching for soil moisture conservation is an age-old practice and is selectively usedby the farmers. Several materials such as organic or inorganic materials of natural (fieldcrop residues, waste plant biomass, wood chips, saw dust, coco-coir etc.) or of syn-thetic origin (plastic sheets, soil conditioners), soil (dust mulch) or pebbles (stone mulch)can be used as mulch. The choice of a mulch material, however, depends on its cost,availability, ease of handling and efficacy etc.
In rainfed areas with resource-poor farmers availability of mulch material is gener-ally a problem. A technology was perfected at the Himachal Pradesh Agricultural Univer-sity, Palampur, for in situ soil moisture conservation wherein waste plant materials(Lantana, Eupatorium, Ipomea, Shorea robusta etc.) were used as mulch during rainy(kharif) season (in standing crop) to enhance residual soil moisture for timely sowing ofwinter (rabi) crops (Sharma et al. 1990, 2000).
The alley cropping is another system of raising mulch material. It is essentially anagro-forestry system in which food crops are grown in alleys formed by hedge-rows oftrees and shrubs. The hedgerows are cut back at planting and kept pruned duringcropping to prevent shading and reduce competition with food crops. When there are nocrops, the hedge-rows are allowed to grow freely to cover the land. It can easily beadopted by resource-poor farmers in hills and is ideally suited to marginal areas. Pruningsfrom trees/shrubs provide excellent mulch material and green manure. Hedge-row trees/shrubs also provide biologically fixed N to the companion crop, and act as a barrier tocontrol soil erosion.

52 Bulletin of the Indian Society of Soil Science, No. 29
Organic Matter Build-up in Soils
Soil organic matter plays three important functions viz. nutritional function (suppliesessential nutrients); biological function (food for microbes); and soil physical, chemicaland physico-chemical function (improvement in soil properties). Water holding capacity(WHC) and available water capacity (AWC) of soils are directly linked to soil organiccarbon (SOC). Studies have shown that 1% increase in soil organic manure (OM) in-creases field capacity by about 2.2%, permanent wilting point by about 1%, and availablewater capacity by about 1.5% (Sharma and De Datta 1994). A study in Ghana (Beet1990) found that a decrease in organic matter in soils from 5 to 3% decreased soil waterretention from 57 to 37%. Soil incorporation of organic materials such as farmyardmanure (FYM), compost, green manures, waste plant residues, farm weeds or even cropresidues improves the SOC and soil water retention.
Conservation Tillage
Conventional tillage (repeated primary and secondary tillage operations) invariablyenhances SOM decomposition by breaking soil aggregates and exposing the soil to weath-ering agents, thus, weakening soil structure, and making soil loose to be washed awaywith runoff water. Conservation tillage (a non-inversion tillage that retains at least 30% ofthe soil surface covered by residues after planting, and is less intensive than conventionaltillage) has been found to be a potential alternative to conventional tillage to reduce soilerosion by water or wind; improve and sustain soil health; and lower the cost of cultiva-tion. Conservation tillage is environment-friendly. The term “conservation tillage” is anumbrella classification for several crop production systems, including no-till, reduced-till,minimum-till, direct seeding and other names. If tillage operations are inevitable, theyshould be performed across the slope so as to retain water at soil surface and cut downthe flow velocity of run-off water.
Protection/Rejuvenation of Traditional Water Sources
Efforts should be made to protect the traditional water resources, such as wells,baudies, springs, ponds etc. against drying, pollution or physical destruction. Governmentis encouraging local communities through panchayats etc. for taking interest and respon-sibility of rejuvenating and maintaining such water sources.
Water springs are important natural sources of water for hill people both for domes-tic and agricultural purposes. Water springs in hills are drying due to deforestation,mining, blasting activities in the catchment areas (road construction, queries or otherinfrastructural development etc.), and declining rainfall events. Deforestation increasesrunoff and decreases infiltration, thereby resulting in relatively less groundwater recharg-ing. Blasting causes drying of water springs and lowering of water table in wells bydisrupting the water-flow lines. For rejuvenation of natural water resources in hills,deforestation must be curved, land must be put under vegetation and blasting activitiesreduced.
In one study at Palampur, rehabilitation of catchment area of the springs withvegetation enhanced the flow rate of the springs (Table 7).

Efficient Water Management for Sustainable Agriculture 53
Table 7. Flow rate (m3 s-1x10⁻⁶) of two springs before and after rehabilitation of surrounding areas withvegetation (Acharya et al. 1989)
Month Before rehabilitation (1983-84) After rehabilitation (1984-85)Rainfall Spring I Spring II Rainfall Spring I Spring II
(mm) (mm)
May 206.4 20.0 32.2 34.4 14.6 31.5June 53.4 16.5 30.5 483.6 12.2 22.2July 275.6 14.0 29.0 654.9 107.2 169.6August 929.0 19.2 34.4 523.0 403.0 499.2September 373.5 32.6 36.0 189.7 271.5 147.0October 24.4 28.0 32.3 Nil 138.6 160.2November Nil 27.0 29.0 11.2 82.3 71.6December 9.7 26.2 28.8 127.6 98.2 86.5January 28.5 26.8 29.7 72.7 83.3 88.5February 138.1 26.0 31.6 27.4 80.5 86.2March 35.9 28.4 34.3 26.4 58.0 62.0April 27.0 22.4 35.2 80.2 34.0 48.0Mean 175.1 23.9 31.9 185.9 115.3 122.7
Groundwater Management
Surface water is inadequate to meet agricultural demand of the country and we haveto depend on ground water. Increased dependence on groundwater for irrigation andother uses have over-exploited this natural water resource. Construction activity in andaround the city due to rapid urbanization results into drastic reduction in infiltration ofrainwater into the sub-soil and reduced recharging of groundwater. Water bodies aredrying up and being reclaimed as plots for houses.
In order to sustain groundwater resource it is essential to utilize groundwater judi-ciously and efforts are directed for recharging the ground aquifers. The states, whichhave taken up rainwater harvesting and groundwater recharge programmes on a largescale, are Gujarat (North Gujarat, Saurashtra and Kachchh), Rajasthan, Maharashtra,Tamil Nadu, Karnataka, Andhra Pradesh, Madhya Pradesh, Orissa and Chattisgarh (Kumaret al. 2008). The exploitation of groundwater resources should be regulated so as not toexceed the recharging possibilities, as well as to ensure social equity. The detrimentalenvironmental consequences of over-exploitation of groundwater need to be effectivelyprevented by the Central and State Governments. Clearly, a joint management approachcombining government administration with active people participation is a promising solu-tion.
Structures generally used for recharging ground water are:
• Pits: Recharge pits are constructed for recharging the shallow aquifers. These areconstructed 1 to 2 m wide and to 3 m deep which are back-filled with boulders,gravels and coarse sand.
• Trenches: These are constructed when the permeable stream is available at shallowdepth. Trench may be 0.5 to 1 m wide, 1 to 1.5 m deep and 10 to 20 m longdepending up availability of water. These are back-filled with filter materials.
54 Bulletin of the Indian Society of Soil Science, No. 29
• Dug wells: Existing dug wells may be utilised as recharge structure and water shouldpass through filter media before putting into dug well.
• Hand pumps: The existing hand pumps may be used for recharging the shallow/deepaquifers, if the availability of water is limited. Water should pass through filter mediabefore diverting it into hand pumps.
• Recharge wells: Recharge wells of 100 to 300 mm diameter are generally constructedfor recharging the deeper aquifers and water is passed through filter media to avoidchoking of recharge wells.
• Recharge shafts: For recharging the shallow aquifers which are located below clayeysurface, recharge shafts of 0.5 to 3 m diameter and 10 to 15 m depths are con-structed and back-filled with boulders, gravels and coarse sand.
• Lateral shafts with bore wells: For recharging the upper as well as deeper aquiferslateral shafts of 1.5 to 2 m width and 10 to 30 m length depending upon availability ofwater with one or two bore wells are constructed. The lateral shafts are back-filledwith boulders, gravels and coarse sand.
• Spreading techniques: When permeable strata start from top then this technique isused. Water in the streams/Nalas should be spread by making check dams, nalabunds, cement plugs, gabion structures or constructing a percolation pond.
2. Efficient Utilization of Conserved Water
Improved Agronomic Practices
Farmers must follow improved agronomic practices (selection of crops and cropcultivars, mixed cropping, crop rotation, use of manures and fertilizers, irrigation method-ology, crop protection, weed control etc.) to cultivate crops in order to sustain soilfertility, achieve maximum crop productivity and enhance water use efficiency in therainfed areas. High yielding and less water-requiring crops (short duration, low transpira-tion, deep and well branched root system) are needed for rainfed areas.
Raising Water Productivity
Several studies suggest that better management of rainwater, soil moisture andsupplemental irrigation hold the key to high water productivity. It is estimated that a 35%increase in water productivity could reduce additional crop water consumption from 80 to20% (Molden 2007). There are several options for increasing water productivity inrainfed areas:
• Supplemental irrigation: A study of over 500 districts in India concludes that provi-sion of critical irrigation during the mid and terminal drought periods has the potentialto improve the yields by 29 to 114% for different crops (Sharma et al. 2010). Sharmaet al. (2010) estimated that with one time supplemental irrigation of about 100 mm(using harvested run-off), along with adoption of improved agronomic practices, theoverall productivity level in rainfed areas could be enhanced from the existing aggre-

Efficient Water Management for Sustainable Agriculture 55
gated level of 1.20 t ha-1 to a level of 2.65 t ha-1 (cereals- 3.64 t ha-1; oilseeds-1.75 tha-1, pulses- 1.93 t ha-1). Out of the total of about 92 Mha of rainfed cropped area ofthe country, only 30 Mha lies in <500 mm rainfall zone and the rest of 68% rainfedcropped area lies in medium to high rainfall regions with very high potential forsupplemental irrigation through capturing run-off.
• Multiple use of water: Multiple use of water provides challenging opportunities forincreasing water productivity at various scales ranging from farm to basin scales,both under irrigated and rainfed conditions. Multiple use of stored water integratescrops, livestock, fisheries and horticulture for enhancing water productivity to im-prove food security, health and environment and ultimately the improved livelihood ofthe resource-poor farmers.
• Farm mechanization: Timely operations are important in rainfed agriculture as thefarm operations are linked to the soil moisture regime. The limited ‘sowing time-window’ available at the onset of monsoons places heavy demand on the availabledraft power. Though the total farm-power availability has increased over time, com-mensurate increase in appropriate farm-implements has not taken place. Decliningbullock power in several states makes the small-farmers much more vulnerable asthey will be the last priority for tractors on hire services. The problem deepens withincreasing rainfall uncertainties due to climate change.
• Protected cultivation: Cultivation in net/shaded/poly houses provides protection againstrainfall deficits, insects, pests, diseases and 5-10 fold higher productivity, high qualityoff-season production and very high prices. It also saves water and fertilizers in therange of 30-60% and generates employment over the extended period. The protectedcultivation coupled with rainwater harvesting is a viable and profitable technique ofhigh-value crop production in small rainfed holdings.
EPILOGUE
India’s rainfed agricultural sector provides livelihoods for hundreds of millions ofpeople, and it is the source of nearly half of the value of the country’s agriculturalproduction. As unexploited irrigation potential is increasingly scarce, planners look in-creasingly to rainfed agriculture to contribute to food production and economic develop-ment in the decades ahead. This is well known that irrigated agriculture has always beenmore productive than rainfed agriculture, but rainfed agriculture have been highly produc-tive, particularly in the last decade, thus providing hope that the rainfed sector can in factmake major contributions in the coming years. Variable rainfall, dry spells, and droughtsmake rainfed farming a risky business. Better management of rainwater, soil moisture,and supplemental irrigation is the key to success in these areas. Technology is known.Only proper implementation is needed.
REFERENCES
Acharya, C.L., Sharma, P.D., Kapur, O.C. and Kumar, R. (1989) Formation and flow behaviours ofselected Himalayan springs. Indian Journal of Ecology, 16, 119-123.

56 Bulletin of the Indian Society of Soil Science, No. 29
Agarwal, A. (2000) Try capturing the rain: Briefing Paper for Members of Parliament and StateLegislatures. Center for Science and Environment, New Delhi.
Beet, W.C. (1990) Raising and Sustaining Productivity of Smallholder Farming Systems in theTropics. Agbe Publishing, Alkmaar, Holland.
Conway, G. (1997) The Doubly Green Revolution - Food for All in the Twenty-first Century.Comstock Publ. Ass., New York.
Falkenmark, M. and Rockström, J. (2004) Balancing Water for Humans and Nature: The NewApproach in Ecohydrology. London: Earthscan.
FAOSTAT (2005) Database. Food and Agriculture Organization, Rome. Accessed November2005. [http://faostat.fao.org/].
Kapur, O.C., Acharya, C.L. and Masand, S.S. (1995) Increasing efficiency of stored water throughminimal irrigation and mulch in wheat. Journal of Water Management 3, 70-73.
Kanwar, J.S. (1999) Need for a future outlook and mandate for dryland agriculture in India. InFifty Years of Dryland Agricultural Research in India (H.P. Singh et al., Eds.). CentralResearch Institute for Dryland Agriculture, Hyderabad, India, pp. 11-20.
Kumar, M.D., Patel, A. and Singh, O.P. (2008) Rainwater harvesting in the water-scarce regionsof India: Potential and pitfalls. In: Strategic Analyses of the National River Linking Project(NRLP) of India, Series 2 (U.A. Amarasinghe and B.R. Sharma, Eds.). Proceedings of theWorkshop on Analyses of Hydrological, Social and Ecological Issues of the NRLP. Co-lombo, Sri Lanka: International Water Management Institute. pp 289-314.
Molden D (Editor) (2007) Water for Food, Water for Life: A Comprehensive Assessment of WaterManagement in Agriculture. Earthscan, London and International Water ManagementInstitute (IWMI), Colombo, Sri Lanka.
NRAA (2012) Prioritization of Rainfed Areas in India, Study Report 4, NRAA, New Delhi.
Pisharoty, P.R. (1990) Characteristics of Indian Rainfall, Monograph, Physical Research Labo-ratories, Ahmedabad.
Pretty J. and Hine R. (2001) Reducing food poverty with sustainable agriculture: A summary ofnew evidence. Final Report of the ‘Safe World; University of Essex, UK.
Rego, T.J., Wani, S.P., Sahrawat, K.L. and Padhasardhy, G. (2005) Macro-benefits from boron,zinc and sulphur application in Indian SAT: A step for grey to green revolution in agricul-ture. Global Theme on Agroecosystems Report 16. International Crops Research Institutefor the Semi-Arid Tropics. Hyderabad, India.
Rockstrom , J. (2001) Green water security for the food makers of tomorrow: Windows of oppor-tunity in drought-prone Savannahs. Water Science and Technology 43(4), 71-78.
Rockstrom J. (2003) Water for food and nature in the tropics: Vapor shift in rainfed agriculture.Invited Paper to the Special Issue 2003 of Royal Society Transactions B. Biology, Theme:Water Cycle as a Life Support Provider.
Rosegrant, M., Ximing, C., Cline, S. and Nakagawa, S. (2002) The Role of Rainfed Agriculture inthe Future of Global Food Production. EPTD Discussion Paper 90. IFPRI, WashingtonDC, USA.
Efficient Water Management for Sustainable Agriculture 57
Sharma, B.R., Samra, J.S., Scott, C.A. and Wani, S.P. (Editors) (2005) Watershed ManagementChallenges: Improved Productivity, Resources and Livelihoods. International Water Man-agement Institute, Colombo, Sri Lanka, 334 pp.
Sharma, B.R., Rao, K.V., Vittal, K.P.R., Amarasinghe, U.A. and Singh, A. (2010) Estimating thepotential of rainfed agriculture in India. Prospects of water productivity improvements.Agricultural Water Management 97, 23-30.
Sharma, B.R., Rao, K.V., Vittal, K.P.R. and Amarasinghe, U.A. (2008) Converting rain into grain:Opportunities for realizing the potential of rain-fed agriculture in India. In: Strategic Analy-ses of the National River Linking Project (NRLP) of India, Series 2 (U.A. Amarasingheand B.R. Sharma, Eds.). Proceedings of the Workshop on Analyses of Hydrological, Socialand Ecological Issues of the NRLP. International Water Management Institute, Colombo,Sri Lanka. pp. 239-252.
Sharma, P.K. (2003) Raised-sunken bed system for increasing productivity of rice-based crop-ping system in high rainfall areas of Himachal Pradesh. Journal of the Indian Society ofSoil Science 51, 10-16.
Sharma, P.K. and Acharya, C.L. (2000) Carry-over of residual soil moisture with mulching andconservation tillage practices for sowing of rainfed wheat in north-west India. Soil andTillage Research 57, 43-52.
Sharm, P.K. and De Datta, S.K. (1994) Rainwater utilization efficiency in rainfed lowland rice.Advances in Agronomy 52, 85-120.
Sharma, P.K., Kharwara, P.C. and Tewatia, R.K. 1990. Residual soil moisture and wheat yield inrelation to mulching and tillage during the preceding rainfed crop. Soil Tillage Research15, 279-284.
Sharma, P.K., Kapur, O.C., Kumar, R., Masand, S.S., Saroch, K. and Sandal, S. (2010) Water forHill Agriculture: Unlocking Potentials. Westville Publ. House, New Delhi. p.148. (ISBN978-81-85873-57-2).
Singh, R.P. (2001) Watershed Management: A Holistic Approach for Dryland Agriculture. Na-tional Workshop on Watershed Area Development: Challenges and Solutions. IIM,Lucknow.
Wani, S.P., Pathak, P., Sreedevi, T.K., Singh, H.P. and Singh, P. (2003) Efficient management ofrainwater for increased crop productivity and groundwater recharge in Asia, pp 199-215. InWater Productivity in Agriculture : Limits and Opportunities for Improvement (J.W. Kijne,R. Barker and D. Molden, Eds). Wallingford, UK, Colombo, Sri Lanka: CABI-IWMI.
Wani, S.P. and Ramakrishna, Y.S. (2005) Sustainable management of rainwater through inte-grated watershed approach for improved rural livelihoods. In Watershed ManagementChallenges: Improving Productivity, Resources and Livelihoods (B.R. Sharma et al., Eds.).International Water Management Institute, Colombo, Sri Lanka. pp. 39-60.


Bulletin of the Indian Society of Soil Science, No. 29. pp 59-86 (2014)
Sodic Irrigation Management forSustaining Productivity
M.S. Bajwa1 and O.P. Choudhary2
The imminent water scarcity is posing the single biggest threat to sustaining future foodsecurity, agro-eco-system and socio-economic stability all over the world. The real prob-lems will be how to meet our ever-increasing needs of irrigation water and ensuringprogressive growth in agro-production for sustaining our burgeoningly growing popula-tion.
The problems of water scarcity are on rise particularly, under arid and semi-aridclimatic conditions, where surface water resources are limited, good quality undergroundaquifers are continuously getting depleted and ground waters in many areas contain higherconcentrations of soluble salts that can adversely affect agricultural production. In India,poor quality saline and/or sodic (containing high carbonates of Na) ground waters consti-tute a major portion (32-84%) of the total irrigation potential of ground waters in differentstates like Uttar Pradesh, Haryana, Punjab, Rajasthan, Gujarat, Madhya Pradesh, Karnatakaand Andhra Pradesh (Minhas and Gupta 1992). Most of the ground waters in north-western parts of India receiving 500-700 mm rainfall annually test high in residual alka-linity (Bajwa et al. 1974; Minhas and Gupta 1992; Choudhary et al. 2011b) than those inthe regions receiving less than 350 mm annual rainfall where the waters are saline innature (Sharma and Minhas 2005).
Continued use of these poor quality waters for irrigation leads to the build-up ofsalinity and/or sodicity in soil and deterioration of soil physico-chemical properties (Josanet al. 1998; Grattan and Oster 2003; Oster 2004) because of which sustainability of cropproduction is adversely affected (Minhas and Gupta 1992; Gupta and Abrol 2000; Minhasand Bajwa 2001; Choudhary et al. 2011b; Minhas 2012).
But despite these effects of saline and sodic irrigation, poor quality waters can alsobecome (to some extent) a valuable resource for irrigation and sustaining crop production,when used and managed correctly. This is particularly so when, excepting poor qualitywater, no other good quality water resource is available for irrigation or its supplies arelargely inadequate or erratic.
For such situations, ever since the work reported by Bhumbla (1969), Kanwar andKanwar (1971), Gupta (1971), Bhumbla and Abrol 1972), Paliwal et al. (1976) and AICRP-Saline water (1972-2006), and others, concerted efforts have been made to understand and1Former Director of Research, Punjab Agricultural University, Ludhiana, Punjab2Department of Soil Science, Punjab Agricultural University, Ludhiana, Punjab

60 Bulletin of the Indian Society of Soil Science, No. 29
develop proper crop, saline/sodic water and soil management strategies that can help insustaining high crop production while ensuring conservation of the eco-system.
Work on saline waters and their management has been extensively reviewed (Minhasand Gupta 1992; Rhoades 1999; Tanwar 2003; Minhas 2012). This paper critically re-views and analyses the work done on sodic waters and their management for sustaininghigh crop productivity, particularly in India.
Sodic Waters
Sodic waters contain excessive concentration of dissolved carbonates (CO2-3 + HCO-
3) ofNa+ (generally very low in CO2-
3), carbonates > chlorides and sulphates, high proportion ofNa+ with respect to Ca2++Mg2+ (United States Salinity Laboratory 1954). The soluble Napercentage is generally > 75 and the ratio of divalent cations to total cations is < 25 forsodic waters.
Alkalinity (Alk) of these waters depends upon dissolved carbonates (CO32- + HCO3
-)and Pco2 (Stumm and Morgan 1981) which can be defined by:
Alk = [HCO3-] + 2[CO3
2-] + [OH-] — [H+]
Since Alk of natural waters in equilibrium with PCO2 is not appreciably affected byH+ and OH- ions in the pH range of 6 to 10:
Alk = [HCO3-] + 2 [CO3
2-] = (HCO3-) + 2 (CO3
2-)
Alk = (HCO3-) + 2 (CO3
2-) = 2[Ca2+] + 2[Mg2+] + [Na+] + [K+] – [Cl -] – 2 [SO42-]
Alkalinity of water is, therefore, expressed as (sum of cations) minus (sum of anions,other than carbonates), and residual Alk = [HCO-
3 + CO32-] – [Ca2+ + Mg2+] which
determines the potential of irrigation water to create alkalinity hazard in the soil.
This has been expressed as residual sodium carbonate (RSC) by Eaton (1950) and isbeing used as an index of water-suitability for irrigation of crops in the soil testing labora-tories of India. In general, waters having high RSC test low in EC, Some waters termedas saline-sodic test low in RSC but high in SAR and EC (>4 dS m-1) (Bajwa et al. 1975;Singh et al. 1977). Waters having RSC < 2.5, 2.5 to 5 and >5 meq L-1 are considered to besafe, marginal and unsafe, respectively (Bhumbla et al. 1972). Presence of CO3
2- in ground
water is more harmful than HCO3- (Kanwar and Kanwar 1971). However, these critical
limits may not hold when precipitation of CO32- is not complete and varies with Pco2 in soil
solution. In some waters, RSC of irrigation water may be zero, but may contain highcarbonates and also high SAR (Bower and Maasland 1963; Singh et al. 1977).
SODIC IRRIGATION EFFECTS ON SOIL SODIUM SATURATION
In the early stages of sodic irrigation, large amounts of divalent cations are released intothe soil solution from exchange sites. Several reports on the sodication of soils due toirrigation with sodic waters have appeared from the north-west parts of India (Singh andSingh 1971; Gupta 1980; Manchanda et al. 1989; Bajwa et al. 1983, 1986, 1993; Bajwaand Josan 1989a,b; Minhas et al. 2007a,b; Choudhary et al. 2011a, 2013). Because ofincreased input of sodic water, the build up of ESP in soil under rice-wheat system is

Efficient Water Management for Sustainable Agriculture 61
higher than in the maize-wheat system (Fig. 1 & 2). Major build-up of salts and Na+ in thesurface soil layers occurs during irrigation of winter crops with sodic water under themonsoonal climate (Bajwa et al. 1983; Bajwa and Josan 1989a; Bajwa et al. 1992; Josanet al. 1998; Choudhary et al. 2004; Minhas et al. 2007b). The sodicity development uponirrigation with sodic waters depends upon equilibrium between precipitation of calcite andother salts during irrigation to crops and their dissolution with rain water. Such conditionsdo not allow for the achievement of steady-state conditions. However, a quasi-stable saltbalance can be reached within 4-5 years of sustained sodic water irrigation (Minhas andGupta 1992) while the continual rise in pH and exchangeable sodium percentage (ESP) isvery slow (Choudhary et al. 2004, 2006). Choudhary et al. (2004) reported in a 10-yearfield study that under sugarcane crop the build-up of ESP in soil tended to stabilize after 4years of sodic irrigation, but it continued to increase over the years under saline-sodicwater irrigation.
Fig. 1. Depth distribution of exchangable sodium percentage as affected by RSC of irrigation water
Evaluating Sodicity Hazards
The level of Na saturation in soil determines the possibilities of growing differentcrops and sustaining high crop production-efficiency under sodic irrigation systems. Ourability to predict the extent of ESP build up in soil under long-term sodic irrigation ofdifferent cropping systems, therefore, assumes significance for selection of crops andcropping systems and planning crop-water-soil management systems.
Residual sodium carbonate (Eaton 1950) and sodium adsorption ratio (United StatesSalinity Laboratory 1954) of irrigation water (iw) have been most commonly used asindices of water suitability with respect to sodicity hazard in soil. But Singh et al. (1977)observed that ESP in the soil was better related (r = 0.60) with carbonates (CO3
2- +HCO3
-)iw followed by RSCiw (r = 0.54) and SARiw (r = 0.45) for 139 soil samples ofBhatinda district of Punjab. This shows that SARiw or RSCiw alone cannot adequatelypredict the build up of ESP in the soil and adjustments are needed for precipitation ofcarbonates in soil in equilibrium with Pco2.
Bower (1961) proposed the following empirical equation for working out the ad-justed SARiw:
Adj.SARiw = SARiw [1+ (8.4 — pHc)], where pHc is the calculated pH of irriga-tion water (iw) in contact with lime in equilibrium with PCO2.

62 Bulletin of the Indian Society of Soil Science, No. 29
Sharma and Mondal (1981) reported that the root zone ESP build up was bettercorrelated with adj SARiw (r = 0.857) than with RSCiw (r = 0.598). In a long-term fieldstudy, Bajwa et al. (1983) also observed ESP build up in a sandy loam soil to be bettercorrelated with adj SARiw (r = 0.90) than RSCiw (r = 0.49).
Under steady state conditions with respect to ESP build up, where SAR of soil water(sw) was considered as ESP of soil, Bower and Maasland (1963) proposed:
SARsw = ESPSurface soil = 2 SARiw [1 + (8.4 - pHc)]
However, this adj. SAR procedure (Bower et al. 1968) is no longer recommendedbecause it over-predicts the sodium hazard. In long-term field studies, Bajwa and associ-ates (1983, 1989), however, observed that compared with values of co-efficient 2, asobserved above by Bower and Maasland, the values worked out to 1.5 under rice-wheatand 0.72 under maize-wheat systems.
Increase in LF (Ddw/Diw+ Drw) decreases precipitation of CaCO3. At LF less than0.3 usually precipitation of CaCO3 occurs while beyond 0.4, usually dissolution of CaCO3
occurs. Keeping this in view, Bower et al. (1968) proposed
SAR of soil = ESP = (1/LF)1/2{SAR iw [1+(8.4 - pHc)}
Since weathering of minerals and consequent release of Ca and Mg in soil solutioncan affect calculated values of ESP, Rhoades (1968) proposed
ESP = Y(1+2LF)/ (LF)1/2 . adj.SARiw (where Y is mineral weathering coefficient usuallytaken as 0.70).
Suarez (1981) observed that value of pH 8.4 for soil solution in equilibrium withCaCO3 is not constant but depends upon soil solution composition, LF, and PCO2
and
Fig. 2. Exchangeable sodium percentage over the years as affected by different RSC waters

Efficient Water Management for Sustainable Agriculture 63
proposed the following equation for better prediction of SAR of drainage water (SARdw)and in turn ESP:
SARdw = (Na/LF) / [(Mg iw/LF) + X (Pco2)1/3]½ (Where X is Cax in IW modifiedby ionic strength and (CO3+HCO3) : Ca ratio)
Ayers and Westcot (1985) used Cax and used the term: adj. RNa = Na/√[(Cax + Mg)/2which was modified in terms of LF as follows:
SARdw = 1/ (LF)1/2 .adj. RNa
On the basis of a large number of long-term experiments, Minhas and Sharma (2006)reported that sodicity build up was directly related to the depth of sodic water irrigation(Diw), the rainfall (Drw) and the evapo-transpiration demands (ET) of the crops grown in asequence. The build up of ESP could be adequately predicted (R2 = 0.69) as:
ESP = (Diw/Drw) (√ (1 + Drw/ET) (adj.RNa)
The ability of these empirical equations to predict the build up of ESP in the soilunder different long-term sodic irrigated cropping systems needs to be adequately evalu-ated. In long-term field experiments, Bajwa et al. (1983, 1986), Bajwa and Josan (1989b),Minhas and Gupta (1992), Bajwa et al. (1992) and Choudhary et al. (2004) observed thatincrease in RSCiw increased ESP values in soil which were highly significantly relatedwith RSCiw, adj.SARdiw, SARdw and adj.RNa under rice-wheat, maize-wheat, cotton-wheat, millet-wheat and sugarcane cropping systems. Bajwa and Josan (1989b) used dif-ferent empirical equations to predict the build up of ESP in soil after nine years of sodicirrigation under rice-wheat and millet-wheat systems. The results showed that under rice-wheat system (LF = 0.55) the equation proposed by Bower et al. (1968) fairly accuratelypredicted the build-up of ESP in soil. Equations proposed by Rhoades (1968), Suarez(1981) and modified Ayers and Westcot (1985) estimated ESP values significantly lowerthan the observed ESP values, and an empirical constant 2.6 needs to be applied to allthese indices for predicting ESP in soil. Under maize-wheat system (LF = 0.29), Boweret al. (1968) equation over-estimated ESP in soil. Rhoades (1968), Suarez (1981) andmodified Ayers and Westcot (1985) equations fairly closely predicted the build up of ESPin soil. Under five years of cotton-wheat system, Bajwa et al. (1992) reported that thepredicted values of ESP were fairly close to the observed ESP values for soils irrigatedwith sodic waters, as well as for those observed under saline-sodic water irrigation. How-ever, for saline-sodic irrigated conditions, none of the models could predict the build up ofESP in soil. Under wheat-fallow system, Manchanda (1993) also reported that adj.RNaunder-predicted ESP (0-30 cm soil) by 1.5 and 1.3 times whereas adj.SAR over-predictedit by 2 times.
Results of long-term field experiments (Minhas and Bajwa 2001) show that adj.RNacan serve as a useful index to predict the ESP build up in soil under sodic irrigated millet/maize-wheat rotation, particularly because it does not require the use of any empiricalconstant. But for the rice-based cropping system, 2.6 times adj.RNa seems to be reliable.The concept of adj. RNa is also to be preferred because Cax offers a better insight into thechange in Ca2+ concentration in soil-solution due to release of calcium from soil mineralsor its retention/precipitation in soil.

64 Bulletin of the Indian Society of Soil Science, No. 29
For making precise recommendations, the validity of these empirical equations, how-ever, needs to be tested for sodic and saline-sodic waters under different types of croppingsystems, and varying soil, climate, leaching and levels of crop-water-soil managementconditions.
An increase in exchangeable sodium percentage adversely affects soil physical prop-erties as manifested through increased surface crusting that impacts seedling emergence,reduced infiltration affecting water holding capacity of soil profile, increased soil strengthimpacting root penetration and reduced aeration resulting in anoxic conditions for roots(Josan et al. 1998). Due to these effects, making tillage and sowing operation becomesmore difficult (Oster and Jaywardane 1998).
Even after long-term use of sodic waters containing high residual alkalinity, sub-surface soil layers mostly remain low in ESP, due to little leaching of sodium (Fig. 1a).Increased input of sodic water in the rice-wheat system results in greater increase in soilsodicity (higher ESP) than that in the millet-wheat system. (Bajwa and Josan 1989b).Thus, it becomes evident that deterioration in soil physical properties and decline in wheatyields is higher when rice is grown in rotation. So it is usually feared that rice-wheatsystem may not be sustainable with the use of sodic waters (Minhas and Bajwa 2001).
MANAGING SODIC WATERS FOR SUSTAINING HIGH CROP PRODUCTIVITY
Several reports (Minhas and Gupta 1992; Rhoades 1999; Minhas and Bajwa 2001; Tanwar2003; Läuchli and Grattan 2007; O’Connor et al. 2008; Choudhary et al. 2011b) haveshown that adoption of suitable technologies and approaches for efficiently managingsodic irrigation systems can help in sustaining fairly high crop productivity with leastcosts, while conserving the eco-system. This can help in not only living with the problembut also in addressing the difficulties being created under the current and future shortagesof irrigation water to a considerable extent.
The aim of the strategies for managing sodic irrigation system should be to minimizethe adverse impacts of alkalinity in water on soil degradation, crop productivity andeconomic returns. To achieve this waters capable of causing salinity and/ or alkalinityhazards need specialized soil-water-crop management practices (Ayers and Westcot 1976;Shainberg and Oster 1978). The available management options (Minhas and Gupta 1992;Minhas and Bajwa 2001) mainly include site-suitability-based selection of crops and theirvarieties which are capable of growing and producing high yields under varying levels ofalkalinity in the soil, adoption of technologies to control the build-up of sodicity in the soilfor maintaining root-zone ESP below permissible limits, amending sodic water and sodicirrigation effects (chemically, organically) on soil and crop growth/performance and adopt-ing efficient crop-water/irrigation—soil health management technologies. Provision of ad-equate drainage (surface or sub-surface) to maintain proper water and salt-balance in theroot zone soil is a basic necessity for ensuring success of any saline or sodic irrigationproject (Kovda et al. 1973). Since there seems to be no single management measure tocontrol salinity and sodicity of irrigated soils, several practices interact with each otherand should be considered in an integrated manner (Gupta and Abrol 1990; Minhas andBajwa 2001; Choudhary et al. 2011b).

Efficient Water Management for Sustainable Agriculture 65
Crop Selection
Several reports on the use of sodic waters for crop production (Kanwar and Kanwar 1971;Bhumbla et al. 1972; AICRP-saline water 1972-89; Ayers and Westcot 1985; Minhas andGupta 1992; Minhas and Bajwa 2001; Minhas 2012) show that selection of suitable cropsand their varieties capable of producing high yields and economic returns under varyinglevels of soil Na saturation is a fundamental factor for achieving sustainable high agricul-tural productivity under sodic irrigation system. This is mainly because crops differ intolerance to soil salinity and sodicity/alkalinity (Mass and Hoffman 1977; Ayers andWestcot 1985 and Minhas and Gupta 1992), which may form the basis of selection ofcrops for growing on soils irrigated with varying levels of sodicity in water.
Gupta and Abrol (1990) proposed the upper permissible ESP limits for differentcrops as: 10–15 for deciduous fruits, nuts, citrus, avocado, safflower, black gram, peas,lentil and pigeon pea; 16–20 for chickpea and soybean; 20–25 for clover, groundnut,cowpea, onion and pearl-millet; 25–30 for linseed, garlic and cluster beans; 30–50 foroats, mustard, cotton, wheat and tomatoes; 50–60, for beets, barley, and Sesbania; and 60–70 for rice. Most of these crops, however, show varying levels of sensitivity to increasinglevels of alkalinity in soil at different growth stages (germination, early seedling develop-ment, and reproductive and grain formation). This information can help in deciding aboutcrop-management options and planning scheduling the timing of sodic irrigations duringthe growing period of crops. Choudhary et al. (1994, 1996a,b) reported that wheat andbarley plants possessing penetrative root systems could produce high yields even at anESP of 40-50 in 0-30 cm soil developed due to long-term irrigation with sodic waters.
Major problems occur due to nutritional imbalance in soil-plant system as a result ofsevere reduction in Ca concentration (below 2 meq L-1) in soil solution (Rhoades et al.1992) with increase in alkalinity and Na saturation in soil. Sodicity tolerance of cropplants also depends upon the ability of plant-roots to exclude Na and absorb nutritionallyadequate amounts of Ca (otherwise deficient under sodic soil environment). Crops havinghigher tolerance to soil Na saturation have also been reported to maintain relatively higherCa/Na and lower Na/K ratios in shoots (Bajwa and Bhumbla 1974; Bajwa 1982; Choudharyet al. 1996b) by restricting Na absorption (Gill and Qadir 1998).
Varieties of crops having high yield potential even under higher levels of soil alka-linity should be preferred over those having lower yield potential. A typical example isthat of high yielding wheat cultivar PBW-343 that can produce high yield even withirrigation waters having RSC up to 6.5 meq L-1 without any substantial loss in grain yieldand grain quality (Choudhary et al. 2007, 2012). In addition, crops having low irrigationrequirement should be preferred, whereas high irrigation requiring crops should be avoided(Minhas and Gupta 1992). Long-term experiments show much greater reduction in produc-tivity of sodic irrigated wheat grown after high irrigation requiring rice crop (Fig. 3) ascompared to that grown after lower irrigation requiring millet and cotton crops.
Since the build-up of ESP under sodic irrigation system is maximum in the surfacesoil and it decreases with depth (Bajwa and Josan 1989a,b,c; Choudhary et al. 2004),adequate information needs to be generated about tolerance and production-efficiency of

66 Bulletin of the Indian Society of Soil Science, No. 29
different crops (varying in rooting-behaviour) in soils undergoing sodification due to long-term sodic irrigation.
Predicting Sodic Irrigation Effects on Crop Productivity
Effects of sodic irrigations on soil Na saturation and crop production have beenextensively reported (Bower et al. 1968; Manchanda et al. 1982, 1985; Ayers and Westcot1985; Minhas and Gupta 1992; Minhas and Bajwa 2001; Choudhary et al. 2006, 2011a).Our ability to predict the level of performance of different crops grown in different crop-ping-systems over the years, under long-term sodic irrigation can be of great significancefor planning about selection of crops and cropping systems and deciding about crop-soil-water management options so as to achieve sustainable high crop productivity.
In a long-term field study, Bajwa and Josan (1989a,b,c) and Bajwa et al. (1992)observed decline in productivity of rice-wheat, maize-wheat and cotton-wheat croppingsystems to be significantly related with increase in alkalinity of water. Using best-fitquadratic relationships between adj.SARiw and crop yields, curves drawn for predicting10, 25 and 50% crop yields with respect to good quality water are shown in fig. 4. Suchtypes of curves can be useful for making recommendations about the years up to which itwill be possible to sustain the desired level of productivity. Based upon these data theadj.SARiw values can be predicted for sustaining 90, 75, 50% relative yields of rice-wheat, millet-wheat and cotton-wheat cropping systems irrigated with sodic water (Fig. 5).
USE OF AMENDMENTS
Chemical Amendments
The adverse effects of irrigation with sodic water on physico-chemical properties of soilscan be mitigated by the application of amendments containing Ca such as gypsum oracidifying materials to dissolve native calcite. Application of gypsum has commonly been
Fig. 3. Relative wheat yields under sodic water irrigation (w.r.t good quality water) after different cropsin rotations

Efficient Water Management for Sustainable Agriculture 67
Fig. 4. Best-fit quadratic relationships of observed yields and adj.SARiw for 9 years of thestudy, curves drawn for predicting 10, 25 and 50% crop yields w.r.t. those obtainedunder good quality water (Source: Bajwa and Josan 1989b)
recommended when RSC of the irrigation water exceeds 2.5 meq L-1 (Bhumbla and Abrol1972; Ayers and Westcot 1976). Reports by Gupta (1980), Sharma and Mondal (1981) andAICRP-saline water (1985) show no response to applied gypsum under fallow-wheat sys-tem receiving irrigation water having up to RSCiw of 10 meq L-1. Bajwa and Josan(1989a) observed that application of gypsum to supply 2.5 and 5.0 meq L-1 Ca in sodicirrigation water was sufficient to maintain high wheat and rice yields. In a 6 years long-
Fig. 5. Adj.SARiw levels for sustaining 90, 75 and 50% crop yields.

68 Bulletin of the Indian Society of Soil Science, No. 29
term field study on a sandy loam soil, Bajwa et al. (1993) concluded that for the millet-wheat-maize rotation, application of gypsum was significantly more effective under sodicirrigation (RSC 9.5, EC 1.6 dS m-1, SAR 12) than that under saline-sodic irrigation (EC2.9 dS m-1, RSC 9.5 meq L-1, SAR 29). Above reports suggest that for achieving sustain-able high crop productivity, gypsum has to be used to amend sodic irrigation effects onsoils and plant growth. However, the factors such as the level of sodicity and salinity inwater and soil, degree of soil deterioration, cropping intensity and the depth of irrigationapplied to the crops will ultimately decide on the amount of gypsum required.
Sharma et al. (2001) applied graded doses of gypsum varying from 12.5 to 100% ofgypsum requirement (GR) to evaluate its impact on sustainability of rice and wheat yieldsin the sodic-water-irrigated soils. Sustainable yield index varied from 0.57 to 0.65 in riceand 0.54 to 0.65 in wheat (Table 1). It clearly suggests that 50% GR is sufficient to obtainsustainable rice and wheat yields, at par with crop yields obtained at higher rates ofapplied gypsum and yields are also comparable with those obtained under canal waterirrigation.
Choudhary et al. (2004) reported that when gypsum was applied to neutralize theRSC to 2.5 meq L-1, both under sodic and saline-sodic waters, ESP of the soil decreased
Table 1. Crop yield and sustainable yield index (SYIa) for rice and wheat as affected by rate of gypsumapplication under sodic water irrigation (Sharma et al. 2001)
Treatments Gypsum Crop yield (t ha-1) Sustainable yield index (SYI)(% GRb) applied Rice Wheat Rice Wheat
(t ha-1)0 0 4.01 3.55 0.57 0.5412.5 1.25 4.22 3.75 0.60 0.6025.0 2.50 4.13 3.68 0.60 0.5850.0 5.00 4.26 3.82 0.61 0.6275.0 7.50 4.22 3.83 0.62 0.62100.0 10.00 4.48 3.94 0.62 0.63Canal water Nil 4.46 3.85 0.65 0.65LSD (P = 0.05) 0.24 0.16
a SYI = (Y-S)/Ymax, where Y – average yield; S – standard deviation; Ymax – the maximum yield in thestudy area (6 t ha-1 for rice and 5 t ha-1 for wheat)b GR – Gypsum requirement
(Fig 6). Long-term irrigation with saline-sodic water (RSC 10 meq L-1, SAR – 31.2, EC –2.90 dS m-1) resulted in higher buildup of Na and soluble salts compared to sodic (RSC-10 meq L-1, SAR – 19.8, EC – 1.43 dS m-1) water. Due to higher electrolyte concentration,more Na moved to deeper layers and higher values of ESP in soil layers were observedunder the saline-sodic water treatment (Fig. 6b) than that under sodic water treatments(Fig. 6a). Application of farmyard manure had a complimentary effect on efficiency ofgypsum in reducing the ESP of soil, although it was less efficient than gypsum whenapplied alone.

Efficient Water Management for Sustainable Agriculture 69
Time of gypsum application: In long-term field studies under maize-wheat and rice-wheat systems, Bajwa et al. (1983) and Bajwa and Josan (1989a) observed that sodicirrigation significantly decreased crop productivity, which was significantly increased withthe application of gypsum. Gypsum applied in soil at each irrigation with sodic water(RSC 8 meq L-1) was more effective in increasing yields of maize in maize-wheat rotationas compared to its cumulative dose applied before sowing each crop in the rotation. Atlower level of RSC in water (RSC 6.8 meq L-1), crop responses to gypsum either applied asone dose or at each irrigation were similar. With higher RSC water (RSC 10.3 meq L-1)while the improvement in wheat yield was similar for both the modes of gypsum applica-tion, but high irrigation-requiring rice crop (higher build up of ESP in soil) respondedbetter to gypsum (Fig. 7) when it was applied with each irrigation (Bajwa and Josan1989a).
Yadav and Kumar (1994) observed that gypsum application before the onset ofmonsoons (rainy season) was better than its application before pre-sowing irrigation ofrabi crops and at each irrigation. Pyrites has also been used for amending the deleteriouseffects of high RSC waters. Minhas (2012) also reported that under rice-wheat systemgypsum applied every year was better than that after 3 years.
SODIC WATER FOR SODIC SOIL RECLAMATION
In many arid and semi-arid regions, there are areas where good quality water may be eitherinadequate or not available but sodic groundwater is available. Under such situations,farmers may have no other choice but to use even these poor quality sodic waters for thereclamation of sodic soils. Use of such types of waters can be expected to affect thedissolution rate of gypsum (Dutt et al. 1972; Singh and Bajwa 1991) and alter its effi-ciency for amelioration of sodic irrigation effects on soil and crop production.
Fig. 6. Depth-distribution of ESP (0-60 cm) as affected by (a) sodic and (b) saline-sodic irrigation after10 years (1989-90 to 1998-99)(Source: Choudhary et al. 2004)

70 Bulletin of the Indian Society of Soil Science, No. 29
Sharma and Manchanda (1989) observed that crops in millet-wheat rotation can besuccessfully raised with sodic irrigation provided ESP of the sodic soil is maintainedbelow 15-20 with the use of gypsum @ 100% of GR of the sodic soil. Yadav et al. (1991)reported that for sodic water (RSC 12 meq L-1) irrigated crops like pearl-millet, mung-bean, cowpea and pigeon-pea, application of gypsum @ 50% of GR on a loamy sand sodicsoil was appropriate. Joshi and Dhir (1991) showed that application of gypsum (at 100%GR) in sodic soil plus that required to neutralize RSC in applied irrigation water during 2years resulted in moderate production of wheat and mustard in the second year.
Singh and Bajwa (1991) observed that increasing levels of sodicity in water in-creased ESP in soil, irrespective of gypsum levels (at 33, 67 and 100% of GR) applied forinitial sodic soil reclamation. The increase in ESP was particularly much higher where nogypsum had been applied (at each irrigation) for sodic water amelioration. In the absenceof gypsum for sodic water amelioration, application of even higher levels of gypsum forinitial sodic soil reclamation could not control the increase in build-up of ESP (Fig. 8) insoil to the levels similar to that obtained under good quality water (GW) irrigation treat-ment. But, irrespective of gypsum levels applied for sodic soil reclamation, gypsum ap-plied at each irrigation decreased the ESP values in soil, which resulted in significantimprovement in growth of rice and wheat crops to the levels that were almost similar tothose observed under GW treatment.
This suggests that when sodic water has to be used for reclamation of sodic soils,additional amount of gypsum (more than that required for initial sodic soil reclamation)should be applied to neutralize residual alkalinity in irrigation water and control the build-up of ESP in soil and sustain high crop productivity.
Using gypsum in water courses : Passing sodic water through water-courses/chan-nels and beds containing gypsum (fragments or rock) has been reported to be quite effec-tive in decreasing alkalinity in water (Pal and Poonia 1979). The solubility of gypsum andits effectiveness, however, depends upon size of fragments and flow rate, salt content andionic composition of water (Kemper et al. 1975). Calcium picked up by sodic water
Fig. 7. Relative grain yield of rice and wheat with gypsum levels and time of application

Efficient Water Management for Sustainable Agriculture 71
flowing through gypsum beds mostly varies (3 to 5 meq L-1) but it seldom exceeds 8 meqL-1 (Singh et al. 1986). Significant higher crop-responses under bed application of gyp-sum, compared with its soil application, have been reported in the All India CoordinatedResearch Project - Saline Water (2002). In long-term experiment, Minhas et al. (2004)observed that whereas the decline in ESP was almost similar under both bed and soilapplication of gypsum, but rice crop responded better to the bed application treatment(Fig. 9). This practice can help in minimizing costs (grinding, bagging and storage) andobtaining higher economic returns.
Using organic materials: For the amelioration of sodic irrigation effects on soil andcrop productivity application of gypsum as a source of Ca is a common recommendation.In addition, CaCO3 and other minerals inherently present in the soil can also becomeimportant sources of Ca if their dissolution can be increased in the soil. This can be
Fig. 8. Effect of sodic irrigation in a sodic soil and gypsum on ESP(Source: Singh and Bajwa 1991)
Fig. 9. Effect of bed and soil application of gypsum on productivity (t ha-1) ofcrops irrigated with sodic water

72 Bulletin of the Indian Society of Soil Science, No. 29
achieved by incorporating different organic materials, whose decomposition results inincreasing the partial pressure of CO2 and concentration of organic acids in soil solution,which in turn increases the solubility of CaCO3 and other minerals (Ponnamperuma 1972;Ugoloni and Sletten 1991; Choudhary et al. 2006, 2011a). Calcium mobilized in this waycan greatly help in off-setting the adverse sodic irrigation impacts on soil (Choudhary etal. 2011a).
Increase in organic matter can also help in counteracting the process of Na accumu-lation on soil (Poonia et al. 1984). Application of gypsum and organic amendments posi-tively influenced microbial biomass carbon in soils irrigated with sodic water (SW) (Kauret al. 2008). Thus, improvement in bio-chemical and physical properties and fertility of thesoil will be the added advantage. Dhankar et al. (1990) also reported an increase in yieldsof sodic irrigated crops with FYM and gypsum application.
Sekhon and Bajwa (1993) carried out a salt balance study using lysimeters underrice-wheat-maize (fodder) system on a calcareous soil irrigated with sodic water. Increasein sodicity in water increased the soil pH and Na saturation and decreased the cropgrowth. Application of increasing levels of gypsum decreased the ESP and improved thecrop growth. Incorporation of organic materials (green manure, farmyard manure and ricestraw) under increasing levels of applied gypsum increased the removal of Na in drainagewater, reduced the precipitation of Ca and carbonates, decreased the pH and ESP in thesoil (Fig. 10) and improved the growth of rice-wheat-maize cropping system. Dry matterproduction of all the crops was higher under green manure treatment followed by FYMand rice straw. The results indicated that incorporation of organic materials can help indecreasing the quantity of gypsum required for controlling the adverse impact of sodicirrigation on soil properties and enhancing crop productivity.
Fig. 10. Effect of sodic irrigation, gypsum and organic materials on soil ESP(Source: Sekhon and Bajwa 1993)

Efficient Water Management for Sustainable Agriculture 73
In a 15-year long field experiment initiated on the basis of the results of the study ofSekhon and Bajwa (1993), Choudhary et al. (2011a) observed that continual sodic irriga-tion resulted in the gradual increase in soil pH and ESP in a calcareous sandy loam soil.This caused a cumulative yield loss of 1.5 t ha-1 in rice-wheat system for 9 years ofcropping, and thereafter, the loss in crop yield was greater (Fig. 11).
Application of organic materials such as wheat straw, FYM, and green manuringwith Sesbania aculeata led to mobilization of Ca2+ from CaCO3. This eliminated the needof gypsum for controlling the harmful effects of sodic waters in calcareous soils and
Fig. 11. Cumulative yield loss in response to sodic water irriga-tion compared to good quality canal water over years(Source: Choudhary et al. 2011a)
sustained yields of rice and wheat. Application of wheat straw before rice transplanting,although was less effective than farmyard manure and green manure treatments in increas-ing rice yield over the un-amended soil under sodic water treatment (Fig. 12) but it was atpar with green manuring in its residual effect on the productivity of following wheat.
In another long-term field experiment under sugarcane crop, Choudhary et al (2004)observed farmyard manure to be more effective under saline-sodic (38% increase) thanunder sodic water irrigation (23% increase).
The combined effects of gypsum and manure applied together were, however, ben-eficial only under sodic water irrigation. Relative to good quality water irrigation treat-ment, there was no decline in yield up to an ESP level of 12, beyond which a significantreduction in cane yield occurred. Under long-term sodic water irrigation an ESP of 10-12could be maintained through combined application of gypsum and manure. In case ofsaline-sodic irrigation, sugar yield under farmyard manure treatment (10.8 t ha-1) wasequivalent to that under the gypsum plus manure treatment but was significantly higherthan that under the gypsum treatment (9.0 t ha-1). This suggests that cane and sugar yieldswith good quality juice can be sustained by applying gypsum/farmyard manure or bothunder sodic and only farmyard manure under saline-sodic water irrigation.

74 Bulletin of the Indian Society of Soil Science, No. 29
Fertility Management
Under sodic irrigation system and in sodic soils availability of nutrients and cropresponses to applied fertilizers are controlled by the level of alkalinity build up in the soil,forms in which nutrients are present in soil, different loss mechanisms, transformations ofapplied nutrients, and ionic interactions effects on the absorption of nutrients by plants.Soils of the arid and semi-arid regions are almost universally low in organic matter anddeficient in available nitrogen, with crops responding significantly to applied nitrogenousfertilizers. The efficiency of applied fertilizer N is, however, low in alkali soils and thesoils undergoing sodification (increasing alkalinity) because of the extensive losses mainlythrough ammonia volatilization (Singh and Bajwa 1987). Losses as high as 40% wereobserved under soils receiving irrigation waters having 15 meq L-1 RSC (Singh and Bajwa1990).
Therefore, 25% higher fertilizer is recommended in sodic environment comparedwith the normal soil conditions. However, extent of crop responses decreases with in-crease in sodicity in the soil. For sustaining high crop production-efficiency per unit ofapplied N-fertilizer, growth-limiting high level of sodicity factor has to be corrected andlosses have to be minimized by applying fertilizer at some depth in the soil or surface-applied fertilizer should be mixed in the soil by hoeing. To increase N-use efficiency,splitting of fertilizer-N to match crop demands, deep placement of fertilizer and use ofslow release N-fertilizers have been found to be successful. Bajwa and Singh (1992)observed that under flooded alkali soil conditions, urea, ammonium sulphate and ammo-nium chloride placed in reduced zone produced similar rice yields whereas nitrate-contain-ing fertilizers were appreciably inferior (Table 2). In case of wheat, effectiveness of
Fig. 12. Relative crop yields under sodic water irrigation, gypsum and organic amend-ments averaged over six years (2000-2005) (Source: Choudhary et al. 2011a)

Efficient Water Management for Sustainable Agriculture 75
fertilizers containing both NH4+-N and NO3
--N was similar.
The reclamation of sodic soils has been found to decrease the ammonia volatilizationlosses. A better strategy seems to be to substitute a part of inorganic fertilizer requirementsthrough organic materials. A large pool of NH4
+ liable to be lost through volatilization isbound with organic forms andsubsequently by the organicallybound N is released to crops dur-ing its growing season.
Long-term irrigation withsodic water increases alkalinity(mainly carbonates of Na) andprecipitation of Ca as CaCO3 insoil, because of which solubilityand availability of micronutrientcations viz. Zn, Mn, Fe and Cuis controlled by the carbonateequilibria in the soil solution.Sodic soils and the soils under-going sodication are mostly deficient in these nutrients,Bajwa et al. (1992) observed that nine years of sodic irrigations caused significant declinein DTPA-extractable micronutrients in the soil. This decline was more pronounced in thesoil under rice-wheat than that under millet-wheat crop rotation. Soil application of Zn andfoliar applications of Fe and Mn are recommended for sustaining high productivity ofcrops irrigated with sodic waters.
IRRIGATION MANAGEMENT
Conjunctive Use of Poor and Good Quality Waters
In arid and semi-arid regions, canal water supplies are most often not assured or arein short supply. Farmers of these regions are forced to use saline/sodic waters to meet cropwater requirements. Available option is to practice conjunctive use of salty and freshwater, either by blending with better quality water (Meiri and Plaut 1985) or using themseparately in cyclic mode. Minhas and Gupta (1992) showed that different quality waterscan be blended in the supply network making tailor-made water available for each cropand all soil conditions. Blending is promising in areas where freshwater supplies can bemade available on demand. The proportion of blending two different water supplies (canaland sodic water) depends on the crops to be grown, extent of sodicity of water and freshwater supplies and economically acceptable yield reductions.
Allocation of the two waters separately, if available on demand, can be done todifferent fields, seasons or crop growth stages so that salinity/sodicity stresses are mini-mized during sensitive growth stages in the crop. Therefore, the cyclic use of multi-qualitywaters can be made inter- or intra-seasonal (Minhas et al. 2007b). Shelhevet (1984) andMinhas and Gupta (1992) stated that cyclic use is more common and offers several advan-tages over blending. Better quality water can be used for pre-sowing and early stages of
Table 2. Effect of different sources of N on grain yields (t ha-1)of rice (150 kg N ha-1) and wheat (120 kg N ha-1)grown on a sodic soil
Fertilizer Rice Wheat
Urea 8.04 4.22Calcium ammonium nitrate 7.14 4.12Ammonium sulphate 7.57 4.07Ammonium chloride 8.04 -Potassium nitrate 4.50 4.18Control 3.01 2.23CD (P=0.05) 0.53 0.34
Source: Bajwa and Singh (1992)

76 Bulletin of the Indian Society of Soil Science, No. 29
crop growth and then switching to sodic water later on when the already established cropis able to tolerate relatively higher salinity/sodicity levels. Phogat et al. (2011) observedthat cyclic use strategy for saline and canal water resulted in higher water use efficiencyand crop yields than blending the two water qualities. Rhoades et al. (1992) advocated theseasonal cyclic use, called ‘dual rotation’ strategy where non-saline non-sodic water isused for salt/sensitive crops/initial stages of tolerant crops to leach out the accumulatedsalts from irrigation with salty waters to previously grown tolerant crops. Sharma andMinhas (2005) stated that this strategy may work better in arid climate with very lowrainfall but it is of natural occurrence in the monsoonal climate. Moreover, crop produc-tion can be optimized from the same total water supply if the two water sources are usedsequentially rather than blending the two. Blending of two types of waters also requiresthe creation of additional facilities.
Minhas et al. (2007b) evaluated the sustainability yield index (calculated as SYI =(Y-S)/Ymax where’Y’ is the average yield and ‘S’ the standard deviation) of rice and wheatwhen sodic and good quality waters were used either by blending or by their alternateinter- or intra seasonal use, ranged between 0.52-0.75 and 0.79-0.95 for rice and wheat,respectively. Marginal improvements in the yield index with cyclic uses over blendingindicate a higher sustainability with the former.
For crops sensitive at germination stage, cyclic strategy involving sodic water (SW)should address problem of seedling emergence due to crusting by pre-sowing irrigationwith good quality canal water (CW). Bajwa and Josan (1989c), Choudhary et al. (2006)and Choudhary and Ghuman (2008) reported that alternating irrigations with GW and SWmaintained relatively lower ESP in soil, reasonably good physical condition of soil andhelped in sustaining high crop yields (Table 3).
Winter crops like wheat and sunflower can be grown reasonably well even with pre-sowing irrigation using sodic water. These crops respond to the total proportion of sodicwater applied rather than the order of sodic water and canal water used in a cyclic strategy
Table 3. Effect of cyclic use of sodic and canal water on crop yields (t ha-1) under various crops andcropping systems
Irrigation Rice-wheata Cotton-wheatb Cotton-sunflowerc
treatments Rice Wheat Cotton Wheat Sunflower
Canal water (CW) 6.78 5.43 1.32 5.20 3.28Sodic water (SW)@ 4.17 3.08 0.95 4.43 2.552CW:SW# 6.67 5.22 1.26 5.10 2.99CW:SW 6.30 5.72 1.21 4.95 2.88CW:2SW 5.72 4.85 1.15 4.70 2.67SW:2CW 1.22 4.82 3.01SW:CW 1.08 4.70 2.802SW:CW 1.02 4.75 2.69CD (P=0.05) 0.60 0.50 0.18 0.21 0.22
a 1981-1985; b & C 1996-2002: @ RSC > 5 mmolc L-1
# Cyclic use of 2 irrigations with canal water followed by one with sodic water

Efficient Water Management for Sustainable Agriculture 77
(Choudhary et al. 2006; Choudhary and Ghuman 2008) (Table 3). These results are ofconsiderable agronomic significance when canal water supplies progressively decreasefrom the head reach to the tail reach in a canal command (Tyagi 2003) and may not beavailable at the time of sowing of a crop. Furthermore, occasional application of farmyardmanure and gypsum in combination with alternate irrigation with saline-sodic (SAR >10,RSC >2.5 mmolc L-1) and fresh water in cyclic manner could effectively reclaim saline-sodic soils following rice–wheat crop rotation (Murtaza et al. 2009). The proposed strat-egy offers the additional advantage of integrated water resources management by usinglow quality water for soil reclamation while saving better-quality water for producinghigh-value crops.
Higher proportions of sodic water used in blending/cycle can also degrade the qual-ity of the harvested product. Examples include a reduction in potato grade and weight lossduring storage as well as the smaller seeds and lower oil content in the case of sunflower(Chauhan et al. 2007).
Irrigation Intervals
Application of light and frequent irrigations is a common recommendation for rais-ing crops on saline and sodic soils (Minhas and Gupta 1992; Sharma 2008). This helps inmaintaining favourable moisture conditions and proper salt-balance in the root zone soiland in turn minimizing the adverse osmotic and toxic-ion effects on plant growth. How-ever, under arid conditions, higher transpiration rates from wetter soils kept closer to fieldcapacity due to frequent saline irrigations may lead to increased salinity in the soil solution(1.5 to 2.0 folds), thereby taking away the benefits of higher irrigation frequency (Sinhaand Singh 1976a,b). In a six years long-term study on a sandy loam soil, Bajwa et al.(1993) reported that crop responses to shorter irrigation intervals [depth of irrigation @ 4,6.7 and 10 cm at every irrigation (ei) under fixed total depth of irrigation] involving sodicwater depended upon the season in which crop was grown. Wheat and millet crops grownduring winter and monsoon climatic conditions did not show significant differences inproductivity under different frequencies of irrigation (Fig. 13). But maize fodder cropgrown during hot summer season responded significantly to increasing frequency of irriga-tion, mainly because of moderation of soil temperature and maintenance of favourableroot-zone soil moisture regime during the period of high evapotranspiration-demand. Ef-fectiveness of applied gypsum (applied to neutralize RSC) on ESP was almost similarunder different irrigation intervals but this was also superior in raising crop productivityunder shorter irrigation intervals.
LEACHING REQUIREMENT FOR MAINTAINING ROOT ZONE SALINITY
Leaching requirement is the minimal fraction of total water applied that must pass throughthe root zone to prevent the reductions in crop yields below the acceptable level. A generalrecommendation is the application of excessive water to meet the leaching requirementand maintain a desirable salt balance in the soil. In drier arid areas with low rainfall, 15-20% more water at each irrigation should be applied while crops are irrigated with salinewater to promote leaching as compared to good quality water. This may not be the case in

78 Bulletin of the Indian Society of Soil Science, No. 29
areas with monsoon type climate (Minhas and Gupta 1992; Minhas 1996). While usingsaline-sodic water (ECw = 3.2 dS m-1, SAR = 21 and RSC > 4 meq L-1), Bajwa et al.(1983) and Bajwa and Josan (1989b) observed about 30-50% higher salinity and sodicitybuild up even in light textured soil, when 50% extra water was applied to meet theleaching requirement in rice-wheat and maize-wheat systems in monsoonal South Asia.The general strategy to use more efficiently the monsoon rainwater for leaching andreduce the salt build up in the root zone soil seems to be more useful in areas receivingmore than 400 mm rainfall. However, in the event of sub-normal rainfall year, a heavy pre-sowing irrigation with good quality water should be applied so that the accumulated saltsduring the preceding rabi season are pushed beyond the root zone (Minhas and Gupta1992).
Method of Irrigation
The distribution of water and salts varies with the method of irrigation. The methodadopted should create and maintain a favourable salt and water regimes in the root zonesoil so that water is readily available to plants without affecting growth and yield.
Surface irrigation (less than 40% efficiency) and irrigation in furrows (<60-70%efficiency) generally result in excessive losses of water. High energy pressurized irrigationmethods such as sprinkler and drip are typically more efficient (>90% efficiency) as thequantity of water to be applied can be adequately controlled, unlike surface irrigationsystems. Sprinklers help distribute water uniformly even on undulating soils and thosewith variable infiltration rates due to soil type variability. Sprinklers also increase theefficiency of salt leaching (Minhas and Gupta 1992). Saline/sodic water used throughsprinklers, however, may cause leaf burn due to accumulation of toxic quantities of salts.This is particularly true for sensitive crops that exhibit high rates of foliar salt absorptionduring periods of high evaporative demand.
Fig. 13. Effect of irrigation intervals and gypsum on crop yields (Source: Bajwa et al. 1993)

Efficient Water Management for Sustainable Agriculture 79
Drip irrigation can help in regular and frequent water applications. Kahlon et al.(2004) and Rajak et al. (2006) reported that crops perform better using this system asopposed to others because lower soil-water salinity is maintained near the drip emitterwhere root density is high. It also avoids leaf wetting and injury to plants. Drip-irrigatedcrops have also been found to show higher water uptake by their roots resulting in higherwater use efficiency and yield of vegetables. Recently, while using waters having highresidual alkalinity for irrigating tomatoes, Choudhary et al. (2010) reported superiority ofthe drip system over furrow irrigation on yield, size and quality of fruits.
GUIDELINES FOR USING SODIC WATERS
Bhumbla and Abrol (1972) reported that water can be considered safe for irrigationof field crops when RSC is less than 2.5 meq L-1 and above this level of RSC amendmentlike gypsum is needed. Singh and Singh (1971) and Gupta (1980) observed that watershaving RSC up to 7.5 meq L-1 are being used safely under fallow (during monsoon)-wheat.In 1990, recommendation for waters (RSC <2.5 meq L-1, EC <4 dS m-1) jointly by AICRP-Saline Water, Central Soil Salinity Research Institute, Haryana Agricultural Uuniversityand Punjab Agricultural University are given in table 4.
These guidelines are being followed by the soil and water testing laboratories indifferent agro-climatic regions of India. More recently, Minhas and Sharma (2006) gavepermissible limits of sodicity in water in terms of adj.RNa for using these sodic watersunder different rainfall regions and cropping systems (Table 5).
Table 4. A Joint recommendation of AICRP-Saline Water, CSSRI, HAU, PAU (1990)
Upper limit*Soil texture (% clay) RSCiw SARiw
Fine (>30%) 2.5-3.5 10Moderately fine (20-30%) 3.5-5.0 10Moderately coarse (10 —20%) 5.0-7.5 15Coarse (< 10%) 7.5-10.0 20* Remarks:1. These limits are for kharif fallow –wheat and rainfall 350-550 mm.2. When water has Na< 75%, Ca+Mg <25%, and rainfall > 550 mm upper limits of RSC are safe.3. For double cropping use gypsum, avoid growing rice.4. Textural class for all soil layers is up to 1.50 m depth.5. With hard-pan in profile — next finer textural class has to be considered.
For meeting site-specific water quality objectives, these guidelines have to be fol-lowed keeping in view that specific effects and degree of sodicity hazards will dependupon residual alkalinity and SAR of irrigation water, depth of sodic water applied, crops/cropping systems followed, soil properties (texture, CaCO3, hard-pan, etc.), efficiency incrop-water-soil health management, ground water behaviour and drainage conditions, andclimatic conditions.

80 Bulletin of the Indian Society of Soil Science, No. 29
In addition to these guideline following practices also need to be adopted.
Field should be leveled to ensure uniform irrigation and leaching of salts. Undersaline sodic water irrigation (high SAR and high EC) gypsum should be applied afterleaching excess soluble salts with good quality water or after monsoon rains. Practice ofmulching which can help in conservation of soil moisture, controlling the formation ofsurface crust and ensuring better seed germination should be followed. For sustaining highcrop productivity and economic returns efficient and integrated crop-water-soil healthmanagement is most important for maximizing crop production—efficiency per unit ofinputs (seed, water, amendments, fertilizers, pesticides, energy).
For sustaining high crop production-efficiency and maximizing economic returnsunder the conditions of sodic irrigation an integrated crop-water-soil management ap-proach has to be followed. Emphasis should be on making a mix of site-specific appropri-ate initiatives for tackling challenges on multiple fronts at the same time.
References
AICRP-Saline Water (1972–2006) Annual Progress Reports. All India Co-ordinated Research Projecton Management of Salt-affected Soils and Use of Saline Water in Agriculture, CSSRI, Karnal.
Ayers, R.S. and Westcot, D.W. (1985) Water quality for agriculture. Irrigation Drainage Paper 29,Rev. 1, FAO, Rome, Italy, p. 174.
Bajwa, M.S. (1982) A study on the salt and sodium tolerance of rice. Journal of AgriculturalScience Cambridge 98, 475-482.
Bajwa, M.S. and Bhumbla, D.R. (1974) Growth and cation absorption by plants under differentlevels of sodium. Indian Journal of Agricultural Sciences 44, 598-601.
Bajwa, M.S. and Josan, A.S. (1989a) Effect of gypsum and sodic irrigation water on soil and cropyields under rice-wheat rotation. Agricultural Water Management 16, 53-61.
Bajwa, M.S. and Josan, A.S. (1989b) Prediction of sustained sodic irrigation effects on soil sodiumsaturation and crop yields. Agricultural Water Management 25, 217-228.
Bajwa, M.S. and Josan, A.S. (1989c) Effect of alternating sodic and non sodic irrigations on thebuild-up of sodium in the soil and on the crop yields in northern India. Experimental Agricul-ture 25, 199-205.
Bajwa, M.S. and Singh, B. (1992) Fertilizer nitrogen management for rice and wheat crops grown inalkali soils. Fertiliser News 37(8), 47-59.
Table 5. Permissible limits of adj RNa in irrigation water
RainfallCropping system <40 cm 40 60 cm >60 cmFallow - wheat 16 21 27Maize/Millet - wheat 14 17 23Rice - wheat 6 9 14Cotton-wheat 14 20 26

Efficient Water Management for Sustainable Agriculture 81
Bajwa, M.S., Choudhary, O.P. and Josan, A.S. (1992) Effect of continuous sodic and saline-sodicwaters on soil properties and crop yields under cotton-wheat in northern India. AgriculturalWater Management 22, 345-350.
Bajwa, M.S., Hira, G.S. and Singh, N.T. (1983) Effect of continuous irrigation with sodic andsaline-sodic waters on sodium accumulation and maize and wheat yields in northern India.Irrigation Science 4, 91-99.
Bajwa, M.S., Josan, A.S. and Choudhary, O.P. (1993) Effect of frequency of sodic and saline-sodicirrigations and gypsum on the build-up of sodium in soil and crop yields. Irrigation Science14, 21-26.
Bajwa, M.S., Josan, A.S., Hira, G.S. and Singh, N.T. (1986) Effect of sustained saline irrigation onsoil salinity and crop yields. Irrigation Science 7, 27-35.
Bajwa, M.S., Singh, N.T. and Randhawa, N.S. (1974) Chemical composition of underground watersof Punjab. Journal of Research, Ludhiana 10, 433–437.
Bajwa, M.S., Singh, N.T., Randhawa, N.S. and Brar, S.P.S. (1975) Underground water quality mapof Punjab state. Journal of Research, Ludhiana 12, 117-122.
Bhumbla, D.R. (1969) Water quality and use of saline water crop production. In Symposium on Soiland Water Management, Hisar, March 11-13, 1969.
Bhumbla, D.R. and Abrol, I.P. (1972) Is your water suitable for irrigation – get it tested. IndianFarming 21, 15-16.
Bhumbla, D.R., Abrol, I.P., Bhargava, G.P. and Singhla, S.K. (1972) Soils of the experimental farm.Karnal Bulteins. 1, CSSRI, Karnal 50 pp.
Bower, C.A. (1961) Prediction of the effects of irrigation water on soil. In Proceedings of TeheranSymposium on Salinity Problems in Arid Zones. UNESCO. pp 1-8.
Bower, C.A. and Maasland, M. (1963) Sodium hazard of Punjab ground waters. In Proceedings ofSymposium on Waterlogging and Salinity in West Pakistan. 50, pp. 49-51.
Bower, C.A., Ogata, G. and Tucker, J.M. (1968) Sodium hazard of irrigation waters as influenced byleaching fraction and by precipitation or solution of calcium carbonate. Soil Science 106, 29–34.
Chauhan, S.K., Chauhan, C.P.S. and Minhas, P.S. (2007) Effect of cyclic use and blending of alkaliand good quality waters on soil properties, yield and quality of potato, sunflower and Sesbania.Irrigation Science 26, 81-89.
Choudhary, O.P, Josan, A.S., Bajwa, M.S. and Kapur, M.L. (2004) Effect of sustained sodic andsaline-sodic irrigations and application of gypsum and farmyard manure on yield and qualityof sugarcane under semi-arid conditions. Field Crops Research 87, 103-116.
Choudhary, O.P. and Ghuman, B.S. (2008) Cyclic use of sodic and non-sodic canal waters forirrigation in cotton-wheat cropping system in a semi-arid region. Journal of Sustainable Agri-culture 32, 269-286.
Choudhary, O.P., Bajwa, M.S. and Josan, A.S. (1994) Characteristics of different wheat cultivars fortolerance to soil sodium saturation. Transactions of World Soil Science Congress 3 (b), 368-369.

82 Bulletin of the Indian Society of Soil Science, No. 29
Choudhary, O.P., Brar, J.S., Saroa, G.S. and Sekhon, K.S. (2012) Wheat response to increasinglevels of residual alkalinity in irrigation water in a semi-arid region. Journal of Crop Improve-ment 26, 802-815.
Choudhary, O.P., Dhindsa, G.S. and Josan, A.S. (2003) Screening of triticale germplasm for toler-ance to soil and water sodicity under semi-arid conditions. Triticale Topics 19(8), 6-12.
Choudhary, O.P., Ghuman, B.S. and Saroa, G.S. (2007) Response of ‘PBW 343’ wheat (Triticumaestivum) to increasing levels of residual alkalinity in irrigation water in semi-arid regions.Indian Journal of Agricultural Sciences 77, 150-153.
Choudhary, O.P., Ghuman, B.S., Bijay-Singh, Thuy, N. and Buresh, R.J. (2011a) Effects of long-term use of sodic water irrigation, amendments and crop residues on soil properties and cropyields in rice–wheat cropping system in a calcareous soil. Field Crops Research 121, 363–372.
Choudhary, O.P., Ghuman, B.S., Dhaliwal, M.S. and Chawla, N. (2010) Yield and quality of twotomato (Solanum lycopersicum L.) cultivars as influenced by drip and furrow irrigation usingwaters having high residual sodium carbonates. Irrigation Science (accepted), DOI 10.1007/s00271-010-02-y.
Choudhary, O.P., Ghuman, B.S., Josan, A.S. and Bajwa, M.S. (2006) Effect of alternating irrigationwith sodic and non-sodic waters on soil properties and sunflower yield. Agricultural WaterManagement 85, 151-156.
Choudhary, O.P., Gill, J.K. and Bijay-Singh (2013) Water-extractable carbon pools and microbialbiomass carbon in sodic water-irrigated soils amended with gypsum and organic manures.Pedosphere 23, 88-97.
Choudhary, O.P., Grattan, S.R. and Minhas, P.S. (2011b) Sustainable crop production using salineand sodic waters. In: Alternate Farming Systems, Biotechnology, Drought Stress and Ecologi-cal Fertilisation. (E. Lichtfouse Ed), Sustainable Agriculture Reviews 6: 293-318, DOI10.1007/978-94-007-0186-1, Springer Dordrecht, New York.
Choudhary, O.P., Josan, A.S. and Bajwa, M.S. (1996a) Rooting and yield relationships in differentbarley cultivars grown under increasingly soil sodicity stress conditions, Crop Improvement23, 1-11.
Choudhary, O.P., Josan, A.S. and Bajwa, M.S. (1996b) Tolerance of wheat and triticale to sodicity.Crop Improvement 23, 238-246.
Choudhary, O.P., Josan, A.S. and Bajwa, M.S. (2001) Yield and fibre quality of cotton cultivars asaffected by sustained sodic irrigations in semi-arid conditions, Agricultural Water Manage-ment 49, 1-9.
Dhanker, O.P., Yadav, H.D. and Yadav, O.P. (1990) Long-term effect of sodic water on soil deterio-ration and crop yields on loamy sand soil of semiarid regions. In National Symposium onWater Resource Conservation - Recycling and Reuse. Nagpur, February 3-5. pp. 57-60.
Dutt, G.R., Terkertoub, R.W. and Ranschkolb, R.S. (1972) Prediction of gypsum and leachingrequirement for sodium-affected soils. Soil Science 114, 93–103.
Eaton, F.M. (1950) Significance of carbonates in irrigation waters. Soil Science 69, 123-133.

Efficient Water Management for Sustainable Agriculture 83
Gill, K.S. and Qadir, A. (1998) Physiological aspects of salt tolerance, In Agricultural SalinityManagement in India (N.K. Tyagi and P.S. Minhas, Eds.), pp. 243-260.
Grattan, S.R. and Oster, J.D. (2003) Use and reuse of saline-sodic waters for irrigation of crops. InCrop Production in Saline Environments: Global and Integrative Perspectives (S.S. Goyal,S.K. Sharma, and D.W. Rains, Eds.). Haworth Press, NY, pp. 131-162.
Gupta, I.C. (1971) Quality of irrigation water in western Rajasthan and their utilization for growingsalt-resistant crops. Proceedings of All India Symposium on Soil Salinity, Kanpur. pp 111-118.
Gupta, I.C. (1980) Effect of irrigation with high sodium waters on soil properties and growth ofwheat. Proceedings of International Symposium of Salt-affected Soils, CSSRI, Karnal, pp.382-388.
Gupta, R.K. and Abrol, I.P. (1990) Salt-affected soils – Their reclamation and management for cropproduction. Advances in Soil Science 12, 223-275.
Gupta, R.K. and Abrol, I.P. (2000) Salinity build-up and changes in the rice-wheat system of theIndo-Gangetic plains. Experimental Agriculture 36, 273-284.
Josan, A.S., Bajwa, M.S. and Choudhary, O.P. (1998) Effect of sustained sodic irrigations onphysical properties and root growth in a Typic Ustochrept soil under two cropping systems.Journal of Research, Ludhiana 35, 125-131.
Joshi, D.C. and Dhir, R.P. (1991) Rehabilitation of degraded sodic soil in an arid environment byusing residual Na-carbonate water for irrigation. Arid Soil Research and Rehabilitation 5,175-185.
Kahlon, M.S., Choudhary, O.P. and Josan, A.S. (2004) Effect of sodic water applied through dripirrigation on soil properties. In Extended Summaries (Theme V), International Conference onSustainable Management of Sodic Lands, Lucknow, India, 2004, pp. 450-452.
Kanwar, B.S. and Kanwar, J.S. (1971) Effect of residual sodium carbonate in irrigation waters onplant and soil. Indian Journal of Agricultural Sciences 41, 54-66.
Kaur, J., Choudhary, O.P. and Bijay-Singh. (2008) Microbial biomass carbon and some soil proper-ties as influenced by long-term sodic-water irrigation, gypsum, and organic amendments.Australian Journal of Soil Research 46, 141-151.
Kemper, W.D., Olsen, J. and De Mooy, C.J. (1975) Predicting salinisation and sodication of a baresandy-loam soil after number of irrigations with poor quality water interspersed with rainwater. Soil Science Society of America Proceedings 39, 458-463.
Kovda, V.A., Berg, C. and Hagen, R.M. (1973) Irrigation Drainage and Salinity. UNESCO andFAO. Hutchinson Press, London.
Läuchli, A. and Grattan, S.R. (2007) Plant growth and development under salinity stress. In Ad-vances in Molecular-breeding Towards Salinity and Drought Tolerance (M.A. Jenks, P.A.Hasegawa and S.M. Jain, Eds), Springer-Verlag, pp. 1-31.
Maas, E.V. and Hoffman, G.J. (1977) Crop salt tolerance-current assessment. Journal of Irrigationand Drainage ASCE 103, 115-134.
Manchnada, H.R. (1993) Long-term use of sodic waters in north India and the reliability of equa-tions for predicting their sodium hazard. In Towards the Rational Use of High Salinity Toler-

84 Bulletin of the Indian Society of Soil Science, No. 29
ant Plants, Vol.2. (H. Lieth and A.Al. Masoom, Eds), pp 433-438, Kluwer Academic Publish-ers, The Netherlands.
Manchanda, H.R., Gupta, I.C. and Jain, B.L. (1989) Use of poor quality waters, In Reviews ofResearch on Sandy Soils in India. International Symposium on Managing Sandy Soils, CAZRI,Jadhpur, pp. 362-383.
Manchanda, H.R., Sharma, S.K. and Bhandari, D.K. (1982) Response of barley and wheat to phos-phorus in the presence of chloride and salinity. Plant and Soil 66, 233-241.
Manchanda, H.R., Sharma, S.K., Yadav, S.S., Buttar, B.S. and Suneja, B.K. (1985) Sodic water forwheat. Indian Farming 35, 9-11.
Meiri, A. and Plaut, Z. (1985) Crop production and management under saline conditions. Plant andSoil 89, 253–271.
Minhas, P.S. (1996) Saline water management in India. Agricultural Water Management 30, 1-24.
Minhas, P.S. (2012) Sustainable management of brackish water agriculture. In Advances in SoilScience-Soil Water and Agronomic Productivity (Rattan Lal and B.A. Stewart, Eds), CRCpress, London. pp 289-323.
Minhas, P.S. and Bajwa, M.S. (2001) Use and management of poor quality waters for the rice-wheatbased production system. In The Rice-Wheat Cropping System of South Asia: Efficient Pro-duction Management. (P.K. Kataki, Ed), The Haworth Press, Inc., pp. 273-306.
Minhas, P.S. and Gupta, R.K. (1992) Quality of Irrigation Water. ICAR, New Delhi.
Minhas, P.S. and Sharma, D.R. (2006) Predictability of existing indices and an alternative coeffi-cient for estimating sodicity build-up using adj. RNa, and permissible limits for crops grown onsoils irrigated with waters having residual alkalinity. Journal of the Indian Society of SoilScience 54, 331-338.
Minhas, P.S., Sharma, D.R. and Chauhan, C.P.S. (2004) Management of saline and alkali waters forirrigation. In Advances in Sodic Land Reclamation. International Conference on SustainableManagement of Sodic Lands, February 9-14, 2004, Lucknow.
Minhas, P.S., Dubey, S.K. and Sharma, D.R. (2007a) Effects of soil and paddy-wheat crops irrigatedwith waters containing residual alkalinity. Soil Use and Management 23, 254-261.
Minhas, P.S., Dubey, S.K. and Sharma, D.R. (2007b) Comparative effects of blending, intra/inter-seasonal cyclic uses of alkali and good quality waters on soil properties and yields of paddyand wheat. Agricultural Water Management 87, 83-90.
Murtaza, G., Ghafoor, A., Owens, G., Qadir, M. and Kahlon, U.Z. (2009) Environmental andeconomic benefit of saline-sodic reclamation using low quality water and soil amendments inconjunction with rice-wheat cropping system. Journal of Agronomy and Crop Science, doi.10.111/j.1439-037X.2008.00350.x
O’Connor, G.A., Elliott, H.A., and Bastian, R.K. (2008) Degraded water reuse: An overview. Jour-nal of Environmental Quality 37, 157–168.
Oster, J.D. (2004) Amendments use to mitigate the adverse effects of alkali irrigation water. InExtended Summaries, International Conference on Sustainable Management of Sodic Lands,UPCAR, Feb. 9–4, Lucknow, India, pp. 89–91.

Efficient Water Management for Sustainable Agriculture 85
Oster, J.D. and Jaywardene, N.S. (1998) Agricultural management of sodic soils. In Sodic Soil:Distribution, Management and Environmental Consequences (M.E. Sumner and R. Naidu,Eds.), Oxford University Press, NY, pp. 51-75.
Pal, R. and Poonia, S.R. (1979) Dimensions of gypsum beds in relation to residual sodium bicarbon-ate of irrigation water, size of gypsum fragments and flow velocity. Journal of the IndianSociety of Soil Science 27, 5-10.
Paliwal, K.V., Maliwal, G.L. and Manohar, S.S. (1976) Effect of the level of salinity of irrigationwater on the growth and yield of barley varieties grown on a sandy soil of Rajasthan. IndianJournal of Agricultural Sciences 46, 159-164.
Phogat, V., Satyavan, Sanjay-Kumar and Sharma, S.K. (2011) Effects of cyclic and blending uses ofsaline and good quality water on soil salinization and crop yields under pearl millet-wheatrotation. Journal of the Indian society of Soil Science 59, 94-96.
Ponnamperuma, F.N. (1972) The chemistry of submerged soils. Advances in Agronomy 24, 29–96.
Poonia, S.R., Mehta, S.C. and Pal, R. (1984) The effect of electrolyte concentrations on calcium-sodium exchange equilibrium in two soil samples in India. Geoderma 32, 63-70.
Rajak, D., Manjunatha, M.V., Rajkumar, G.R., Hebbara, M. and Minhas, P.S. (2006) Comparativeeffects of drip and furrow irrigation on the yield and water productivity of cotton (Gossypiumhirsutum L.) in a saline and waterlogged Vertisol. Agricultural Water Management 83, 30-36.
Rhoades, J.D. (1968) Mineral weathering correction for estimating sodium hazard of irrigationwaters. Soil Science Society of America Proceedings. 32, 648–652.
Rhoades, J.D. (1999) Use of saline waters in irrigation. In Agricultural Drainage (R.W. Skaggs andJ. van Schilfgaarde, Eds), Madison, Wisconsin, pp. 615-657.
Rhoades, J.D., Kandiah,A. and Mashali, A.M. (1992) The use of saline waters for irrigation, Irriga-tion and Drainage, Paper No. 48, FAO, Rome, 133 pp.
Sekhon, B.S. and Bajwa, M.S. (1993) Effect of incorporation of organic materials and gypsum incontrolling sodic irrigation effects on soil properties under rice-wheat-maize system. Agricul-tural Water Management 24, 5-25.
Shainberg, I. and Oster, J.D. (1978) Quality of irrigation water. I.I.I.C. Publication No. 2. (Interna-tional Irrigation Information Centre).
Sharma, B.R. and Minhas, P.S. (2005) Strategies for managing saline/alkali waters for sustainableagricultural production in South Asia. Agricultural Water Management 78, 136-151.
Sharma, D.R. (2008) Technologies for efficient use of saline water for sustainable crop production.In Chemical Changes and Nutrient Transformations in Sodic/Poor Quality Water IrrigatedSoils. (N.P.S. Yaduvanshi, R.K. Yadav, D.S. Bundela, N. Kulshreshta and G. Singh, Eds).Central Soil Salinity Research Institute, Karnal, India, pp. 123-128.
Sharma, D.R. and Mondal, R.C. (1981) Case study on sodic hazard of irrigation waters. Journal ofthe Indian Society of Soil Science 29, 270-273.
Sharma, D.R., Minhas, P.S. and Sharma, D.K. (2001) Response of rice–wheat to sodic irrigation andgypsum application. Journal of the Indian Society of Soil Science 49, 324-327.

86 Bulletin of the Indian Society of Soil Science, No. 29
Sharma, S.K. and Manchanda, H.R. (1989) Using sodic water with gypsum for some crops inrelation to soil ESP. Journal of the Indian Society of Soil Science 37, 135-139.
Shelhevet, J. (1984) Management of irrigation with brackish water. In Soil Salinity under Irrigation,(I. Shaiberg and J. Shelhvet, Eds.), Springer Verlag, New York. pp 298-318.
Singh, A. and Singh, N.T. (1971) Effect of quality of water on soil properties. Proceedings of AllIndia Symposium on Soil Salinity, Kanpur. pp 132-137.
Singh, A.N., Baumgardner, M.F. and Kristof, S.T. (1977) Delineating salt-affected soils in part ofIndo-Gangetic plain by digital analysis of landsat data. Technical Report. LARS, PurduenUniversity, West Lafayette, Indiana, USA.
Singh, B. and Bajwa, M.S. (1987) Ammonia volatilization from salt-affected soils fertilized withurea under submerged conditions. Journal of the Indian Society of Soil Science 35, 353-356.
Singh, B., Rana, R.S. and Bajwa, M.S. (1977) Salinity and sodium hazard of underground irrigationwaters in Bathinda district (Punjab). Indian Journal of Ecology 4, 32-41.
Singh, H. and Bajwa, M.S. (1990) Comparison of different models for describing gypsum dissolu-tion kinetics in different aqueous salt solutions. Australian Journal of Soil Research 28, 947-953.
Singh, H. and Bajwa, M.S. (1991) Effect of sodic irrigation and gypsum on reclamation of sodic soiland growth of rice and wheat plants. Agricultural Water Management 20, 163-172.
Singh, M., Poonia, S.R. and Pal, R. (1986) Improvement of irrigation water by gypsum beds.Agricultural Water Management 11, 293-301.
Sinha, B.K. and Singh, N.T. (1976a) Magnitude of chloride accumulation near corn roots underdifferent transpiration, soil moisture and salinity regimes. Agronomy Journal 60, 346–348.
Sinha, B.K. and Singh, N.T. (1976b) Salt distribution around roots of wheat under different transpi-ration rates. Plant and Soil 44, 141-147.
Suarez, D.L. (1981) Relationship between pHc and sodium adsorption ratio (SAR) and an alternatemethod of estimating SAR of soil or drainage water. Soil Science Society of America Journal45, 469-474.
Tanwar, B.S. (2003) Saline Water Management for Irrigation. International Commission on Irriga-tion and Drainage (ICID), New Delhi.
Tyagi, N.K. (2003) Managing saline and alkali water for higher productivity. In Water Productivityin Agriculture: Limits and Opportunities for Improvement (J.W. Kijne, R. Barker and D.Molden, Eds.). CABI Publishing, Wallingford, U.K, pp. 69-88.
Ugolini, F.C. and Sletten, R.S. (1991) The role of proton donors in pedogenesis as revealed by soilsolution studies. Soil Science 151, 59-75.
United States Salinity Laboratory Staff (1954) Diagnosis and Improvement of Saline and AlkaliSoils. Handbook 60. United States Department of Agriculture. 160 pp.
Yadav, H.D. and Kumar, V. (1994) Crop production with sodic water. In Dry Land Resources andTechnology (L.L Somani, K.N. Bansal and R.A. Sharma, Eds.) Scientific Publishers, Jodhpur.
Yadav, H.D., Kumar, V., Singh, S. and Yadava, O.P. (1991) Effect of gypsum on some kharif cropsin sodic soils. Journal of Research (HAU) 22, 170-173.