efficiency valuation: fine tuning m&v for business transactions
TRANSCRIPT

Efficiency Valuation:Fine Tuning M&V for Business Transactions
Steve KromerEfficiency Valuation Organization
Copenhagen, DenmarkApril 19th, 2006

2
The Speaker
• Steve Kromer, P.E.– Twenty years experience in energy efficiency M&V– Chair, Efficiency Valuation Organization (EVO)
• EVO: Efficiency Valuation Organization– International non-profit organization– Manages the IPMVP - Energy Savings Verification– Developing the IEEFP - Finance Protocol– Mission:
• To develop and promote the use of standardized efficiency protocols
• To help users quantify the risks and benefits in efficiency business transactions

3
Major Points
• Verifying energy efficiency investments in: • Contract environments (ESCOs)
– Government (US Federal)
– Private
• Public programs (Utility)
• M&V “Protocols”– IPMVP, FEMP, ASHRAE
– The 2006 California EM&V Protocols
• Identify, Quantify and Manage - Uncertainty
4
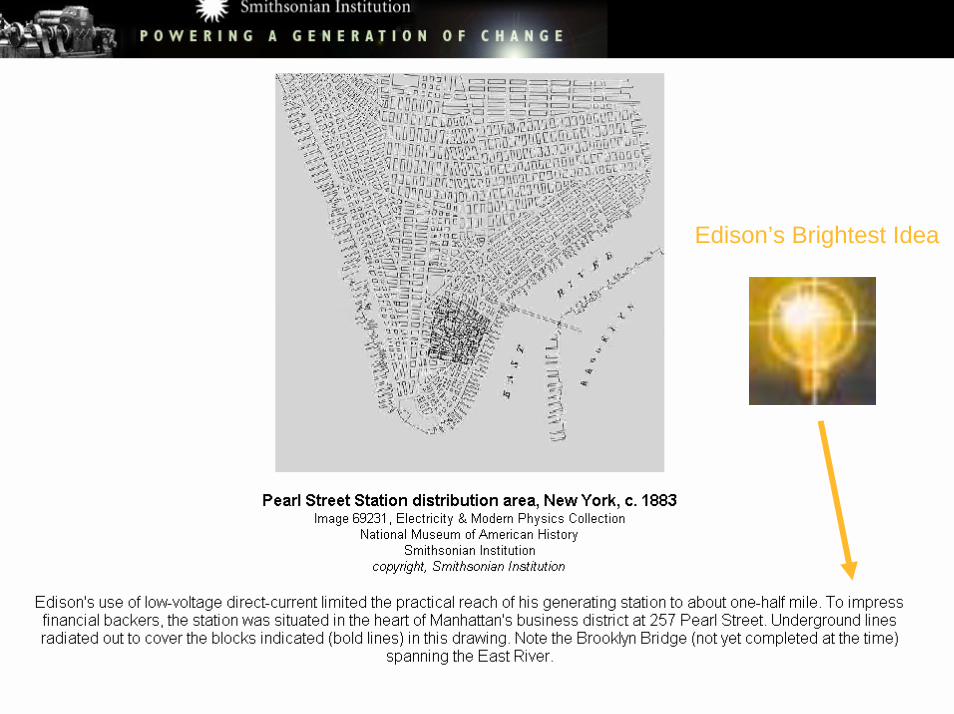
Edison’s Brightest Idea

5
Energy Impacts Energy Efficiency -The Opportunity
• Energy Demand is a function of productivity– Financial decisions within the firm drive energy purchases
– Optimizing energy utilization (not eliminating)
• Energy Demand contributes to environmental “costs”– Society demands that these costs are priced
• Taxation – Public Goods Charge on electric bill
– Emissions markets - ETS, CDM, CCX
Markets drive value of efficiency

6
Energy Investment Decisions Investment in Supply Side
Investment
Demand-SideSupply-SideGenerationTransmissionDistribution
Efficiency Demand Response
What Information is needed to support Supply-Side
• Investment decisions ?• Implementation ?• Settlement ?
What Information is needed to support Supply-Side
• Investment decisions ?• Implementation ?• Settlement ?

7
Efficiency Investment Decisions Information Needs
Investment
Demand-SideSupply-Side
What Information is needed to support Demand-Side
• Investment decisions ?• Implementation ?• Settlement ?
What Information is needed to support Demand-Side
• Investment decisions ?• Implementation ?• Settlement ?
•T -8 Lighting•New Chiller•VAV Install•Controls•High Efficiency Motors
GenerationTransmissionDistribution
Efficiency Demand Response
8
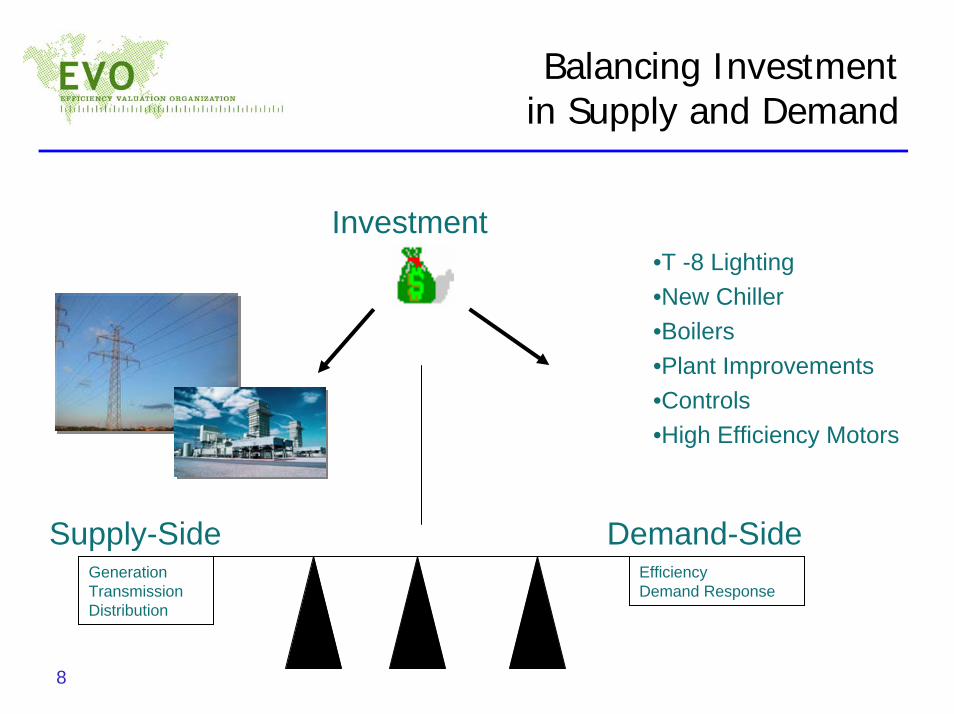
Balancing Investmentin Supply and Demand
Investment•T -8 Lighting•New Chiller•Boilers•Plant Improvements•Controls•High Efficiency Motors
Demand-SideSupply-SideGenerationTransmissionDistribution
Efficiency Demand Response

9
EXAMPLE: California 2006-2008 Energy Efficiency Programs
Demand-Side
InvestmentInvestment
$2.0 Billion$2.0 Billion
Supply-SideGenerationTransmissionDistribution
Efficiency Demand Response
•T -8 Lighting•New Chiller•Boilers •Plant Improvements•High Efficiency Motors
New EM&V ProtocolsBased on:IPMVP

10
IPMVP
International Performance Measurement and Verification Protocol
• Volume I - Energy Savings Concepts and Tools– Defines basic M&V terminology (4 “Options”)– General procedures to achieve reliable and cost-effective
determination of savings– Applicable to energy or water efficiency projects in buildings and
industrial plants
• Volume II - Indoor Environmental Quality • Volume III - New Construction and Renewables

11
M&V Options
Options A and B are retrofit-isolationmethods
Options C and D are whole-facility methods
The difference is where the boundary lines are drawn

12
M&V Constraints
• EVERY SITUATION IS DIFFERENT– Every facility is “wired” differently– Difficult to create standard M&V plans
• M&V plan costs must be reasonable– Costs must provide benefits
• Cost of M&V should reflect uncertainty in project– Lower uncertainty = less M&V
• M&V should reduce uncertainty– Benefit is the reduced uncertainty

13
M&V Requires TWO Meters
250,000
500,000
750,000
1,000,000
kWh
Baseline Period Performance Period
WWHH meter
Watt-hour MeterWatt-hour Meter
What Would Have Happened MeterWhat Would Have Happened Meter

14
Watt-hour (Wh) Meters & What Would Have Happened (WWHH) Meters
What Would Have Happened Meter = Model
Components - Algorithms (Models), Inputs, Metered data
Example 1 - Change Point Models…Example 2 - Simple Lighting Spreadsheet
Watt-hour Meter
Components - Wheels, Dials, Wires, CTs

15
M&V Decisions Balancing Benefit and Cost
Cost of Information
Benefit of Information?
What Information is needed to support• Investment decisions ?• Implementation ?• Settlement ?
What Information is needed to support• Investment decisions ?• Implementation ?• Settlement ?
Benefit/Cost = 1Benefit/Cost = 1
•Meters
•Analysis
How do we quantify the value of reduced uncertainty?
•Reduced Uncertainty

16
Settlement Quality
• We’ve heard about “Investment Grade” Audits
• Now we need “Settlement Quality” M&V
• Can you bank the output of your M&V?
• Is the M&V sufficient for credits, certificates?

17
M&V Contexts
• Government Contracts (ESPC)– Federal Energy Savings Performance Contracts
• Private Contracts within a firm– Enron Energy Services
– Energy Asset Management - Project Valuation
• Public Programs (Utility Programs)– Texas, BC Hydro, New England, Northwest
– California EM&V

18
FEMP Super ESPC
• M&V must follow FEMP M&V Protocol– Based on IPMVP– Some instruction on basing M&V on uncertainty
• Hundreds of projects in federal sector• Measurement plans for each project• Uncertainty variables identified• Total uncertainty calculated• Value of Information = Comfort of Agency
decisions makers
19
Private Firm M&V
• M&V required to justify internal capital allocations (optimize energy systems)
• Portfolio Approach– All projects evaluated for uncertainty and risk– Highest risks get most attention
• Value of M&V - Calculated by risk-adjusted discount rate (Rigorous!!)
• Requires taking a position on risk/reward

20
California EM&V Protocols
EM&V - Evaluation, Measurement & Verification
• $2 Billion EE Investment by Utilities• $120 Million budget for EM&V (3 yrs)
– Allocation of EM&V based on uncertainty– Uncertainty assessed for each program– Portfolio model assess total uncertainty– Uses Monte Carlo simulation tool
• http://www.cpuc.ca.gov/static/energy/electric/energy+efficiency/rulemaking/eeevaluation.htm

21
Public Programs:California EM&V
• Public Goods Charges (tax on ratepayers)• Political emphasis on “enhancing reliability”• Approach taken -
– Identify (calculate) “baseline” uncertainty– Portfolio-wide “risk” assessment
• Allocation of MASSIVE M&V funding based on risk ($120,000,000 US)
• Relative allocation, not absolute (not rigorous)• Value based on expected uncertainty reduction

22
“Monte Carlo” Tools
• Common tools using Monte Carlo techniques• SAS - most common statistical software package
(All big evaluation firms and utilities have SAS)
• SPSS - Statistical Package for Social Sciences
• @Risk (Palisade) – commerical software
– runs as Excel “add-in”
• Crystal Ball (Decisioneering)
– commercial software
– runs as Excel “add-in”

23
Energy Efficiency InvestmentsPhysical and Financial Risks
+ =
Physical Assumptions Forecast =Range of possible outcomes

24
“Results” - the Forecast and Sensitivity

25
Applicable at Many levels
• Apply at Portfolio Level (Top down)– Allocation of EM&V resources
• Apply to Programs– Planning
• Apply to Project M&V (Bottom up)– Identifying the variables to measure
• Next step - optimal allocation of resources– Based of cost of reduced uncertainty

26
Lighting Example
Using Crystal Ball
• Simple “Model”• Full load hour biggest uncertainty• Watts of baseline next biggest• Pre and Post Metering increase precison

27
Applying Risk Analysis to Programs
Using Crystal Ball
• Accepted “Model”• Measurable Precision• Quantified Risk

28
Applying Risk Analysis to Portfolios

29
Monte Carlo tools
• Compatible with IPMVP
• Simple to apply to any spreadsheet model
• “Best case” “Worst case” “Most likely”
estimates are already in your head.
• Allows systematic management of “estimates”

30
Conclusions
• IPMVP Options successfully applied ingovernment / private / utility programs
• Identifying, Quantifying and Managinguncertainty is critical to the business transaction
• The Art of M&V is evolving
• Tools to help quantify uncertainty and optimizeallocation of M&V resources are available

31
Thank You
Join us today:www.efficiencyvaluation.org
Download IPMVP Volumes:www.ipmvp.org
Contact me:Steve Kromer, Chair, EVO Board of Directors: