code of practice valuation of commercial forest plantations · code of practice valuation of...
TRANSCRIPT

Page 1
Code of Practice
Valuation of Commercial Forest Plantations
2nd October2012
Working Group
Daragh Little John Phelan
Tom McDonald Henry Phillips
This is a First public Draft of a Proposed Code of Practice for the valuation of commercial plantations. It may be changed
substantially prior to publication and should not be used, except in the most general sense as a Guide to Valuations.
The preparation of this Draft Code of Practice was part funded by the Department of Agriculture, Food and the Marine
If the Forestry Bill planned for publication in 2012 is enacted all references in this document to the Forestry Act, 1946 should then be construed as referring to the more recent legislation and cross checked to ensure that legal requirement still pertains.

Page 2
Glossary of Acronyms– references are to usage in Ireland unless otherwise stated
ABE Area of Biodiversity Enhancement
ADR Alternative Dispute Resolution
AFCA Association of Consulting Foresters of Australia
BNM Bord na Mona (Turf Board)
CAPM Capital Asset Pricing Model
CAT Capital Acquisitions Tax
CGT Capital Gains Tax COICOP Classification of Individual Consumption According to Purpose
COFORD Council for Forest Research and Development
CPI Consumer Price Index issued by Central Statistics Office
DBH Diameter at breast height (1.3 m) measured overbark.
DCF Discounted Cash Flow
EC European Commission
EPA Environmental Protection Agency
ESB Electricity Supply Board
FAO Food and Agriculture Organisation of the United Nations FC Forestry Commission (UK)
FS Forest Service (Republic of Ireland)
GPC Grant and Premium Category
ha Hectare (10,000 square metres equivalent to 2.471 acres)
IAS International Accounting Standard
IASB International Accounting Standards Board
IDR Implied Discount Rate
IFA Irish Farmers Association
IFRS International Financial Reporting Standards
ITGA Irish Timber Growers Association IVSC International Valuation Standards Council
LEV Land Expectation Value
LMV Land Market Value
LPS Lodgepole Pine South Coastal
MMAI Maximum Mean Annual Increment
NFV Net Future Value
NPV Net Present Value
NZIF New Zealand Institute of Forestry
PEP Potential End Product PRA Property Registration Authority
PRSI Pay Related Social Insurance
PSP Property Services Provider
PSRA Property Services Regulatory Authority
PV Present Value
PwC PricewaterhouseCoopers
RICS Royal Institution of Chartered Surveyors
ROW Right of Way
SAC Special Area of Conservation
SCW Special Construction Works SED Small End Diameter (cm) overbark
SEV Soil Expectation Value
SP Sales Proposal (timber)
SPA Special Protection Area for birds
sph Stems per hectare
UNFCCC United Nations Framework Convention on Climate Change
USC Universal Social Charge
WACC Weighted Average Cost of Capital
WPI Wholesale Price Index YC Yield Class

Page iii
Table of Contents 1.0 Introduction ......................................................................................................................................................... 1
1.1 Comment on layout of Code and the Chapters................................................................................................. 1
1.3 Worlds Forest Resources ................................................................................................................................ 2
1.4 Private Forest Estate ...................................................................................................................................... 2
2.0 Valuation............................................................................................................................................................. 4
2.1 General .......................................................................................................................................................... 4
2.2 Valuation of Forests - Challenges .................................................................................................................... 5
2.3 Purpose of Forest Valuation ............................................................................................................................ 6
2.4 Factors Affecting the Valuation of Forests........................................................................................................ 7
2.4.1 Physical Factors......................................................................................................................................... 7
Location .............................................................................................................................................................. 7
Area (Size) .......................................................................................................................................................... 8
Fragmentation ..................................................................................................................................................... 8
Infrastructure (Access) ........................................................................................................................................ 8
Site Characteristics ............................................................................................................................................. 8
Dwellings and Buildings ....................................................................................................................................... 9
2.4.2 Forest Crop Details .................................................................................................................................... 9
Management ......................................................................................................................................................10
2.4.3 Legal and Regulatory Factors ....................................................................................................................10
Title ...................................................................................................................................................................10
Rights of Way ....................................................................................................................................................10
Environmental Designations ...............................................................................................................................11
Felling Regulations .............................................................................................................................................11
2.4.4 Forest Policies and Support Measures .......................................................................................................12
Grant Aid ...........................................................................................................................................................12
Taxation .............................................................................................................................................................12
2.4.5 Market Considerations ..............................................................................................................................12
3. Methods of Forest Valuation ....................................................................................................................................14
3.1 Transaction Method .......................................................................................................................................14
3.2 Cost Based Methods......................................................................................................................................15
3.2.1 Historical Cost ...........................................................................................................................................16
3.2.2 Current Replacement Cost ........................................................................................................................16
3.3 Lump Sum (Liquidation) Method .....................................................................................................................17
3.4 Expectation Value Approach (Present Value Method) .....................................................................................18
3.5 Real Options Pricing ......................................................................................................................................19
4.0 IAS 41 ...............................................................................................................................................................20
4.1 General .........................................................................................................................................................20
4.2 Fair Value ......................................................................................................................................................20
4.3 Valuation Methods .........................................................................................................................................21
4.3.1 Quoted Price .............................................................................................................................................21
4.3.2 Comparable Sales.....................................................................................................................................21

Page iv
4.3.3 Present Value ...........................................................................................................................................21
Cashlows - Sensitivity Analysis ...........................................................................................................................22
Costs to Sell.......................................................................................................................................................22
4.3.4 Cost Approach ...............................................................................................................................................22
4.4 Land ..............................................................................................................................................................22
4.5 Timber Prices ................................................................................................................................................22
4.6 Review of Implementation of IAS 41 ...............................................................................................................22
5.0 Land Value ........................................................................................................................................................24
5.1 General .........................................................................................................................................................24
5.2 Land Expectation Value .................................................................................................................................25
6.0 Revenues and Costs ..........................................................................................................................................27
6.1 Revenues General .........................................................................................................................................27
6.2 Non Timber Revenues ...................................................................................................................................27
6.3 Timber Revenue and Prices ...........................................................................................................................28
6.3.1 General ....................................................................................................................................................28
6.3.2 Current Prices ...........................................................................................................................................28
6.3.3 Price Time Series ......................................................................................................................................29
6.3.4 Indexing Prices .........................................................................................................................................29
6.4 Costs General ...............................................................................................................................................30
6.5 Cost and Valuation ........................................................................................................................................30
7.0 Forecasting Future Timber Volumes ...................................................................................................................32
7.1 General .........................................................................................................................................................32
7.2 Forestry Commission Yield Models ................................................................................................................32
7.3 GROWFOR Dynamic Yield Models ................................................................................................................33
7.3.1 How the Dynamic Models Work (62) ..........................................................................................................34
7.3.2 Comparison with FC Yield Models .............................................................................................................34
7.4 Allowances for Open Space and Other Factors ...............................................................................................34
7.4.1 Open Space and Areas for Biodiversity Enhancement ................................................................................35
7.4.2 Attrition .....................................................................................................................................................35
7.4.3 Harvest Loss .............................................................................................................................................35
7.5 Volume Assortments ......................................................................................................................................36
7.5.1 Product Outturn.........................................................................................................................................37
8.0 Discount Rates...................................................................................................................................................39
8.1 General .........................................................................................................................................................39
8.2 Capital Asset Pricing Model (CAPM) ..............................................................................................................40
8.3 Weighted Average Cost of Capital (WACC) ....................................................................................................41
8.4 Surveys of Industry Professionals...................................................................................................................42
8.5 Discount Rate Used in Forest Transactions ....................................................................................................43
8.6 Discount Rate - Pre or Post Tax .....................................................................................................................43
8.7 Discount Rate and Risk..................................................................................................................................45
9.0 Risk ...................................................................................................................................................................46
9.1 Nature Based Risks .......................................................................................................................................46

Page v
9.1.1 Wind .........................................................................................................................................................46
9.1.2 Fire ...........................................................................................................................................................46
9.1.3 Frost .........................................................................................................................................................47
9.1.4 Disease ....................................................................................................................................................47
9.1.5 Flooding....................................................................................................................................................47
9.2 Market Based Risks .......................................................................................................................................47
9.3 Contingencies ................................................................................................................................................48
10.0 Valuing Special Considerations ..........................................................................................................................49
10.1 Broadleaf Crops.............................................................................................................................................49
10.1.1 General ................................................................................................................................................49
10.1.2 Possible Approach to Valuation .................................................................................................................50
10.2 Joint Ventures and Partnerships .....................................................................................................................50
10.3 Bare Forestry Land ........................................................................................................................................51
10.4 Christmas Trees ............................................................................................................................................51
11.0 Preparing a Forest Valuation ..............................................................................................................................52
11.1 General .........................................................................................................................................................52
11.2 Preparation Phase .........................................................................................................................................52
11.2.1 Determine Valuation Method .................................................................................................................53
11.3 Site Visit and Data Collection .........................................................................................................................54
11.4 Calculating and Modelling ..............................................................................................................................55
11.5 Valuation Report ............................................................................................................................................56
11.5.1 General ....................................................................................................................................................56
11.5.2 Valuation Report Checklist ........................................................................................................................56
Glossary ..........................................................................................................................................................................58
References ......................................................................................................................................................................60
Further Reading ...............................................................................................................................................................63
Appendix 1 Examples of Disclaimers and Limitations ...............................................................................................65
Appendix 2 Worked Example - Land Expectation Value ...........................................................................................66
Appendix 3 Historical Standing Conifer Prices.....................................................................................................67
Figures FIGURE 1: PRIVATE FORESTS - SPECIES 2 FIGURE 2: PRIVATE FORESTS - SIZE DISTRIBUTION 3 FIGURE 3: SPA HEN HARRIER - SLIEVE BLOOMS 11 FIGURE 4: UK FOREST SALES 15 FIGURE 5: IAS 41 FAIR VALUE 23 FIGURE 6: IRISH LAND VALUES 24 FIGURE 7: REGIONAL TIMBER PRICES - TEAGASC 28 FIGURE 8: TIMBER PRICES AND PRICE INDICES 29 FIGURE 9: HISTORY OF GROWTH MODELING 32 FIGURE 10: FORESTRY COMMISSION YIELD MODEL 33 FIGURE 11: GROWFOR OUTPUT 33 FIGURE 12: HARVEST LOSS - LODGEPOLE 36 FIGURE 13: OUTLINE OF PEPING PROCESS 37 FIGURE 14: IMPACT OF DISCOUNT RATE ON PRESENT VALUE 39 FIGURE 15: WINDTHROW MODEL 46 FIGURE 16: STEPS IN PREPARATION OF FOREST VALUATION 52

Page vi
Tables TABLE 1: PREMIUM PAYMENTS AFFORESTATION ....................................................................................................................27 TABLE 2: APPROACHES TO ESTIMATING DISCOUNT RATES (77) ...................................................................................... 40 TABLE 3: ESTIMATE OF DISCOUNT RATE ( RI ) USING CAPM ......................................................................................... 41 TABLE 4: INDIVIDUAL RESPONSES TO SURVEY QUESTIONS (79) ...................................................................................... 42 TABLE 5: TREATMENT OF CONTINGENCIES IN FOREST VALUATION ................................................................................... 48 TABLE 6: CHECKLIST FOR VALUATION METHOD........................................................................................................... 54 TABLE 7: CHECKLIST FOR VALUATION REPORT ............................................................................................................ 57 Acknowledgements

Page vii
Executive Summary
To be completed

1
1.0 Introduction This Code of Practice for the valuation of commercial plantations in the Republic of Ireland is intended to provide guidance to all involved and with an interest in the valuation of forest assets. It is limited in scope to the commercial aspects of forest management and does not address "values" which are not traded or recognised directly in the market place in Ireland e.g. landscape value, water quality, biodiversity or carbon sequestration. Its publication is timely in that as annual premium payments on many private plantations begin to run out some owners with a requirement for alternative or a regular income are looking to dispose of their forest asset but have no benchmark against which to value their plantations. Furthermore, there is an absence of a standardised approach to forest valuation. It will be essential for continued confidence in private afforestation, and for liquidity in forest markets that forest owners are confident in selling and seen to receive fair compensation for their forests. Increasingly, with circa 11% of the country under forests, many more forest plantations will need to be valued not just for sale and purchase but as part of probate, as security for loans, family settlements and mediation, insurance, annual and investor reporting, utility compensation (ESB, wind farms and telecommunication masts), compulsory purchase orders, stamp duty, arbitration and other reasons. Forestry, as an asset class, has tended to be grouped with real estate but with its many inherent differences it is increasingly being seen by investors as a separate asset class. Biological growth, being immune to markets, provides stability and the long term nature of the investment enables matching with long term liabilities. Institutional investors require objective valuations, performance accountability, environmentally responsible investments and liquidity and a codified approach to valuation supports their needs. Against this background it is important that there is a standardised approach or Code of Practice to forest valuation. Such an approach should give confidence to investors and sellers alike and help to increase the number of commercial transactions as well as assist in other areas where valuations are required. This Code of Practice is concerned primarily with the valuation of commercial plantations. Some forestry undertakings hold forestry plantations in Trusts, Funds, limited companies and other investment vehicles. The valuation of such undertakings is not within the scope of this Code of Practice although the valuation of their forestry assets is covered by the principles outlined.
1.1 Comment on Layout of the Code and the Chapters Chapter 1 provides an overview of the size and composition of the private forest estate in Ireland in 2012. Chapter 2 provides an introduction to valuation in general, the reason(s) for undertaking a valuation and the different terminology used as an estimate of market value. It identifies the particular issues in the valuation of forests and explores a wide range of factors which can affect the valuation including physical site factors, forest crop details, legal and regulatory matters, forest policy and support schemes and timber markets. Chapter 3 outlines the main methods used to arrive at a forest valuation including transaction based, cost based, liquidation based and present value methods. For completeness, although not perhaps entirely relevant to individual plantations, real option pricing is also considered. The major assumptions and or shortcomings of each of the methods is discussed together with references as to when and where they have been used to value forests. Chapter 4 outlines the requirements under International Accounting Standard 41 Agriculture and the hierarchy of methods to determine the fair value of a forest crop. Compliance with IAS 41 is required for EU listed companies which hold biological assets. The chapter provides a general overview of IAS 41 and is not a detailed guide to its implementation Chapter 5 discusses the issues in assigning a value to bare forest land, given the replanting obligation and the impact of drawing down of support payments. It outlines the land expectation value (LEV) approach and the factors which influence same. It explores the options available when the LEV is negative as can happen for instance in cases of lower yield class crops.
2
Chapter 6 deals with revenues and costs to be included in the valuation. It lists the main sources of revenues and deals with timber prices, their reliability and the use of price series. Costs are related to the stages of development of a plantation and the main items are identified. Chapter 7 deals with the technical aspects of forecasting future volume growth. The two main approaches - Forestry Commission models or Irish dynamic models - are discussed. Guidance is given in relation to the netting of volumes to allow for unproductive areas, volume losses during harvesting and possible losses due to windthrow and or disease. Chapter 8 discusses the discount rate, real and nominal and methods for its derivation including the capital asset pricing model (CAPM), weighted average cost of capital (WACC), implied discount rate and the use of pre or post taxation discount rate. Chapter 9 describes the main risks associated with forestry in Ireland such as wind and fire and discusses how these should be considered in any valuation. The two main approaches of either including in the cashflows or increasing the discount rate are discussed. The treatment of contingencies is also covered. Chapter 10 outlines the main issues in the valuation of broadleaved crops including the lack of appropriate growth models, limited or no price information and the wide variation in quality and past treatment. It also deals with the valuation of joint ventures and partnerships. Chapter 11 sets out a general scheme to be followed when undertaking a forest valuation. The main elements are broken down into preparatory, site visit and data collection, calculations and modelling and reporting phases. Under each phase the main activities are listed together with guidance on what to look out for and be aware of.
1.3 Worlds Forest Resources According to the Food and Agriculture Organisation of the United Nations (FAO), the world's total forest area is just over 4 billion hectares (ha), with the five most forest-rich countries (the Russian Federation, Brazil, Canada, the United States of America and China) accounting for more than half of the total forest area (64). Around 13 million hectares of forest were converted to other uses or lost through natural causes each year in the last decade compared to 16 million hectares per year in the 1990s. Afforestation and natural expansion of forests in some countries and regions have reduced the net loss of forest area significantly at the global level. The net change in forest area in the period 2000–2010 is estimated at –5.2 million hectares per year (an area about the size of Costa Rica), down from –8.3 million hectares per year in the period 1990–2000 (1). Plantation forests now make up an estimated 7 percent of the total forest area, or 264 million hectares but contribute a significantly higher proportion to overall roundwood production. During the 2005–2010 period, the area of planted forest increased by approximately 5 million hectares per year (1).
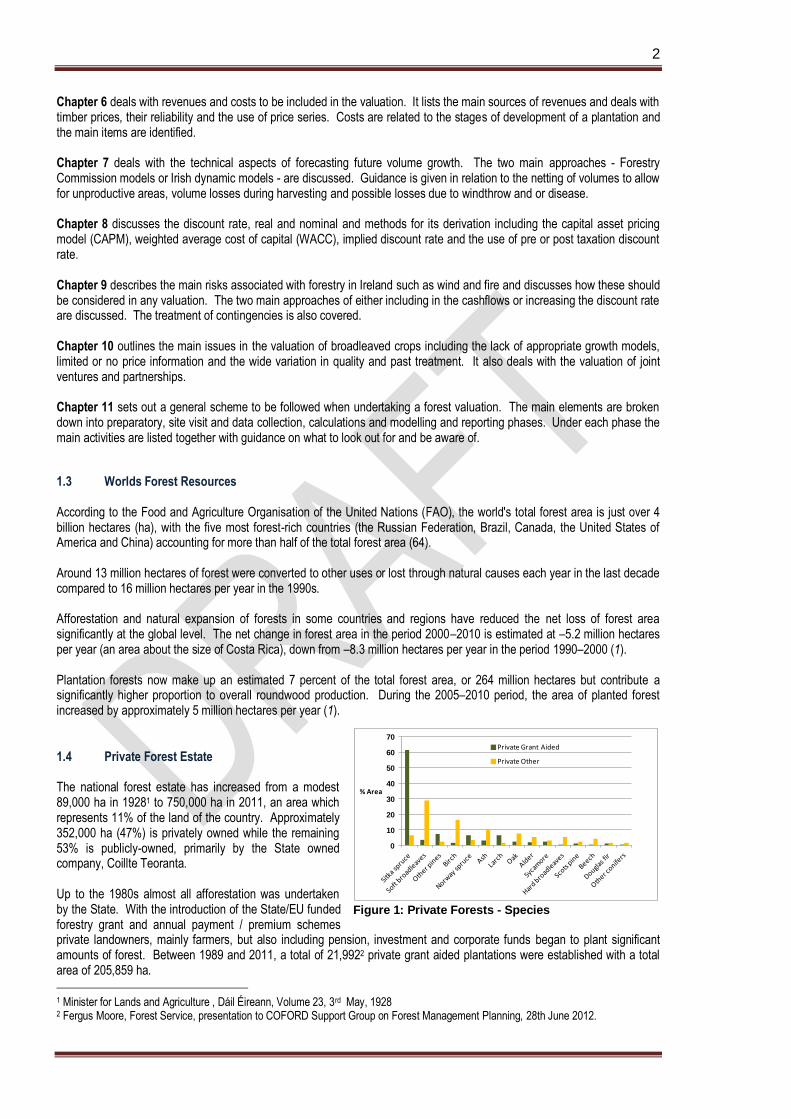
1.4 Private Forest Estate The national forest estate has increased from a modest 89,000 ha in 19281 to 750,000 ha in 2011, an area which represents 11% of the land of the country. Approximately 352,000 ha (47%) is privately owned while the remaining 53% is publicly-owned, primarily by the State owned company, Coillte Teoranta. Up to the 1980s almost all afforestation was undertaken by the State. With the introduction of the State/EU funded forestry grant and annual payment / premium schemes private landowners, mainly farmers, but also including pension, investment and corporate funds began to plant significant amounts of forest. Between 1989 and 2011, a total of 21,9922 private grant aided plantations were established with a total area of 205,859 ha.
1 Minister for Lands and Agriculture , Dáil Éireann, Volume 23, 3rd May, 1928 2 Fergus Moore, Forest Service, presentation to COFORD Support Group on Forest Management Planning, 28th June 2012.
0
10
20
30
40
50
60
70
% Area
Private Grant Aided
Private Other
Figure 1: Private Forests - Species
3
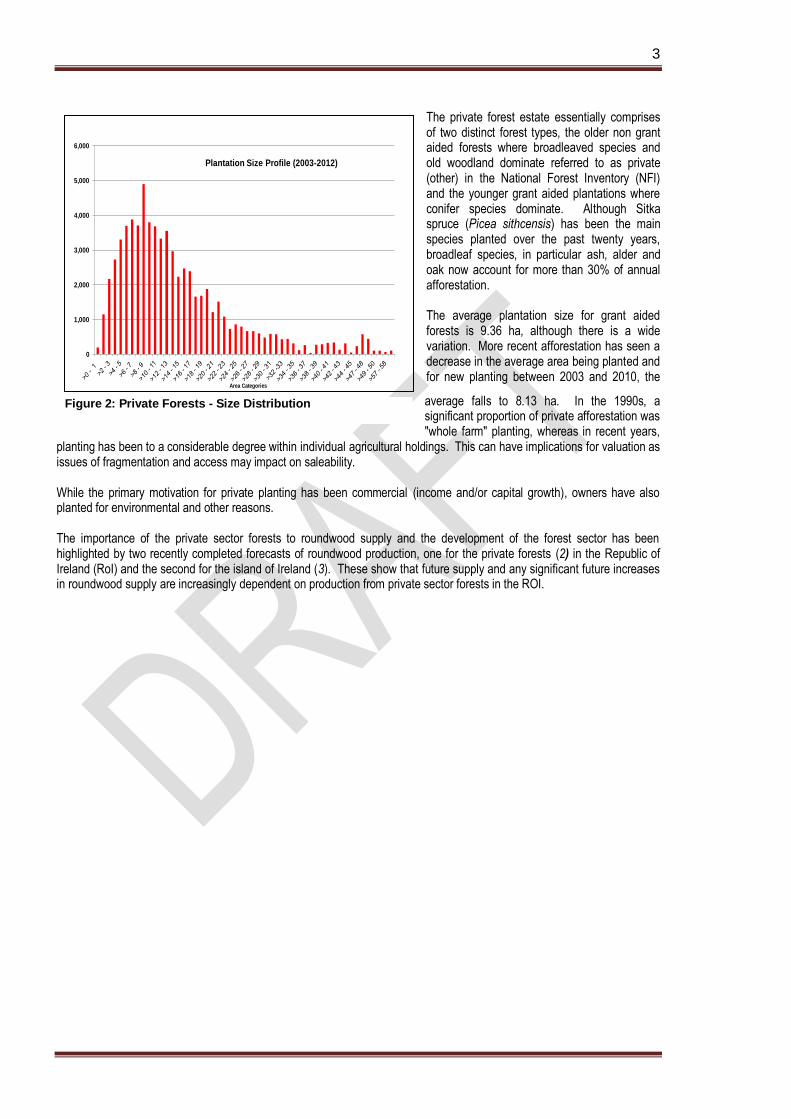
The private forest estate essentially comprises of two distinct forest types, the older non grant aided forests where broadleaved species and old woodland dominate referred to as private (other) in the National Forest Inventory (NFI) and the younger grant aided plantations where conifer species dominate. Although Sitka spruce (Picea sithcensis) has been the main species planted over the past twenty years, broadleaf species, in particular ash, alder and oak now account for more than 30% of annual afforestation. The average plantation size for grant aided forests is 9.36 ha, although there is a wide variation. More recent afforestation has seen a decrease in the average area being planted and for new planting between 2003 and 2010, the
average falls to 8.13 ha. In the 1990s, a significant proportion of private afforestation was "whole farm" planting, whereas in recent years,
planting has been to a considerable degree within individual agricultural holdings. This can have implications for valuation as issues of fragmentation and access may impact on saleability. While the primary motivation for private planting has been commercial (income and/or capital growth), owners have also planted for environmental and other reasons. The importance of the private sector forests to roundwood supply and the development of the forest sector has been highlighted by two recently completed forecasts of roundwood production, one for the private forests (2) in the Republic of Ireland (RoI) and the second for the island of Ireland (3). These show that future supply and any significant future increases in roundwood supply are increasingly dependent on production from private sector forests in the ROI.
0
1,000
2,000
3,000
4,000
5,000
6,000
Area Categories
Plantation Size Profile (2003-2012)
Figure 2: Private Forests - Size Distribution

4
2.0 Valuation
2.1 General Prior to the land being afforested, its value was relatively easily referenced to the sale or rent of similar type land in the general locality with national and specialist media reporting land and rental prices on a regular basis. Once planted, the value of the newly established plantation / forest asset is not widely known as there have been relatively few sales with lit tle reporting in the public media of the prices achieved. Even where there are a number of recent sales of plantations, the diversity in terms of species, age, stocking, management history, proximity to market, health status and infrastructure make any form of direct comparisons difficult. Most professional foresters will have, as part of their education, covered the general topic of discounted cash flow (DCF) and its application to forestry and in particular the calculation of the net present value of forest assets. The Society of Chartered Surveyors Ireland (SCSI) which is affiliated to the Royal Institution of Chartered Surveyors (RICS) is the professional body for land and property valuers in Ireland and was established as a result of a merger between the Society of Chartered Surveyors (SCS) and the Irish Auctioneers & Valuers Institute (IAVI). Members who qualify as valuers are entitled to use the designation "Chartered Valuation Surveyor" and must comply with the RICS Valuation Standard, commonly known as the "Red Book". Valuation and appraisal are often used interchangeably in relation to forests with perhaps valuation being the more common term in use. The valuation usually sought is the property's Market Value. Appraisals are needed because compared to, say, quoted company shares or corporate stock, forest transactions occur infrequently. Furthermore, every forest property is different from the next (location, species, productivity, age profile, management regime) a factor that doesn't affect assets
like company shares but which can be an important factor in their value. To clarify what is meant by valuation, market value and fair value, the terms are defined now and will be used in this meaning throughout the text. Valuation is the process of establishing, by conventional calculation, a single number expressed in currency that is a surrogate for the market price expected on the sale of the subject asset and should contain any procedure that increases the realism of the valuation as a surrogate for the market price (4). Appraisal is the process of developing an opinion of value which must be numerically expressed as a specific amount, as a range of numbers, or as a relationship (e.g. not more than, not less than) to a previous value opinion or numerical benchmark (e.g., assessed value, collateral value) (5). Forming an opinion of market value is the purpose of many property appraisals. The purpose of an appraisal may also be to determine whether a specific investment, usually an investment of scale, is over or undervalued – so it may take a broader due diligence approach, perhaps benefiting from broader market and investment knowledge, than that appropriate to individual forest holdings. Throughout this code of practice, use is made wherever possible of the terminology and definitions as set out in the RICS Red Book (6). Market value is the estimated amount for which an asset or liability should exchange on the valuation date between a willing buyer and a willing seller in an arm's length transaction after proper marketing and where the parties had each acted knowledgably, prudently and without compulsion (6). Independent Valuation is defined as a valuation made by an entity (firm or individual) which is an expert in relation to valuations of that type of asset and whose pecuniary or other interests could not be regarded as affecting the entity's ability to give an unbiased valuation (7). A non-independent valuation is typically undertaken in house within a company for financial reporting or guidance or where the valuer is an employee of the company or has an interest in the asset being valued. In the case of independent valuations, the commissioning party should provide the valuer with written instructions that clearly set out the scope and purpose of the report and ensure the independence of the valuer in writing the report and in drawing conclusions (7). Under some circumstances, the owner may not be in a position to provide written instructions. Great care should be taken to ensure independence and to reflect the wishes of the owner. Independent valuers / valuations are expected to provide readers of the report with an objective and unbiased assessment, independent of an interested party.

5
To ensure consistency between valuations in a given country and between different countries, valuation work is guided by standards. There are two broad types of standards:-
a) Reporting e.g. International Financial Reporting Standards (IFRS) set by the International Accounting Standards Board (IASB) or Valuation Standard 6 of the Red Book; and
b) Valuation e.g. by the International Valuation Standards Council (IVSC). Few standards specifically for forest valuation exist. New Zealand (4) and Australian (8) standards, both of which are aligned with the adoption of International Accounting Standard 41 Agriculture which deals with the valuation of biological assets, have most relevance to Ireland as they deal primarily with plantation forests. Due to the increasing investment activity in forestry, the IVSC has included a commercial forestry theme in its current work plan with the remit to Consider the need for and if appropriate develop an Asset Standard for commercial forestry and develop any associated guidance to support the standard and publish as a Technical Information Paper (TIP) (9, 10). In 2003, the European Commission (EC) formally approved the requirement for the use of International Accounting Standards (IASs) from 2005 in the group accounts of all companies listed on European Union (EU) stock exchanges (11). Member States have the discretion to apply this requirement to a wider group of companies and their accounts. Of particular interest to the valuation of forests is IAS 41 while either IAS 16 Property Plant and Equipment or IAS 40 Investment Property deals with the valuation of the underlying land. IAS 41 uses the term Fair value which it defines as the amount for which an asset could be exchanged, or a liability settled, between knowledgeable, willing parties in an arm’s length transaction. The valuer's role is typically to emulate the market and establish an opinion of either fair value or market value (12). In addition to standards for reporting and valuation, there are accompanying practices or ethics that apply to valuers in their day to day business of undertaking valuations (4, 13, 14). These typically focus on professional competence, conflict of interest, disclosure, confidentiality and relationship with the client. The code of ethics of the Society of Irish Foresters (15) addresses many of these issues.
The Property Services Regulatory Authority (PSRA), established under the Property Services (Regulation) Act 2011, regulates property services providers (PSPs) - auctioneers/estate agents, letting agents and management agents. The PSRA is the licensing authority for all PSPs. and it is an offence to provide a property service without a licence which is punishable by an unlimited fine and up to 5 years in prison. Property services for which a licence is required include:
a) The auction of property other than land; b) The purchase or sale, by whatever means, of land; c) The letting of land; and d) Property management services (defined as services to multi developmental units).
A separate licence is required for each property service. The valuation of forests is not a licensable activity under the Property Services (Regulation) Act.
2.2 Valuation of Forests - Challenges Forest valuations have a number of features related or common to other asset classes, however they present some unique challenges in terms of:
a) Biological processes and their performance over time;
b) The ability, within limits, to defer timber harvesting and resultant revenues to take advantage of market prices;
c) The evaluation of risk that can impact on timber volumes and revenues e.g. storms, disease, pests and climate change;
d) Impact of an increasing regulatory framework on the management of forests, the timing and scale of activities not least harvesting operations;
e) The apportionment of value between the forest crop and the underlying land (may be required for taxation purposes);
f) The impact of external roading infrastructure and access and distance to markets;

6
g) Impact of EU and Government policy on the demand for woody and wood based products; and
h) Imperfect information.
2.3 Purpose of Forest Valuation Forests can provide a wide variety of benefits or values not only to the individual forest owner but also to neighbouring lands, the local population and society in general. These benefits range from timber production to the mitigating impacts on global climate change. As stated in the introduction, this Code of Practice provides guidance only on the valuation of those commercial goods and services that are likely to arise from the ownership of forests. A forest valuation is generally required for a specific purpose. The same valuation may be appropriate for a number of different purposes but there will be important differences in forest valuations for some purposes (4). A forest valuation may be required for one or more of the following reasons:-
(a) Sale and Purchase: This is probably the most common reason for a valuation. The seller may wish to establish an opinion as to the market value of his or her plantation and based on this determine a reserve price below which the proposed sale would not take place. The purchaser on the other hand may wish to confirm his or her view as to the value of the plantation or seek an informed opinion as to the market value of the particular forest asset and based on this arrive at an informed maximum price to pay for the forest.
(b) Collateral : A forest owner may wish to use the forest asset as collateral for a loan. Lending
institutions are generally unfamiliar with the value of forest assets and may require confirmation as to the value of the asset and in particular the realisable or market value of the forest.
(c) Insurance Cover: Forest plantations can be insured against a number of risks with the most
common being fire and windthrow. The stage of development of the forest crop, which in turn impacts on its market value, will play a significant role in determining the level of cover required and in turn the insurance premium payable. The insurance provider will generally indicate value based on the replacement cost or they may have their own ready reckoner or model for discounted cash flow (DCF) depending on the type of cover required and / or the age of the plantation. As forests become older and/or more diverse, a regular valuation review may be appropriate. In the instance where there is a dispute or claims negotiation between the forest owner and the insurer, a third party independent valuation within the policy parameters may be required.
(d) Compulsory Sale or Compensation: In the case of compulsory sale, as for example road
development, the owner will require fair compensation for the forest plantation, the loss of premium payments, future timber revenues and the underlying land. Owners will also require fair compensation where utilities (gas, electricity) will pass through their plantations. An agreed compensation protocol between an Bord Gais and the Irish Farmers Association (IFA) is included in the Forest Service Afforestation Schemes Manual (16).
(e) Disclosure in Financial Statements: There is a legal requirement for assets to be disclosed in
the financial statements of a company. Accounting policies require that assets be stated at the lower of cost or net realisable value which may require an opinion on value. Shareholders may require that valuations be reported. This can be achieved by using either a conventional accounting practice e.g. historical cost and or a formal valuation process, depending on the age or stage of development of the forest (17).
(f) Financial Management: Owners may, as part of the normal management of their financial
affairs, seek to have a valuation of their forest asset or an update to a prior forest valuation to assist them in determining how the asset is performing and form a view as to whether it is more appropriate to retain and or dispose of the asset.
(g) Prospectus: There are a number of forestry funds operating in Ireland dating back to the 1990s.
These include investment in existing forests and the purchase of bare land for afforestation both in Ireland and / or abroad. Prospectuses may be prepared for such entities which could involve the acquisition of harvesting rights or the purchase of forests or the establishment of new forest

7
plantations. The prospectus would include a schedule outlining the anticipated or estimated value in the forest asset or harvesting rights and the expected return on investment. Such funds may also require periodic valuations for reporting and compliance.
(h) Probate: In the event of the death of a forest owner, a value will be required for the forest asset.
This value may need to be apportioned between the forest crop and the underlying land. (i) Taxation: Different tax treatments can apply to the forest crop and the underlying land and may
also differ depending on owner status and the nature of the transaction. The value apportioned to the land and the crop may need to be determined for tax compliance when the forest crop and land are disposed as one or separately.
(j) Other: Examples of other reasons for undertaking a forest valuation include dispute resolution
which includes litigation and alternative dispute resolution (ADR), and property division, family transfer and stamp duty.
2.4 Factors Affecting the Valuation of Forests Irrespective of the actual method used to determine the value of a forest, there are a number of factors which can either singly or in combination impact on the particular valuation. Thus before one selects the most appropriate valuation methodology, it is important to have an understanding of these factors and their influence on any valuation. The factors fall into a number of main categories (19):-
a) Physical factors;
b) Forest crop details;
c) Legal and regulatory factors;
d) Forest policy and support measures; and
e) Market considerations.
2.4.1 Physical Factors Physical factors may either serve to increase or decrease the value of a forest plantation depending upon the particular situation. The more obvious physical factors are the area of the forest plantation, geographic location, infrastructure (access) and site characteristics. Dwellings and buildings which may be present may influence the overall market value but their valuation are outside the scope of the guidance provided in this Code of Practice and owners are advised to seek professional specialist advice as to their value.
Location Although roundwood timber prices have on average kept pace with inflation over the years, as a raw material it is a relatively low value and bulky product which is costly to transport from the forest harvesting site to the primary processor whether that is a sawmill, a panel mill or a wood energy facility. The proximity to market(s) will influence the price a purchaser is willing to pay for roundwood. This price would be reflected in the market value of the forest plantation being greater (all other things being equal) where the forest is within the traditional catchment of one or more primary processors or end-users. Small local sawmills can sometimes outbid the larger mills for roundwood supply due to their lower transport costs offsetting efficiencies of scale. A typical rotation for commercial coniferous plantation crops is of the order of 30 to 40 years and within that timeframe existing processors may expand, contract or cease trading or new entrants may emerge. An informed knowledge of local market developments is important in any valuation and the likelihood or otherwise of new outlets for roundwood material e.g. wood energy or animal bedding etc. For purchasers whose motivation is simply to own a forest for lifestyle choice or other non commercial reasons, proximity to an urban setting, good fishing area, scenery or popular holiday destination may be an important consideration. In this instance proximity to timber markets will only be of secondary importance, if at all.

8
Ireland is a windy country and the susceptibility of forest crops to wind damage e.g. windblow, depends on a combination of location (wind zone), elevation, soil type and whether the stand has been thinned. COFORD (Council for Forest Research and Development) has supported the development of a general model to estimate the probability of windthrow which is available for download from its website (20). Care is needed in using and interpreting the results of the model. Forest crops in high risk areas would have shorter rotations and as a consequence reduced timber volumes and revenues. Such crops would attract a lower market value in view of the increased risk and associated reduced future timber revenues. Adoption of appropriate management practices such as drain maintenance, early selection thinning, use of low impact harvesting equipment and working of sites during dry periods can mitigate the impact of wind damage.
Area (Size) Plantation area (size) offers economies of scale and allows the owner to place reasonably sized timber sales packages on the market which are attractive both to the purchaser and the harvesting contractor. Thus larger forest plantations will tend to attract an added price premium to reflect the possible economies of scale and ease of management that they afford. However, care needs to be taken because of issues such as potential limits on felling coupe sizes and variation in quality and growth within larger plantations. Notwithstanding this, there are a number of potential purchasers who are more influenced by lifestyle choices and non timber values than by commercial considerations. Thus small forest properties can achieve prices beyond their valuation for commercial timber production.
Fragmentation While in the 1990s, a significant proportion of private afforestation was "whole farm" planting, in recent years, planting has been to a considerable degree within individual agricultural holdings and often can comprise of a number of geographically separate small plots. The degree of fragmentation of the forest holding can impact on the costs of future forest activities such as harvesting and roading with consequent impact on value. Purchasers prefer larger single blocks rather than a series of fragmented forest areas.
Infrastructure (Access) Infrastructure considerations are closely related to location. Forest properties are typically located adjoining third or fourth class roads many of which can have legal or practical (physically incapable) weight limits. Such restrictions limit access and may require additional travel distance to market. On occasion, this may involve an intermediate step to get the harvested material to a suitable location for normal road transport. Such double handling or additional transport distance represents an extra cost potential roundwood purchasers must bear and would be reflected in their price offer for any timber put up for sale. This reduced price would be reflected in any forest valuation. The presence of an existing internal forest road, provided it is fit for purpose, will eliminate the need for expenditure on road construction and make the forest more valuable. Some sites due to their configuration and or their distance from a county road may have very high roading requirement in terms of linear metres of road per stocked hectare of forest, perhaps even to the extent that it would only be worthwhile to build the road at the time of clearfell. The high road costs coupled with the absence of any thinning revenues will need to be factored into the forest valuation. Within a forest property the presence of obstacles to road construction such as streams, rivers, rock outcrop, ravines or deep gulleys which need to be traversed will add to road construction and maintenance costs and will need to be reflected in the valuation.
Site Characteristics The site characteristics which influence forest valuation are soil type, elevation, exposure, slope, ground roughness and drainage capacity. These factors influence potential harvesting costs combining to either increase costs as for example where there are steep slopes or reduce costs where there are dry mineral soils on level sites which can be worked at any time of the year.

9
Soil type is closely correlated to the potential of the site to produce timber. This timber production potential is referred to as yield class (YC) and is defined as the number of cubic metres per hectare per annum that a site will produce over the rotation of maximum mean annual increment (MMAI). Yield class, for a given tree species, will vary being generally higher for mineral soils than for organic (peat) soils. There is also a discernible decrease in yield class with increasing elevation on any given soil type. A site's ability to produce volume i.e. its yield class, is closely linked with its ability to generate timber revenues which form a major input to the determination of forest value. Thus, all things being equal and ignoring any potential impact of high growth rates on timber quality and or product outturn, the higher the site productivity (yield class) the greater the forest value. Elevation, soil type and exposure either in isolation or combination can limit the potential of the site to grow trees imposing a maximum height beyond which trees will be more subject to potential windthrow. Forest crops on exposed wet mineral sites are inherently less stable than their counterparts on sheltered, low elevation and drier sites. Such crops even though they may have a similar yield class, will have a reduced volume production capacity through a management requirement to fell such crops either at the onset of wind damage or in anticipation of wind blow. The ground preparation technique at time of planting may also influence stability. Single or double mouldboard ploughing, which to a large degree have been replaced by mounding, can predispose a crop to the early onset of windthrow. On sites where drainage is not maintained or where it is impeded, crops can be predisposed to windthrow damage. Inappropriate thinning practices can significantly increase wind risk and the valuer should consider this when valuing thinned properties. Slope and ground roughness (occurrence of rocks, rock outcrop and other impediments to travel) will impact on harvesting methods and costs. On steep slopes, felling may be limited to chainsaw and extraction only possible using cable systems rather than ground based timber extraction systems like forwarders or skidders. This will increase harvesting costs and will be reflected in the timber price and ultimately the market value for the forest.
Dwellings and Buildings Many forest plantations contain abandoned cottages and or farm buildings / outhouses and their value should be included to arrive at the overall market value for the forest plantation. The state of repair and access to such buildings is extremely variable. Notwithstanding this, some may have potential for development. The valuation of such assets is outside the scope of this Code of Practice and where such assets are present, owners are recommended to seek independent professional advice as to their market value.
2.4.2 Forest Crop Details There are a number of aspects relating to the forest crop that will impact on market value. The first and most obvious is the stage of development of the crop as this has a major impact on the timing of future revenues and costs. Crops which have yet to reach canopy closure will have lower market value than crops which have reached pole stage (mid rotation). Species is very important. The main market currently in Ireland is for conifer spruce species. Broadleaved species like oak and beech have quite long rotations, are more costly to manage and on similar sites produce less timber than conifers. Other broadleaves like ash or sycamore have shorter rotations but can be very variable in quality. Timber quality is important also for conifer species and stem straightness, absence of forking and branching habit will all influence future revenues and costs. Minor species even though they are of good quality can be difficult to market. Plot Size and Layout: - The layout of the various forests plots within the plantation or forest holding is an important consideration. A good plot layout should facilitate harvesting and help minimise roading and other costs, thereby contributing to value; otherwise layout could effectively limit the scope of harvesting resulting in dead hauls through areas not ready for thinning. The larger the individual plot sizes, the greater the scope for economies of scale and the more marketable the harvested timber. Stocking (the degree to which the forest crop covers the ground) is directly related to the site's capacity to produce timber. Fully stocked sites will attract a higher value than under stocked plantations or those sites where for one reason or another part of the crop has failed or is in check. Diseases and pests when present serve to reduce the volume production from a plantation, the extent of this reduction is related to the type and extent of the damage. Ireland’s island status, the relative newness of the forest estate and the enforcement of plant health regulations by the Forest Service have enabled us to remain free of many of the major European forest diseases and pests. Plantations which show the presence of disease or attack by insect pests, while they will

10
generally survive will show reduced vigour and may also have lower timber quality. Such crops will have a reduced market value. Deer are now a major presence in parts of the country and can do significant damage to young forest plantations. Where there is evidence of significant damage, crops will be marked down in value as timber quality and potential product recovery will be reduced.
Management How the crop has been managed to date in terms of the quality of forest establishment, the extent or otherwise of maintenance, the road density and alignment, the thinning practice adopted including rack layout, whether pruning has been undertaken and if so the appropriateness of the stem selection, will all influence value. All other things being equal, well managed plantations under active management and supported by a current management plan and good silvicultural records (including production) will tend to attract higher market values than crops which have been neglected and are in need of costly management interventions. The cost of any immediate remedial activity required to maintain the crop, facilitate future harvesting and or security of the plantation should be included in any projected future cashflows.
2.4.3 Legal and Regulatory Factors The legal and regulatory framework around forestry is becoming increasingly complex and can serve in specific circumstances to significantly restrict the range, scale and or timing of planned forest activities including fertilisation, drainage, road construction, forest harvesting and reforestation. Natura 2000 sites (Special Protection Areas under the Birds Directive and Sites of Community Importance under the Habitats Directive) now account for 13.0% of the land area (21). However, the proportion of forestry contained in these protected areas is significantly greater. An informed view is required to determine the impact, if any, on the forest valuation.
Title The greater majority of private forest plantations are held freehold. Leaseholds are relatively uncommon but one example is the leasing of industrial cutover bogland by BNM to Coillte which occurred during the 1990s. The Forest Service set out a series of requirements that must be met if the leased lands are to be eligible for grant and premiums (16). There are a number of forest partnership arrangements, as for example the Coillte Farm Partnership Scheme, where the landowner retains ownership of the land and the timber revenues are apportioned between both parties according to an agreed schedule. The Forest Service requires that all turbary and grazing rights on lands to be planted are relinquished prior to approval for grant aid. However, there are some older forest properties where this was not a requirement and care is needed to ensure that any burden on the land is identified and taken into consideration in determining the market value of the forest plantation. Where small areas of bare land are contained within the forest area they may be subject to burdens. The terms of any leasehold, joint venture or joint management arrangement for the forest property in question are important in determining market value with any restrictions or onerous burden(s) having a negative impact. It is important to be aware that burdens on land may not always be exercised and as such may not be obvious on a site visit. Adequacy and proof of title may be relevant but are outside the scope of this Code of Practice and an appropriate comment should be included in the Valuation Report.
Rights of Way Access to third parties or the public in general that is granted by way leaves, easements and rights of way (ROW), together with liabilities for the maintenance of other features needs to be carefully assessed (19) and any cost or revenue implications reflected in the market value. Access that is exercised irresponsibly can result in additional management costs from fire, trespass or vandalism (19). Access to many forest plantations may be by ROW or along shared roads. Enquiries need to be made where access is not directly from a public road and due account taken of the position in the valuation. Under the Land and Conveyancing Act 2009, all rights of way have to be registered with the Property Registration Authority (PRA) by December 2021. Additional costs are likely to be incurred where ROWs are unregistered. Historical or unregistered ROWs may be difficult to determine and problems may only come to light at the time of road construction. In some instances the right of access provided may

11
not be appropriate for the normal range of forest activities or operations. All of the issues and practicalities around ROWs should be considered when determining the valuation and appropriate comment included in the Valuation Report. Where access to the plantation is via a shared road with an adjoining forest owner or land owner, it is important to be aware of any conditions that may apply e.g. limits on the timing of access, charge per m3 for use of the access or repair covenants. Conditions should when quantifiable be incorporated into any projected cashflows.
Environmental Designations The Birds and Habitats Directives, introduced in 1979 and 1992 respectively, are designed to protect threatened, rare and vulnerable species and habitats across Europe and to ensure their survival. Measures associated with achieving this objective focus on management of Special Protection Areas for Birds (SPAs) and Special Areas of Conservation (SACs) although measures are not limited to such sites. One of the key protection measures is to ensure that the possible nature conservation implications on a Natura 2000 site of any plan or project is considered before a decision is taken to allow that plan or project to proceed (referred to as ‘appropriate assessment’ as described in Article 6 of the Habitats Directive). A range of environmental guidelines to address biodiversity, water quality, archaeology and landscape issues within forests and to guide harvesting and aerial fertilization was introduced by the Forest Service, mainly in 2000. These guidelines are expected to be updated by the Forest Service in line with improved science and understanding of the issues involved. Compliance is required as a condition of planting approvals, grant aid and licences/approvals. The Forest Service introduced guidelines dealing with the Freshwater Pearl Mussel (2008), Kerry Slug (2009), Otter (2009) and a circular dealing with appropriate assessment for felling and related activities within Hen Harrier SPAs (2011). It is important that where either all of the forest plantation or part falls within or adjoins or is in close proximity to a designated area, that the management implications are fully understood and any cost and / or revenue implications are adequately reflected in projected cashflows and the market value. For instance felling on a site with archaeological features might require an archaeological survey. Other cases might necessitate leaving standing trees which would otherwise be harvestable.
Felling Regulations The Forestry Act, 1946, is the legislation governing tree felling in Ireland. There are two types of licence under the Act (a) Limited Felling Licence (2 years) mainly used for small felling operations where there is no replanting and (b) General Felling Licence (up to 5 years) used for felling, including thinning, on larger areas and grant aided plantations. Replanting is generally mandatory and on the same area being clear felled. The Minister for Agriculture, Food and the Marine can, through the Forest Service, refuse an application for a felling licence or can attach conditions. Normally a coupe size (felling area) limit of 25 ha applies to clear fells but this may be larger or smaller depending on the particular local circumstances such as landscape and or other considerations. If the forest plantation is a large single even-aged block, then it may be necessary to factor in to the valuation that it is felled over a number of years rather than as a single unit due to landscape, environment or other considerations. The implications of this where necessary should be included in future cashflows and reflected in the valuation. As the replanting of clear felled areas is mandatory under the 1946 Forestry Act, forests and forest land are normally valued under the assumption that they will continue to be used as forests and not be converted to an alternative land use. A Forestry Bill is due to be published towards the end of 2012 and this may change matters in this regard.
Figure 3: SPA Hen Harrier - Slieve Blooms

12
2.4.4 Forest Policy and Support Measures In 1996, the Government published Growing for the Future, an ambitious strategy for the development of the forestry sector in Ireland to 2035. The review of forest policy in 2004 noted that it was formulated in the context of increasing awareness of the environmental and social values of forestry, a decreasing ownership role of the State throughout Europe and developing regional and global regulatory frameworks for forestry (22). Many of the objectives set out in Growing for the Future have been met e.g. National Forest Inventory. The thrust of the strategy remains in place and successive Governments have continued to support afforestation, species diversity and the practice of sustainable forest management. A forest policy review, completed in 2012, is currently under consideration by the Minister for Agriculture, Food and the Marine (the Government Department with responsibility for forestry policy and regulation).
Grant Aid The Forestry Schemes Manual (16) issued by the Forest Service sets out the details for the various afforestation measures including qualifying conditions, the level of grant support and premium payments. Depending on the age of the forest, there may still be part of the establishment grant due as well as a number of premium payments, the extent of which relate to the status of the owner (farmer or non-farmer) and the species planted. Non-farmer premiums are less and of a shorter duration – once payments are based on non-farmer rates they cannot increase to farmer rates and a non-farmer buying from a farmer will get the lower rate (if within the relevant time frame). Any outstanding support payment(s) will impact on the value of the forest plantation and will need to be considered when determining the market value. Confirmation and proof of existing levels of premium payments and any outstanding grant payments should be sought. There are also grants available for forest road construction (23) although the support scheme has been suspended on and off over the years due to budgetary constraints. Thus valuers would need to take an informed view as to whether the support will be there, and at what levels, when and if road construction is required and reflect this in the market value and state the assumptions used. The qualifying criteria and the scope of support schemes can vary over time and indeed some schemes may be suspended temporarily, replaced or withdrawn. It is important to be aware of the extent and range of support measures and accompanying qualifying conditions and to reflect these in cashflows and the determination of forest value.
Taxation Traditionally in Ireland, valuations for forest plantations, as with other assets, have been determined before any tax consideration was taken into account. Valuations would tend to note the tax treatment of forestry. Income from the occupation of woodlands managed on a commercial basis with a view to the realisation of profits is exempt from income tax for individuals and companies. The 2006 and 2007 Finance Act and subsequent amendments introduced restrictions on the level of exemption. The current 2012 level is €80,000 where adjusted income exceeds €124,999 or €125,000 per individual in any one year, subject to other criteria and conditions. Individuals are exempt from Capital Gains Tax (CGT) on gains attributable to the forest crop in commercial woodlands. Gains on the underlying land are subject to CGT. This exemption does not apply to companies. Commercial woodlands are subject to Capital Acquisition Tax on gifts to, or inheritance by individuals regardless of the residence or domicile of the disposer and beneficiary (18). There are reliefs that can apply. Income from woodlands, including forest premiums is reckonable for the purposes of PRSI and the Universal Social Charge (USC) ) – applicable to individuals (18). Any valuation should indicate the general taxation requirements that the client may need to consider. Taxation advice is a specialist area and outside the scope of this Code of Practice.
2.4.5 Market Considerations Investment in forestry has a number of attributes which differentiate it from other types of investment. As an asset class it tends to exhibit less volatility and even during recession or downturns in the economy, forests will continue to grow and put on volume increment. Notwithstanding this, the value of forests is influenced by various market factors including:-
13
a) The general state of the economy but in particular the state of the construction sector;
b) The demand for timber and timber based exports3;
c) Government policies around renewable energy and the use of woody biomass;
d) Supply and demand for forests;
e) Availability and cost of finance; and
f) Performance of alternative investments. While the majority of purchasers of forest plantations to date have done so for mainly commercial reasons, there are individuals where commerciality is not the prime motivation and environmental considerations and lifestyle choices are more important as well as simply the desire to own a forest or a particular type of forest. Forest certification is a voluntary market mechanism to promote the responsible forest management. of the world's forest resources. It provides an independent assurance that the quality of management practised by an enterprise conforms to specified standards and in so doing attempts to link the demand for forest products to environmental and social standards, to producers who can meet such demands (25). There are two major forest certification schemes - Forest Stewardship Council (FSC) and the Programme for the Endorsement of Forest Certification (PEFC). The main sawmills and processing facilities have chain of custody (CoC) certification. This provides assurances that wood and wood-based products originate from sustainably managed forests. Timber and timber product markets are increasingly demanding that wood and wood based products are from certified sources. Few private forests in Ireland have been certified. There are limits to the proportion of non certified material that wood processors can include in their product offering and still retain the CoC. This proportion is decreasing over time. Forest plantations which are certified may be more attractive as the timber produced will have access to certified markets. This assumes that certification would be retained following a change of ownership.
3 Since 2007 the trend has been for Ireland to become a net exporter of sawn timber, due largely to the collapse of the domestic construction market and increased levels of exports to the UK. Thus while the domestic sawn timber market declined by 46% over the period 2008-2010,
sawn timber exports grew by 60% (24).

14
3. Methods of Forest Valuation There are a variety of methods used to estimate forest value. Some are based on accounting practices, while others owe their origin to either modern economic theory or are rooted in the approaches adopted by such foresters as Cotta and Faustmann in the first half of the nineteenth century (26). The four main methods for valuing forests are:-
a) Transactions Method;
b) Cost Based Methods;
c) Lump Sum Method ; and
d) Expectation Value (Present value method or DCF) A variation of the present value method which is perhaps more commonly referred to as the discounted cash flow is the real option method which seeks to place an additional value on the flexibility of the harvesting decision to respond to changes in timber prices. In addition, the International Accounting Standard for biological assets (IAS 41) recognises a particular situation where if an active market exists, the price quoted in the market is the appropriate basis for determining the fair value of that asset. Each of these valuation methodologies is expanded upon in the following pages while Chapter 4 deals specifically with IAS 41.
3.1 Transaction Method The transaction based approach involves the analysis of recent market transactions and historical trends regarding the prices achieved for forest sales. In principle, it is the most satisfactory basis for determining forest value as it is based on the evidence provided by sales transactions (27). No two forest plantations are the same and in comparing transaction results it is necessary to consider which attributes influenced the sale value and to what extent. Important attributes include but are not necessarily limited to:-
a) Degree of maturity;
b) Size (area);
c) Species composition;
d) General growth rates (yield class);
e) Management history;
f) Timber quality and stocking;
g) Accessibility;
h) Proximity to market; and
i) Location and general terrain. Each of these may have an important influence on forest market value and on the sales price recorded in the market. Given the range of factors it is unlikely that plantations can be found that are exactly similar or wholly comparable to the forest plantation being valued. This is especially so when the number of transactions are relatively few and insufficient to provide meaningful guidance. Notwithstanding this, some of these factors can be taken into account quantitatively by adjusting for differentials that are well established in the market, such as the added cost of timber haulage from a more remote location (28) or the average yield class (growth rate). In Ireland, while there a number of transactions, there is no published data on the prices achieved. This is in contrast to agricultural land sales, which are reported on regularly in the media and specialist publications. The Central Statistics Office (CSO) discontinued their survey of land sales in the first quarter of 2005. Care is needed in the interpretation of anecdotal or second hand information on transaction prices. There are often practical difficulties, in analysing transaction information and in extrapolation to the forest of interest: -

15
a) Heterogeneous Forests: No two forests are identical. They may differ in species composition, productivity, maturity, past silviculture and other factors which will influence their value.
b) Timing: Prices provide market information at a particular point in time and reflect the underlying market conditions which may have changed in the interim.
c) Lack of Information: Forest sales information is often not available either for confidentiality reasons or because the forest represents one component of a “bundled” sale involving other significant assets.
d) Illiquid Market: There are relatively few buyers in the market especially for smaller plantations and immature forests.
e) Developed Market: In the case of Ireland, there is as yet no true secondary market for forest plantations. Information on forest sales is limited but the market is developing.
Even in countries where there are large numbers of forest owners and a strong forest tradition there may not always be sufficient comparable market transactions. In Finland for example while nearly 3,000 representative market based forest property transactions are made annually, donations and sales between relatives account for some 12,000 – 15,000 transactions per annum excluding other types of transfers like inheritance, compulsory purchase and lease agreements (29). The 2011 published market report on forest sales in the UK (30) although limited to mainly coniferous plantations above 20 ha provides a good indication as to the size of the market and the number of transactions and the values achieved. However when the data are analysed to compare values for a specific yield class, age class or area within a geographic region, the sample size can be quite small and anomalies can result. Thus while the data can be useful to provide general trends, there are insufficient transactions to provide direct comparisons. Notwithstanding the fact that it may not be possible to find transaction evidence for comparable forests, transactions when available can provide useful information or indicators. One particular use is the estimation of the implied discount rate (IDR). Estimation of the discount rate used by purchasers
involves the development of a credible cash flow model for the forest plantation in question using the best information available. The discount rate at which the discounted cash flows equate to the purchase price is the implied discount rate. This can be used as an input to the discount rate used in expectation based valuations. A 2003 study in Finland compared the estimated forest income with the sales price for 1,404 forest properties distributed throughout the country (31). The results showed the use of an average discount rate of 4%. However, there was significant variation with discount rates of 4-5% being used in the southern part of the country and rates of 2-3% being used in the north. An analysis of the sale price of State forests in New Zealand concluded that the pre-tax discount rates of the order of 9-11% were used in sale valuations (32). The 2011 report on forest sales in the UK reported that sale prices continue to consistently exceed asking prices by an average of 27%, implying that purchasers were using a discount rate significantly lower than valuers. The relevance and motivation of the market must always be considered, as factors arising in one or more transactions may not translate into the general market.
3.2 Cost Based Methods The cost based approach to forest valuation is based upon the principle of substitution. The value of a forest asset is estimated on the basis of the cost to put in place a similar asset i.e. the cost to bring the forest to a similar stage of development. Cost based methods can provide a basis for determining value for example for insurance purposes, or for very
0
20
40
60
80
100
120
140
Annual Sales by Area and Number Sold Source: UPM Tilhill and Savills Forest Market Report 2011
Property Count Area Sold (1,000 ha)
20
18
16
14
12
10
8
6
4
2
Area
Sold
Property
Count
Figure 4: UK Forest Sales

16
young forests (7). In a review of valuation methods in Australia and New Zealand undertaken in 2004, cost based methods were more widely used in Australia due to the requirements set out in the recently introduced accounting standard for self-generating and regenerating assets, while New Zealand favoured the discounted cash flow approach (33). Cost based methods fail to take account for accretion of growth on standing trees and the substantial unrealised increase in value of the forest over the remainder of the rotation to the time of clearfell (34). Notwithstanding this, costs based approaches have had appeal for a number of reasons (35):
a) A preference in some cases to value young stands on the basis of replacement cost rather than future expectations (DCF); and
b) The influence of accounting practice and the concept of objectivity. A high cost forest does not necessarily imply a high value forest and a low cost forest does not imply a low value forest, in fact commonly the opposite can be true (7, 27). Forest establishment costs are a function of site type, terrain, location, vegetation, and the necessity for operations such as deer fencing, vegetation control, trespass removal and fire protection. Value is a function of site productivity, location relative to markets, species and management regime. Inflating costs does not necessarily inflate value. Cost and value are therefore only loosely related (7), especially when biological factors come into play. Cost based methods can be divided into two main categories:-
a) Historic Cost; and
b) Current Replacement Cost.
3.2.1 Historical Cost The historic cost method equates forest value to the sum of the historic costs incurred in developing it (4). Thus a plantation would be valued as the sum of the land cost, establishment costs (net of any grant payments) and the cost of maintenance and any management costs to bring it to its current stage of development. There is no adjustment for inflation. The costs refer to the particular technology in use at the time of occurrence and any cost efficiencies through the use of improved equipment and or working practices are not considered. Costs should be recorded annually as part of good management practice. The costs to be capitalised should be limited to those that enhance or can enhance the forest asset. This can lead to different practices as to the treatment of some costs – for instance insurance is a risk reduction annual cost rather than an asset enhancing cost. Construction and maintenance of firelines could also be viewed as risk reduction costs but there is also a valid view that they enhance the protected plantation, in the same way as an alarm system might enhance a building. Other costs that need to be considered carefully are filling-in (replacement of dead plants) especially extreme values; trespass control and fertilising. In general exceptional costs arising from some non routine activi ty (such as additional maintenance following trespass) should be considered very carefully as to whether they are valid development costs. The costs for the historic cost method should not be significantly out of line with the norm for similar plantations. This can be checked by looking at the Current Replacement Cost as described in the next section. There are a number of variations relating to (a) eligible development costs, (b) inclusion / exclusion of maintenance costs and (c) inclusion / exclusion of interest (debt financing) costs (4). Financial statements relating to young forests are typically prepared under the historical cost convention (17). Once the forests have reached a certain stage of development – effectively established and free growing or alternatively approaching canopy closure - then the forest value is more generally based on anticipated revenues and costs. Where a young forest is valued periodically (say annually) over a number of years (during which time it progresses to canopy closure) a valuer can be faced with a discontinuity when changing to a different value methodology e.g. changing to an expectation value approach (35).
3.2.2 Current Replacement Cost The current replacement cost method equates forest value to the accumulation of costs incurred in developing the forest. There are two variations, the first where forest value equates to the sum of costs incurred without any consideration that an owner would require a return on the sums invested - this is the simple replacement cost. The second is where there is a recognition that any owner or investor requires some form of return on their investment and in this instance the costs are compounded forward from the time of occurrence to the present day - this is the current compounded replacement cost..

17
Standard costs representing current best practice are used for each particular forest activity. The forest value is therefore the price that owners would have to receive if they were to obtain a satisfactory rate of return on their investment to date (27). Use of replacement method requires clarity around:
a) The level of overhead costs;
b) The treatment of taxation, where relevant; and
c) Compound rate (when compounded replacement costs is used). A limitation with the current compounded cost replacement method is the need to determine a specific compound rate. The compound rate used represents the opportunity cost of capital as distinct from the interest rate on borrowed funds. Often a conservative rate has been used which is lower than the rate used to discount future revenues (35). The replacement cost approach has been used for some valuations for insurance purposes. If the insured value is based on the biological asset value then it may be an underestimate of the true replacement cost for two main reasons.
a) There would be a cost for clearing the young plantation if it was destroyed by fire, as the salvage value would be minimal.
b) The replaced forest would be some years behind the forest it is replacing and that will impact on the timing of future timber volumes and future cash flows.
The current replacement cost has been considered as inappropriate for merchantable plantations (34). While it may be preferable in some respects to historic cost because it does recognize the cost of capital and changes in operational efficiency, it still fails to take account of the increase in tree growth with tree age and the impact this has on overall growing stock volumes and value. The forest value obtained using this method may differ from the accumulated book value using the historical cost method due to a combination of improved or increased unit costs and the inclusion of compounding.
3.3 Lump Sum (Liquidation) Method In the lump sum / liquidation method, the forest value equates to the value that would be realised if all of the growing stock (standing timber) in the forest plantation was harvested and the material placed on the market, less the cost of harvesting, transport and sales i.e. the stumpage value. The method assumes that all stands in the forest can be liquidated immediately and sold at current stumpage prices. While this may be true for the typical scale of private forests in Ireland, where large areas are involved, the market may not be able to absorb the volumes concerned with a consequent impact on price and by inference value. Thus for large areas, the method can provide an optimistic estimate of market value. The use of this method however generally gives a conservative value as (a) young stands which have not reached thinning stage are valued at zero and (b) no account is taken of future volume production. As forest stands or plantations approach financial maturity, the marginal rate of value growth of the growing stock can be significant. An informed and rational owner will recognize the economic opportunity of holding the growing trees rather than selling them at current value (27). The approach, sometimes also referred to as the “stumpage” method, was one of those considered during an evaluation of valuation methods for a number of European countries (36). This analysis came down in favour of present value methods as a general approach although it did recognise that liquidation value had some application in Germany and Austria but proved unreliable in France. Use of the method can result in significant variation in value year on year in line with changes in timber prices. One difficulty with the approach is that it does not indicate or specifically provide for a value of the bare land following harvesting. In some countries where there is no replanting obligation, it may be possible to apply a market value to the land. However in other countries where there is a replanting obligation, then the value to apportion to the underlying land can be problematic. Large forest companies avoid use of this method as it is unlikely to reflect either the buyer's or seller's analysis (27).

18
3.4 Expectation Value Approach (Present Value Method) The method is not new and the idea of valuing a forest plantation, or valuing a parcel of bare land on which a forest has still to be established, by calculating its net present value (NPV) using a discounted cash flow (DCF) approach, found widespread theoretical support in Germany in the first half of the 19th century (26). Among the earliest contributions were Cotta in 1804 who applied the method to seven examples of forests using a 3% discount rate (37). The approach is more commonly attributed to Faustmann who in 1849 showed that the value of a forest can be expressed as a sum of discounted net cash flow over an infinite time period (38). However according to Scorgie4, Sir Thomas Culpeper, the Elder, in his political writing dating back to the year 1621, was concerned that forest owners in Britain would disinvest from forestry by postponing harvests, as the cash-flows from immediate felling would exceed the future cash flows discounted at the usual interest rate. Richards, a land surveyor, applied techniques of discounting future cash flows in multiple variations in 1730, explicitly using the term ‘present value’ for the outcome of his calculations which he used to solve the valuation problems of standing timber under both sustained and intermittent management (37). In the expectation approach, forest value equates to the discounted value of future net cashflows. The future roundwood volumes are estimated based on the planned management regime (thinning and rotation length) and revenues are then calculated by multiplying the volume by the relevant timber price. Costs are then subtracted from the revenues to provide future net cashflows. These are then discounted to give the forest value. There are a number of variations depending on whether:-
a) A single rotation or perpetual series of rotations are assumed; or
b) The analysis framework of an estate level or a stand level is adopted. The present value of a perpetual series of forest rotations is referred to as the soil or land expectation value and is based on the Faustmann formula. The basic logic of this formula is that for even aged timber production, the net present value is basically formed by a perpetual periodic series of clear-cutting revenues at the end of every rotation of t years. By compounding each rotation's regeneration / reforestation and other possible costs (as well as possible revenues from thinnings to the end of rotation), all (compounded) cash flows can be added to the end of rotation and apply a general present value formula for a perpetual periodic series,
PV = a / (1 + i)t - 1 where:
PV = Present value of a perpetual periodic annuity; a = Value of fixed payment received every t years in perpetuity; t = Years between annuity payments (rotation length); and i = Interest rate, expressed as a decimal.
Where a forest comprises a number of properties or stands or plots, there are two approaches in how the present value is calculated. In the estate based approach the forest is valued as a single entity. The net cashflows of all stands are forecast and discounted to give an estimate of forest value. These cashflows are associated with an underlying management and harvesting strategy which applies to the whole estate (4). The approach varies depending on:-
a) Assumptions or constraints placed on the level of harvesting. There may be a requirement to supply a minimum annual timber volume or constraints on the area of clearfells or no constraint in which instance the value of each stand can be optimised.
b) Assumptions about replanting requirements and the species used for second and or subsequent rotations In the stand based approach the forest value equates to the sum of the value of each individual stand. The net cashflows of each stand are forecast and discounted to give stand value. As for the estate based approach, assumptions are made about the underlying management and harvesting regime (4). The strategy varies depending on:
a) Rotation age - the optimum financial rotation can be assumed;
b) Silvicultural regime; and
c) Replanting costs (typically no replanting is adopted in stand based expectation method (4)).
4 Scorgie, M. E. (1996). Evolution of the application of present value to valuation of nonmonetary resources. Accounting and Business Research, 26(3), pp. 237–248.

19
A characteristic of the present value approach is that it uses price information from markets in which transactions are frequently occurring i.e. the timber market, in contrast to the market for forest plantations where transactions are relatively few and irregular in comparison. The price information comes from either current or historical timber sales data or a combination of both whereas the value which is being assessed will derive from future market prices (this is an issue with most capital appraisal projects). The other features of the present value method are that it requires:-
a) Forecast of future roundwood production from the stand or stands being valued;
b) Assumptions about timber prices;
c) Assumptions about costs; and
d) The determination of the appropriate discount rate.
3.5 Real Options Pricing The present value or DCF approach assumes a fixed investment path where decisions are made in advance, and remain unchanged over the rotation, even when unexpected favourable (price increase) or unfavourable (price decrease) events arise. It ignores the value that alternative (unexpected) opportunities and choices may bring to the investment and to the forest value. Option value can only arise where there is the flexibility to change the date of harvest in response to new information. If the forest is subject to supply commitments or if the site types are unstable, then the forest manager may have to harvest irrespective of whether prices are favourable or otherwise. Real option pricing is technically demanding and the underlying stochastic processes and its application at individual stand or forest level represent significant challenges (12). When there is a degree of irreversibility attached to the decisions being made, it may be optimal for forest owners and their managers to remain flexible about the harvesting decisions (39). If timber prices are low at the "expected" time of harvest, owners may want to delay harvest. Likewise, if timber prices are unusually high before the "expected" time of harvest , owners may want to harvest early. Real options analysis extends the present value and DCF analyses by attempting to value flexibility in managerial decision making when managers make decisions that are at least partially irreversible (such as the case with forest harvests - the trees cannot be un-harvested) and where key state variables, as for example timber prices are uncertain (40). In a world where all investments were costlessly reversible or all future state variables were known with certainty, real options would not arise. In such a world, managers could either costlessly reverse their decisions in the light of new information so as to maximise asset values or they could predict with perfect foresight their optimal future decisions. Since neither is the case, particularly in forestry, there is a strong argument in principle that real options must be considered when valuing forests (48). In the real option pricing approach, forest value is a function of future harvest volume, future harvest cost, timber price, timber price volatility, the time to harvest and the discount rate. Timber price volatility is modelled using a number of possible methods and or assumptions as is the decision to harvest. By adopting a flexible approach to harvesting decisions, it is possible to increase the forest valuation. This has been demonstrated for the sale of the State's forest assets in New Zealand where option pricing showed a 15% increase over the more traditional DCF approach (37). There is a developing literature on reserve pricing strategies for forest assets which recognise that managing the harvest decision in the light of future price information can increase forest value. Typically there is a reserve pricing threshold, as a function of age, such that forests should only be harvested at any given age if the timber price exceeds the threshold. However, if there was widespread adoption of this approach, then the result would be to dampen variability in timber prices and hence diminish the option value from the harvest timing decision (40). In a 2010 review of the relevance of option pricing for forest valuation in New Zealand, the authors conclude that at the present time, option valuation approaches have limited relevance for the practice of forest valuation in New Zealand (41). This was mainly due to the sensitivity of the underlying price model, the lack of information to conclusively determine the model followed by log prices in New Zealand and the fact that the present value approach is well understood and straight forward to apply to a wide range of forestry applications.

20
4.0 IAS 41
4.1 General This Chapter is intended as general overview of IAS 41 and is not a detailed guide to its implementation. Financial reports are an important means by which companies convey financial and other information about their operations to investors, the market and other interested parties. The content and form of external financial reports is regulated by accounting standards and, until recently, accounting standards have been the domain of national governments and accounting organizations within a particular country (11). The globalisation of markets and the rise of multi-nationals has led to the call for the harmonisation of accounting and reporting standards to facilitate comparison of results across different countries for goods and services traded in the same market. The International Financial Reporting Standards Foundation (IFRS Foundation, is a non-profit accounting organisation. Its main objectives include the development and promotion of International Financial Reporting Standards (IFRSs) and International Accounting Standards (IASs), as well as interpretative guidance, through the International Accounting Standards Board (IASB), which it oversees. The International Accounting Standards Committee was founded in 1973 with the remit to develop international accounting standards and it was replaced in 2001 by the IASB. There are now (2012) some 27 current International Accounting Standards (IASs). In 2003, the European Commission formally approved the requirement for the use of IASs from 2005 in the group accounts of all companies listed on EU stock exchanges. Member States have the discretion to apply this requirement to a wider group of companies and their accounts if they so wish. IAS 41 Agriculture was issued in 2000 with an effective date of January 2003. Its objective is to prescribe the accounting treatment and disclosures related to agricultural activity. Within the standard, agricultural activity is defined as the management of an entity of the biological transformation and harvest of biological assets for sale or for conversion into agricultural produce or into biological assets. Within the meaning of the standard, trees in a plantation are considered as a biological asset, felled trees are agricultural produce and sawnwood is an example of a product arising from processing after harvest. IAS 41 does not relate to land, which is covered by IAS 16 Property Plant and Equipment or IAS 40 Investment Property. Biological assets that are physically attached to land are measured as biological assets separate from the land. Thus IAS 41 deals only with the standing forest crop and excludes further processing costs and replanting costs. PricewaterhouseCoopers (PwC), an international consulting company, undertook two reviews of the implementation of IAS41 as it applies to forest companies, the first published in 2009 (42) and the second in 2011 (43) with the aim of providing insight into the key judgments that are made by preparers from around the world and to provide pointers as to what may be considered as best practices in fair valuing forest assets and the related disclosures. PwC in its initial review summarised IAS 41 as follows (42):- IAS 41 prescribes the accounting treatment, financial statement presentation and disclosures related to standing timber and other biological assets. The standard prescribes, among other things, the treatment for standing timber during its period of growth, degeneration, production, and procreation and for the initial measurement as agricultural produce, i.e. harvested timber. There is a presumption that the fair value of standing timber can be reliably measured. For assets with no market-determined prices or values, and for which no alternative estimates are available, historical cost can be used, that is, until the fair value becomes measurable. Fair value is stated net of point-of-sale costs. During the period of growth any change in the fair value should be recognised through comprehensive income and should be included in the profit and loss of the period in which it arises. IAS 41 does not prescribe a valuation method; each preparer must determine the valuation approach which is most representative for its forest assets. IAS 41 has a number of major implications for the valuation of forests and the disclosure in financial statements.
4.2 Fair Value IAS 41 requires that A biological asset shall be measured on initial recognition and at the end of each reporting period at its fair value less costs to sell, except for the case described in paragraph 30 where the fair value cannot be measured reliably. Fair value is defined as the amount for which an asset could be exchanged, or a liability settled, between knowledgeable, willing parties in an arm’s length transaction. The fair value of an asset is based on its present location and condition. As a

21
result, for example, the fair value of cattle at a farm is the price for the cattle in the relevant market less the transport and other costs of getting the cattle to that market.
4.3 Valuation Methods
4.3.1 Quoted Price Where an active market exists for a biological asset, then the quoted price in that market is the appropriate basis for determining fair value of that asset. If an entity has access to different active markets then it should use the price in the market expected to be used. IAS 41 defines an active market as one where all the following conditions exist:
a) The items traded within the market are homogeneous;
b) Willing buyers and sellers can normally be found at any time; and
c) Prices are available to the public. While the market for the sale of logs may under certain conditions approach the definition of an active market, the market for the sale of forests does not, as items traded i.e. forests, are not homogenous, willing buyers and sellers cannot always be found and prices are not available to the public.
4.3.2 Comparable Sales Where an active market does not exist, as is the case in Ireland, IAS 41 allows an entity to use one or more of the following, when available, in determining fair value:-
a) The most recent market transaction price, provided that there has not been a significant change in economic circumstances between the date of that transaction and the end of the reporting period;
b) Market prices for similar assets with adjustment to reflect differences; and
c) Sector benchmarks such as the value of an orchard expressed per export tray, bushel, or hectare, and the value of cattle expressed per kilogram of meat.
The three possibilities listed can be considered as examples of Comparable Sales / Transactions approach to valuation. As we have already discussed in the Chapter 3 Methods of Forest Valuation, the number of forest transactions is limited and further complicated by the heterogeneous nature of the forest plantation transacted. This coupled with the fact that there are no sector benchmarks e.g. value of a tree crop expressed as an average value per hectare means that it is not possible currently to use this approach, under Irish conditions, to valuing the forest crop.
4.3.3 Present Value When market-determined prices or value are not available for a biological asset an entity is directed to use the present value of expected net cash flows from the asset discounted at a current market-determined rate in determining fair value. In determining the present value, an appropriate discount rate to be used. In its original form, IAS 41 required that the discount rate used to determine value should be a pre-tax rate. However this was amended in 2008 to require a current market determined rate to be used but permits this to be a pre-tax or post-tax rate according to the valuation methodology used to determine fair value (44) IAS 41 requires that the following cashflow items are to be excluded in arriving at fair value:-
a) Taxation;
b) Financing Costs; and
c) Reforestation Costs.
22
Cashlows - Sensitivity Analysis IAS 41 requires that the possibility of variations in cash flows should be reflected in the calculation of fair value. Accordingly, an entity should incorporate expectations about possible variations in cash flows into either the expected cash flows, or the discount rate, or some combination of the two but in such a way as to avoid double counting. This in effect is a requirement for a form of sensitivity analysis.
Costs to Sell In the original version of IAS 41 the term point of sale costs was used but the wording has been changed to costs to sell. These costs include commissions to sales agents, costs of advertising, and the cost of preparing information to support the sale process.
4.3.4 Cost Approach IAS 41 recognises that cost may sometimes approximate fair value, particularly when:
a) Little biological transformation has taken place since initial cost incurrence; or
b) The impact of the biological transformation on price is not expected to be material (for example, for the initial growth in a 30-year pine plantation production cycle).
This essentially refers to relatively young forest crops and limits the cost approach to such situations.
4.4 Land IAS 41 recognises that there may not be a separate market for biological assets like forest crops which are physically attached to the land but that an active market may exist for the combined assets i.e. forest crop and underlying land. Under such circumstances, one may use information regarding the combined assets to determine fair value for the biological assets. For example, the fair value of raw land and land improvements may be deducted from the fair value of the combined assets to arrive at the fair value of biological assets.
4.5 Timber Prices While IAS 41 allows for the use of the present value approach and the use of discounted cashflows in this regard, it does not provide any guidance or requirement regarding timber prices to be used. If an active market exists for logs, then the expectation is that current timber prices should be used. This could result in significant variations in fair value, year on year in line with timber price movements. However this is open to interpretation; for instance market-determined prices or values may not be available for a biological asset in its present condition (e.g. a forest aged 14 cannot be clearfelled so no market exists for logs from such trees). In these circumstances, an entity is permitted to use the present value of expected net cash flows from the asset discounted at a current market-determined rate in determining fair value. IAS 41 recommends that separate disclosure of physical and price changes is useful in appraising current period performance and future prospects, particularly when there is a production cycle of more than one year. IAS 41 states that contract prices are not necessarily relevant in determining fair value, because fair value reflects the current market in which a willing buyer and seller would enter into a transaction. As a result, the fair value of a biological asset or agricultural produce is not adjusted because of the existence of a contract. It recognises that in some cases, a contract for the sale of a biological asset or agricultural produce may be an onerous contract, as defined in IAS 37 Provisions, Contingent Liabilities and Contingent Assets. IAS 37 applies to onerous contracts.
4.6 Review of Implementation of IAS 41 In 2009 and again in 2011 PricewaterhouseCoopers (PwC), published a review of the implementation of IAS 41 across a range of forest listed companies and countries and continents (42, 43). The findings from both reviews are broadly similar and are summarised below.
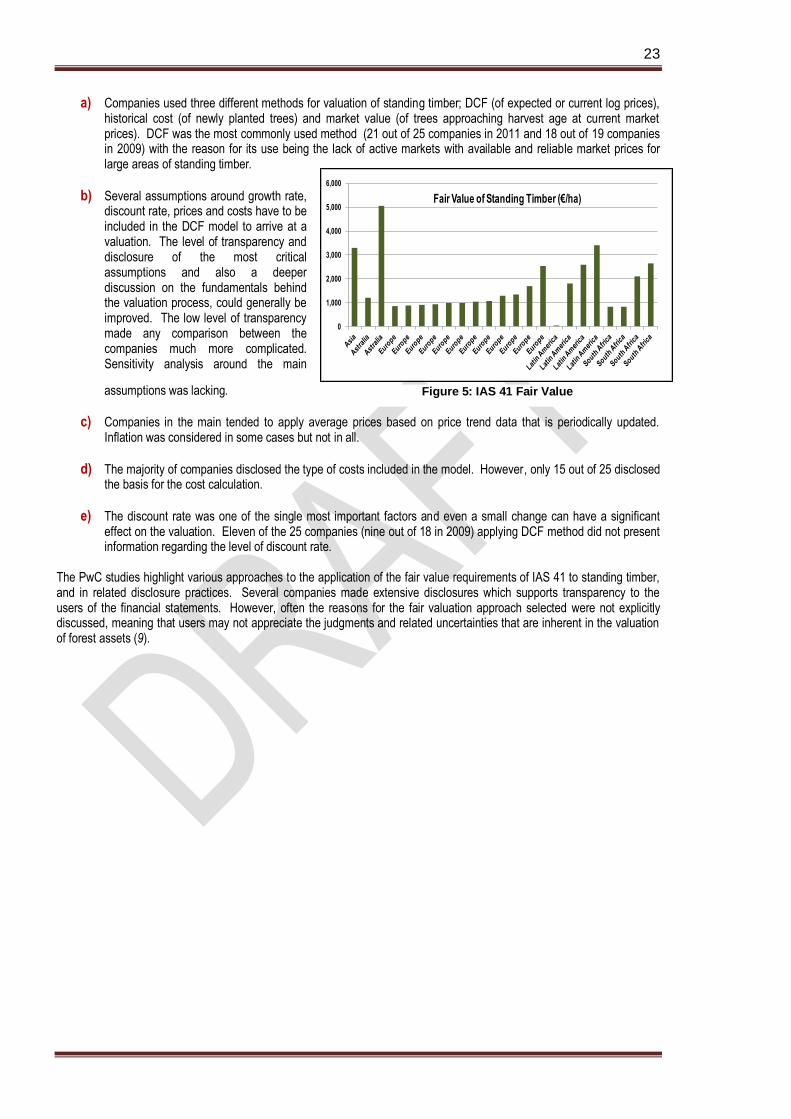
23
a) Companies used three different methods for valuation of standing timber; DCF (of expected or current log prices), historical cost (of newly planted trees) and market value (of trees approaching harvest age at current market prices). DCF was the most commonly used method (21 out of 25 companies in 2011 and 18 out of 19 companies in 2009) with the reason for its use being the lack of active markets with available and reliable market prices for large areas of standing timber.
b) Several assumptions around growth rate, discount rate, prices and costs have to be included in the DCF model to arrive at a valuation. The level of transparency and disclosure of the most critical assumptions and also a deeper discussion on the fundamentals behind the valuation process, could generally be improved. The low level of transparency made any comparison between the companies much more complicated. Sensitivity analysis around the main
assumptions was lacking.
c) Companies in the main tended to apply average prices based on price trend data that is periodically updated. Inflation was considered in some cases but not in all.
d) The majority of companies disclosed the type of costs included in the model. However, only 15 out of 25 disclosed the basis for the cost calculation.
e) The discount rate was one of the single most important factors and even a small change can have a significant effect on the valuation. Eleven of the 25 companies (nine out of 18 in 2009) applying DCF method did not present information regarding the level of discount rate.
The PwC studies highlight various approaches to the application of the fair value requirements of IAS 41 to standing timber, and in related disclosure practices. Several companies made extensive disclosures which supports transparency to the users of the financial statements. However, often the reasons for the fair valuation approach selected were not explicitly discussed, meaning that users may not appreciate the judgments and related uncertainties that are inherent in the valuation of forest assets (9).
0
1,000
2,000
3,000
4,000
5,000
6,000
Fair Value of Standing Timber (€/ha)
Figure 5: IAS 41 Fair Value

24
5.0 Land Value
5.1 General In its simplest form, and excluding any infrastructural elements or outstanding premium payments, a forest plantation is made up of two parts, the first being the forest crop growing on the land and the second the underlying land itself. The land and the forest crop constitute a combined asset in which their roles are inseparable biologically (43). While it can be reasonably straightforward to estimate the value of the growing crop, the value of the underlying land presents a number of difficulties. In theory, the value of the land is its value when put to optimum use. Thus any valuation should consider the possibility of the conversion of the land to other possible uses. This may or may not be a continuation under forest but could involve a change to an alternative land use e.g. dairying, beef production or tillage. An example where alternative use was higher than continuation under forestry was the premature felling of conifer crops in Marlborough, in New Zealand and the bare land then being planted with grape vines (46). In Ireland, under the Forestry Act, 1946 there is a requirement to obtain a felling licence for the felling of trees. Section 41 provides that the Minister may, if he thinks fit, in granting a limited licence attach a replanting condition. There is an alternative (Section 42) whereby the Minister could attach a contributing condition – basically a requirement that the licensee contribute to the Minister a sum equivalent to the expense, in the opinion of the Minister, of replanting. The replanting condition is normally applied to licences for clearfell. Alternatively an owner, wishing to clear land, with a view to replanting, can apply under Section 49 for a general felling licence – which must have a replanting condition (Section 49(3)). This means that consideration of alternative or more optimal land use is not currently an option. The exception would be where the land had a "development" value and the owner, with approval from the Forest Service, agreed to plant an alternative and acceptable area for which prior planting approval is required, leaving the cleared forest land free to be put to alternative use. Under such circumstances the proceeds from the sale of the bare land or the value attributable to its alternative use could more than compensate for the purchase of an alternative land area to be afforested. The valuation of development potential is outside the scope of this Code of Practice. Valuers should not assume approval from the Forest Service. The levels of supports for agriculture and forestry are reflected in the price for agricultural and forestry land. Agricultural price supports, coupled direct payments and direct payments coupled to land will bid up the rental rate of land (and the price) (47).. The degree to which price supports and/or direct payments are bid into the price of land depends on the elasticity of land supply and the substitutability of land for other factors of production (47). Once land is afforested and there is a drawdown of the establishment grant and premium payments, the potential revenue stream is reduced and this impacts on the price any potential purchaser would be willing to pay for the underlying land. The degree to which the value of the land devalues is unknown as there is no significant market for bare forestry land currently in Ireland. However, if purchasers were to act rationally then the price they would be willing to pay would relate to the loss in revenues arising from the drawdown of premium and grant payments.
Placing a value on the underlying land has complications arising from (a) the lack of a known market for bare forest land, (b) the obligation to replant and (c) the loss in value due to the payment of premiums to the owner. Where some premium payments are still due these should be valued separately taking due account that the premium rate and term can be impacted by a transaction and payment is conditional on adequate maintenance being undertaken. The approach to the land is to value it based on its potential for forestry, excluding premium or grant supports. There is an underlying assumption that the current situation whereby there is no support available for reforestation costs and that premium payments relate to afforestation only will continue.
Nominal
Real
Figure 6: Irish Land values

25
5.2 Land Expectation Value The land expectation value (LEV) provides a measure of the profitability of a forest investment in bare land or more simply the value of land used for growing timber. It represents the maximum price that a purchaser should be willing to pay to purchase the bare land in order to achieve the required rate of return in a forestry land use, assuming that the use continues in perpetuity (46). The LEV is also referred to as the soil expectation value (SEV) or the Faustmann Formula. The LEV is the present value of a perpetual series of forest rotations, the land being bare at the commencement of the series. It is based on the standard discounting formula for the present value of a perpetual periodic annuity:-
PV = a / (1 + i)t - 1
where: PV = Present value of a perpetual periodic annuity; a = Value received every t years in perpetuity; t = Years between annuity payments; and i = Interest rate, expressed as a decimal.
This is actually a standard DCF calculation. To convert to LEV we simply replace "a" with the net future value (NFV - compounded net cashflow) for a single rotation and replace t with the rotation age.
LEV -= NFV/(1 + i)t - 1 The formula and derivation of LEV has a number of inbuilt assumptions:-
a) The values of all costs and revenues are identical for all rotations. All costs and revenues are compounded to the end of the rotation to get the net future value of one rotation. This value will be the amount received every t (rotation) years;
b) The land will remain under forestry in perpetuity;
c) The land requires regeneration costs at the beginning of the rotation; and
d) Land value does not enter into the calculation as it is what is being calculated. An additional but very important assumption is that the forest crop and its management regime are financially optimal, within the regulatory framework, for the site in question. Thus the LEV reflects the best potential forestry use, not just simply a repeated continuation of the current crop. It is important to recognise that LEV is an economic construction, albeit with a long history of use in forestry but that it may only have a tenuous relationship to the "market value" for bare forestry land following initial clearfell. The LEV is an economic indicator of land value in forestry land use. An example of how to calculate the LEV is provided in Appendix 2. The LEV can approach zero or indeed be negative if the site has low productivity or very high costs. When the LEV is negative, it indicates that continuation of the land under forestry is insufficient to provide the rate of return required by an owner. When it is zero it indicates that a potential purchaser should not pay anything for the land if they are to achieve their required rate of return i.e. the future costs and future revenues cancel each other at the discount rate used. Land does not change hands in the market at zero value nor does the situation arise where the purchaser is paid by the seller to acquire the land, except in very rare circumstances where a significant cost burden e.g. cleaning illegal dumping, may arise. So while there is an economic message in negative or zero LEVs, it is clear that bare land for forestry does not have a nil or zero value. In such circumstances an alternative approach is required. There are two possibilities to consider. The first and one which may have merit is to include a "notional" value for land approximating the lower range of positive LEVs. This while it gets over the unrealism of negative or zero values implies that owners are prepared to accept a lower rate of return than the indicated discount rate in the overall valuation. The second is to use a lower discount rate to calculate the LEV and this would have the effect of increasing the value. The argument in favour of this latter approach include:-
a) An owner may not have the same expectation for succeeding rotations as for the current one in view of the timeframe involved and the implications of compounding risk into perpetuity. There are many advocates of reducing discount rates over time.

26
b) An owner can take the view that the use of current costs and revenues ignores their expectation that technology will achieve efficiencies and that growth rates and timber quality will be improved in second and subsequent rotations.
This approach allocates the replanting costs to the next rotation. An alternative approach is to follow the legal position and treat the replanting costs as a cost to be offset against timber revenues. Then the question becomes what value would the market place on a replanted hectare of forest of similar composition to that currently being valued. For simplicity it can be assumed that the maintenance for the first two or three years is included in the replanting costs (there is a legal obligation to maintain). By building a profile for the second rotation (and assuming no supports) it is possible to arrive by DCF at a value that the market would attribute after replanting following clearfell. That can then be factored in to the present cashflow and discounted at the appropriate rate. This will give a different value than the LEV (which recognises continuation in perpetuity). The market does not have sufficient knowledge to determine whether third and subsequent rotations of similar (or better) quality are possible and could tend to ignore calculations that required revenues from such rotations.
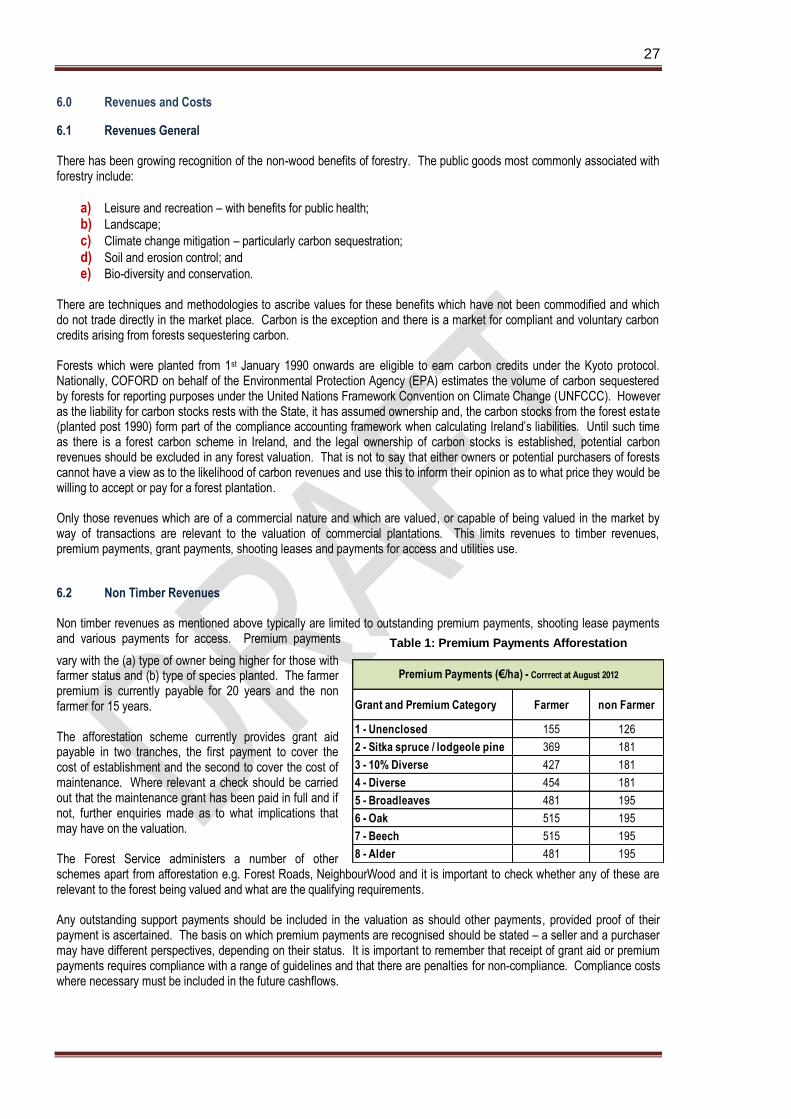
27
6.0 Revenues and Costs
6.1 Revenues General There has been growing recognition of the non-wood benefits of forestry. The public goods most commonly associated with forestry include:
a) Leisure and recreation – with benefits for public health;
b) Landscape;
c) Climate change mitigation – particularly carbon sequestration;
d) Soil and erosion control; and
e) Bio-diversity and conservation. There are techniques and methodologies to ascribe values for these benefits which have not been commodified and which do not trade directly in the market place. Carbon is the exception and there is a market for compliant and voluntary carbon credits arising from forests sequestering carbon. Forests which were planted from 1st January 1990 onwards are eligible to earn carbon credits under the Kyoto protocol. Nationally, COFORD on behalf of the Environmental Protection Agency (EPA) estimates the volume of carbon sequestered by forests for reporting purposes under the United Nations Framework Convention on Climate Change (UNFCCC). However as the liability for carbon stocks rests with the State, it has assumed ownership and, the carbon stocks from the forest estate (planted post 1990) form part of the compliance accounting framework when calculating Ireland’s liabilities. Until such time as there is a forest carbon scheme in Ireland, and the legal ownership of carbon stocks is established, potential carbon revenues should be excluded in any forest valuation. That is not to say that either owners or potential purchasers of forests cannot have a view as to the likelihood of carbon revenues and use this to inform their opinion as to what price they would be willing to accept or pay for a forest plantation. Only those revenues which are of a commercial nature and which are valued, or capable of being valued in the market by way of transactions are relevant to the valuation of commercial plantations. This limits revenues to timber revenues, premium payments, grant payments, shooting leases and payments for access and utilities use.
6.2 Non Timber Revenues Non timber revenues as mentioned above typically are limited to outstanding premium payments, shooting lease payments and various payments for access. Premium payments
vary with the (a) type of owner being higher for those with farmer status and (b) type of species planted. The farmer premium is currently payable for 20 years and the non farmer for 15 years. The afforestation scheme currently provides grant aid payable in two tranches, the first payment to cover the cost of establishment and the second to cover the cost of maintenance. Where relevant a check should be carried out that the maintenance grant has been paid in full and if not, further enquiries made as to what implications that may have on the valuation. The Forest Service administers a number of other schemes apart from afforestation e.g. Forest Roads, NeighbourWood and it is important to check whether any of these are relevant to the forest being valued and what are the qualifying requirements. Any outstanding support payments should be included in the valuation as should other payments, provided proof of their payment is ascertained. The basis on which premium payments are recognised should be stated – a seller and a purchaser may have different perspectives, depending on their status. It is important to remember that receipt of grant aid or premium payments requires compliance with a range of guidelines and that there are penalties for non-compliance. Compliance costs where necessary must be included in the future cashflows.
Grant and Premium Category Farmer non Farmer
1 - Unenclosed 155 126
2 - Sitka spruce / lodgeole pine 369 181
3 - 10% Diverse 427 181
4 - Diverse 454 181
5 - Broadleaves 481 195
6 - Oak 515 195
7 - Beech 515 195
8 - Alder 481 195
Premium Payments (€/ha) - Corrrect at August 2012
Table 1: Premium Payments Afforestation
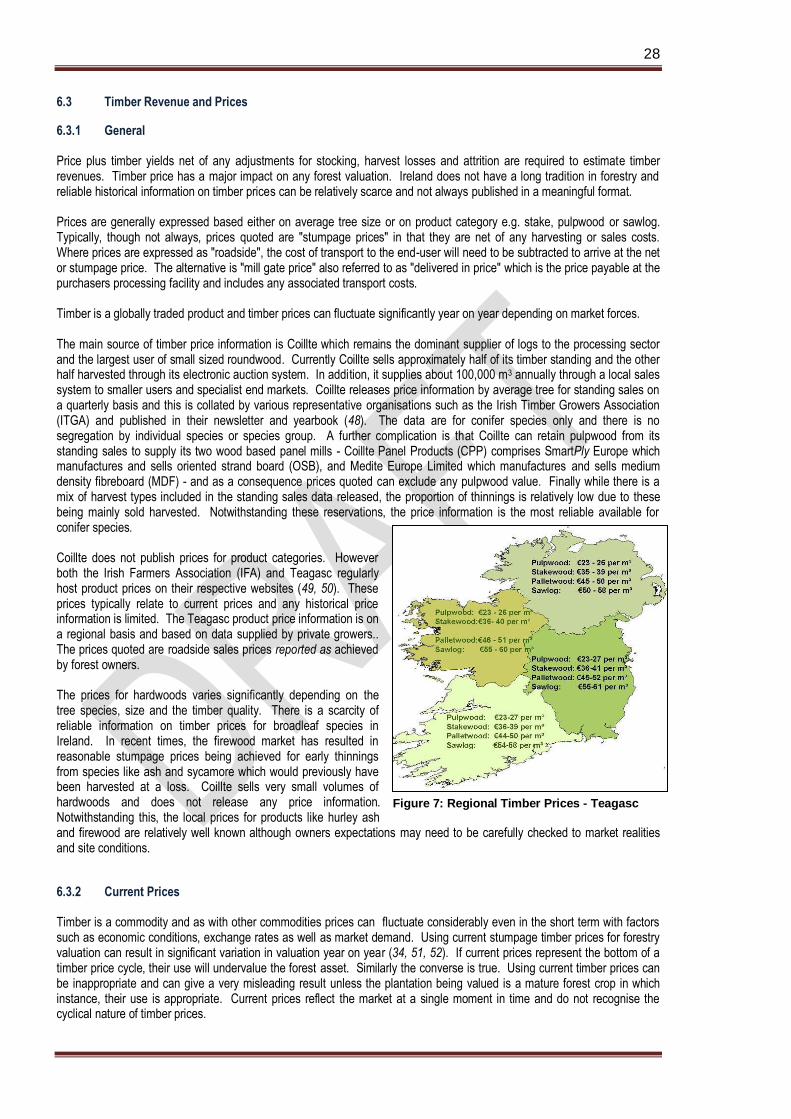
28
6.3 Timber Revenue and Prices
6.3.1 General Price plus timber yields net of any adjustments for stocking, harvest losses and attrition are required to estimate timber revenues. Timber price has a major impact on any forest valuation. Ireland does not have a long tradition in forestry and reliable historical information on timber prices can be relatively scarce and not always published in a meaningful format. Prices are generally expressed based either on average tree size or on product category e.g. stake, pulpwood or sawlog. Typically, though not always, prices quoted are "stumpage prices" in that they are net of any harvesting or sales costs. Where prices are expressed as "roadside", the cost of transport to the end-user will need to be subtracted to arrive at the net or stumpage price. The alternative is "mill gate price" also referred to as "delivered in price" which is the price payable at the purchasers processing facility and includes any associated transport costs. Timber is a globally traded product and timber prices can fluctuate significantly year on year depending on market forces. The main source of timber price information is Coillte which remains the dominant supplier of logs to the processing sector and the largest user of small sized roundwood. Currently Coillte sells approximately half of its timber standing and the other half harvested through its electronic auction system. In addition, it supplies about 100,000 m3 annually through a local sales system to smaller users and specialist end markets. Coillte releases price information by average tree for standing sales on a quarterly basis and this is collated by various representative organisations such as the Irish Timber Growers Association (ITGA) and published in their newsletter and yearbook (48). The data are for conifer species only and there is no segregation by individual species or species group. A further complication is that Coillte can retain pulpwood from its standing sales to supply its two wood based panel mills - Coillte Panel Products (CPP) comprises SmartPly Europe which manufactures and sells oriented strand board (OSB), and Medite Europe Limited which manufactures and sells medium density fibreboard (MDF) - and as a consequence prices quoted can exclude any pulpwood value. Finally while there is a mix of harvest types included in the standing sales data released, the proportion of thinnings is relatively low due to these being mainly sold harvested. Notwithstanding these reservations, the price information is the most reliable available for conifer species. Coillte does not publish prices for product categories. However both the Irish Farmers Association (IFA) and Teagasc regularly host product prices on their respective websites (49, 50). These prices typically relate to current prices and any historical price information is limited. The Teagasc product price information is on a regional basis and based on data supplied by private growers.. The prices quoted are roadside sales prices reported as achieved by forest owners. The prices for hardwoods varies significantly depending on the tree species, size and the timber quality. There is a scarcity of reliable information on timber prices for broadleaf species in Ireland. In recent times, the firewood market has resulted in reasonable stumpage prices being achieved for early thinnings from species like ash and sycamore which would previously have been harvested at a loss. Coillte sells very small volumes of hardwoods and does not release any price information. Notwithstanding this, the local prices for products like hurley ash and firewood are relatively well known although owners expectations may need to be carefully checked to market realities and site conditions.
6.3.2 Current Prices Timber is a commodity and as with other commodities prices can fluctuate considerably even in the short term with factors such as economic conditions, exchange rates as well as market demand. Using current stumpage timber prices for forestry valuation can result in significant variation in valuation year on year (34, 51, 52). If current prices represent the bottom of a timber price cycle, their use will undervalue the forest asset. Similarly the converse is true. Using current timber prices can be inappropriate and can give a very misleading result unless the plantation being valued is a mature forest crop in which instance, their use is appropriate. Current prices reflect the market at a single moment in time and do not recognise the cyclical nature of timber prices.
Figure 7: Regional Timber Prices - Teagasc

29
6.3.3 Price Time Series To overcome the difficulty associated with current prices, use can be made of average timber prices data over a number of years. There are numerous examples of national timber price series (53). The difficulty arises in selecting the time period over which the average price is calculated. In Ireland, the norm has been to use a 10 or 15 year moving average. In Finland, the norm is a 10 year average (53). In New Zealand, a shorter time period is used but price information is generally collated on a quarterly as opposed to annual basis. Due to the cyclical nature of timber prices, most analysts argue that the time period chosen should embrace at least one complete price cycle. Under Irish conditions this has approximated to seven years but this is variable depending on market influences. In Australia, a report on the valuation of forest assets argues that the use of price data over an entire business cycle, might have to embrace seven years such that the trend component within that time could be substantial, resulting in a significant understatement of values against current market conditions and perceptions (34). The report recommends to fit a trend line to quarterly real price data for at least three and preferably at least seven years and use that trend to predict the estimated price for the current year, which is then adopted as the base level for valuation. Undoubtedly by using a long time series e.g.15 year price weighted average, any possible annual price fluctuations are smoothed by being spread over the previous 14 years of the series and this will result in reduced variation in valuations year on year. However, the value of forest resources are probably more closely aligned with the recent past and the market outlook for timber and timber based products rather than with what operated in the market some fifteen years ago. The number of years to the date of clear fell will influence the timber price series that is most appropriate. When the time to clear fell is relatively short, then current prices or a variation of same should be used. However, when the time to clear fell is long and or when the forest plantation is relatively young, then a longer term price series should be used. Whatever prices are being used should be clear and commented upon in the Valuation Report.
6.3.4 Indexing Prices A further complication arises when averaging price data over time i.e. what index to use to deflate values to real values. In Ireland, the Consumer Price Index (CPI) has been used by forestry consultants. However the price size information in GROWFOR uses the Wholesale Price Index (WPI). In Finland use is made of the WPI in determining their stumpage price index, while in the UK, the Forestry Commission use GDP values to deflate prices. In an analysis of standing timber prices and the various wholesale price indices published by the Central Statistics Office, a higher degree of correlation was found between timber price and the index for rough sawn timber (54). There was no significant difference between the CPI and WPI in the period under analysis. The Consumer Price Index is designed to measure the change in the average level of prices (inclusive of all indirect taxes) paid for consumer goods and services by all private households in the country and by foreign tourists holidaying in Ireland (55). All goods and services bought by the reference population for the purposes of consumption are included in the index. Expenditure on capital assets and investments, gambling and certain other activities are however excluded. There are 632 item headings and 12 division headings based on the COICOP classification (Classification of Individual Consumption According to Purpose). The term Industrial Producer Price Index refers to a family of indices that measure the average change over time in the selling prices received by domestic producers of goods and services (56). The other three wholesale price index series - Building Materials, Capital Goods and Energy Products - incorporate imported and home produced goods sold by manufacturers and wholesale outlets. The WPI for Building and Construction Materials, provides only a general indication of price trends in that sector, although it does include rough timber (including plain sawn), hardwoods and joinery products.
0.5
0.7
0.9
1.1
1.3
1.5
1.7
1.9
2.1
2.3
1987 1988 1989 1990 1991 1992 1993 1994 1995 1996 1997 1998 1999 2000 2001
Comparison of Standing Timber Price and CSO Indices
Standing Timber Timber and Wooden Products
Paper and Paper Products Rough Sawn Timber
Other Timber General WPI
Consumer Price Index
Figure 8: Timber Prices and Price Indices

30
While there are advantages and disadvantages to the use of both CPI and WPI, since wood product prices alter more in sympathy with wholesale prices rather than retail prices, the use of a wholesale price index as a deflator leads to less fluctuation about the trend in deflated price and is therefore to be preferred in calculating average annual trend (57). More analysis is required before definitive guidance can be provided as to which index or sub index to use.
6.4 Costs General Costs form an important element in any forest valuation, irrespective of the valuation method being applied. The cost profil e of forestry is skewed with the majority of the costs, apart from road construction, normally occurring within the first five years. Costs can be broken down into four main categories:-
a) Establishment Costs;
b) Maintenance Costs;
c) Road Construction Costs; and
d) Harvesting Costs. Within each of these broad categories and depending on the specific site characteristics, costs and their timing can be estimated with a good degree of accuracy and a range of market contract rates apply although there can be regional and site dependent differences. Establishment costs include fencing, site cultivation (both for afforestation and reforestation), fertilizer and fertilizer application, plants, planting, vegetation control and filling-in (replacement of plant failures). Maintenance costs generally refer to items such as fence and drainage repairs, screefing of firelines and road repairs in advance of or following harvesting. Forest road construction costs include road survey and design / layout, road formation and road completion. The cost of any special construction works (SCW) e.g. culverts or forwarder crossings are included under this heading. There may also be compliance costs such as road opening licences and or repairs to public roads. Harvesting costs include the cost of marking and timber measurement, cost supervision and invoicing, and for roadside sales the cost of felling and extraction. Harvesting costs may also include the cost of transport to the sawmill or wood processing facility where this forms part of the sales contract. Once off costs can also occur, e.g. trespass removal, second fertilizer treatment, inspection paths in advance of thinning, preparation of forest management plans, forest inventory, sanitary fellings and fire protection measures. If the forest plantation is being managed by a third party on behalf of the owner, there will be an annual management cost. The same applies if the potential purchaser intends to contract out the management of the plantation. Forest insurance against for example fire or wind blow is not compulsory and is at the discretion of the individual forest owner. There are a number of providers and rates are competitive and depend on site and crop characteristics. The cost of insurance should be included in the cashflows where relevant. There is the alternative view that insurance costs do not contribute directly to asset value and should be excluded in valuing the asset. However insurance is a valid cost and is one means to mitigate the impact of risk elements and include in the cashflows which is preferred to trying to accommodate all risk elements in the discount rate.
6.5 Cost and Valuation Costs can generally be attributed either to an individual forest stand in which case they are generally reported on a per hectare basis or on a volume ( per m3) or weight basis (per tonne) for harvesting operations. Alternatively costs may be attributed to the forest plantation as a whole in which case they are generally apportioned on the basis of productive forest area. The important thing is that all costs should be included and that no costs should be included in the analysis more than once. It is important to validate the costs being input to the valuation and to take a view as to (a) whether the forest operation is necessary and (b) if so does the cost reflect the going market rate.

31
Where a present value approach is being used, the current market cost is used for future costs. This approach assumes that there are no technological improvements which would go to reduce costs and also no market forces that would serve to increase costs relative to inflation. The assumption is generally valid but care is needed when valuations are being applied to relatively young plantations. Sunk costs are past costs that have already been incurred and cannot be recovered under any circumstances. When using the present value approach, all sunk costs are ignored and the only costs to be considered are future costs over the lifetime of the forest or plantation.

32
7.0 Forecasting Future Timber Volumes
7.1 General Foresters often have a good general sense of a stand's developmental future and at what stage it can or should be harvested and also what interventions can be implemented to alter the course of development to suit specific objectives. However, it takes years of experience to achieve this level of expertise, and even then, quantifying the predictions, in terms of crop parameters, can be extremely difficult. Forest growth models attempt to bridge this gap between the present and future stand parameters by predicting the future condition based on a number of underlying assumptions. Ultimately, growth models are the quantitative generalisations on the knowledge of forest stand development and their response to silvicultural treatments (58).
While the terms growth and yield tend to be used synonymously, throughout this Code of Practice yield is used to refer to the volume removed in thinnings and clearfells while growth is used to refer to changes in volume over a given period of time including a rotation. Growth models are pivotal to predicting future timber production and by implication future timber revenues. A growth model can be considered to be a model of the production within a single tree or stand of trees (59). Forest growth and yield models have a long history of development dating back some hundreds of years, although the rate of their development has increased significantly in recent times with the availability of personal computers to perform both data analysis and complex simulations (58).
Although growth models can be classified under a number of headings, in terms of volume forecasting, models can be considered as being either :
a) Static; or
b) Dynamic. Traditionally in forestry in Ireland static stand growth models have been used to predict future volume production. These models, as for example the Forestry Commission Yield Tables (60), predict stand parameters (such as volume, stocking or basal area) over time based on assumed management interventions (thinnings). In this regard they are limiting as any deviation from the norm is not catered for within the model. In more recent times, significant progress has been made in the development of dynamic stand models. Dynamic models exhibit greater flexibility in terms of modelling different crop treatments. They can cater for a range of initial stand states (stocking, basal area and height) and variation of management intervention (timing of thinnings, number of thinnings and thinning intensity).
7.2 Forestry Commission Yield Models The Forestry Commission (FC) yield models for forest management (60) have been widely used to forecast future volume production at a stand, forest and national level. The models are based on the yield class system of growth classification and on research and plot data from the United Kingdom (UK). There are a wide variety of models encompassing different tree species, growth rates (yield classes), thinning treatments and initial tree spacing. The models are however static and as such assume certainty about the starting position of a stand and how that individual forest stand will be managed over time.
Figure 9: History of Growth Modelling
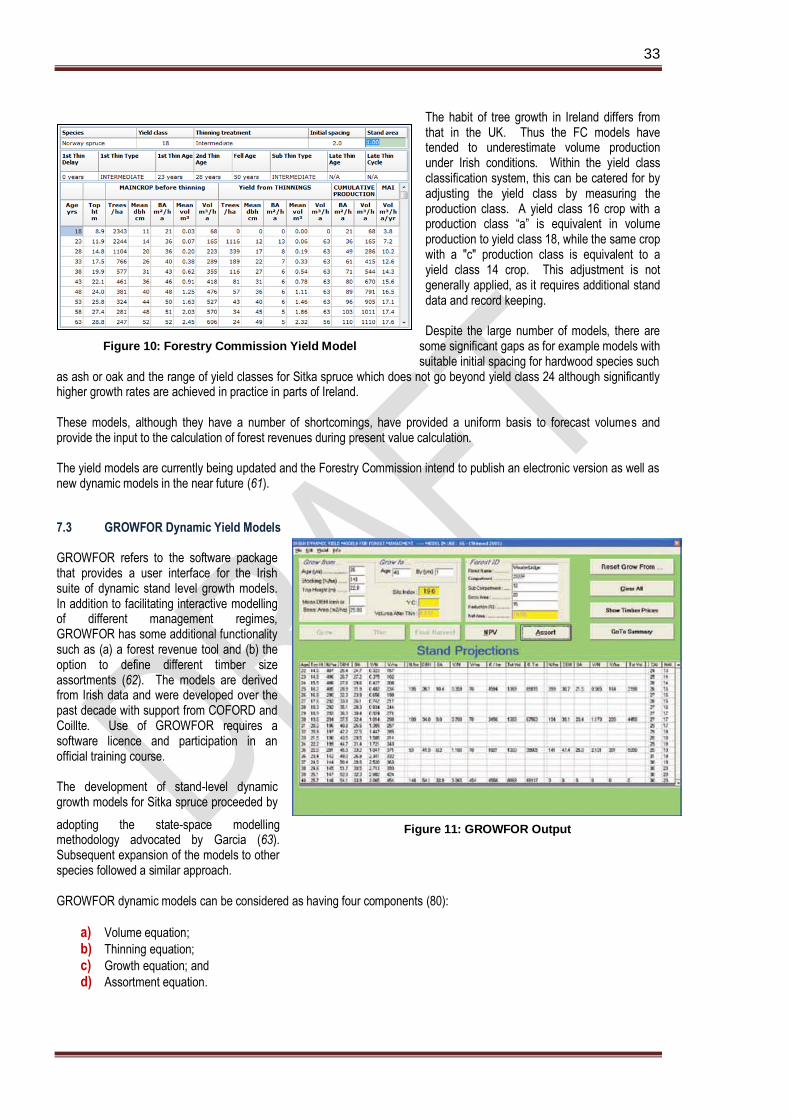
33
The habit of tree growth in Ireland differs from that in the UK. Thus the FC models have tended to underestimate volume production under Irish conditions. Within the yield class classification system, this can be catered for by adjusting the yield class by measuring the production class. A yield class 16 crop with a production class “a” is equivalent in volume production to yield class 18, while the same crop with a "c" production class is equivalent to a yield class 14 crop. This adjustment is not generally applied, as it requires additional stand data and record keeping. Despite the large number of models, there are
some significant gaps as for example models with suitable initial spacing for hardwood species such
as ash or oak and the range of yield classes for Sitka spruce which does not go beyond yield class 24 although significantly higher growth rates are achieved in practice in parts of Ireland. These models, although they have a number of shortcomings, have provided a uniform basis to forecast volumes and provide the input to the calculation of forest revenues during present value calculation. The yield models are currently being updated and the Forestry Commission intend to publish an electronic version as well as new dynamic models in the near future (61).
7.3 GROWFOR Dynamic Yield Models GROWFOR refers to the software package that provides a user interface for the Irish suite of dynamic stand level growth models. In addition to facilitating interactive modelling of different management regimes, GROWFOR has some additional functionality such as (a) a forest revenue tool and (b) the option to define different timber size assortments (62). The models are derived from Irish data and were developed over the past decade with support from COFORD and Coillte. Use of GROWFOR requires a software licence and participation in an official training course. The development of stand-level dynamic growth models for Sitka spruce proceeded by
adopting the state-space modelling methodology advocated by Garcia (63). Subsequent expansion of the models to other species followed a similar approach. GROWFOR dynamic models can be considered as having four components (80):
a) Volume equation;
b) Thinning equation;
c) Growth equation; and
d) Assortment equation.
Figure 10: Forestry Commission Yield Model
Figure 11: GROWFOR Output
34
The volume equation, which estimates stand volume is based on a combination of top height, age, stocking (stems per ha), mean dbh and/or basal area, is a variation on the standard type volume equation proposed by Garcia. The thinning equation used is that proposed by Garcia (107) and allows for the determination of post-thinning basal area (resp. stocking) when the top height, pre-thin basal area, pre-thin stocking and post-thin stocking (resp. basal area) are known. The growth projection mechanism employed consists of a system of differential equations formulated by Garcia (64). GROWFOR uses an assortment model to calculate assortments for any production thinnings and the main crop including clearfell volumes with the added functionality that users can specify the assortment categories. The model reflects the actual data and management regime as input by the user.
7.3.1 How the Dynamic Models Work (62) In order for the Irish dynamic yield models to work, forest inventory data are required in the form of species, age, top height (m), stocking (stems/ha) and either basal area (m2/ha) or mean diameter at breast height (cm). These data are input into the model and a current standing volume per hectare and associated product assortments are generated. The forest can then be ‘grown on’ to a future age at which the user may decide to thin or to fell the stand. Growth projections are best confined to ages greater than first thinning, if any, to clear felling. The age limits within the model are from 10 to 60 years. When faced with a thinning decision, the user can specify thinning intensity in terms of the number of stems, the volume of timber or the basal area to be removed per hectare. Following each thinning the stand can be ‘grown on’ again to another future age and the process repeated until a decision is made to finally fell the stand. At all stages, the timing, frequency and intensity of thinning interventions are under the user’s control. The models require a minimum basal area before a thinning can occur. For each year, the model provides projections of stand conditions in terms of age, top height (m), stems per hectare, mean diameter at breast height (cm), basal area (m2/ha), mean volume per stem (m3) and gross standing volume per hectare (m3/ha). For those years in which a thinning has been specified, the same information is provided for the stand prior to and post thinning operations and for the thinning yield.
7.3.2 Comparison with FC Yield Models When Irish dynamic yield models are compared directly with FC models the following observations have been noted:-
a) Standing volume estimates are frequently greater;
b) Growth projections to mid rotation indicate increased basal area growth and diminished tree mortality. This effect can be reversed in late rotation;
c) Unthinned stands have a slower rate of mortality and often a higher rate of basal area growth; and
d) For species other than Sitka spruce, use of standard FC thinning volume yields can result in a running down of stand basal area.
When the private sector forecast was run using GROWFOR based models, there was a reduction in total net volume of 1.5% over the twenty year forecast period when compared with the FC based models (65). The difference was due to reduced thinning volumes, especially for first and second thinnings.
7.4 Allowances for Open Space and Other Factors Growth models irrespective of whether they are dynamic or static predict estimates of gross standing volume and do not take account of:-
a) Unproductive forest areas such as roads or firelines;
b) Open space retained for biodiversity;

35
c) Volume losses during harvesting; or
d) Volume losses due to wind blow or the onset of disease / insect attack.
7.4.1 Open Space and Areas for Biodiversity Enhancement Traditionally within Ireland and the UK, yield table volumes have been adjusted by 15% to allow for volume losses arising from roads, rock outcrop and other unproductive areas and this was the guidance provided in FC Booklet 48 (60). This 15% adjustment was tested by the Forest Service in 1984 on a random sample of four forests. The results showed that when all roads, ridelines and other unproductive areas were mapped and netted, they accounted for 12% of the gross area. From observation, there is a relationship between average yield class and the volume reduction factor – the higher the average yield class the smaller the volume reduction factor. This is understandable in that lower yield classes occur on poorer site types and tend to have a higher proportion of unstocked or unproductive areas due to site constraints. The Forest Biodiversity Guidelines (66) require that Areas for Biodiversity Enhancement (ABEs) e.g. open spaces and retained habitats, should comprise approximately 15% of individual grant aided afforestation projects which are greater than 10 ha. In sites less than 10 ha, the open space element of ABEs should be designed in conjunction with neighbouring land use and can be reduced.
7.4.2 Attrition Attrition is the loss in productive (volume) capacity due to the incidence over time of windthrow and disease. Traditionally in Ireland an attrition factor of 7.5% has been used in roundwood production forecasting (84). When the attrition concept was first introduced, double mouldboard ploughing and systematic one-line-in-three first thinning, were standard practices. Both contributed to the onset and severity of windthrow. In the interim, the greater proportion of the productive private forest estate has been established using improved cultivation methods e.g. mounding, and will receive either a rack and selection or line and selection first thinning. Furthermore, there is a smaller proportion of the private estate planted on the more exposed/wind prone sites than for State-owned forests. An attrition factor less than 7.5% is thus more appropriate. In the absence of research to provide guidance, a default attrition factor of 5% was used in the private sector forecast published in 2009 (2). This 5% was converted to an annual attrition volume between the age of first thinning and the age of maximum mean annual increment (MMAI) and was deducted from forecast volumes.
Annual Attrition Rate = 5.0 / (MMAI – Age 1st Thin)*100 Forecast volumes (thinning and clearfell) are reduced by calculating the number of years between first thinning and the age at MMAI and multiplying this by the annual attrition factor. As the typical rotation for the main tree species is less than the rotation of MMAI, the volume loss due to attrition is generally less than percentage attrition rate assumed. The choice of attrition factor will very much depend on the individual plantation being valued and indeed may be zero for stable and disease free crops. At a national level, the use of an attrition factor captures losses due to catastrophic storms and disease outbreaks but its use at individual plantation or stand level requires professional judgement.
7.4.3 Harvest Loss Volume losses arising from harvesting operations comprise:-
a) Stump wood above ground level;
b) Bark removed during delimbing and extraction to the roadside / landing;
c) Waste wood arising from cutting into assortments;
d) Logs used to support harvesting machinery along extraction racks;
e) Volume in tree tops where the end diameter is greater than the minimum top diameter; and
f) Volume loss due to cross cutting into product assortments. There are other losses associated with harvesting, as for example, logs left in the forest and not extracted or logs left at the roadside or at the harvest landing, following sale closure. These two categories are not typically counted as harvesting losses but come into play when the harvest volume is compared with the invoiced volume across a customer’s weighbridge.

36
Harvesting losses will vary with a number of factors including:-
a) Harvesting system (tree length, cut to length / assortment);
b) Tree size;
c) Tree species and quality (straightness, branching habit);
d) Timing of harvest (bark losses);
e) Harvesting stage (thinning, clearfell, regeneration felling); and
f) Product assortment specification. Despite the immediate impact of harvesting losses on returns to the (a) forest owner, (b) harvesting contractor and (c) customer, there is relatively little published information on the scale of such losses or on measures to mitigate any potential volume loss. However losses of the order of 8% have been reported (67, 68) for harvesting operations in Papua New Guinea and Brazil. In Russia, harvesting losses varying from 6.46% in western regions to 10 – 15% in Siberian forests have been reported (69). In the USA, in a comparison of harvesting systems, volume losses of 6.7% were recorded (88). In Europe with the increasing focus on wood energy and the role of wood biomass in helping EU Member States meet their renewable energy targets, there is a greater awareness of harvesting losses and their importance. A 2008 study to determine forest energy potential, estimated harvesting volume losses in Finland as being or the order of 8% for pines and spruces (70). The private sector forecast (2) analysed harvest loss information supplied by Coillte in over 57 sales proposals (SPs) totalling 203,000 m3 over a wide range of tree sizes and harvest types. Based on this analysis it used the following default values for all conifer species, apart from Lodgepole Pine South Coastal (LPS) in the private sector forecast:-
(a) First + Second Thinning 12.5% (b) Third + Subsequent Thinning 9.0% (c) Clearfells 5.5%
If the harvest product assortment includes energy wood, then the losses attributable to waste (4%) and tops (2%) would reduce to almost zero. Similarly if the specification is to cut to smaller than 7cm top diameter the losses especially in first and second thinnings will be less. These default values do not include any allowance for improvements in technology, improved management / harvesting practices or recovery over time. Harvesting losses associated with Lodgepole Pine South Coastal (LPS) are higher than for spruce and there is some justification in having specific harvesting loss estimates for this species. There is anecdotal evidence to suggest that LPS on western peats in counties Galway and Mayo has exhibited higher harvest losses than elsewhere in the country. These losses have approached 30% on premature clearfells, especially where roading density was low and extraction racks have had to be strengthened by using on site harvested material.
7.5 Volume Assortments
Volume assortment tables provide the proportion of volume in one or more size categories based on the average stem diameter which by convention in Ireland is measured overbark and on a minimum length size measured in metres. The three standard size categories, based on top diameter, commonly used are (1) 7cm to 13cm, (2) 14cm - 19cm and (3) 20cm and greater. It is important to clarify that these are size categories and do not equate to product classes due to underlying assumptions regarding log lengths and timber quality. Notwithstanding this, these three assortment categories provide the starting point for apportioning the volume into end product categories e.g. stake, pulpwood, small and large sawlogs. Historically between 65-70% of the 14cm plus size assortments converts to sawable volume (3). Prior to the introduction and use of GROWFOR, most foresters used the Forestry Commission assortment tables (91) commonly referred to as the "blue book". This has now been replaced by a more comprehensive mensuration manual which includes additional assortment tables (71).
% Volume Loss by Tree Size - Lodgepole Pine
y = -1.2364x + 26.07
R2 = 0.5439
0.0
5.0
10.0
15.0
20.0
25.0
30.0
0.24 0.20 0.23 0.24 0.20 0.47 0.16 0.41 0.97 0.51
Average Tree Size (m3)
% V
olu
me
Lo
ss
Figure 12: Harvest Loss - Lodgepole

37
Due to the differing habits of growth between Ireland and the UK for conifer species, Coillte introduced an assortment table specific to Sitka spruce being grown in Ireland based on research findings (72) and this assigns a greater proportion of the wood volume to the two larger size categories up to an average tree diameter breast height (dbh) of 32cms and above this, the table is the same as the Forestry Commission.
7.5.1 Product Outturn PEPing refers to the pre-harvest prediction of potential log product yield (potential end products) defined by several descriptors including species, length, small end diameter (SED) range and quality specifications e.g. degree of bow or sweep. The process of PEPing can be carried out at any level, from a single tree to an entire forest plantation. There are two principal types of PEPing system:
a) Indirect prediction based on an initial estimate of assortments from an assessment of tree size and form, irrespective of stem quality, followed by a generic percentage downgrade to account for stem quality trends identified within a stand.
b) Direct prediction based on a combined assessment of the size, shape and quality of individual trees. In general, indirect prediction PEPing systems yield less detailed and less accurate estimates of potential log product yield but are less costly to operate. Conversely, direct prediction PEPing systems yield more detailed and more accurate estimates of potential log product yield and can be used dynamically to simulate various log product yield scenarios based on different log category specifications. However, direct prediction systems are more costly, requiring measurement data based on more detailed tree level and stand level assessments. In order to undertake PEPing, several attributes must be known about the tree, plot or stand being assessed, including:
a) Species;
b) The physical dimensions of the tree(s) – dbh, height, upper stem diameter (stem profile); and
c) Tree quality - tree straightness, forking, wood density, taper, branching habit. Detailed stem quality data are not usually collected as part of forest inventory or management planning in Ireland and the apportionment of volume to the different product categories is based on a combination of experience, tree size, ocular assessment of stem quality and product specification. In the UK, the Forestry Commission developed a system of log quality in the early 1990s with logs being classed as "green" or "red" depending primarily on straightness but also taking into account knot size and number (73). Following on from this, Methley developed a system to assess straightness in Sitka spruce crops as this parameter was determined as the principal indicator of log quality (74). This was further refined and now forms part of data collected during inventory surveys. The system comprises assigning a straightness score on a scale of 1 to 7 to a sample of circa ten trees based on an ocular assessment of the bottom 6m of the stem. A purely visual assessment was found to be as accurate as that using measurement tools and is considerably quicker and easier to complete. The straightness scoring system was validated and shown to have a strong correlation with percentage green log recovery (75). Recent advances in timber mensuration, including the use of terrestrial laser scanning (TLS) technology to provide 3D stem profiles and associated software to analyse the potential end product assortment breakdown and value maximisation represent technological advances in the PEPing process. TreeMetrics, based in Cork, are the only commercial entity currently offering TLS data capture and analysis services.
Management
Plan
Information
Stand
Data ?
GROWFOR
Models
Forestry
Commission
Yield Models
Volumes
DBH,
Mean Tree
Volumes
DBH,
Mean Tree
Assortment
TablesVolume Reduction
Potential
End
Products
Rules based on
Product specifications
Tree size
Quality
Species
Yes
No
Figure 13: Outline of PEPing Process

38
Technology advances are likely to improve the range and quality of data potentially available to both timber buyers and sellers and perhaps lead to greater efficiency in harvesting. However until such technology is being used commercially on a regular basis it is not possible to draw definitive conclusions about improved product recovery and associated timber revenues.

39
8.0 Discount Rates
8.1 General Money received today is valued more highly than the same amount of money at some future time. This is true even if there is no risk regarding the possibility of future payment. If there is risk, then the preference for money today will be stronger. The discount rate expresses the investor’s time preference for funds and their perception of risk. Forest valuations are extremely sensitive to the discount rate used due to the length of time between planting and final harvest which can vary from 30 years for conifers to over 100 years for some broadleaf species like oak. A lot of discussion and opposing views are expressed concerning what discount rate to use in forest valuations and the analysis of forestry investments. The rate chosen can significantly increase or decrease the valuation as well as determine the viability of a forest investment be it either the purchase of bare land for afforestation or the roading of a given forest plantation. A high discount rate favours short term projects, while a low discount rate favours longer term projects. By convention the discount rate is normally applied to real cash flows and so the discount rate is expressed in
real terms. Conversion from the nominal to the real rate should be by the formula;
ir = (1 + in) / (1 + d) –1 where the rates are proportions, not percentages
ir = real rate; in = nominal rate; and d = inflation rate.
The simpler formulation
ir = in – d provides only an approximate result, with decreasing reliability as the inflation and nominal rates increases. Its use, although not uncommon, is not recommended (35). To illustrate the impact of the discount rate on present value, consider a timber revenue of €17,500 due in 35 years time. I f we ignore the natural time preference for funds and use a zero discount rate then the value remains at €17,500. However at a discount rate of 4% the present value is €4,435, using 5% reduces this to €3,137 and at 6% this is further reduced to €2,277 which is equal to approximately only one eight of the future revenue of €17,500. In general terms, the discount rate represents the sum of a benchmark risk free rate and a risk premium, which in turn can be broken into two components (76, 77):
a) Systematic risk (also known as non-diversifiable risk and market risk when related to an investment). This part of the risk in a business's performance is attributable to market wide economic forces, such as inflation, interest rates or business cycles that affect all investments to some extent.
b) Non-systematic risk (also known as diversifiable risk or unique risk). This component is due to factors that are specific to the investment, in this instance to forestry.
No perfect "discount rate reference manual" exists that identifies a suitable discount rate for every type of forest investment., rather discount rates must be estimated (77). The starting point therefore is to identify a risk free rate of return that can be earned on funds. In the past this was usually taken to mean the rate of return on government bonds but Ireland's turbulent economic climate of recent years has seen
€0
€2,000
€4,000
€6,000
€8,000
€10,000
€12,000
€14,000
€16,000
€18,000
€20,000
0% 4% 5% 6%
Discount Rate
Present Value of Timber Revenue due in 35 years
Figure 14: Impact of Discount Rate on Present Value

40
government bonds reduced in value due to the perceived risk of non or partial payment. Notwithstanding this, the risk free rate has been of the order of 2.5% when allowance for inflation has been taken into consideration (22). In general terms there are four approaches to identify the most appropriate discount rate to use in forest valuation or forestry investment analysis (Table 2). Irrespective of which approach used, the objective is to determine the appropriate discount rate to use in the valuation of the forest asset. Table 2: Approaches to Estimating Discount Rates (77)
Approach Key Assumption Data Required
Estimate using Capital Asset Pricing Model (CAPM)
Market rewards investors for risk, not for failures to diversify
Risk free rate; historical returns of a suitable market index and of the specific asset being considered.
Calculate Weighted Average Cost of Capital (WACC)
Firm/project maintain same debt level over time; firm/project have similar risk profiles; capital cost reflects the marginal cost of capital.
Firm market value of debt and equity, historic returns on equity, marginal cost of debt and applicable tax rate.
Survey active investors and or valuers
Honest responses; rates estimated independently; they know the market.
Discount rates; specify whether real/ nominal, before/after tax, benchmark risk free rate
Derive from comparable forest transactions
Buyers seek to maximise profits; winning bid represents market; required data are available
Forest prices; sale characteristics (debt, species, area, volumes); assumptions regarding growth, prices and costs.
8.2 Capital Asset Pricing Model (CAPM) The need to assess the appropriate return on capital has led to the development of the Capital Asset Pricing Model (CAPM). Its underlying concept is that equity holders require a higher return than debt holders because of the higher risk assumed by owning equity (4). When applied to equity capital the CAPM states:-
Ri = Rf + βe (Rm – Rf) where
Ri = Required rate of return for equity holders in shares of asset i; Rm = Rate of return in the equity market as a whole; Rf = Rate than can be obtained from risk free investments; (Rm – Rf) = Average market risk premium; and βe = Equity beta specific to each kind of equity stock or investment.
Ri has been used as an estimate of the discount rate.
Systematic or market risk is a component of the total risk on a specific investment and it describes how returns tend to move with the market as a whole. Some correlation is to be expected, since individual investments are likely to exhibit some common responses to such factors as interest rate charges and fluctuations in the economy. Unique or non-systematic risk defines that proportion of the total risk that is peculiar to a particular investment. Examples in forestry could include fire, pest or disease outbreaks, wind or unforeseen changes in the regulatory framework which restrict or limit forest activities. Investors can reduce most of the unique risk through diversification as with a combination of different investments, individual events tend to be moderated or cancelled out. However a diverse combination of investments cannot escape the impact of systematic or market risk. The CAPM is concerned with market risk and an asset Beta is a measure of the unique or non-systematic risk of an asset relative to the market. Thus CAPM calculates the risk premium of an asset based on its relative return to the overall market ,

41
such as broad measures of the equity markets e.g. Standard and Poors 5005. Beta is a measure of the relative volatility of a specific investment class relative to the market. An investment that correlates perfectly with the stock market has a Beta of 1.0. Thus if the market index increases by 5%, the forest investment with a Beta of 1.0 should also rise by 5%. However an investment with a beta of 0.7 would only increase by 70% of 5% or 3.5%. According to Barclays Capital Equity Gilt Study in 2007 (78), the return on UK equities had averaged 6.9% over the previous ten years and 7% over the previous twenty years. The risk free rate is somewhere approaching 2%. Using these as inputs to the CAPM equation provides an objective estimate of an appropriate discount rate. The difficulty is in deciding on the most appropriate Beta to use. There are no market quoted forest investment companies in Ireland and thus any estimate of Beta will have to be "imported" from outside the country where the investment context may not be similar. Also, if we are seeking a Beta value to arrive at an appropriate discount rate for forest valuation, then we should only consider Beta values for forest companies which limit themselves more or less to forest management. Such companies can be difficult to find as most publicly quoted forest companies have diversified their business albeit in many instances to areas related to their core forest business. Notwithstanding these reservations and difficulties, there are some relevant quoted Beta values available. The New Zealand Forestry Standard (4) quotes the values of Beta from ten sources ranging from 0.5 to 0.8, with most being within the range of 0.6 to 0.75. This latter smaller range reflects, at least in part, the fact that in forestry enterprises there are a number of allowances for risk and so it is plausible, and indeed sensible, to use lower values of Beta so as not to “double count” risk (35). Table 3: Estimate of Discount Rate ( Ri ) Using CAPM
8.3 Weighted Average Cost of Capital (WACC) The WACC approach is frequently used to estimate the discount rate for investment projects and publicly traded equities. It recognises the weighted average cost of an entities' different sources of financing. In its simplest form, the cost of equity capital is multiplied by the assumed proportion of equity financing and the cost of debt likewise multiplied by the assumed proportion of debt financing (4) to arrive at an average. Since financing costs - the rate of interest lenders charge a specific investor and the expected returns expected by shareholders - vary across firms and projects, this approach can be appealing in how it can be tailored to specific investments (77). All else being equal, the WACC of a firm increases as the Beta and rate of return on equity increases, as an increase in WACC notes a decrease in valuation and a higher risk.
Where:
Re = cost of equity; Rd = cost of debt; E =Value equity; D =Value of debt; V = E + D E/V = % of financing that is equity; D/V = % of financing that is debt; and Tc = Corporate tax rate.
5 A stock market index based on the common stock prices of 500 top publicly traded American companies. It differs from other stock market indices like the Dow Jones Industrial Average and the Nasdaq Composite because it tracks a different number of stocks and weights the stocks differently. It is one of the most commonly followed indices for the U.S. economy.
Rm Rf βe Ri
7.0 2.0 0.60 5.0
7.0 1.5 0.60 4.8
7.0 2.0 0.65 5.3
7.0 1.5 0.65 5.1
7.0 2.0 0.70 5.5
7.0 1.5 0.70 5.4

42
The following example shows how a nominal, after-tax WACC might be derived for a timberland investment (22):
Assumptions: Financing = debt 40%, equity 60% Marginal tax rate of investor = 30% Cost of debt to the investor = 7.0% Equity yield rate (using CAPM) = 8.5%
WACC = (0.6 * 8.5%) + (1 - .30) *(0.4 * 7.0%) WACC = 7.1%
The New Zealand Valuation Standard (4) takes the view that in proposing a construct for forest valuation that debt financing should, in the first instance be excluded, the reasons being:-
a) Evidence suggests that lending institutions are reluctant to lend against immature forests unless: i. There is assurance of an ongoing cashflow sufficient to service the debt (interest and capital
repayments); and ii. A combination of assets (more than just the forest itself) is available as collateral security.
b) Levels of gearing vary between corporates and the New Zealand Institute of Forestry (NZIF) does not wish to propose a standard debt equity ratio.
The effect of excluding debt within the WACC is to confine the discount rate assessment to the cost of equity and forest investment risk alone.
8.4 Surveys of Industry Professionals Surveys of industry professionals can offer guidance for estimating discount rates as many of those surveyed also value investments in forestry and work with clients who invest in forestry. Successful surveys typically require some level of ongoing working relationship or quid pro quo where the survey results are shared with respondents in return for their confidential participation. One example of repeated surveys is in New Zealand and has been ongoing every two years since 1997. This survey reports on the discount rate, valuation method and related
parameters e.g. determination of timber prices and the treatment of land in the valuation (Table ).
Table 4: Individual Responses to Survey Questions (79)
Respondent Discount rate post-tax
Discount rate pre-tax
Basis for discount rate
Log prices based on
Cost of land based on
1 7 IDR 4Q Market rental
2 7 9 - 10 Market / consistency Current to 12Q over 5 years
Market rental
3 8.5 - 10 IDR & WACC / CAM Current to trend over 5 years
Market rental or LMV
4 9 - 9.5 CAPM / Survey 18 month Actual rental or 6% of LMV
5 7 - 8.5 large estates 8 - 12 other
IDR Current to 20Q over 5 years
Market rental
6
8 Consistency 12Q LEV
7 8 - 8.5 IDR & WACC / CAPM Forecast to long term average
Market rental or 4-6% of LMV
8
6.8 Survey 12Q LEV
9 7 - 8 IDR / Survey 4Q trending to 12Q
Market rental
10 8 Consistency / Anecdotal
12Q 6% LMV
11 8 - 9 IDR / WACC 4Q trending to forecast
LMV or Market rental

43
Valuers selected the discount rate based on a wide range of information including WACC, CAPM, implied discount rate (IDR) and the results of previous surveys. In Australia, an informal review carried out in 2005, indicated that the range of interest rates used by a group of about 15 Association of Consulting Foresters of Australia (AFCA) consultants was generally in the range 5-10% (35). There are currently no such similar surveys in Ireland.
8.5 Discount Rate Used in Forest Transactions In a market where there are a reasonable number of forest sales or where the specifics of a particular forest sale or sales are known, it is possible to estimate the discount rate used. This can be done by entering the forest specific data into a valuation model and varying the discount rate until the present value approximates the actual sale price. This presupposes that one uses similar timber prices and costs and that the general inventory data are available. As already mentioned under Transaction Method in Chapter 3, in a 2003 study in Finland, the estimated forest incomes were compared with the sales price for 1,404 forest properties distributed throughout the country (31). The results showed the use of an average discount rate of 4% throughout the country. However, there was significant variation with rates of 4 to 5% being used in the southern part of the country and rates of 2 to 3% being used in the north. An analysis of the sale price of State forests in New Zealand concluded that pre-tax discount rates of the order of 9 to 11% were used in valuations of the plantations (80). The 2011 report on forest sales in the UK noted that sale prices continue to consistently exceed asking prices by an average of 27%, implying that purchasers were using a discount rate significantly lower than valuers, although factors such as non-market/non-commercial values attributed by purchasers could also be an explanation.
8.6 Discount Rate - Pre or Post Tax If all forestry revenues were immediately taxable and all forestry costs (including the purchase price) were immediately deductible and at the same rate, then the "equivalent" discount rate to be applied to before-tax cashflows would equal that applied to after-tax cashflows i.e. the same discount rate could be applied to either before-tax or after-tax cashflows and the same value would arise (81). A pre-tax discount rate is generally understood to imply a rate which ignores taxation effects and which is applied to all forest cash flows which similarly avoid any inclusion of taxation. This provides a pre-tax valuation of the forest plantation in question. The tax treatment may differ depending on the status of the owner – a pension fund is different to a company and in turn an individual is subject to different rules and rates. Tax rates and rules may change at the discretion of the Government. Therefore a pre-tax valuation is mostly used. There are two differing interpretations regarding a post tax scenario. The first is that it is the discount rate which is applied to cash flows which explicitly recognise and net out taxation. It therefore is a discount rate which is applied to post tax cash flows. The second interpretation is that a post-tax rate includes adjustments for the effect of taxation. When applied to pre-tax cash flows it is intended to provide the same result. The discount rate contains a surrogate adjustment for tax effects. Typically a lower discount rate is applied to post-tax cashflows, the extent of which reflects the taxation treatment of forestry and the general taxation regime within the country in question (82). Up until recently in Ireland, the occupation of woodlands managed on a commercial basis with a view to the realisation of profits was exempt from income tax and from Capital Gains Tax (CGT) on the forest crop while the underlying land was subject to CGT. Due to this tax treatment, discount rates were applied to pre-tax cashflows. Forest incomes now benefit from an exemption limit while income from commercial woodlands, including the forest premiums is reckonable for the purposes of PRSI and the Universal Social Charge (USC) (18). Notwithstanding the change in the tax treatment, the practice is still to apply the discount rate to the pre-tax forest cashflows. It is important that any Valuation Report states quite explicitly just which type of discount rate is being used, and it is preferable to also include a statement as to why that particular rate was selected.

44

45
8.7 Discount Rate and Risk There are two general approaches to the treatment of risk in forest valuations. The first is to where possible adjust the future cashflows to incorporate the risk while the second is to increase the discount rate used in the valuation. This latter approach has tended to prevail in forest valuations undertaken in Ireland based on an informal sample survey of forestry consultants. However simply increasing / adjusting the discount rate to account for risk assumes that the risk in question is compounding over time. Not all risks increase over time under Irish conditions e.g. fire risk decreases with age, while wind risk increases with age but not perhaps exponentially as an increased discount rate implies. The older the forest plantation the less is the risk of establishment failure or damage from frost or trespass. Also the older a forest plantation, the greater the proportion of recoverable volume following fire or windthrow. Market uncertainty may not be a sufficient reason to increase the discount rate as it may involve outcomes better or worse than expected (76). Klemperer, quoted in (77) demonstrates that for any perceived risk level, the correct risk premium for the discount rate declines with increasing the payoff period and suggests that the further into the future a risky revenue is, the lower the correct risk-adjusted discount rate (RADR) should be, given the same degree of risk and risk aversion. Given the inherent difficulty in identifying the most appropriate risk adjusted discount rate and the time implications of same, the preferred approach is to incorporate where possible as much of the risk in the forest cashflows. Risk should be structurally built into the analysis of the value in an appropriate manner, not simply allowing for it in the discount rate (83). Some examples of this preferred approach under Irish conditions are:
a) Use of an attrition factor in stand volume estimation;
b) Use of harvest loss factors;
c) Applying reduced rotations on unstable sites; and
d) Including the cost of insurance in the cashflow.

46
9.0 Risk There is no such thing as a completely risk free investment. Governments have been known to fall, stock markets to crash, freak weather events to devastate vast areas, banks to go bankrupt. The same applies to forestry. As a form of investment, forestry in countries with a stable political system, clear land ownership rights and access to timber markets can be considered a low to medium risk investment. There are risks however and it is important to state them clearly and where possible to account for them in any valuation. Risks can be classified as being either-
a) Nature based; or
b) Market based.
9.1 Nature Based Risks
9.1.1 Wind Ireland is a windy country relative to most others in Western Europe, although perhaps not experiencing the extreme wind speeds that sometimes occur elsewhere. The incidence of high wind speeds and gales is well documented by the Meteorological Office. Wind coupled with wet mineral or organic soils predispose forest crops to windthrow, often cutting short the preferred rotation length. On drier soil types wind can cause leader damage and breakage in young to pole stage crops. The most common method to account for the risk associated with wind is to classify the crop rotation in terms of top height measured in metres and assign a rotation length that immediately precedes the onset of windblow. The general Windthrow Model, developed with support from COFORD, can be of assistance in determining the appropriate rotation length and the likelihood of wind blow. Users of the model should note the limitations of the model and the correct interpretation of the results indicated (20). The reduced rotation will incur a cost reflected in a decrease in the valuation, as it is typically less than the financial optimum, if the crop had the ability to grow to financial maturity. In terms of valuation, the top height site classification is critical. Both practitioners and potential investors need to be careful to avoid being either overoptimistic or overly conservative in
determining the rotation length with consequent impact on the forest valuation. In areas of high wind risk, it may be a better option to adopt a no-thinning regime coupled with a reduced rotation length or an early thinning with reduced thinning intensity. This may enable the crop to grow on further, but will reduce average tree size with potential consequent impact on revenues and forest valuation. A balance needs to be struck between revenue forgone by not thinning and the risk of losing revenue by opening up the crop to windthrow through thinning. Finally at a forest level, the use of an attrition factor to reduce crop volumes can take account of the risk of windblow but the value used can be subjective. An alternative approach to reducing the rotation length is to increase the discount rate used to allow for the additional risk associated with windthrow. This approach is more subjective and is not recommended. However, a purchaser or investor may have an alternative view.
9.1.2 Fire Ireland has a relatively short fire danger period compared to Mediterranean or Central European countries. Notwithstanding this, fire is a risk, particularly with young coniferous plantations up to thicket stage, especially where they adjoin bogland or
Figure 15: Windthrow Model

47
grassland areas which are burned on a regular basis. The normal forest practices to reduce fire risk include the establishment and maintenance of firebreaks and vigilance / monitoring during the fire danger periods. It is possible to insure a forest plantation against fire and where this is done, the cost should be included in the cashflows. There is normally an obligation (arising from the grant and premium contract with the Forest Service) to replant fire damaged areas; consideration should be given to replanting or reconstitution insurance.
9.1.3 Frost Spring and summer frosts can cause serious damage to a young plantation, resulting in the need for substantial filling-in or even replanting. This can in part be avoided by the correct choice of species and the use of a more frost hardy provenance when available. The risk of frost damage decreases with age as crops increase in height and generally once plantations reach five to seven years, they are relatively safe from frost risk.
9.1.4 Disease Ireland's forests, compared to other European countries, are relatively disease free, due not only to its island status, but also to the enforcement by the Forest Service of hygiene regulations on the importation of plant reproductive material and wood and wood products. There remains however a constant risk of disease, especially for our major coniferous species. The outbreak during the late 1990s of the lesser-banded weevil in the north-west of the country is a case in point. Mainland Europe has been subject to serious insect outbreaks of the European spruce bark beetle (Ips typographus), the Nun moth (Lymantria monacha) and others in the past, although confined mainly though not exclusively to areas where crops are predisposed to disease, due to pollution or the effects of war, where normal sanitary felling operations have ceased. It is impossible to evaluate the risk associated with disease and quantify it in a format suitable for inclusion in a forest valuation. As a minimum, the recommended practices for protection against disease should be included in the forest cashflows.
9.1.5 Flooding Flood risk should be relatively low if the forest site has been carefully chosen and areas prone to flooding avoided. While forests will generally recover from occasional short term flooding, any flooding of a long term nature can result in reduced growth or mortality, apart from damage to the roading or harvesting infrastructure. Changes in land use either upstream or within a catchment or the lack of maintenance on water networks could impact on water dispersal resulting in more prolonged periods of flooding.
9.2 Market Based Risks There are a number of aspects to market based risks. The industry capacity may not expand in line with forecast roundwood production, resulting in an oversupply of timber with a consequent negative impact, from the owner or investors perspective, on timber prices. The timber market or sections of the market e.g. pulpwood, may be depressed at the time of harvest resulting in timber revenues being less than estimated, although this can be mitigated if there is flexibility in the timing of harvests. Timber price increases may not keep pace with inflation resulting in lower timber revenues than anticipated. The opposite of this is where timber prices increase at a rate greater than inflation resulting in an increase in revenues and market value. On the costs side, the unit costs of the main forest operations e.g. harvesting, may increase at a rate greater or less than inflation, thus reducing the net timber revenues and the market value or increasing the net revenues and market value. Irish forest industry is increasingly dependent on export markets and changes in the exchange rate may either have a negative or positive impact on the price that the industry can afford to pay for timber raw material. If one extends the concept of market to include the future management of the forest, then there is the risk that the forest could be mismanaged. This could take the form of over-thinning to take advantage of high prices at a particular moment in time with a consequent reduction in volume production or the lack of supervision of forest operations leading to suboptimal timber volume recovery or lack of overall management with no maintenance or forest management plan.
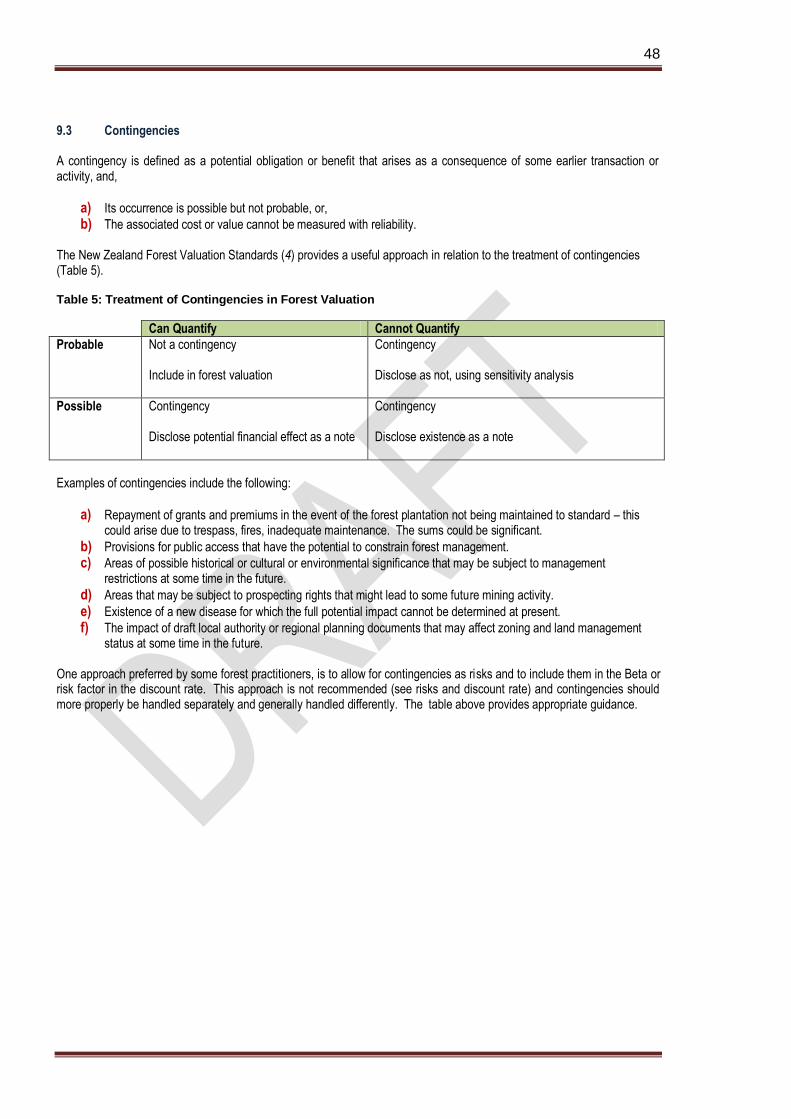
48
9.3 Contingencies A contingency is defined as a potential obligation or benefit that arises as a consequence of some earlier transaction or activity, and,
a) Its occurrence is possible but not probable, or,
b) The associated cost or value cannot be measured with reliability. The New Zealand Forest Valuation Standards (4) provides a useful approach in relation to the treatment of contingencies (Table 5). Table 5: Treatment of Contingencies in Forest Valuation
Can Quantify Cannot Quantify
Probable Not a contingency Include in forest valuation
Contingency Disclose as not, using sensitivity analysis
Possible Contingency Disclose potential financial effect as a note
Contingency Disclose existence as a note
Examples of contingencies include the following:
a) Repayment of grants and premiums in the event of the forest plantation not being maintained to standard – this could arise due to trespass, fires, inadequate maintenance. The sums could be significant.
b) Provisions for public access that have the potential to constrain forest management.
c) Areas of possible historical or cultural or environmental significance that may be subject to management restrictions at some time in the future.
d) Areas that may be subject to prospecting rights that might lead to some future mining activity.
e) Existence of a new disease for which the full potential impact cannot be determined at present.
f) The impact of draft local authority or regional planning documents that may affect zoning and land management status at some time in the future.
One approach preferred by some forest practitioners, is to allow for contingencies as risks and to include them in the Beta or risk factor in the discount rate. This approach is not recommended (see risks and discount rate) and contingencies should more properly be handled separately and generally handled differently. The table above provides appropriate guidance.

49
10.0 Valuing Special Considerations
10.1 Broadleaf Crops
10.1.1 General Obviously in instances where there are comparable sales then these should be used as the basis for valuation. However, as there are relatively few broadleaf sale transactions, the valuing of broadleaf crops in commercial forest plantations presents a number of challenges some of which may not be readily reconcilable. The main challenges centre around the following:-
a) Absence of an appropriate growth model to estimate future volumes; b) Relatively small volumes currently being harvested; c) Lack of reliable historical or current prices; d) Selection of most appropriate management regime; e) Shape, size and location of plot; and f) Variation in quality.
The only available growth models for broadleaf species are the Forestry Commission (FC) models (60). The models for soft broadleaf species - ash, sycamore, alder, birch and cherry - are based on an initial spacing of 1.5m x 1.5m or 4,444 stems per hectare (sph) at the time of establishment while the practice currently under the Forest Service Afforestation Scheme (16) is to use a lower stocking and rectangular spacing of 2.0m x 1.5m or 3,300 sph for these species. The wider spacing will result in an increase in average tree size at a given age, all other things being equal but provides less of a choice in the selection of final crop trees. The impact on total volume production is expected to be relatively minor. The FC models for oak and beech are based on 1.2m x 1.2m spacing or 6,944 sph. The practice under the Forest Service Afforestation Scheme was to use a lower stocking and rectangular spacing of 2.0m x 0.75 m or 6,600 sph for these species when planted as pure crops. The differences in sph are small and it possible to use the FC model to estimate future growth. In 2011, the minimum stocking for oak and beech was reduced by the Forest Service to 2m x 1.5m or 3,300 sph and there is no appropriate FC model that can be used to estimate future volume growth (16). The COFORD 2004 guide to Irish hardwoods estimated that only about 20,000 m3 of roundwood was harvested each year in Ireland but noted that the use of Irish hardwoods had grown considerably over the previous decade with new processors and designers having entered and energised the market (84). The recent interest in renewable energy and woody biomass has seen a dramatic increase in the demand for, and sale of, broadleaf firewood which commands a premium over conifers. The volumes of hardwood loges harvested is likely to remain at a low level until the end of the next decade (2). The small volumes makes it difficult to estimate harvest costs reliably. There is little reliable historical information on the prices achieved by broadleaves. Where information is available, it is generally confined to small lots with a lack of supporting information on timber quality. The situation is changing slowly as more volumes are harvested. However in the short to medium term, it is unlikely that there will be a significant improvement in the quality and range of price information available for broadleaves. Broadleaf crops require more intensive management than conifers under Irish conditions. As the planting of broadleaves has been relatively recent, the experience in the silvicultural tending of these crops is less than for conifers. Broadleaves require shaping and tending (cleaning) and this may not always have been undertaken. Unless these activities are undertaken in a timely fashion, the crop will be devalued. Although referred to in Chapter 2 under the headings of size and fragmentation, broadleaves have tended to be planted in smaller plots than conifers reflecting to some degree their more demanding site requirements. This together with the occurrence of fragmentation makes valuation more difficult. On the positive side, the market for broadleaf firewood does not require areas on the same scale as for conifer pulpwood to be economic, especially

50
for owners who can provide labour and local transport. However it is important that valuers have a good knowledge of any local markets and note any issues pertaining to past and future management. Broadleaves exhibit a wide variation in quality reflecting a combination of species selection, plant quality, past treatment, site selection and inherent variability. This quality is ultimately reflected in the volumes of quality logs that can be recovered at the time of harvesting. Broadleaves, especially when properly managed, can enhance the appearance of a plantation and improve its overall saleability. It is important to recognise that broadleaf crops may be the preferred forest type for individuals whose reason for purchase is lifestyle choice. However valuation of the possible premium payable by such owners is currently impossible in the absence of significant reported transactions. It is likely that such purchasers will emerge but with criteria such as access, visibility and possible proximity that may rule out many woodland lots.
10.1.2 Possible Approach to Valuation In the absence of suitable transaction data, one possible approach to overcome some of the challenges identified above is to classify the broadleaved crop as being:-
a) Good quality commercial; b) Lower quality mainly with limited potential; or c) Retained for landscape and other reasons.
The good quality commercial crops would have the potential to produce quality sawlogs, provided the crop receives the appropriate silvicultural treatment. These stands would be valued similar to conifer stands using the expectation value approach. Ash has been planted widely, often with the objective of producing butts suitable for hurley production. Care should be taken in evaluating the proportion of the crop that is suited to this end use. With species like oak and beech which have a longer rotation than ash, the use of an appropriate discount rate is important. Given the long rotations, a lower rate may be justified, especially as such crops are less prone to wind damage and fire. Stands judged to be of lower quality with insufficient quality stems to form a substantive final crop could be valued on the basis of harvested volumes being directed at the firewood and lower quality timber markets with perhaps only a small proportion of final volumes achieving sawlog prices. Some broadleaf areas, especially those surrounding plantations, may have little or no commercial value apart from firewood due to a combination of quality, size (area) and or shape of the area. Such areas could be valued on the basis that they would be retained for landscape or other environmental considerations. Currently, these considerations do not have a traded market value, although as stated above the presence of broadleaves can enhance the attractiveness for sale of a given plantation which might justify a small premium.
10.2 Joint Ventures and Partnerships In the case of joint venture forest plantations, the normal method of valuation will be to deal with the plantation as a whole and then to apportion the net present value in accordance with the terms of ownership in the joint venture. It will be important to validate that the costs and revenues to date have been apportioned in line with the joint venture agreement and whether there are any outstanding costs or revenues accruing to one or more parties to the joint venture. Accounts should be requested. In the case of plantations which are the subject of a partnership arrangement, the normal method of valuation will be to deal with the plantation as a whole and then to apportion the net present value in accordance with the terms of the partnership. As with joint ventures, it will be important to validate that the costs and revenues to date have been apportioned in line with the joint venture agreement and whether there are any outstanding costs or revenues accruing to either partner. Some partnership arrangements, where there has been an upfront payment on signing of the partnership, may require that this sum

51
be repaid at termination. The quality of record keeping can be variable and it may be difficult to determine what payments have been made to date and what payments are outstanding. In both cases inspection of the agreements governing the relationship between the parties is essential so that any covenants or undertakings are fully understood and reflected appropriately in the valuation.
10.3 Bare Forestry Land On occasion, bare forestry land i.e. land where the forest crop has been harvested or removed, may form part of the plantation being valued or indeed may be the subject of the valuation. Under such circumstances the preferred approach is to use transaction evidence when available. In the absence of transaction evidence, the preferred method is the expectation approach i.e. land expectation value (LEV) as outlined in Chapter 5 Land Value. To calculate the LEV requires assumptions around the site productivity or yield class, species and management regime before an estimate of future costs and revenues can be determined and an appropriate discount rate applied to the cashflows. Notwithstanding this, valuers should be aware that prospective purchasers may have an alternative view which would limit the timeframe to a single rotation rather than in perpetuity as the LEV assumes. Fencing and drainage requirements should be reviewed as to potential cost in addition to other establishment costs. Risks such as deer, weevil, frost and other factors may influence the valuation. Irrespective of which approach is used to value the land, it is important to confirm that a felling licence was issued for the area, that it was valid at the time of clear felling and that any conditions attached to the licence have been adhered to. This will require a site visit.
10.4 Christmas Trees The valuation of Christmas tree plantations is outside the scope of this Code of Practice. Where a crop of Christmas trees forms part or all of the plantation being valued, then specialist advice should be sought as to their valuation.
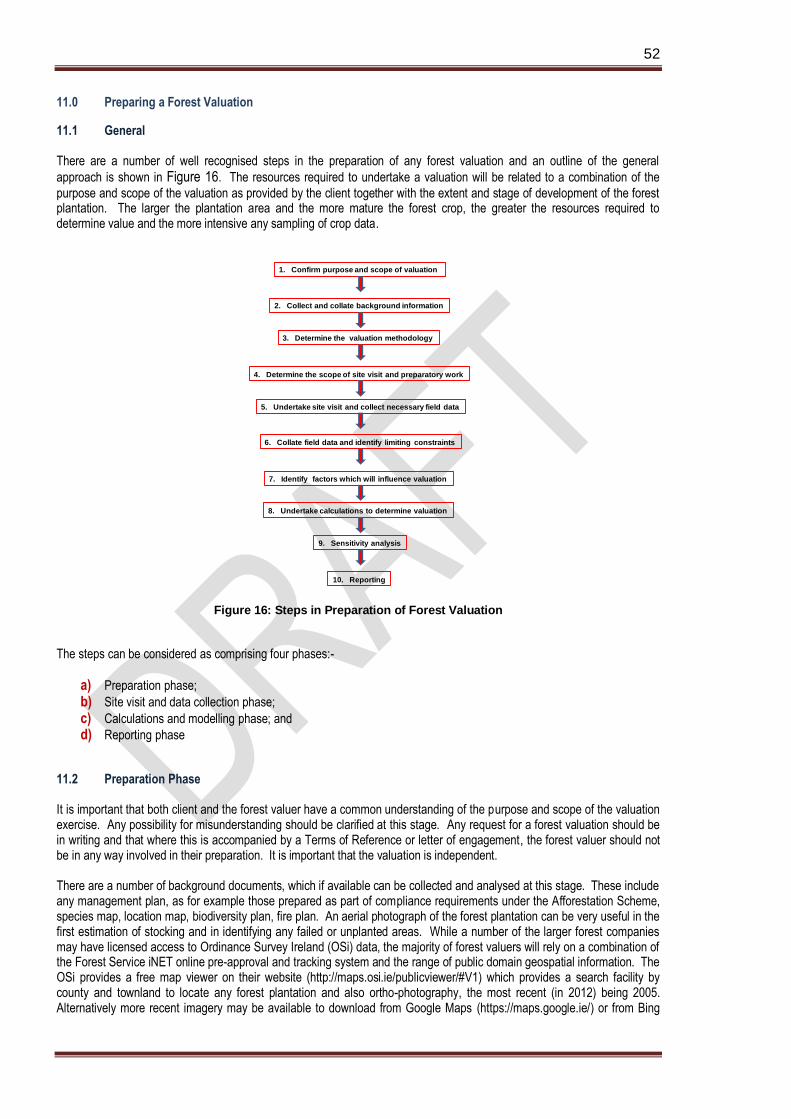
52
11.0 Preparing a Forest Valuation
11.1 General There are a number of well recognised steps in the preparation of any forest valuation and an outline of the general
approach is shown in Figure 16. The resources required to undertake a valuation will be related to a combination of the
purpose and scope of the valuation as provided by the client together with the extent and stage of development of the forest plantation. The larger the plantation area and the more mature the forest crop, the greater the resources required to determine value and the more intensive any sampling of crop data.
Figure 16: Steps in Preparation of Forest Valuation
The steps can be considered as comprising four phases:-
a) Preparation phase;
b) Site visit and data collection phase;
c) Calculations and modelling phase; and
d) Reporting phase
11.2 Preparation Phase It is important that both client and the forest valuer have a common understanding of the purpose and scope of the valuation exercise. Any possibility for misunderstanding should be clarified at this stage. Any request for a forest valuation should be in writing and that where this is accompanied by a Terms of Reference or letter of engagement, the forest valuer should not be in any way involved in their preparation. It is important that the valuation is independent. There are a number of background documents, which if available can be collected and analysed at this stage. These include any management plan, as for example those prepared as part of compliance requirements under the Afforestation Scheme, species map, location map, biodiversity plan, fire plan. An aerial photograph of the forest plantation can be very useful in the first estimation of stocking and in identifying any failed or unplanted areas. While a number of the larger forest companies may have licensed access to Ordinance Survey Ireland (OSi) data, the majority of forest valuers will rely on a combination of the Forest Service iNET online pre-approval and tracking system and the range of public domain geospatial information. The OSi provides a free map viewer on their website (http://maps.osi.ie/publicviewer/#V1) which provides a search facility by county and townland to locate any forest plantation and also ortho-photography, the most recent (in 2012) being 2005. Alternatively more recent imagery may be available to download from Google Maps (https://maps.google.ie/) or from Bing
1. Confirm purpose and scope of valuation
2. Collect and collate background information
3. Determine the valuation methodology
4. Determine the scope of site visit and preparatory work
5. Undertake site visit and collect necessary field data
6. Collate field data and identify limiting constraints
8. Undertake calculations to determine valuation
7. Identify factors which will influence valuation
9. Sensitivity analysis
10. Reporting

53
Maps (http://www.bing.com/maps/). Whichever source is used, it will also provide an insight into adjoining or closely located forest areas which may or may not have a bearing on the valuation. The aerial photography will also enable a view to taken as to adjoining land use and whether this poses a fire or flood risk. The OSI map viewer can also be useful in a preliminary assessment of roading access and distance to processing facilities, though this would need to be confirmed by a site visit as weight limits are not included as a layer in the data and there can be wide variation in the quality of third and fourth class roads. Once identified it is possible to check whether the forest plantation is located in or adjoining a designated protected area. This can be done through either the National Parks and Wildlife Service website (http://www.npws.ie/protectedsites/) or through the free Coillte mapClient which is available on its website but does require registration before it can be used (http://forest.map-server.de/coillte/startRegister.do). It may be appropriate to query if the owner has received any formal designation or proposed designation notification. The species map provides species area information and can be compared with the aerial photography and used to identify the priority areas to be seen during the site visit. However, species maps may be out of date and may not always reflect intervening silvicultural practices such as filling-in and selection thinning. The management plan when present can provide useful information on growth rates (yield class, albeit perhaps notional), planned rotation lengths and thinning regime, roading, previous history, planned interventions and any required activities to be undertaken e.g. second fertilization. Other information that can be gathered during this phase includes but is not necessarily limited to:
a) Any update of timber prices or local markets with relevance to the valuation;
b) Confirmation of the levels and duration of any premium payments;
c) Any felling licence for proposed harvesting and any conditions or communications attaching;
d) Confirmation of any partnership, joint venture or lease arrangements relating to part or all of the forest property;
e) Identification and confirmation of any burdens on the land e.g. rights of way, turbary;
f) Data on any recent forest transactions and whether it is comparable to the plantation being valued;
g) Any update on standard costs which should be included in any valuation; and
h) Whether the plantation has access paths and if yes their approximate location (If the plantation has reached thicket stage and there are no paths, it may be necessary to arrange for paths to be prepared in advance of the site visit. ).
This list is not exhaustive but serves as a preliminary checklist in advance of a site visit.
11.2.1 Determine Valuation Method In Chapter 3 Methods of Forest Valuation, a number of possibilities were discussed together with any special requirements and or shortcomings. There is no one single valuation method that can be applied universally to forest plantations. The most appropriate method depends on an examination of:-
a) Purpose of valuation;
b) Plantation age;
c) Plantation size; and
d) Relevant Issues / Site Factors The following table is not exhaustive but it provides some initial guidance on the determination of the most appropriate forest valuation method. Irrespective of the method chosen, the forest valuer should become familiar with the method and any implicit assumptions and or shortcomings associated with it. In compiling this table, the assumption is that most valuations will be undertaken in the private sector, where forest properties are not generally large scale and where with a number of exceptions, forests are not operated as a going concern with any minimum timber supply contracts in place.

54
Table 6: Checklist for Valuation Method
Plantation Size
Few Stands Can generally value each stand or forest plot separately and combine the values as with few stands there are generally no complex yield scheduling considerations. The most appropriate approach is generally present value. If the stands are approaching maturity the lump sum approach may be relevant. If there have been recent transactions of broadly similar types of plantations, then comparable sales in combination with present value may be the most appropriate.
Many stands Whether the area is being managed as a forest or as a series of separate stands can sometimes be a matter of semantics and opinion. For valuing a forest that includes many stands the most appropriate approach is generally present value.
Plantation Age
Young Immature
Replacement cost may be the most appropriate if the valuation is for insurance purposes. If the valuation is not for insurance and the crop is young then historical cost may have application. However discounted present value may be more appropriate when the crop is approaching canopy closure. It depends on the reason for the valuation being carried out.
Mature If there are only a few stands then lump sum value may be appropriate providing access to markets is available and assured. As the discounting period is likely to be small present value approaches will generally provide similar values.
Mixed Ages Provided there are no requirements for minimum annual or periodic yield, then present value is appropriate although for the younger age classes, historical cost may have application.
Reason for Valuation
Insurance Replacement cost may be the most appropriate for younger crops. The policy wording should be reviewed as it may determine the valuation basis.
Sale Ideally transaction approaches should be used, but as discussed earlier transactions may be limited and difficult to interpret. Present value approaches are generally used.
Investment Present value is probably the most appropriate. However taxation considerations often are the primary concern of the investor and may even drive the investment decision
Financial Reporting
The cost basis may be required by company law but financial statements may include valuations – usually based on net present value.
Financial Management
Present value is the most common
Probate Present value is the most common approach
Compensation The method depends upon the specific case for compensation. Where this involves loss or deferment of future income, then present value method is the most appropriate.
11.3 Site Visit and Data Collection A site visit to the forest plantation being valued is essential and it is not recommended to prepare a Valuation Report without visiting the site. The site visit has four main purposes:-
a) Validate information already collected;
b) Collect forest crop information;
c) Identify issues which could impact on the valuation; and
d) Consideration of the future management regime.
55
A good idea is to prepare a checklist prior to the site inspection to serve as a reminder. This can prevent the need to revisit an area, which can be time consuming and costly depending on its location. It is important to check boundaries to verify the area and access including county road and any possible weight limits on bridges or access roads and to ensure that there are no new incidences or extensions of areas within the plantation which have been damaged by disease, pests, fire or wind. Where these have occurred, they should be mapped and their area calculated. Any yield information should be validated. If the crop is relatively young, this can be done through sampling for top height and using this to assign a general yield class. If the crop is approaching first thinning or has been thinned, then it will normally be necessary to lay down a number of sample plots to obtain information on stocking, species, basal area, height and crop volume. This information can be input to the forecasting of timber volumes. The extent of the sampling and the level of accuracy required will depend on the degree of maturity of the forest crop and guidance on this is provided in a number of publications. An appraisal of timber quality based on an ocular assessment of incidence of harvesting / pest damage together with straightness, taper and branching is a basic requirement and will assist in determining the mix and relative proportions of potential end products (product recovery). During the site visit it is important to be mindful of things such as evidence of deer or other pest damage, harvesting damage and rutting, inappropriate rack layout, incidence of snowbreak or wind damage, presence of disease, insect attack, stock trespass, blocked drains, weak areas, areas in need of fertilization or supplemental planting, health status (yellowing of needles or chlorosis), dumping and if any of the material is hazardous. Similarly if there is any recent evidence of fire damage or inappropriate social behaviour, it should be noted. If there is a forest road consider:
a) If it needs repair or upgrading;
b) If there is sufficient stacking space for harvested material;
c) If the exit to the county road is appropriate; and
d) If the entrance is suitably secure. If no road is present, are there any factors which could significantly impact on construction costs e.g. river crossing. If there is a right of way into the plantation, is the width appropriate and will it be necessary to upgrade to allow access to timber transport? The site visit will allow for an informed view as to the appropriateness or otherwise of the management plan, in particular the thinning regime and the proposed rotation length. In this regard, if the area has been thinned, the presence and degree of any ground damage, the incidence of "pumping" and the occurrence of any blown trees are important considerations. It will also inform about the appropriate costs to include in the valuation.
11.4 Calculating and Modelling Provided that the data collection and validation has been completed, the valuation method or methods determined and any factor which would materially influence the valuation been identified, the next step is to undertake the calculations and growth modelling which will lead to the valuation. The type and extent of the calculations is dependent on the valuation method. To forecast volumes, a choice will need to be taken between the use of Forestry Commission (FC) yield models or GROWFOR dynamic models. Where the forest crops are relatively young, it is not possible to use GROWFOR as it requires stand data as a starting point. Under such circumstances the FC models can be used provided reliable estimates of yield class have been taken. An alternative is to use the first entry of the FC model as input to the GROWFOR model and then grow the crop on in line with the specified future management regime. This provides a more flexible approach as non standard treatments can be accommodated. However dynamic models are not yet available for all species. When the forest crop is at first thinning stage or has been thinned, then the stand data collected can be input to GROWFOR and the crop grown on to reflect the specified management regime. The alternative is to use the nearest FC model and adjust the volumes to reflect any non standard treatment. This latter approach requires a good understanding and expertise in growth and yield modelling and is not generally recommended. The next step is to adjust the volume yields to reflect the findings of the site visit. This includes an allowance for unproductive areas and harvest losses. The use or otherwise of an attrition factor is a case for professional judgement and should be decided upon on a site by site basis.

56
The choice of timber price information is an important consideration. In general terms current prices should be used for mature crops while for young and immature crops, price trend data is preferred. The basis for the prices used should be clearly identified and explained. Where present value method is being used, the choice of discount rate and its basis should be explained. In deciding on costs, the basis for their determination should be explained and any relevant market standard costs included as a supporting reference. Any once off costs should be clearly identified and possible impact analysed. Assumptions about grants from the State should be set out clearly. The main risks should be stated and how they are incorporated into the valuation. The final step is the calculation to determine the valuation and this should be explained including the influencing factors. Sensitivity analysis should be undertaken in relation to the major factors which impact on the valuation e.g. discount rate, timber prices.
11.5 Valuation Report
11.5.1 General
The commissioners and end-users of forest valuation reports have a valid expectation that the reports which they obtain, meet a minimum of reporting qualities. This is independent of any reporting or compliance standard (accounting or membership of professional body) under which the valuation is disclosed e.g. IAS 41. If certain minimum quality attributes are not met, then the usefulness of the valuation is limited. The PwC review of the implementation of IAS 41 in a sample of 25 forest companies in 2011 highlighted a number of shortcoming in the quality or reporting and concluded that the level of transparency and disclosure of the most critical assumptions and also a deeper discussion on the fundamentals behind the valuation process, could generally be improved and that sensitivity analysis around the main assumptions was lacking (43). The quality of forest valuation reports undertaken in Ireland has been variable, ranging from a simple one page statement of valuation, to comprehensive reports outlining the purpose, scope assumptions, methodology, risk and other considerations complete with annexes for maps, management plans, expected volumes and net cashflows. The purpose of the report will usually impact on the extent and content of the valuation report.
11.5.2 Valuation Report Checklist Due to the wide variation in the purpose for undertaking a forest valuation, there is no one report format that will apply in all instances. However, there are a number of common elements that should be considered for inclusion. A potential checklist is set out in Table 7. This is not intended to be exhaustive or to cover every eventuality, rather it is provided as guidance and to promote more comprehensive reporting and disclosure. It is not intended as a substitute for compliance with any professional standard e.g. RICS VS 6 Valuation reports (6) or the disclosure requirements under any relevant accounting standard or legal requirement. It is essential to clearly state the purpose and scope in carrying out the forest valuation. This may be of the form The purpose and scope of this valuation is defined in the Terms of Reference / letter of engagement provided by the client and is attached as Appendix 1 to this report Every forest valuation is limited to some degree. The known limitations should be described in some detail as this is probably the most important information users need to be able to assess the relevance of the forest valuation for their particular circumstances.

57
Table 7: Checklist for Valuation Report
Id Heading Description
(i) For Whom Set out clearly for whom the report is intended (ii) Disclaimers Set out clearly any appropriate disclaimers or qualifications e.g. reliance on data provided
by the Client.
(iii) Executive Summary Briefly outline the purpose and scope of the valuation, the result, the method(s) used and rationale, forest description, any major considerations or issues impacting on value, prices, costs, market value and sensitivity analysis.
1 Purpose and Scope This should outline the purpose of the valuation and any limiting factors. The Terms of Reference or letters of engagement should be annexed and reference made to any important information contained therein. Define any limitations and caveats.
2 Methodology Discussion on possible valuation methodologies and their relevance. Description of method(s) chosen and summary of the rationale. List any assumptions that would have a material bearing on the valuation included in the method chosen.
3 Title Where appropriate include folio reference and proof of title together with any burden and or liens on the title. Include any validation or check on the area and the method used. If title review is not part of the brief that should be explicitly stated.
4 Forest Description Includes the location, area, soils, elevation and aspect, age, stocking, timber quality species, growth classification, health and disease status. Previous history and records. Any current management plan, species map or orthophotography should be annexed. Is it in or adjoining a protected area and implications. Methods and or any sampling used to validate/ ground truth management information e.g. appropriateness of management regime, species, dbh, basal area, volume, stocking, forest area and so on should be described together with any findings and their impact.
5 Costs Discussion on costs included in the valuation, itemising their basis and timing.
6 Revenues Description of the revenues included in the valuation, Proof of premium payments / entitlements. Timber prices used and their derivation including any indexation or trend data with an explanation. Any assumptions around quality and price and timber markets.
7 Taxation Indicate the general taxation considerations that may need to be addressed.
8 Forecast of Growth The growth classification and growth models used and an explanation why a particular model was chosen. Any reductions to standing volume estimates and the basis for same. Description of PEPing procedure if used.
9 Valuation Statement of valuation and date at which it is applicable. Explanation of calculations.
10 Risk and Contingencies
Identify the main risks and describe how these are accommodated in the valuation e.g. in the cashflows or in the discount rate. Describe possible contingencies and how they are addressed.
11 Discount Rate How it was determined and rationale for its basis. The level of risk included
12 Sensitivity analysis Identify key factors which influence value and quantify their impact on valuation e.g. timber prices, discount rate.
13 Appendices Terms of reference, letter of engagement, maps, summary inventory listings, summary management plan, prices, woodflows
There needs to be a clear statement about the dangers in using the results of a forest valuation for purposes for which the study was not intended. It is important to very carefully document all the assumptions that have been made, document and detail the reasons and basis for those assumptions, and describe the methodology used and the rationale for its selection. There is also a need to comment on the extent of professional judgement in the report. The various data sources need to be described in detail. If the data are from external sources to the forest being valued then this should be stated and a comment made about their appropriateness. Professional judgement may be needed to assess the appropriateness of data and growth models used in forecasting volumes. Comments on accuracy may be qualitative rather than quantitative, or ideally a judicious mix of both. To support the valuation and to respond to any query that might arise, a copy of all calculations, expected cashflows,
standard costs, timber price information including worksheets and growth models should be retained.

58
Glossary Assortment: The apportionment of timber volume into different size categories usually on the basis of assortment tables and mean dbh with a minimum length applying. Basal Area: The sum of the cross-sectional areas measured at breast height of the trees in a given stand. Usually expressed as square metres per hectare (m2/ha). Coupe: An area within a forest where harvesting, typically clearfelling, is identified to take place. Diameter Breast Height (dbh): The overbark diameter of standing trees measured at 1.3 metres above ground level. Discount Rate: The rate per annum at which future sums are discounted in order to express them as equivalent present day values. The discount rate may be either "nominal" which includes an estimate for inflation or "real" which excludes inflation. Fair Value: The amount for which an asset could be exchanged, or a liability settled, between knowledgeable, willing parties in an arm’s length transaction Fireline: An unplanted strip of land left between plantations, or along their margins, which is kept clear of vegetation to limit possibility of fire entering the plantation GROWFOR: The software package that provides a user interface for the Irish suite of dynamic stand level growth models. It includes a forest revenue tool and the option to define different timber assortments Harvest Loss: The difference in volume between that of the standing tree and the volume of the products cut from it that are sold. Expressed as a percentage of the standing volume. Land Expectation Value (LEV): The maximum price that a purchaser should be willing to pay to purchase bare land in order to achieve the required rate of return in a forestry land use, assuming that the use continues in perpetuity Market Value: The estimated amount for which an asset or liability should exchange on the valuation date between a willing buyer and a willing seller in an arm's length transaction after proper marketing and where the parties had each acted knowledgably, prudently and without compulsion (RICS 2012). Maximum Mean Annual Increment (MMAI): The age at which the mean annual increment peaks. This corresponds to the intersection of the current annual increment and mean annual increment curves. It is the rotation age which maximises timber volume production. Mean Annual Increment (MAI): The average rate of volume increment of a stand from time of planting to the present day, measured in cubic metres per hectare Plantation: A forest stand created by the regular placement of seedlings or seed. of either native or exotic species selected for their wood-producing properties and managed intensively for timber production. Rotation: The complete life-cycle of a tree crop measured in years, from initial establishment through to final felling (clearfell). Soil Expectation Value (SEV): See Land Expectation Value Stand: A group of standing trees within a forest usually with uniform characteristics that distinguish it from other stands. Stumpage: The value of standing timber net of harvesting and measurement costs. Top Height: The height (m) of the largest 100 diameter trees per hectare. Frequently used as a parameter in growth models. Yield Class: Measure of the rate of volume growth per hectare based on the maximum mean annual volume increment using two cubic metre intervals between the classes

59
Yield Model: Tabular or graphic presentation of the future growth and yield development for a particular species and site productivity. Dynamic yield models allow users to input stand data and thinning prescriptions, while static yield models are completely deterministic.

60
References
1 FAO (2011) Forest Resources Assessment 2010
2 Phillips, H., Redmond, J., Mac Siurtain, M. and Nemesova, A. (2009)
Roundwood production from private sector forests 2009-2028. A geospatial forecast. COFORD, Dublin
3 Phillips, H. (2011) All Ireland Roundwood Production Forecast 2011 - 2028. COFORD, Department of Agriculture Fisheries and Food, Dublin
4 NZIF (1999) NZIF Forest Valuation Standards
5 The Appraisal Foundation (2009)
Uniform standards of professional appraisal practice 2008-2009 Appraisal Standards Board, The Appraisal . USA
6 RICS, UK (2012) RICS Valuation - Professional Standards. March 2012. Royal Institute of Chartered Surveyors, UK.
7 Association of Consulting Foresters of Australia (2004)
Supplement 1 to An Australian Standard for valuing Commercial Forests. Version 1, May 2004. Association of Consulting Foresters of Australia in collaboration with Agriculture, Fisheries and Forestry Australia
8 Leech. J. and and Ferguson, I. (2009)
An Australian Standard for valuing Commercial Forests. Version 2.0.1. Association of Consulting Foresters of Australia in collaboration with Forest and Wood Products Research and Development Corporation
9 IVSC (2011) The IVSC Commercial Valuation Project. IVSC Standards Board Meeting 3 November 2011
10 IVSC (2011) The IVSC Commercial Valuation Project. IVSC Standards Board Meeting 17 June 2011
11 Herbohn, H. and Herbohn, J. (2006)
International Accounting Standard (IAS) 41: What Are the implications for reporting forest assets?
12 Pastila, S. (2012) Forest Valuation Considerations. Invest in Forest Conference - Riga 24-26 Aril 2012
13 API (2008) Valuation and Property Standards. Version 6. Australian Property Institute
14 Appraisal Foundation (2009)
Uniform Standards of Professional Appraisal Practice
15 SIF (2011) Code of Ethics and Professional Conduct
16 Forest Service (2011) Forestry Schemes Manual, December 2011. Forest Service Johnstown Castle Estate, Co Wexford
17 IForUt (2011) Irish Forestry Annual Report & Accounts 2010. Irish Forestry Unit Trust, 1st Floor Unit 3 Woodford Business Park, Santry, Dublin 17
18 Byrne, D (2011) Woodland taxation in the Republic of Ireland. Forestry and Timber Yearbook 2012. ITGA, Dalkey, Dublin
19 RICS, UK (2010) Valuation of Woodlands. RICS Practice Standards UK. GN 64/2010
20 Ní Dhubháin Á., Walshe, J., Bulfiin, M., Keane, Dr. M. and Mills, P. (2010)
Windthrow - Estimating windthrow probability in forest plantations in Ireland
21 EC (2012) Natura 2000 European Commission Nature and Biodiversity Newsletter No. 31, January 2012. DG Environment
22 Bacon, P & Associates Economic Consultants (In Association with Deloitte), (2004)
Bacon, P & Associates Economic Consultants (In Association with Deloitte), A Review and Appraisal of Ireland’s Forestry Development Strategy, Stationery Office, Dublin
23 Forest Service (2012) Forest Road Scheme, January 2012. Forest Service Johnstown Castle Estate, Co Wexford
24 Knaggs, G. and O'Driscoll, E. (2012)
Woodflow and forest-based biomass energy use on the island of Ireland (2010) COFORD Connects Series, Processing/Products No. 27. COFORD
25 Pfeifer, A. (2003) Forest Certification - What does it mean for Irish forestry ?. COFORD Connects, Environment No. 2
26 Wagnière, S. (2011) Forest Valuation: A Knowledge-based View. Dissertation No. 3993 Reprography ETH Zentrum, Zurich
27 Poyry (2011) Stakeholder and Analyst Summary Report Sino-Forest Corporation. Background Papers accompanying the 31 December 2011 Valuation of Sino-Forests China Forest Assets
28 Association of Consulting Foresters of Australia (2009)
An Australian Standard for valuing Commercial Forests. Association of Consulting Foresters of Australia in collaboration with Agriculture, Fisheries and Forestry Australia

61
29 Kauko Viitanen, Simo Hannelius, Markku Airaksinen (2006)
Valuation Guidance of Forest Properties Within Valuation Standards Needed? Shaping the Change XXIII FIG Congress Munich, Germany, October 8-13, 2006
30 UPM Tilhill and Savills (2011)
Forest and Market Report. Issue 13, 2011
31 Hyytiäinen, K. Hannelius, S. & Salminen, O. (2007)
Yksityismetsien arvo tuottoarvolaskelmien ja Markkina-arvojen mukaan. (Valuation of forest properties based on income evaluations and market prices. Maanmittaus 82(2): 28-44 (In Finnish).
34 Ferguson, I. (1997) Valuation of forest assets: Report commissioned by Auditor –General, Australia. http://www.audit.sa.gov.au/95-96/forest
35 NZIF (2010) Allow the use of a cost-based approach to value young stands. Proposal for a change to the NZIF Forest valuation Standard. NZIF Forest Valuation Working Party. Discussion Paper issued June 2010
35 Leech, J. (2007) Handbook to accompany An Australian Standard for valuing Commercial Forests Association of Consulting Foresters of Australia in collaboration with Forest and Wood Products Research and Development Corporation
37 Cotta, H. (1804) Systematische Anleitung zur Holztaxation der Waldungen. Zweite Abtheilung. Berlin: Johann Daniel Sander.
38 FOPER (2010) Introduction to forestry, forest policy and economics. FOPER Online course
39 Tee J., Scarpa R., Marsh D. and Guthrie G (2011)
Real Options Analysis of Afforestation and Reforestation(Article 3.3 of the Kyoto Protocol) under the New Zealand Emissions Trading Scheme 18th Annual Conference of the European Association of Environmental and Resource Economists (EAERE), 29 June- 2 July 2011, Rome, Italy
40 Meade, R., Fiuza, G. and Lu, A. (2008)
Forest and Forest Land Valuation: How to Value Forests and Forest Land to Include Carbon Costs and Benefits. Report prepared for the NZ Ministry of Agriculture and Forestry by NZ Institute for the Study of Competition and Regulation Inc.
41 Manley, B. and Niquidet, K. (2010)
What is the relevance of option pricing for forest valuation in New Zealand? Forest Policy and Economics, Vol 12, Issue 4, April 2010, pp. 299-307
42 PWC (2009) Forest Industry: Application review of IAS 41, Agriculture: the Fair Value of Standing Timber. Pricewaterhouse Cooper, Forest , Paper and Packaging
43 PWC (2011) Forest Industry: Application Review of IAS 41, Agriculture: The Fair Value of Standing Timber. Pricewaterhouse Cooper, Forest , Paper and Packaging
45 Ferguson, I. and Leech, J. (2007)
Forest valuation and the AASB 141 accounting standard. Australian Forestry 2007 Vol. 70 No. 2 pp. 125–133
46 Barnes, Alan (2002) Negative and low LEVs - their nature and attendant problems of analysis. NZ Journal of Forestry, August 2002
47 Hanrahan Dr. K. (2009) Economics of Irish land Markets. Teagasc National Rural Development Conference, Silver Springs Hotel, Cork, October 2009
48 ITGA (2011) Forestry and Timber Yearbook 2012. ITGA, Dalkey, Dublin
49 IFA (2012) IFA Timber Price Survey
50 Teagasc (2012) Timber Prices
51 Phillips, H. (1998) Approaches to forestry investment. Report commissioned by Society of Irish Foresters.
52 Uotila. E. (2000) Problems Measuring the Profitability of Forestry. In Finnish Forest Sector Economic Outlook 2000-2001, Helsinki Research Centre
53 EC (2000) Valuation of European Forests – Results of IEEAF test applications. Eurostat, Luxemburg
54 Phillips, H. (2002) IForUT Valuation Review. Report commissioned by IForUT. Unpublished
55 CSO 2013 Consumer Price Index, July 2012. Central Statistics Office, Cork and Dublin, Ireland
56 CSO 2012 Wholesale Price Index, May 2012. Central Statistics Office, Cork and Dublin, Ireland
57 Johnson, D.R., Grayson, A.J. and Bradley, R.T. (1967)
Forest Planning. Faber & Faber Ltd., London. Pp 513-514
58 Wesikittel, A.R., Hann, D. W., Kershaw, J. A. and Vanclay, J. K. (2011)
Forest Growth and Yield Modeling. John Wiley and Sons Ltd.
59 Broad, L.R. (1998) Growth and Yield Models – An Overview: Workshop - Decision Support Tools in Forest Planning, COFORD, UCD.
62
60 Forestry Commission (1981)
Forestry Commission Booklet 48. Yield Models for Forest Management. HMSO, London
61 Matthews, R. (2008) New models of growth and yield. Presentation to COFORD Forecast Project, February 2008
62 Purser, P and Lynch, T. (2012)
Dynamic yield modes used in Irish forestry. COFORD Connects Silviculture / Management No. 20
63 Garcia, O. (1984) New class of growth models for even-aged stands: Pinus radiata in Golden Down's forest. NZ J. For. Sci. 14:65-88.
64 Garcia, O. (1979) Modelling stand development with stochastic differential equations. In Elliott D.A. (Camp.) Mensuration for management planning of exotic forest plantations, p 315-333. FRl Symposium No. 20. New Zealand Forest Service
66 Forest Service (2000) Forest Biodiversity Guidelines
67 FAO( 1998) Forest Harvesting Case Study 15. Forest harvesting in Papua New Guinea. The PNG Logging COP. FAO of the UN, Rome
68 Winkler, N. (1997) Environmentally sound harvesting, testing the applicability of the FAO model code in the Amazon in Brazil. Forest Harvesting Case Study 8, FAO of the UN, Rome 84pp
69 Obersteiner, M. (1999) Interim report IOR 99-033 Carbon budget of the forest industry of the Russian Federation: 1928-2012. IIASA, Austria
70 Asikainen, A. 2008. Determining forest energy potential in Europe. Joint FAO.UNECE Working Party on Forest Economics and Statistics, 02.03.2008, Geneva.
71 Matthews, R., W. and Mackie, D. (2006)
Forest Mensuration: A handbook for practitioners. Forestry Commission, Edinburgh
72 Jordan, P. (1992) Volume Assortment Tables for Sitka spruce (Picea sitchensis Bong. Carr.) in Ireland. M.Ag.rSc (Forestry) Thesis. National University of Ireland. 133p.
73 Forestry Commission (1993).
Classification and presentation of softwood sawlogs. Forestry Commission Field Book 9. HMSO, London
74 Methley, J. (1998). Timber quality: a pilot study for assessing straightness. Forestry Commission Information Note 10. Forestry Commission, Edinburgh
75 Macdonald, E. Mochan, S.J. and Connolly, T. (2001)
Protocol for Stem Straightness Assessment in Sitka Spruce. Forestry Commission Information Note 39, Forestry Commission, Edinburgh
76 Bill Liley (2000) Focus on the treatment of risk in forest valuations NZ JOURNAL OF FORESTRY, AUGUST 2000
77 Forisk (2006) Discount Rates and Timberland Investments. Timberland Report Vol 8, NO. 3, James W. Sewall Company
78 Barclays Capital (2007) Equity Gilt Study 2007
80 Manley, B. and Bell, A (1992)
Analysis of the value of the State plantations sold in 1990. NZ Forestry 37 (3): 22-27
82 Manley, Bruce (2012) Discount rates used for forest valuation - results of 2011 survey. NZ Journal of Forestry, February 2012 Vol. 56 No. 4
83 Leech, Jerry (2011) Third submission to the Select Committee Inquiry into the Harvesting Rights in Forestry SA Plantation Estates
84 Knaggs, G and Xenopoulou, S (2004)
Guide to Irish Hardwoods. COFORD, Dublin.

63
Further Reading
Airaksinen M. and Hannelius S. (2010)
The Income Approach Combined with Market Prices in Forest Property Valuation. FIG Congress 2010 Facing the Challenges – Building the Capacity Sydney, Australia, 11-16 April 2010
Anon (2009) FOPER Online course in Forest Economics. http://foper.unu.edu/course/?page_id=86
Auditor-General (2009) Forestry Commission of New South Wales (trading as Forests NSW). Auditor-General's Report to Parliament 2009, Vol 10
Australia Houses of Parliament 2011
Interim Report of the Select Committee on Harvesting Rights In Forestry SA Plantation Estates. Laid on the Table of the Legislative Council and ordered to be published on 23 November 2011
Bigsby, H. and Willemse, B (2004)
Internationalisation and the Valuation of Forest Assets. Discussion Paper No. 100, Commerce Division, Lincoln University, Cantebury.
Binkley, C. S. (2008) A Note on the Valuation of Mature Timberland Assets. International Forestry Investment Advisors, LLC Cambridge , MA, USA
Blog (2009) Valuing Timberland IV. The Timberland Blog, 20 February 2009
Central Bank (2011) Valuation Processes in the Banking Crisis – Lessons Learned – Guiding the Future. Central Bank of Ireland, P.O. Box No. 559, Dame Street, Dublin 2.
Cheung, Joe and Marsden, Alastair (2002)
Forest valuation, capital budgeting and discount rates. NZ Journal of Forestry, Nay 2002
Cubbage, F, Mac Donagh, P, Sawinski Jnr J., Morales, V. and Alvarez, J (2005)
Comparative Timber Investment Returns for Selected Plantations and Native Forests in South America and the Southern United States. Southern Forest Resource Assessment Consortium (SOFAC) Meeting May 30-1 June 2005, Research Triangle Park, North Carolina, USA
Deloitte (2008) IAS Plus Special Edition May 2008
Department of Finance (2006)
Budget 2006: Review of Tax Schemes Volume III: Internal Review of Certain Tax Schemes, Department of Finance, February 2006.
Frawley J.P. and Leavy, A. (2001)
Farm Forestry: Land Availability, Take-up Rates and Economics. Teagasc Rural Economy Research Series
Gorman, Peter (2002) Log price expectations and forest valuation. NZ Journal of Forestry, May 2002
Grege-Staltmane, E. (2010) Challenges in accounting the forests - a Latvian case study. Ann. For. Res. 53(1): 51-58, 2010
Hamilton G.J. (1975) Forest Mensuration Handbook. Forestry Commission Booklet No. 39. HMSO, London.
Henson, J. (2012) Is Investing in Forestry a Safe Bet?. Royal Agricultural Society of England Conference on Valuing and adding value to trees and woodlands, April 2012
Hol, P. (2012) Forest Valuations: Methodologies and discussions on requirements. Invest in Forest Conference - Riga 24-26 Aril 2012
Hughes, W.R. (1997) Valuing a forest as a call option. The sale of Forestry Corporation on NZ. University of Waikato Department of Economics Working paper no. 97/3.
Hyldahl, C.A. and Baumgartner, D.C. (1991)
Risk analysis and timberland investments: A bibliography of theory and applications. USDA North Central Experiment Station, General Technical Report NC-143, 1991
Insley, M. (2002) A Real Options Approach to the Valuation of a Forestry Investment. Journal of Environmental Economics and Management 44, 471-492 (2002)
James Seng Khien TEE (2011)
Real Options Analysis of Carbon Forestry under the New Zealand Emissions Trading Scheme. Thesis submitted to University of Waikato
Jeffries, R. (2010) Real Value Valuation for Property in the 21st Century? A Comparison of Conventional and Real value Models. Pacific Rim Property Research Journal, Vol 16, No 4, 2010
KMS Baltics (2012) Land value and timber price trend analysis between Sweden and the Baltics. Invest in Forest Conference - Riga 24th - 26th April 2012
Lafferty, Paul (2006) Forest Valuations. The Property Valuer, Summer 2006.
Leech, J. and Ferguson, I. (2011)
Forest valuation: A primer [online]. Australian Forestry, Vol. 74, No. 3, Sept 2011: 233-235
Macdonald, E, Mochan, S. and Connolly, M. (2009)
Validation of stem straightness scoring system for Sitka spruce (Picea sitchensis )Bong.) Carr.) Forestry, Vol. 82, No. 4, 2009
Manley, B. (2012) Impact of the New Zealand Emissions Trading Scheme on forest valuation. Forest Policy and Economics 14 92012) 83-89
Manley, Bruce (2001) Discount rates used for forest valuation. NZ Journal of Forestry, November 2001.

64
Manley, Bruce (2002) Relationship between discount rates to be applied to before-rax and after-tax cashflows. NZ Journal of Forestry, May 2002
Manley, Bruce (2002) The secondary market for interests in forests - what can we learn. NZ Journal of Forestry, May 2002
Manley, Bruce (2007) Discount rates used for forest valuation - results of 2007 survey. NZ Journal of Forestry, November 2007
Manley, Bruce and Bare B. Bruce (2003)
Equivalence of the expectation and cost compounding methods of forest valuation - Faustmann revisited. NZ Journal of Forestry, May 2003
Mark Willhite (2010) Forestland Investments in the Pacific Northwest
NZIF (2007) Application of accounting standard NZ IAS 41 Agriculture for forest valuation. Technical Practice Note
NZIF (2007) How to recognise the opportunity cost of land in the valuation of a tree crop. Proposal for a change to the NZIF Forest Valuation Standards. NZIF Forest Valuation Working Party, Discussion Paper June 2007
Penttinen. M. and and Rantala, O. (2008)
The International Financial Reporting Standards (IFRS) accounting system as applied to forestry. Working papers of the Finnish Forest Research Institute 93
Phelan, J. (2003) The value of your forest investment. http://www.thefarmforest.com/index.php?option=com_content&task=view&id=30&Itemid=55
Pitigala, G.H and Gunatilake, H. M. (2002)
An Assessment of Financial and Economic Feasibility of Selected Forest Plantation Species. Sri Lankan Journal of Agricultural Economics. Vol. 4 Part 1. Pp121-135
Plantinga, A. J. (1996) Forestry Investments and Option Values: Theory and Estimation. Technical Bulletin 161. Maine Agricultural College and Experimental Station
Richmond, S. (2012) Putting a price tag on individual trees. Royal Agricultural Society of England Conference on Valuing and adding value to trees and woodlands, April 2012
Straka, T. J. and Bullard, S. H. (1996)
Land Expectation Value Calculation in Timberland Valuation. Appraisal Journal (4): 399-405
Susaeta Larrain, Andres I (2005)
Comparative Analysis of the Discounted Cash Flow Approach and Option Pricing Theory for Forest Valuation: a Chilean case study
Tropical Forestry (2012) Valuing Timberland V - The Discount Rate. Tropical Forestry and Timberland News . May 2012
UPM Tilhill (2012) Trends and influences on the UK standing coniferous timber sales market. UPM Tilhill Timber Bulletin, Issue 11 Summer 2012
Valatin, G. (2010) Forests and carbon: valuation, discounting and risk management. Forestry Commission Research Report. Forestry Commission, Edinburgh.
WWF (2010) National Forest Valuation Guidelines. World Wide Fund for Nature - Pakistan 2010
Zhang, D. (1998) Estimating Land Value for Growing Timber on Agricultural Land. Alabama Cooperative Extension System ANR-1132
65
Appendix 1 Examples of Disclaimers and Limitations This report has been prepared for [Enter name and address] and not for any third party and is not an assurance of open market value. Any third party, e.g. a lending institution, should make its own enquiries. This report does not constitute a full management report which would require a more detailed site visit. This report was prepared at the request of and for the exclusive use of the client, [Enter name and address]. This report may not be used for any purpose other than the purpose for which it was prepared. Its use is restricted to consideration of its entire contents. The report has been prepared for [Enter name and address] and is a guide to but not an assurance of open market value. Legal matters are beyond the scope of this report, and any existing liens and encumbrances have been disregarded, and the forest resource has been appraised as though free and clear under responsible ownership and competent management. Unless otherwise stated in this report, the existence of hazardous materials or other adverse environmental conditions, which may or may not be present on the property, were neither called to the attention of [Enter name of Consultant], nor did the consultants become aware of such during the inspection. [Name of Consultant] recognizes the possibility that any valuation can eventually become the subject of audit or court testimony. If such audit or testimony becomes necessary as a result of this valuation, it will be a new assignment subject to fees then in effect. [Name of Consultant] has no responsibility to update this report for events and circumstances occurring after the date of this report. Any liability on the part of [Name of Consultant] is limited to the amount of fee actually collected for work conducted by [Enter name of Consultant]. Nothing in the report is, or should be relied upon as, a promise by [Name of Consultant] as to the future growth, yields, costs or returns of the forests. Actual results may be different from the opinion contained in this report, as anticipated events may not occur as expected and the variation may be significant We have not examined title and same should be examined, particularly in relation to Rights of Way or burdens. . We have not considered non-silvicultural issues such as sporting rights or amenity values, nor have we considered any development potential. Professional advice should be taken where appropriate in relation to taxation considerations and legal issues. We have assumed that the property will continue to be managed for commercial timber production and only timber revenues and existing premium revenues have been assumed (together with land). The valuations were prepared on the general assumption that the relevant crops would be maintained and grown to maturity and that a normal silviculture regime would apply. It is assumed that rotations will be chosen to maximise financial return.

66
Appendix 2 Worked Example - Land Expectation Value The following example illustrates how the land expectation value (LEV) can be calculated. Consider one hectare of clear felled land which is reforested and managed over a 35 year rotation with three thinning events in years 18, 23 and 27. The existing road is upgraded prior to first thinning and there is an annual maintenance charge. In the calculations, the projected revenues have been reduced to allow for cost of sales, unproductive areas and harvest losses.
The costs and revenues are compounded forward to the year of final harvest at an interest rate of 4%. After final harvest, the plantation has a net future value of €9,323.55. These cashflows are then assumed to continue in perpetuity and by applying the formula
LEV = NFV/(1+i)t-1 the LEV in this example is then €3,164.72 and this represents the present value per hectare of the cleared (bare) land for forestry.
Year ItemAmount
(€)
Compound
Factor
Future Value
(€)
0 Establishment -2500 3.9461 -9,865.22
17 Road Upgrade -600 2.0258 -1,215.49
18 Thinning Income 350 1.9479 681.77
23 Thinning Income 750 1.6010 1,200.77
27 Thinning Income 1500 1.3686 2,052.85
35 Final Harvest 17500 1.0000 17,500.00
1 - 35 Annual Maintenance -14 73.6522 -1,031.13
9,323.55
Net Future Value / (((1 + i)^35) -1)
9,323.55 / (((1.04)^35) -1)
9,323.55 / 2.946089
3,164.72
Net Future Value =
LEV =
LEV =
LEV =
LEV =

67
Appendix 3 Historical Standing Conifer Prices This appendix will include:
a) Conifer product prices (roadside) by main species category for the years 2002 to 2011
b) Conifer standing prices for spruce stands i.e. >70% spruce, for the years 2002 to 2011