effects of water management and cultivar on carbon
TRANSCRIPT
Accepted Manuscript
Effects of water management and cultivar on carbon dynamics,plant productivity and biomass allocation in European ricesystems
Viktoria Oliver, Nicole Cochrane, Julia Magnusson, Erika Brachi,Stefano Monaco, Andrea Volante, Brigitte Courtois, GiampieroVale, Adam Price, Yit Arn Teh
PII: S0048-9697(19)32678-6DOI: https://doi.org/10.1016/j.scitotenv.2019.06.110Reference: STOTEN 32764
To appear in: Science of the Total Environment
Received date: 9 February 2019Revised date: 6 June 2019Accepted date: 7 June 2019
Please cite this article as: V. Oliver, N. Cochrane, J. Magnusson, et al., Effects of watermanagement and cultivar on carbon dynamics, plant productivity and biomass allocationin European rice systems, Science of the Total Environment, https://doi.org/10.1016/j.scitotenv.2019.06.110
This is a PDF file of an unedited manuscript that has been accepted for publication. Asa service to our customers we are providing this early version of the manuscript. Themanuscript will undergo copyediting, typesetting, and review of the resulting proof beforeit is published in its final form. Please note that during the production process errors maybe discovered which could affect the content, and all legal disclaimers that apply to thejournal pertain.

ACC
EPTE
D M
ANU
SCR
IPT
Effects of water management and cultivar on carbon dynamics, plant productivity and
biomass allocation in European rice systems
Viktoria Olivera*, Nicole Cochrane
a, Julia Magnusson
a, Erika Brachi
c, Stefano Monaco
b, Andrea Volante
b,
Brigitte Courtoisd, Giampiero Valeb, Adam Pricea, Yit Arn Tehae
aInstitute of Biological Sciences, University of Aberdeen, Cruickshank Building, St. Machar Drive, AB24 3UU,
Aberdeen, UK.
bConsiglio per la Ricerca in Agricoltura e l’analisi dell’ Economia Agraria (CREA), Centro di ricerca cerealicoltura
e colture industriali, S.S.11 to Torino, 13100, Vercelli, Italy.
cDepartment of Life Sciences and Systems Biology, University of Torino, Via Accademia Albertina 13, Torino,
Italy.
dCentre de coopération internationale en recherche agronomique pour le développement (CIRAD), UMR
AGAP, Avenue Agropolis, TA A-108/03, 34398, Montpellier, France
e Present address: School of Natural and Environmental Sciences, Newcastle University, Drummond Building,
Devonshire Terrace, Newcastle upon Tyne, NE1 7RU, UK
* Corresponding author: [email protected]
Keywords: Gross primary productivity, net ecosystem exchange, decomposition, above and belowground
biomass, alternate wetting and drying, European rice cultivation.
ACCEPTED MANUSCRIPT

ACC
EPTE
D M
ANU
SCR
IPT
Effects of water management and cultivar on carbon dynamics, plant productivity and
biomass allocation in European rice systems
Viktoria Olivera*, Nicole Cochrane
a, Julia Magnusson
a, Erika Brachi
c, Stefano Monaco
b, Andrea Volante
b,
Brigitte Courtoisd, Giampiero Valeb, Adam Pricea, Yit Arn Teha e
aInstitute of Biological Sciences, University of Aberdeen, Cruickshank Building, St. Machar Drive, AB24 3UU,
Aberdeen, UK.
bConsiglio per la Ricerca in Agricoltura e l’analisi dell’ Economia Agraria (CREA), Centro di ricerca cerealicoltura
e colture industriali, S.S.11 to Torino, 13100, Vercelli, Italy.
cDepartment of Life Sciences and Systems Biology, University of Torino, Via Accademia Albertina 13, Torino,
Italy.
dCentre de coopération internationale en recherche agronomique pour le développement (CIRAD), UMR
AGAP, Avenue Agropolis, TA A-108/03, 34398, Montpellier, France
e Present address: School of Natural and Environmental Sciences, Newcastle University, Drummond Building,
Devonshire Terrace, Newcastle upon Tyne, NE1 7RU, UK
* Corresponding author: [email protected]
Keywords: Gross primary productivity, net ecosystem exchange, decomposition, above and belowground
biomass, alternate wetting and drying, European rice cultivation.
Abstract
ACCEPTED MANUSCRIPT
ACC
EPTE
D M
ANU
SCR
IPT
Water saving techniques, such as alternate wetting and drying (AWD), are becoming a necessity in modern rice
farming because of climate change mitigation and growing water use scarcity. Reducing water can vastly
reduce methane (CH4) emissions; however, this net climate benefit may be offset by enhanced carbon dioxide
(CO2) emissions from soil. The main aims of this study were: to determine the effects of AWD on yield and
ecosystem C dynamics, and to establish the underlying mechanistic basis for observed trends in net ecosystem
C gain or loss in an Italian rice paddy. We investigated the effects of conventional water management (i.e.
conventionally flooded paddy; CF) and AWD on biomass accumulation (aboveground, belowground, grain), key
ecosystem C fluxes (net ecosystem exchange (NEE), net primary productivity (NPP), gross primary productivity
(GPP), ecosystem respiration (ER), autotrophic respiration (RA), heterotrophic respiration (RH)), and soil
organic matter (SOM) decay for four common commercial European rice cultivars. The most significant finding
was that neither treatment nor cultivar affected NEE, GPP, ER or SOM decomposition. RA was the dominant
contributor to ER for both CF and AWD treatments. Cultivar and treatment affected the total biomass of the
rice plants; specifically, with greater root production in CF compared to AWD. Importantly, there was no effect
of treatment on the overall yield for any cultivar. Possibly, the wetting-drying cycles may have been insufficient
to allow substantial soil C metabolism or there was a lack of labile substrate in the soil. These results imply that
AWD systems may not be at risk of enhancing soil C loss, making it a viable solution for climate change
mitigation and water conservation. Although more studies are needed, the initial outlook for AWD in Europe is
positive; with no net loss of soil C from SOM decomposition, whilst also maintaining yield.
1. Introduction
Irrigated rice (Oryza sativa L.) is the largest consumer of water in the agricultural sector (Thakur et al., 2014)
and can require up to 2500 L of water per kg yield, depending on the rice ecosystem and local climate
(Bouman, 2009). In contrast, wheat and corn use on average 650-900 L per kg (Pimentel et al., 2004). Globally,
ACCEPTED MANUSCRIPT

ACC
EPTE
D M
ANU
SCR
IPT
85-90 million ha of irrigated rice provides 75 % of the world’s rice production, supplying a major staple food for
much of the world’s population (IRRI, 2010; Seck et al., 2012). However, the rise in extreme heat and drought
occurrence, combined with increasing populations, economic growth and diminishing water quality is
intensifying the competition among agriculture, industry and urban populations for finite water supplies (Bates
et al., 2008; Hanjra and Qureshi, 2010). For example, in Europe, irrigation is an essential element in many
types of agricultural production, such as potatoes in northern Europe and cotton and maize in southern
Europe (Baldock et al., 2000; “European Union (EU) agri-environmental indicator,” 2019),and thus comprises a
significant proportion of the total freshwater demand, with approximately 55 % of consumptive water used in
the agriculture sector (Bartram et al., 2002). Although the total European rice contribution is only 0.4 % of the
total global figure (FAO, 2014; USDA, 2015), it has economic, sociocultural and ecological importance in several
Mediterranean countries, including the Ebro Delta in Spain, Rhone Delta in France and Lombardy in Italy. In
these regions, not only does rice production contribute to local economies, but rice fields play a key role in
managing local ornithological fauna populations and macroinvertebrate communities (Faure and Mazaud,
1995; Ibáñez and Caiola, 2018; Longoni, 2010; Lupi et al., 2013), and the harvested area is continually
expanding (Ferrero, 2007; Ferrero and Vidotto, 2010). Thus, there is an urgent need to adopt strategies and
practices that will use water efficiently for the future of irrigated rice production in Europe.
An equally concerning consequence of conventional flooded rice is the associated methane (CH4) emissions,
which occur as a by-product of anaerobic decomposition of plant residues and soil organic matter (SOM).
Subsequently, rice paddies account for 11 % of the total global anthropogenic CH4 emissions (FAO, 2011; Smith
et al., 2014), which is four times higher than for other major cereal crops, such as wheat or maize (Linquist et
al., 2012). With global efforts to mitigate against climate change, reducing greenhouse gas emissions (GHG)
from agricultural practices, such as rice production, is an integral part of the strategy to stabilize climate (IPPC,
2015). As a result, there have been considerable efforts to determine if aerobic cultivation or intermittent
flooding are viable alternatives for maintaining high rice yields, yet simultaneously reducing CH4 emissions
(Bouman and Tuong, 2001). One of the most recent and successful advances is a system of water managed
called Alternate Wetting and Drying (AWD). This approach uses a system of periodic inundation over the rice
production cycle to reduce overall water use and CH4 emissions, while simultaneously ensuring that the rice
crop receives sufficient water input during critical periods of the production cycle, so as to prevent negative
ACCEPTED MANUSCRIPT

ACC
EPTE
D M
ANU
SCR
IPT
impacts on yield and grain quality (Price et al., 2013). Namely, during specific parts of the vegetative growth
cycle (i.e. tillering and stem elongation), rice fields are allowed to drain naturally and are only re-wetted when
the soil water level drops below 15 cm from the soil surface (designed to reflect a soil matric potential of
around -15-20 kPa at 5-10 cm depth and below critical physiological thresholds. In “safe” AWD (Lampayan et
al., 2015), the fields are fully inundated once more for the reproductive phases of plant growth (i.e. panicle
initiation and flowering), in order to promote high levels of grain production and the formation of good quality
grain (Price et al., 2013). Numerous studies conducted throughout Asia and parts of North America have
demonstrated that AWD can reduce CH4 emissions by 35 – 90 %, and improve overall water-use efficiency by
35 - 63 % (Chidthaisong et al., 2018; Chu et al., 2015; Linquist Bruce A. et al., 2014; Rejesus et al., 2011;
Setyanto et al., 2018; Tran et al., 2018; Yang et al., 2017).
In the majority of field trials, grain yields are generally maintained (Yao et al., 2012) or even increased (Jiang et
al., 2017; Gareth J Norton et al., 2017; Gareth J. Norton et al., 2017; Norton et al., 2018; Yang et al., 2017). A
recent meta-analysis based on 56 studies found that safe AWD generally does not impact yield when practiced
either during the vegetative stage or the reproductive phase (Carrijo et al., 2017). Soil physical and chemical
properties were highlighted as being important in maintaining crop yields under AWD practices. Specifically,
yield response of plants grown under AWD performed better in more acidic soils and soils with a higher
organic content (Carrijo et al., 2017). Accordingly, AWD is being promoted more widely in parts of the Indian
sub-continent and Southeast Asia, particularly in regions where water resources are already scarce (IRRI,
2010). This includes countries such as: Bangladesh, Indonesia, Lao PDR, Philippines, Myanmar, Vietnam and
Japan (IRRI, 2010). Yet, despite the uncertainty posed by climate change and the general scarcity of water
resources in rice-producing regions of Europe, we know little about whether AWD is a viable alternative for
European rice farmers. Region-specific knowledge is crucial for assessing the practical viability of this new
management approach, because prior research suggests that the success of AWD is contingent upon local
plant cultivars thriving under AWD, with poorly-adapted cultivars potentially showing a negative response to
reduced water inputs (Matsunami et al., 2012; Sandhu et al., 2017).
However, while research on the effects of water management (including AWD) on yield, grain quality and CH4
flux in rice is relatively well-developed, much less is known about the effects of different water management
ACCEPTED MANUSCRIPT

ACC
EPTE
D M
ANU
SCR
IPT
practices on ecosystem C dynamics, including processes such as net primary production (NPP), ecosystem
respiration (ER), soil organic matter (SOM) decomposition, and biomass allocation (Linquist et al., 2018; Sass
and Fisher, 1997; Wassmann et al., 2009). Given that AWD represents a shift to more oxidizing soil conditions,
one potential impact of AWD is it may accelerate the decay of plant residues and SOM, particularly during the
vegetative growth phase of rice. This could lead to enhanced loss of SOM as CO2, particularly during AWD
cycles, which could partially offset any climate gains made by a net reduction in CH4 emissions.
For example, the few studies which have quantified net ecosystem exchange (NEE) of CO2 from intermittently
flooded paddy fields in Japan, China and the Philippines showed significantly greater CO2 emissions than
continuously flooded paddy soils, implying higher ER (Alberto et al., 2014; Liu et al., 2013; Miyata et al., 2000).
Yet whether the higher ER was the result of increased autotrophic respiration (RA) or enhanced heterotrophic
respiration (i.e. accelerated SOM and plant residue decay; abbreviated RH) is still uncertain. Published studies
have relied on micrometeorological methods (i.e. eddy covariance) to quantify NEE from single-cultivar (rather
than multiple cultivar) studies, and were further limited by the fact that the investigators’ choice of sampling
methodology did not partition ER into its component fluxes (i.e. RA and RH) (Baldocchi D., 2003). In order to
gain deeper insight into the factors that could be regulating ecosystem C loss, it is critical to partition the
principal ecosystem C fluxes such as NEE and ER into their component fluxes, such as gross primary
productivity (GPP), RA and RH (Bhattacharyya et al., 2013; Falge et al., 2002). This is because changes to any of
these component fluxes can influence the balance of soil C storage and CO2 emissions to the atmosphere.
Thus, it is important to determine how these component fluxes vary under different forms of water
management (e.g. CF – continuously flooded versus AWD – alternate wetting and drying), for different
cultivars, and in response to changes in other key environmental variables (e.g. air temperature, soil
temperature, soil moisture content).
Moreover, shifts in soil moisture and other environmental conditions during the vegetative growth phase
could promote changes in plant growth and allocation which could have wider consequences for SOM
formation and storage (Jobbágy and Jackson, 2000). For example, reduction in soil moisture availability could
promote increased plant allocation to roots, deepening of the root profile, or shifts in plant root to shoot
ratios, in-line with plant allocation theory (Bloom et al., 1985; Jobbágy and Jackson, 2000). This could have
ACCEPTED MANUSCRIPT

ACC
EPTE
D M
ANU
SCR
IPT
knock-on effects for how and where plant residues are returned to the soil, with long-term effects for
incorporation of plant residues into SOM, and the overall vertical distribution of SOM stocks throughout the
profile (Jobbágy and Jackson, 2000). Thus, it is critical that we develop a clearer understanding of how water
management strategies like AWD affect not only the net C balance of rice systems but also how plant
allocation and soil C shift in response to water management.
To address these knowledge gaps, we conducted a process-based field experiment that compared the effects
of conventional paddy management (hereafter, continuously flooded rice or CF) and AWD on the C dynamics
of four commercial cultivars common throughout Southern Europe. Specifically, we investigated the effects of
water management and rice cultivar on the principal C fluxes (i.e. NEE, ER), and their components (i.e. GPP, RA,
RH). We also explored how water management and rice cultivar influenced plant biomass production,
including allocation to belowground (root) production, leaves, shoots and grain. We predict that poorly-
adapted rice cultivars will respond negatively to AWD, with a net reduction in total net primary productivity
(NPP). Moreover, we hypothesized that for individual cultivars:
H1. Net ecosystem exchange (NEE) is more positive (i.e. greater net C loss) under AWD compared to CF
due to increased ER under more aerobic soil conditions
H2. Ecosystem respiration (ER) is greater under AWD compared to CF due to enhanced heterotrophic
respiration (RH) and organic matter decay
H3. Total net primary productivity (NPP) and grain yield is similar in AWD compared to CF
H4. Belowground NPP (BNPP) will be greater in AWD compared to CF, while aboveground NPP (ANPP) will
show the opposite trend, in-line with plant resource allocation theory
2. Methods and materials
2.1. Study site and sampling design
Field experiments took place at CREA-Centro di ricerca cerealicoltura e colture industriali, Vercelli
(45°19'21.96"N, 8°22'24.07"E), former CREA-RIS, in the western area of the Po River valley, Italy. These fields
have been under rice cultivation for the last 30 years, with irrigation waters coming from a network of
channels during the growing season (May – September) and fields left fallow during the winter months. Rice
ACCEPTED MANUSCRIPT

ACC
EPTE
D M
ANU
SCR
IPT
straw is not incorporated into the fields after harvest. The climate in the Po valley is temperate and sub-
continental, characterised by a summer mean annual temperature of ~ 23 °C and average annual precipitation
of 1300 mm. The soils are old alluvial soils, and are classified as anthraquic eutrudept, coarse-loamy, mixed,
non-acid, mesic (sand = 49 %; silt = 42 %; clay = %), derived from Quaternary yellow sediment, with a C:N
content of 10:1, bulk density 1.2 (g cm-3) and a pH of 6.4 (Table 1).
The experimental site (20 x 105 m), established in April 2017, was split into eight blocks, with an alternating
paired design of four alternate wetting and drying (AWD) and continuously flooded (CF) replicates adjacent to
each other (Figure 1). Within each block, individual randomised plots of 12 European rice cultivars (1.6 x 5 m)
(Figure 1a and 1b). The rice cultivars included accessions from Italy (Baldo, Vialone nano, Selenio, Centauro,
Loto, and Prometeo), France (Gageron, Gines, and Arelate) and Spain (J.Sendra, Puntal, and Gleva). In this
study, the experimental sampling was conducted on: Arelate, Prometeo, Gleva and Gageron. Gleva and
Prometeo are medium-grain rice, Arelate is long-grain rice and Gageron is short-grain rice. Agricultural and
water management practices are summarized in Table 2. In brief, all plots were fertilised pre-sowing on the
26th April with a commercial dry manure (rate: 260 kg ha-1, total N content: 12.5 %). Top-dress fertilisation was
then added on the 30th June (300 kg/ha, 20-0-30). During the vegetative growth cycle (tillering, stem
elongation), half the plots were subject to AWD with details of this water management provided in section 2.2.
2.2. Water management
Dry seeding took place on 10th May 2017 and both the AWD and CF plots were flooded to 5 cm above the soil
surface on the 14th
June; the AWD plots were allowed to naturally dry out while the CF plots were kept
flooded. On a regular basis, the soil volumetric water content (VWC) at 10, 20, 30 and 40 cm (PR2 Profile
Probe, Delta-T Ltd., Cambridge, UK), the water table depth (piezometer) and the soil matric water potential, at
25 cm depth, (Soilmoisture Equipment Corp. 30 cm) were monitored in every AWD plot (3 replicates in each
AWD plot). The AWD cycles consisted of re-flooding the plots whenever the soil matric water potential
reached -25 kPa (at 25 cm depth) and then allowed to dry out again.
2.3. Carbon dioxide measurements and environmental variables
ACCEPTED MANUSCRIPT

ACC
EPTE
D M
ANU
SCR
IPT
Soil-atmosphere CO2 exchange was measured with an IRGA (EGM-4, PP-systems, Hitchin, UK) CO2 probe and
temperature sensor fitted inside a clear, gas tight PVC cylindrical chamber (10 L volume and 20 L volume
chamber used later in the season to accommodate the taller rice plants). The rate of CO2 accumulation was
measured by placing the chambers over the rice plants for 3 minutes (5 minutes when using the larger
chambers) with instantaneous CO2 concentrations (ppmv) measured every 5 seconds. No chamber bases were
used due to the standing water in the rice paddy fields and in cases where there was no standing water
present at the soil surface (during times of AWD), chambers were placed carefully on the soil surface and a
skirt was applied to create an airtight seal. Net ecosystem exchange (NEE) was determined by using a clear
chamber and ecosystem respiration (ER) measured by covering the chamber to create dark conditions. Gross
primary productivity (GPP) was than calculated by subtracting NEE from ER. Measurements were taken weekly
starting from day 70 – 119 since sowing.
Flux rates were determined using the HMR package (Pedersen et al., 2010) in R 3.0.2 (R Core Team, 2012) by
plotting the best-fit lines to the data for headspace concentration (ppmv) against time (minutes) for individual
fluxes. The Ideal Gas Law was then used to convert gas concentrations (ppmv) to moles of gas using the
following equation:
n = PV/RT [Eq. 1]
where n is the number of moles of CO2 gas (mol), P is atmospheric pressure (atm), V is the volume (L), R is the
ideal gas constant (0.08205 L atm K-1
mol-1
), and T is temperature (K). Fluxes were then reported in mg CO2-C
m-2 hr-1, and annual emissions were estimated by extrapolating each measurement to a 60 day period and
summing for a year.
Soil temperature (at 10 cm and 20 cm depth) and soil moisture (at 10 cm depth) were simultaneously
measured in three locations adjacent to the chambers using a ML2x ThetaProbe with 30 cm rods (Delta-T Ltd.,
UK) and type K thermocouples (Hanna Instruments Ltd., UK).
2.4. Soil CO2 partitioning
ACCEPTED MANUSCRIPT

ACC
EPTE
D M
ANU
SCR
IPT
In order to create root free soil to determine heterotrophic respiration (RH), twenty-four (three per plot) soil
cores lined with micro-pore mesh (50 x 50 µm) were inserted between rows of the rice plants. Soil cores (40
cm deep, 20 cm diameter) were removed and the mesh used to line the hole before placing the soil back to its
original position, whilst keeping soil disturbance to a minimum. CO2 measurements were then taken on these
root excluded collars at the same time as the ER CO2 measurements and autotrophic respiration (RA) was
calculated by subtracting RH from ER.
2.5. Total, above and belowground biomass
Above (ANPP) and belowground biomass (BNPP) were estimated at key stages of plant growth for the
individual cultivars, this included: tillering, panicle initiation, flowering and maturity . The season mean
involved measuring each cultivar when it reached maturity. Belowground biomass was determined by
collecting soil cores (15 cm depth by 10 cm width) using a root auger on all four of the chosen cultivars for the
two treatments. Once collected, the soil was homogenized and roots were removed by hand over a 40-minute
period, which was split into 10-minute intervals. Subsequently, the roots at each interval were cleaned of
residual soil and detritus, dried at 70 °C and weighed. Saturation curves were fitted to the cumulative sampled
dry root mass extracted against time for each core over a 12-hour period. The following equation was used to
determine the saturation curve:
Rt = Rc t/(kr + t) [Eq. 2]
Where Rt is the root mass extracted at time t; Rc is total root mass in the sample; kr is the half saturation
constant (Metcalfe et al., 2007).
Aboveground biomass was quantified by collecting the rice plants from directly where the soil corer was
placed. The plants were dried at 65-70 °C for 48 hours and weighed. When the grain started to develop at the
later stages of plant growth, these were removed and weighed separately. NPP was estimated by using the
total biomass (above and belowground) at the time of harvest.
2.6. Decomposition estimates
ACCEPTED MANUSCRIPT

ACC
EPTE
D M
ANU
SCR
IPT
A decomposition experiment was set up as an additional estimate of soil organic matter mineralization, using
Arelate rice straw. On 20th June 2017, 20 g of dry straw were, weighed and placed inside mesh bags (50 x 50
µm) and then buried at 10 cm depth in groups of 10, in each block (total 80 bags). A bag from each block was
collected every week (8 bags), washed, dried and weighed to determine mass loss. The rate of decomposition
was then calculated from the slope of a linear regression with time against mass loss.
2.7. Statistical Analyses
Statistical analyses were performed using R version 3.0.2 (R_Core_Team, 2012). Extreme outliers (i.e. above
1000 ppm) were observed by visual inspection of the boxplots where points outside of the hinges (third
quartile) were removed and the data were checked for normal distributions. To investigate the effects of
treatment and cultivar on NEE, GPP and ER, a two-way ANOVA and Tukey’s Honest Significant Different (HSD)
post hoc test (P < 0.05) were initially conducted using water treatment and cultivar as independent variables
and NEE, GPP and ER as the response variables, to examine statistically significant differences between means.
Further analysis using a mixed model restricted maximum likelihood analysis (REML) with repeated measures,
was then computed using the lme4 package (Bates et al., 2014), to identify any relationships between these
response variables (NEE, GPP, ER) and extra environmental data measured (independent variables) . The key
independent variables included in the REML model included: water treatment, cultivar, growth stage, soil
temperature (10 cm), soil volumetric water content, aboveground biomass and belowground biomass. . This
linear mixed model considered the violation of independence from repeating measurements on the same
cores and also the nested design of the experiment (cultivar nested within the treatment plots).A Two-way
ANOVA and Tukey’s Honest Significant Difference (HSD) post hoc test (P < 0.05) was used to determine
whether there was an effect of water treatment or stage of growth on the contribution of RA and RH to ER.
The effects of treatment, cultivar and growth stage on above and belowground biomass and yield were tested
using a three-way ANOVA, which included treatment, cultivar, growth stage and their interaction as
independent variables. Response variables included: total plant biomass (roots, straw, grain), aboveground
biomass (straw + grain), belowground biomass (roots) and grain yield. Tukey’s Honest Significant Difference
(HSD) post hoc test (P < 0.05) was then used to determine any significant differences.
ACCEPTED MANUSCRIPT

ACC
EPTE
D M
ANU
SCR
IPT
Simple linear regression analysis with time against mass loss was used to calculate the rate of decomposition
of the litter bags and a two-way ANOVA, which included weight of leaf litter as the response variable and
treatment and time as the independent variables, was used to determine any significant differences.
3. Results
3.1. NEE, GPP and ER
In total there were 4 AWD cycles before keeping all the plots flooded at the commencement of flowering (8th
–
26th August), after which all the plots were dried in preparation for harvesting (2nd November) (Table 2 and
Figures 2a and b).
The results from the two-way ANOVA indicated that neither treatment nor cultivar had a significant effect on
NEE and there was no interaction between the two variables. For the pooled data, NEE under AWD averaged -
15.42 ± 0.96 µmol C m-2 s-1 (range: -37.0 to -0.67 µmol C m-2 s-1), while for CF, NEE averaged -14.66 ± 0.92 µmol
C m-2 s-1 (range: -37.46 to -0.59) (Table 3). The results of the linear mixed effects model still indicated that
neither treatment nor cultivar had a significant effect, but that plant growth stage and soil temperature
significantly affected NEE with higher temperatures and larger plants causing more negative NEE (growth
stage: F(19,3) = 33, p-value < 0.001; soil temperature: F(19,1) = 18.4, p-value < 0.001). The general trend for
both the AWD and CF treatments was that NEE became more negative (i.e. increasing net C uptake) up to day
98, when the plants reached reproductive maturity and all the plots were flooded. This was followed by a
gradual shift towards less negative values (i.e. decreasing net C uptake) up to day 119, when the plots were
drained in preparation for harvesting (Figure 3). NEE (C uptake) was the most negative during panicle initiation
(days 81-95; -23.28 ± 1.91) and flowering (days 96-119; -20.00 ± 1.07), and the most positive during tillering
(days 0-80; -6.13 ± 0.56) and ripening (119-135; -11.50 ± 1.21). Soil temperature affected NEE by increasing
CO2 fluxes when the soils were warmer; i.e. the overall trend was towards more negative values (i.e. greater
net C uptake) when temperatures were warmer. For instance, when temperatures reached their highest
during flowering in August (~ 30 °C), NEE was also at its most negative. When comparing the soil temperature
means between the AWD and CF treatments, no significant difference was observed (AWD = 24.9 ± 2.6, CF =
25.0 ± 25.1 °C).
ACCEPTED MANUSCRIPT

ACC
EPTE
D M
ANU
SCR
IPT
When using a two-way ANOVA on the GPP data, the results also showed no significant effect of treatment,
cultivar or their interaction on GPP. For the pooled data, GPP under AWD averaged 22.41 ± 1.22 µmol C m-2 s-1
(range: 54.41 to 3.87 µmol C m-2 s-1), while for CF, GPP averaged 23.14 ±1.17 µmol C m-2 s-1 (range: 49.21 to
4.79) (Table 3). Analysis using a linear mixed effects model (with the same independent variables as the NEE
analysis above) indicated that once again treatment and cultivar showed no significant effect but that growth
stage and soil temperature significantly affected GPP (growth stage: F(16,1) = 6.0, p-value < 0.01; soil
temperature: F(16,1) = 14.0, p-value < 0.001). The general trend for GPP followed that of NEE, with the most
positive fluxes (net C uptake) during panicle initiation (days 81-95; 31.07 ± 2.71) and flowering (days 96-119;
29.88 ± 1.70), and least positive during tillering (days 0-80; 13.53 ± 0.85) and ripening (119-135; 17.35 ± 1.64)
(Figure 3). Higher GPP fluxes were also observed with higher soil temperatures.
Two-way ANOVA on the ER data also showed no significant effect of treatment, cultivar or interaction on ER.
For the pooled data, ER under AWD averaged 7.14 ± 0.48 µmol C m-2 s-1 (range: 0.58 to 26.99 µmol C m-2 s-1),
for CF, ER averaged 8.77 ± 0.53 µmol C m-2
s-1
(range: 0.54 to 30.34) (Table 3). The linear mixed effects model
(again, using the same independent variables as NEE) indicated that only aboveground biomass (straw)
significantly affected ER (F(16,4.5) = 1, p-value < 0.03), with the biggest fluxes during panicle initiation (days
81-95; 8.87± 1.57 µmol C m-2 s-1) and flowering (days 96-119; 9.89 ± 1.00 µmol C m-2 s-1), when the plants were
at their largest (Figure 3).
3.2. RA, RH and decomposition rates
RA was the dominant contributor to ER for all the cultivars under both treatments, accounting for 83 ± 8 % of
ER (data pooled between treatments and among cultivars; Figure 4a). RA dominated ER throughout the
growing season and at key stages of plant growth. In contrast, mean RH for the pooled data set was
approximately 16 ± 8 % of ER. At its highest, RH reached a maximum of only 29 ± 16 % of ER in the CF plots,
when the plants were tillering (i.e. day 77; Figure 4b).
There was no significant difference in RA and RH between the CF and AWD treatments when the data were
pooled across all plant growth stages (i.e. for RA, AWD = 82 ± 9 % and CF = 84 ± 8 %. For RH, AWD = 18 ± 9 and
CF = 16 ± 8; Figure 4a). However, we observed significant treatment effects during specific plant growth stages.
ACCEPTED MANUSCRIPT

ACC
EPTE
D M
ANU
SCR
IPT
For instance, during ripening, RA accounted for a significantly smaller proportion of ER in the AWD compared
to the CF treatment (P < 0.05; AWD = 73 ± 12 % versus CF = 90 ± 7 %; Figure 7b), whereas RH accounted for a
significantly greater proportion of ER in the AWD compared to the CF treatment (P < 0.05; AWD = 27 ± 12 %
versus CF = 10 ± 7 %). This significant difference between treatments was caused by a significant overall
reduction in ER, and a shift in the relative proportions of RA and RH between the two treatments. In the AWD
treatments, RA declined going from flowering to ripening, while RH showed the opposite trend (Figure 4b). By
contrast, in the CF treatments, neither ER, RA or RH showed a significant shift going from flowering to ripening.
For example, ER in the AWD treatments declined from 9.89 ± 1.00 to 5.85 ± 0.66 µmol C m-2
s-1
going from
flowering to ripening. Likewise, RA declined from 90 ± 3 % during flowering to 73 ± 12 % during ripening. In
contrast, RH rose by 16 %, going from 10 ± 3 % during flowering to 27 ± 12 % during ripening.
In the decomposition experiment, we found that approximately 42 % of the buried rice straw in litter bags was
lost over the 90-day incubation period (-0.03 % decomposition rate day-1). There was no significant difference
between the CF and AWD plots (AWD: y = 95.01 – 3.18x, CF: y = 94.86 – 3.32x) (Figure 5), and decomposition
was not a strong predictor of soil CO2 fluxes (RH) for the pooled dataset (r2 = 0.0732). Drainage did not appear
to influence the decomposition rate-soil CO2 flux relationship.
3.3. Plant biomass, allocation and net primary productivity
NPP was significantly affected by cultivar (F(3,105) = 7.9, p-value < 0.001), treatment (F(1,105) = 28.4, p-value
< 0.001) and stage of growth (F(3,105) = 128.7, p-value < 0.001). For the effect of cultivar, we found that some
plants showed significantly less total plant biomass than others (Figure 6). For example, total plant biomass for
Gleva (1957 ± 142 g m-2) was significantly lower than cultivars such as Gageron and Prometeo (2313 ± 167 and
2473 ± 173 g m-2
, respectively). This difference was particularly observed during panicle initiation (Gleva: 1869
± 200; Arelate: 2186 ± 201; Prometeo 2833 ± 323 g m-2
) (Figure 7). For the effect of treatment, we generally
found that the CF treatment has slightly greater total biomass than AWD (CF = 2447 ± 113 g m-2
versus AWD =
2038 ± 112) (Figure 6). This was specifically evident at the flowering growth stage where the total biomass was
greater under the CF treatments (3009 ± 110) compared to the AWD treatments (2429 ± 57 g m-2) (Figure 8).
For the effect of growth stage, the overall trend was towards increasing total plant biomass gradually as the
ACCEPTED MANUSCRIPT

ACC
EPTE
D M
ANU
SCR
IPT
season progressed. Pair-wise comparisons (Tukey-Kramer HSD, P < 0.05) indicated significant differences
among the growth stages, except during flowering and ripening, where differences were not statistically
significant. Total plant biomass was lowest during tillering (991 ± 66 g m-2
) and rose rapidly during panicle
initiation (2325 ± 121 g m-2
), reaching its largest during flowering (2719 ± 103 g m-2
) and ripening (2934 ± 73 g
m-2).
ANPP was significantly affected by cultivar and growth stage (cultivar: F(3,105) = 11.8, p-value < 0.001; growth
stage: F(3,105) = 181.7, p-value < 0.001). For the effect of cultivar, we found that Gleva produced less
aboveground biomass (AWD = 1247 ± 191; CF = 1253 ± 178 g m-2
) compared to Gageron (AWD = 1545 ± 235;
CF = 1692 ± 212 g m-2) and Prometeo (AWD = 1587 ± 213; CF = 1944 ± 236 g m-2). This was specifically observed
during the panicle initiation growth stage (Prometeo: 1884 ± 240; Arelate: 1221 ± 126; Gleva: 1085 ± 199 g m-2
)
(Figure 6 and 7). For the effect of growth stage, the overall trend was an increase in aboveground biomass at
every key growth stage; tillering had the smallest aboveground biomass (e.g. 376 ± 30 g m-2) and ripening the
largest (2398 ± 52 g m-2
). When analysing the grain separately to the straw, there were no statistically
significant differences between cultivars or treatment.
BNPP was significantly affected by treatment, growth stage, and a treatment by growth stage interaction. For
the effect of treatment (F(1,105) = 19.3, p-value < 0.001), we found that belowground biomass was
significantly lower in AWD (613 ± 31 g m-2) compared to CF (819 ± 43 g m-2) (Figure 6). For the effect of growth
stage ((F(3, 105) = 12.6, p-value <0.001), we found that root biomass tended to vary at different stages of plant
growth. Belowground biomass was lowest during tillering (616 ± 76 g m-2), and highest during panicle initiation
(883 ± 62 g m-2) and flowering (828 ± 66 g m-2). Belowground biomass was at intermediate levels during
ripening (537 ± 28 g m-2). The three-way ANOVA indicated that root biomass was significantly different among
all the different growth stages, except for panicle initiation and flowering which did not differ significantly
from each other (Tukey-Kramer HSD, P < 0.05) (Figure 7). We also found a weak but significant growth stage by
treatment interaction ((F(3,105) = 3.3, p-value < 0.02)); during tillering, AWD and CF treatments showed
significant difference in belowground biomass (AWD = 443 ± 52 compared to CF = 788 ± 60 g m-2
) (Figure 8).
ACCEPTED MANUSCRIPT

ACC
EPTE
D M
ANU
SCR
IPT
4. Discussion
4.1. No change in net ecosystem exchange and carbon storage with reduced water inputs
The rice paddies under both water management systems were net sinks of atmospheric C and did not differ
significantly from each other in terms of NEE, GPP, RE or decomposition rates for the seasonal mean or during
any of the key stages of plant growth measurement. Mean daily NEE in the CF rice paddy was -15.21 ± 0.95 g C
m-2 d-1 (range:-38.87 to -0.61), and GPP 24.01 ± 1.20 g C m-2 d-1 (range: 51.07 to 4.97), affirming prior results of
rice paddy studies using eddy covariance techniques in East Asia, India and the USA, where NEE estimates are
between 5 and -39 and GPP between 5 and 50 g C m-2
day-1
(Alberto et al., 2009; Bhattacharyya et al., 2013;
Miyata et al., 2005; Nay‐Htoon et al., 2018; Saito et al., 2005; Swain et al., 2016). However, unlike in other
studies where they reported a more positive NEE in intermittently flooded systems (Alberto et al., 2014; Liu et
al., 2013; Miyata et al., 2000), mean daily NEE fluxes under AWD in this study were very similar to CF (-16.00 ±
1.00 g C m-2 d-1 (range: -38.39 to -0.70), and GPP 23.26 ± 1.27 g C m-2 d-1 (range: 56.46 to 4.02)), challenging our
first hypothesis (H1). This is because ER was unchanged under more aerobic soil conditions, which also runs
counter to what was expected in our second hypothesis (H2), but is supported by the results from
decomposition experiment where no change was observed in decomposition rate.
Rates of NEE and GPP were more affected by the specific stage of plant development and soil temperature,
rather than with water management. There was a clear seasonal trend in CO2 fluxes, with more negative NEE
values (i.e. increasing net C uptake) observed as the rice plants reached heading to flowering growth stage,
followed by a steep decline in net C uptake (i.e. less negative NEE values) as the plants reached maturity.
These results are consistent with other rice studies, and are explained by an increase in GPP as aboveground
plant biomass and leaf area index (LAI) increases as plants reach heading and flowering growth stages (Alberto
et al., 2009; Campbell et al., 2001; Miyata et al., 2005; Saito et al., 2005). This is subsequently followed by a
decline in GPP towards the ripening growth stage due to leaf senescence or reduction in leaf greenness
(Pakoktom et al., 2009; Swain et al., 2016). Factors such as temperature and light play an important role in
regulating rates of ER, NEE and GPP, with peaks in temperature and light availability during July and August
ACCEPTED MANUSCRIPT

ACC
EPTE
D M
ANU
SCR
IPT
facilitating high rates of C uptake during heading and flowering. (Krishnan et al., 2011; Wohlfahrt Georg and Gu
Lianhong, 2015; Xin et al., 2017). One potential issue is that the relationships between growth stage or
temperature and C fluxes could be confounded, because mean air temperatures are generally warmer during
later phases of plant growth.
Unlike NEE and GPP, ER was more affected to changes in aboveground biomass, but not to plant growth stage
or temperature. Autotrophic respiration dominated ER in this study site (AWD = 82 % and CF = 84 % of ER),
with RH accounting for a much smaller proportion (AWD = 18 % and CF = 16 % of ER) of ER. The proportion of
RH from our CO2 partitioning experiment was within the range (16 ± 8 % of ER) of other cropland systems (5 -
40 %), so these data are not unusual in and of themselves (Hanson et al., 2000; Suleau et al., 2011; Swinnen,
1994). Our findings are also broadly in agreement with other paddy studies that have sought to partition RA
and RH by measuring soil CO2 flux between unvegetated plant rows (i.e. RH ranging from 0.02-3.91 g C m-2 d-1)
(Iqbal et al., 2009; Liu et al., 2013; Nishimura Seiichi et al., 2014), emphasizing the important role of plant
metabolism in modulating ER and NEE in rice systems. While it is somewhat surprising that temperature did
not play a more important role in regulating ER, the relative importance of aboveground biomass and RA in
determining rates of ER suggests that ER during the growing season may be more strongly determined by the
growth and activity of the plant community, rather than by abiotic variables such as temperature.
Results for our AWD treatment are novel and important from a climate change mitigation perspective,
because these data imply that soil and ecosystem C stocks in European rice soils are less likely to be
destabilised by a shift towards less water-intensive production systems, such as AWD or other forms of
intermittent drainage. Thus, in addition to the benefits of reduced emissions of CH4 under AWD, there is no
additional risk of enhanced soil C loss, which could offset the potential climate benefits of AWD in a European
context. However, our results are also surprising because other intermittent drainage studies suggest that
aerobic soil conditions can enhance ER (Liu et al., 2013; Nishimura Seiichi et al., 2014), with some paddy
systems changing from a net sink to a source of CO2 with increased soil drainage (Miyata et al., 2000). Our
findings also run counter to expectations from other human-affected temperate wetlands (e.g. managed
peatlands), where investigators have observed enhanced SOM mineralisation and ecosystem C loss following
drainage (Boyd, 1995; Hooijer et al., 2010; Jungkunst Hermann F. and Feidler Sabine, 2007; Moore and Dalva,
ACCEPTED MANUSCRIPT
ACC
EPTE
D M
ANU
SCR
IPT
1993). One possible explanation is that the 1-2 week wetting-drying cycle for our AWD system was not
sufficient to cause an observable shift in the carbon metabolism of the soil; this interpretation is supported by
findings from our leaf litter decomposition experiment, which showed no significant difference in decay rates
between AWD or CF treatments, implying that the underlying carbon metabolism of the soil was not altered by
AWD. Alternatively, it is possible that the low C stock of these soils (1.3 %; 13.66 ± 3.32 g Kg-1) meant that
there was relatively little labile OM to oxidise or that the quality (i.e. relative lability of the SOM) was too poor
to support high rates of RH, even under more aerobic conditions (Muhr Jan et al., 2011; Swails et al., 2017).
However, this interpretation of the data is not fully supported by the results of the decomposition experiment;
under a situation where soil RH is constrained by a combination of both low redox potential and labile C
availability, then one would predict that alleviation of both these conditions would lead to a significant
increase in rates of organic matter utilization. Yet in the decomposition experiment, we did not see a
significant increase in decay rates of rice straw under AWD.
4.2. Effects of water management and cultivar on plant productivity, allocation and yield
Even though NEE, GPP, ER and decomposition rates did not differ significantly among treatments or cultivars,
we did observe differences in plant productivity and allocation. Crucially, however, yield was not significantly
impacted by water management, partially supporting H3. The overall trend was towards slightly greater total
plant biomass in the CF compared to AWD treatments, partially falsifying H3. No significant effect of AWD on
yield has also been observed in an experiment in Bangladesh. However, they also recorded consistently higher
harvest index values on plants grown under AWD, which was attributed to a change in the allocation of
resources, with either the number of tillers or productive tillers increasing with drier conditions (Gareth J.
Norton et al., 2017). Differences between water treatments were particularly evident during the flowering
stage of growth, when differences in total plant biomass were most pronounced between water treatments.
Interestingly, the differences in total plant biomass and productivity were attributable to differences in
belowground biomass and productivity (BNPP) between water treatments, rather than due to differences in
aboveground biomass and productivity (ANPP), challenging H4. Contrary to expectation, ANPP did not differ
significantly among water treatments, whereas BNPP was significantly lower in AWD compared to CF
treatments. We predicted that water stress might inhibit leaf production and cause a decline in leaf area,
ACCEPTED MANUSCRIPT

ACC
EPTE
D M
ANU
SCR
IPT
leading to retarded leaf growth and light interception, and hence reduce ANPP (Lilley and Fukai, 1994).
Likewise, in-line with plant allocation theory, we predicted that the plants would allocate more energy and
resources to roots over shoots, in response to reduced water supply (Sandhu et al., 2017; Zhang et al., 2009).
Contrary to expectation, we observed the opposite of these trends. We suspect that root growth may have
been restricted because AWD facilitated particle cementation and soil compaction in the silty clay loam soils
found at this study site, inhibiting root growth (Rao and Revanasiddappa, 2006). In 2015, a penetrometer
survey was carried out on the same site as this study to determine whether the load-bearing capacity of the
soil was affected by periods of draught. The results showed that the top 15-30 cm were harder under AWD
(1254 ± 167 KPa) compared to CF (807 ± 111 kPa) and that once the plots were reflooded, the soils did not
recover back to their original softness. However, the soils were not hard enough to be considered impactful on
root growth. Alternatively, it is possible that roots in the AWD treatment may have been growing more
laterally or vertically (i.e. >15 cm; below the sampling depth utilised in this study) (Gu et al., 2017), and were
not representatively sampled by our sampling methodology.
In terms of the effect of cultivar, all of the cultivars showed similar trends in productivity, allocation and yield,
except the Gleva cultivar. Gleva consistently showed lower aboveground biomass and ANPP at all growth
stages compared to the other cultivars. For all four cultivars on both treatments, there was a rapid increase in
ANPP as the rice reached flowering stage, correlating with GPP. The only significant difference observed was a
lower ANPP in Gleva at all growth stages, compared to the other cultivars. However, even though GPP is
primarily controlled by LAI, the significantly lower aboveground biomass in Gleva was not enough to
significantly reduce GPP. On average among the four cultivars, AWD delayed maturity by only two days;
previous fields trials have shown delays up 17 days, but similar to this study, no significant loss in yields were
reported (Howell Katharine R. et al., 2015; Sudhir-Yadav et al., 2011). The BNPP followed a different trend to
ANPP, where BNPP on all the cultivars increased up to panicle initiation and then declined during flowering
and even further at ripening. In other rice studies, the proportion of photosynthetic C allocated underground
has also been documented to significantly decrease after tillering to maturity (Watanabe et al., 2004).
5. Conclusions
ACCEPTED MANUSCRIPT

ACC
EPTE
D M
ANU
SCR
IPT
This study demonstrates that using water saving techniques such as AWD could be a workable solution for
sustainable and environmentally friendly rice cultivation in Northern Italy and potentially in through the rest of
southern Europe, without the associated risks of enhancing C losses from aerobic SOM decomposition or
compromising crop yield. By determining the effects of AWD on ecosystem C dynamics, we were able to
establish the underlying mechanistic basis as to why no C losses were observed. We hypothesised that NEE
would be more positive under AWD compared to CF due to increased ER (in particular RH) under aerobic soil
conditions (H1. and H2). However, these hypotheses were rejected because NEE, ER and RH were significantly
unaffected by AWD conditions. We also hypothesised that NPP and grain yield would be similar in AWD
compared CF (H3.). This was confirmed with yield showing no effect but greater plant biomass (NPP) was
observed under AWD. Interestingly BNPP was reduced while ANPP increased in AWD compared to CF,
challenging plant resource allocation theory (H4.). In our system, the main driving factors for C dynamics were
ANPP and soil temperature and not RH as previously thought. Whilst the overall investment of C to the root
system was reduced under AWD for the four rice cultivars, there was no effect of treatment on the
aboveground biomass or yield, suggesting only partial stress on the rice plants under these controlled levels of
water reduction. Our study therefore highlights the importance of using ‘safe’ AWD and calls for further
research to push these boundaries and assess the impact of longer cycles of AWD on C dynamics and over
multiple years, considering our growing global need to conserve water. Additional studies are also needed to
incorporate a range of organic rich paddy soils to determine whether soil C metabolism will increase when
more labile organic carbon is available.
Declarations of interest: none.
Acknowledgements: We thank the researchers at CREA-Centro di ricerca cerealicoltura e colture industriali,
Vercelli, for allowing us to use their facilities, and the technical staff for their assistance. This research was
conducted in the framework of the FACCE-JPI project GreenRice (Sustainable and environmental friendly rice
cultivation systems in Europe) and was supported by the Biotechnology and Biological Sciences Research
Council (BBSRC).
ACCEPTED MANUSCRIPT
ACC
EPTE
D M
ANU
SCR
IPT
6. References
Alberto, Ma.C.R., Wassmann, R., Buresh, R.J., Quilty, J.R., Correa, T.Q., Sandro, J.M., Centeno, C.A.R., 2014.
Measuring methane flux from irrigated rice fields by eddy covariance method using open-path gas
analyzer. Field Crops Research 160, 12–21. https://doi.org/10.1016/j.fcr.2014.02.008
Alberto, Ma.C.R., Wassmann, R., Hirano, T., Miyata, A., Kumar, A., Padre, A., Amante, M., 2009. CO2/heat
fluxes in rice fields: Comparative assessment of flooded and non-flooded fields in the Philippines.
Agricultural and Forest Meteorology 149, 1737–1750.
https://doi.org/10.1016/j.agrformet.2009.06.003
Baldocchi D., 2003. Assessing the eddy covariance technique for evaluating carbon dioxide exchange rates of
ecosystems: past, present and future. Global Change Biology 9, 479–492.
https://doi.org/10.1046/j.1365-2486.2003.00629.x
Baldock, D., Caraveli, H., Dwyer, J., Einschütz, S., Petersen, J.E., Sumpsi-Vinas, J., Varela-Ortega, C., 2000. What
are the environmental impacts of irrigation on the european union.
Bartram, J., Thyssen, N., Gowers, A., Pond, K., Lack, T., Danzon, M., Jiménez-Beltrán, D., 2002. Water and
health in Europe: a joint report from the European Environment Agency and the WHO Regional Office
for Europe. World Health Organization Regional Publications-European Series.
Bates, B., Kundzewicz, Z., Wu, S., 2008. Climate change and water. Intergovernmental Panel on Climate Change
Secretariat.
Bates, D., Maechler, M., Bolker, B., Walker, S., 2014. lme4: Linear mixed-effects models using Eigen and S4. R
package version 1, 1–23.
Bhattacharyya, P., Neogi, S., Roy, K., Rao, K., 2013. Gross primary production, ecosystem respiration and net
ecosystem exchange in Asian rice paddy: an eddy covariance-based approach. Current science 104,
67–75.
Bloom, A.J., Chapin III, F.S., Mooney, H.A., 1985. Resource limitation in plants-an economic analogy. Annual
review of Ecology and Systematics 16, 363–392.
Bouman, B., 2009. How much water does rice use? Rice Today, January March.
ACCEPTED MANUSCRIPT

ACC
EPTE
D M
ANU
SCR
IPT
Bouman, B.A.M., Tuong, T.P., 2001. Field water management to save water and increase its productivity in
irrigated lowland rice. Agricultural Water Management 49, 11–30. https://doi.org/10.1016/S0378-
3774(00)00128-1
Boyd, C.E., 1995. Soil Organic Matter and Aerobic Respiration, in: Boyd, C.E. (Ed.), Bottom Soils, Sediment, and
Pond Aquaculture. Springer US, Boston, MA, pp. 149–193. https://doi.org/10.1007/978-1-4615-1785-
6_5
Campbell, C.S., Heilman, J.L., McInnes, K.J., Wilson, L.T., Medley, J.C., Wu, G., Cobos, D.R., 2001. Seasonal
variation in radiation use efficiency of irrigated rice. Agricultural and Forest Meteorology 110, 45–54.
Carrijo, D.R., Lundy, M.E., Linquist, B.A., 2017. Rice yields and water use under alternate wetting and drying
irrigation: A meta-analysis. Field Crops Research 203, 173–180.
https://doi.org/10.1016/j.fcr.2016.12.002
Chidthaisong, A., Cha-un, N., Rossopa, B., Buddaboon, C., Kunuthai, C., Sriphirom, P., Towprayoon, S., Tokida,
T., Padre, A.T., Minamikawa, K., 2018. Evaluating the effects of alternate wetting and drying (AWD) on
methane and nitrous oxide emissions from a paddy field in Thailand. Soil Science and Plant Nutrition
64, 31–38. https://doi.org/10.1080/00380768.2017.1399044
Chu, G., Wang, Z., Zhang, H., Liu, L., Yang, J., Zhang, J., 2015. Alternate wetting and moderate drying increases
rice yield and reduces methane emission in paddy field with wheat straw residue incorporation. Food
Energy Secur 4, 238–254. https://doi.org/10.1002/fes3.66
European Union (EU) agri-environmental indicator [WWW Document], 2019. . Eurostat - statistics explained.
URL https://ec.europa.eu/eurostat/statistics-explained/index.php/Agri-environmental_indicator_-
_irrigation#Context
Falge, E., Tenhunen, J., Baldocchi, D., Aubinet, M., Bakwin, P., Berbigier, P., Bernhofer, C., Bonnefond, J.-M.,
Burba, G., Clement, R., 2002. Phase and amplitude of ecosystem carbon release and uptake potentials
as derived from FLUXNET measurements. Agricultural and Forest Meteorology 113, 75–95.
FAO, 2011. FAOSTAT Agricultural data.
FAO, I., 2014. WFP. The state of food insecurity in the world 80.
Faure, J., Mazaud, F., 1995. Rice quality in the European Union. Agriculture et Développement 2–12.
Ferrero, A., 2007. Rice scenario in the European Union. Cahiers Agricultures 16, 272–277.
Ferrero, A., Vidotto, F., 2010. History of rice in Europe.
ACCEPTED MANUSCRIPT

ACC
EPTE
D M
ANU
SCR
IPT
Gu, D., Zhen, F., Hannaway, D.B., Zhu, Y., Liu, L., Cao, W., Tang, L., 2017. Quantitative Classification of Rice
(Oryza sativa L.) Root Length and Diameter Using Image Analysis. PLoS ONE 12, e0169968.
https://doi.org/10.1371/journal.pone.0169968
Hanjra, M.A., Qureshi, M.E., 2010. Global water crisis and future food security in an era of climate change.
Food Policy 35, 365–377. https://doi.org/10.1016/j.foodpol.2010.05.006
Hanson, P., Edwards, N., Garten, C.T., Andrews, J., 2000. Separating root and soil microbial contributions to soil
respiration: a review of methods and observations. Biogeochemistry 48, 115–146.
Hooijer, A., Page, S., Canadell, J., Silvius, M., Kwadijk, J., Wösten, H., Jauhiainen, J., 2010. Current and future CO
2 emissions from drained peatlands in Southeast Asia. Biogeosciences 7, 1505–1514.
Howell Katharine R., Shrestha Pitambar, Dodd Ian C., 2015. Alternate wetting and drying irrigation maintained
rice yields despite half the irrigation volume, but is currently unlikely to be adopted by smallholder
lowland rice farmers in Nepal. Food and Energy Security 4, 144–157. https://doi.org/10.1002/fes3.58
Ibáñez, C., Caiola, N., 2018. Ebro Delta (Spain), in: Finlayson, C.M., Milton, G.R., Prentice, R.C., Davidson, N.C.
(Eds.), The Wetland Book: II: Distribution, Description, and Conservation. Springer Netherlands,
Dordrecht, pp. 1113–1121. https://doi.org/10.1007/978-94-007-4001-3_145
IPPC, 2015. Intergovernmental Panel on Climate Change: mitigation of climate change. Cambridge University
Press.
Iqbal, J., Hu, R., Lin, S., Hatano, R., Feng, M., Lu, L., Ahamadou, B., Du, L., 2009. CO2 emission in a subtropical
red paddy soil (Ultisol) as affected by straw and N-fertilizer applications: A case study in Southern
China. Agriculture, Ecosystems & Environment 131, 292–302.
https://doi.org/10.1016/j.agee.2009.02.001
IRRI, A., 2010. CIAT (2010) Global Rice Science Partnership (GRiSP). CGIAR Thematic Area 3.
Jiang, Y., van Groenigen, K.J., Huang, S., Hungate, B.A., van Kessel, C., Hu, S., Zhang, J., Wu, L., Yan, X., Wang, L.,
Chen, J., Hang, X., Zhang, Y., Horwath, W.R., Ye, R., Linquist, B.A., Song, Z., Zheng, C., Deng, A., Zhang,
W., 2017. Higher yields and lower methane emissions with new rice cultivars. Glob Change Biol 23,
4728–4738. https://doi.org/10.1111/gcb.13737
Jobbágy, E.G., Jackson, R.B., 2000. The vertical distribution of soil organic carbon and its relation to climate and
vegetation. Ecological applications 10, 423–436.
ACCEPTED MANUSCRIPT

ACC
EPTE
D M
ANU
SCR
IPT
Jungkunst Hermann F., Feidler Sabine, 2007. Latitudinal differentiated water table control of carbon dioxide,
methane and nitrous oxide fluxes from hydromorphic soils: feedbacks to climate change. Global
Change Biology 13, 2668–2683. https://doi.org/10.1111/j.1365-2486.2007.01459.x
Krishnan, P., Ramakrishnan, B., Reddy, K., Reddy, V., 2011. High-Temperature Effects on Rice Growth, Yield,
and Grain Quality. https://doi.org/10.1016/B978-0-12-387689-8.00004-7
Lampayan, R.M., Rejesus, R.M., Singleton, G.R., Bouman, B.A., 2015. Adoption and economics of alternate
wetting and drying water management for irrigated lowland rice. Field Crops Research 170, 95–108.
Lilley, J.M., Fukai, S., 1994. Effect of timing and severity of water deficit on four diverse rice cultivars III.
Phenological development, crop growth and grain yield. Field Crops Research 37, 225–234.
https://doi.org/10.1016/0378-4290(94)90101-5
Linquist, B., van Groenigen, K.J., Adviento-Borbe, M.A., Pittelkow, C., van Kessel, C., 2012. An agronomic
assessment of greenhouse gas emissions from major cereal crops. Glob. Change Biol. 18, 194–209.
https://doi.org/10.1111/j.1365-2486.2011.02502.x
Linquist, B.A., Marcos, M., Adviento-Borbe, M.A., Anders, M., Harrell, D., Linscombe, S., Reba, M.L., Runkle,
B.R.K., Tarpley, L., Thomson, A., 2018. Greenhouse Gas Emissions and Management Practices that
Affect Emissions in US Rice Systems. Journal of Environmental Quality.
https://doi.org/10.2134/jeq2017.11.0445
Linquist Bruce A., Anders Merle M., Adviento‐Borbe Maria Arlene A., Chaney Rufus L., Nalley L. Lanier, da Rosa
Eliete F.F., Kessel Chris, 2014. Reducing greenhouse gas emissions, water use, and grain arsenic levels
in rice systems. Global Change Biology 21, 407–417. https://doi.org/10.1111/gcb.12701
Liu, Y., Wan, K., Tao, Y., Li, Z., Zhang, G., Li, S., Chen, F., 2013. Carbon dioxide flux from rice paddy soils in
central China: effects of intermittent flooding and draining cycles. Plos one 8, e56562.
Longoni, V., 2010. Rice Fields and Waterbirds in the Mediterranean Region and the Middle East. Waterbirds:
The International Journal of Waterbird Biology 33, 83–96.
Lupi, D., Rocco, A., Rossaro, B., 2013. Benthic macroinvertebrates in Italian rice fields. J. Limnol 72, 184–200.
https://doi.org/10.4081/jlimnol.2013.e15
Matsunami, M., Matsunami, T., Ogawa, A., Toyofuku, K., Kodama, I., Kokubun, M., 2012. Genotypic variation in
biomass production at the early vegetative stage among rice cultivars subjected to deficient soil
moisture regimes and its association with water uptake capacity. Plant Production Science 15, 82–91.
ACCEPTED MANUSCRIPT

ACC
EPTE
D M
ANU
SCR
IPT
Metcalfe, D.B., Williams, M., Aragão, L.E.O.C., Da Costa, A.C.L., De Almeida, S.S., Braga, A.P., Gonçalves, P.H.L.,
De Athaydes, J., Junior, S., Malhi, Y., Meir, P., 2007. A method for extracting plant roots from soil
which facilitates rapid sample processing without compromising measurement accuracy 174, 697–
703. https://doi.org/10.1111/j.1469-8137.2007.02032.x
Miyata, A., Iwata, T., Nagai, H., Yamada, T., Yoshikoshi, H., Mano, M., Ono, K., Han, G., Harazono, Y., Ohtaki, E.,
2005. Seasonal variation of carbon dioxide and methane fluxes at single cropping paddy fields in
central and western Japan. Presented at the Phyton-Annales Rei Botanicae, Verlag Ferdinand Berger
und Sohne GmbH, pp. 89–97.
Miyata, A., Leuning, R., Denmead, O.T., Kim, J., Harazono, Y., 2000. Carbon dioxide and methane fluxes from an
intermittently flooded paddy field. Agricultural and Forest Meteorology 102, 287–303.
Moore, T., Dalva, M., 1993. The influence of temperature and water table position on carbon dioxide and
methane emissions from laboratory columns of peatland soils. European Journal of Soil Science 44,
651–664.
Muhr Jan, Höhle Juliane, Otieno Dennis O., Borken Werner, 2011. Manipulative lowering of the water table
during summer does not affect CO2 emissions and uptake in a fen in Germany. Ecological Applications
21, 391–401. https://doi.org/10.1890/09-1251.1
Nay‐Htoon, B., Xue, W., Lindner, S., Cuntz, M., Ko, J., Tenhunen, J., Werner, C., Dubbert, M., 2018. Quantifying
differences in water and carbon cycling between paddy and rainfed rice (Oryza sativa L.) by flux
partitioning. PLOS ONE 13, e0195238. https://doi.org/10.1371/journal.pone.0195238
Nishimura Seiichi, Yonemura Seiichiro, Minamikawa Kazunori, Yagi Kazuyuki, 2014. Seasonal and diurnal
variations in net carbon dioxide flux throughout the year from soil in paddy field. Journal of
Geophysical Research: Biogeosciences 120, 63–76. https://doi.org/10.1002/2014JG002746
Norton, Gareth J, Shafaei, M., Travis, A.J., Deacon, C.M., Danku, J., Pond, D., Cochrane, N., Lockhart, K., Salt, D.,
Zhang, H., 2017. Impact of alternate wetting and drying on rice physiology, grain production, and
grain quality. Field crops research 205, 1–13.
Norton, Gareth J., Travis, A.J., Danku, J.M.C., Salt, D.E., Hossain, M., Islam, Md.R., Price, A.H., 2017. Biomass
and elemental concentrations of 22 rice cultivars grown under alternate wetting and drying
conditions at three field sites in Bangladesh. Food and Energy Security 6, 98–112.
https://doi.org/10.1002/fes3.110
ACCEPTED MANUSCRIPT

ACC
EPTE
D M
ANU
SCR
IPT
Norton, G.J., Travis, A.J., Douglas, A., Fairley, S., Alves, E.D.P., Ruang-areerate, P., Naredo, Ma.E.B., McNally,
K.L., Hossain, M., Islam, Md.R., Price, A.H., 2018. Genome Wide Association Mapping of Grain and
Straw Biomass Traits in the Rice Bengal and Assam Aus Panel (BAAP) Grown Under Alternate Wetting
and Drying and Permanently Flooded Irrigation. Frontiers in Plant Science 9, 1223.
https://doi.org/10.3389/fpls.2018.01223
Pakoktom, T., Aoki, M., Kasemsap, P., Boonyawat, S., Attarod, P., 2009. CO2 and H2O Fluxes Ratio in Paddy
Fields of Thailand and Japan. Hydrological Research Letters 3, 10–13. https://doi.org/10.3178/hrl.3.10
Pedersen, A.R., Petersen, S.O., Schelde, K., 2010. A comprehensive approach to soil‐atmosphere trace‐gas flux
estimation with static chambers. European Journal of Soil Science 61, 888–902.
Pimentel, D., Berger, B., Filiberto, D., Newton, M., Wolfe, B., Karabinakis, E., Clark, S., Poon, E., Abbett, E.,
Nandagopal, S., 2004. Water Resources: Agricultural and Environmental Issues. BioScience 54, 909–
918. https://doi.org/10.1641/0006-3568(2004)054[0909:WRAAEI]2.0.CO;2
Price, A.H., Norton, G.J., Salt, D.E., Ebenhoeh, O., Meharg, A.A., Meharg, C., Islam, M.R., Sarma, R.N., Dasgupta,
T., Ismail, A.M., 2013. Alternate wetting and drying irrigation for rice in Bangladesh: Is it sustainable
and has plant breeding something to offer? Food and Energy Security 2, 120–129.
R Core Team, 2012. R: A language and environment for statistical computing. R Foundation for Statistical
Computing, Vienna, Austria.
Rao, S.M., Revanasiddappa, K., 2006. Influence of Cyclic Wetting Drying on Collapse Behaviour of Compacted
Residual Soil. Geotechnical & Geological Engineering 24, 725–734. https://doi.org/10.1007/s10706-
004-5077-4
Rejesus, R.M., Palis, F.G., Rodriguez, D.G.P., Lampayan, R.M., Bouman, B.A.M., 2011. Impact of the alternate
wetting and drying (AWD) water-saving irrigation technique: Evidence from rice producers in the
Philippines. Food Policy 36, 280–288. https://doi.org/10.1016/j.foodpol.2010.11.026
Saito, M., Miyata, A., Nagai, H., Yamada, T., 2005. Seasonal variation of carbon dioxide exchange in rice paddy
field in Japan. Agricultural and Forest Meteorology 135, 93–109.
https://doi.org/10.1016/j.agrformet.2005.10.007
Sandhu, N., Subedi, S.R., Yadaw, R.B., Chaudhary, B., Prasai, H., Iftekharuddaula, K., Thanak, T., Thun, V.,
Battan, K.R., Ram, M., 2017. Root Traits Enhancing Rice Grain Yield under Alternate Wetting and
Drying Condition. Frontiers in plant science 8, 1879.
ACCEPTED MANUSCRIPT

ACC
EPTE
D M
ANU
SCR
IPT
Sass, R.L., Fisher, F.M., 1997. Methane emissions from rice paddies: a process study summary. Nutrient Cycling
in Agroecosystems 49, 119–127. https://doi.org/10.1023/A:1009702223478
Seck, P.A., Diagne, A., Mohanty, S., Wopereis, M.C.S., 2012. Crops that feed the world 7: Rice. Food Security 4,
7–24. https://doi.org/10.1007/s12571-012-0168-1
Setyanto, P., Pramono, A., Adriany, T.A., Susilawati, H.L., Tokida, T., Padre, A.T., Minamikawa, K., 2018.
Alternate wetting and drying reduces methane emission from a rice paddy in Central Java, Indonesia
without yield loss. Soil Science and Plant Nutrition 64, 23–30.
https://doi.org/10.1080/00380768.2017.1409600
Smith, P., Clark, H., Dong, H., Elsiddig, E., Haberl, H., Harper, R., House, J., Jafari, M., Masera, O., Mbow, C.,
2014. Agriculture, forestry and other land use (AFOLU).
Sudhir-Yadav, Gill, G., Humphreys, E., Kukal, S.S., Walia, U.S., 2011. Effect of water management on dry seeded
and puddled transplanted rice. Part 1: Crop performance. Field Crops Research 120, 112–122.
https://doi.org/10.1016/j.fcr.2010.09.002
Suleau, M., Moureaux, C., Dufranne, D., Buysse, P., Bodson, B., Destain, J.-P., Heinesch, B., Debacq, A., Aubinet,
M., 2011. Respiration of three Belgian crops: Partitioning of total ecosystem respiration in its
heterotrophic, above- and below-ground autotrophic components. Agricultural and Forest
Meteorology 151, 633–643. https://doi.org/10.1016/j.agrformet.2011.01.012
Swails, E., Jaye, D., Verchot, L., Hergoualc’h, K., Schirrmann, M., Borchard, N., Wahyuni, N., Lawrence, D., 2017.
Will CO2 Emissions from Drained Tropical Peatlands Decline Over Time? Links Between Soil Organic
Matter Quality, Nutrients, and C Mineralization Rates. Ecosystems. https://doi.org/10.1007/s10021-
017-0190-4
Swain, C.K., Bhattacharyya, P., Singh, N.R., Neogi, S., Sahoo, R.K., Nayak, A.K., Zhang, G., Leclerc, M.Y., 2016.
Net ecosystem methane and carbon dioxide exchange in relation to heat and carbon balance in
lowland tropical rice. Ecological Engineering 95, 364–374.
https://doi.org/10.1016/j.ecoleng.2016.06.053
Swinnen, J., 1994. Evaluation of the use of a model rhizodeposition technique to separate root and microbial
respiration in soil. Plant and Soil 165, 89–101. https://doi.org/10.1007/BF00009966
ACCEPTED MANUSCRIPT

ACC
EPTE
D M
ANU
SCR
IPT
Thakur, A.K., Mohanty, R.K., Patil, D.U., Kumar, A., 2014. Impact of water management on yield and water
productivity with system of rice intensification (SRI) and conventional transplanting system in rice.
Paddy and Water Environment 12, 413–424. https://doi.org/10.1007/s10333-013-0397-8
Tran, D.H., Hoang, T.N., Tokida, T., Tirol-Padre, A., Minamikawa, K., 2018. Impacts of alternate wetting and
drying on greenhouse gas emission from paddy field in Central Vietnam. Soil Science and Plant
Nutrition 64, 14–22.
USDA, 2015. Foreign Agricultural Service, Production Supply and Distribution (PS&D) and Grain: World Markets
and Trade as of.
Wassmann, R., Hosen, Y., Sumfleth, K., 2009. Reducing methane emissions from irrigated rice. International
Food Policy Research Institute (IFPRI).
Watanabe, A., Machida, N., Takahashi, K., Kitamura, S., Kimura, M., 2004. Flow of photosynthesized carbon
from rice plants into the paddy soil ecosystem at different stages of rice growth. Plant and Soil 258,
151–160. https://doi.org/10.1023/B:PLSO.0000016545.36421.bc
Wohlfahrt Georg, Gu Lianhong, 2015. The many meanings of gross photosynthesis and their implication for
photosynthesis research from leaf to globe. Plant, Cell & Environment 38, 2500–2507.
https://doi.org/10.1111/pce.12569
Xin, F., Xiao, X., Zhao, B., Miyata, A., Baldocchi, D., Knox, S., Kang, M., Shim, K., Min, S., Chen, B., 2017.
Modeling gross primary production of paddy rice cropland through analyses of data from CO 2 eddy
flux tower sites and MODIS images. Remote sensing of environment 190, 42–55.
Yang, J., Zhou, Q., Zhang, J., 2017. Moderate wetting and drying increases rice yield and reduces water use,
grain arsenic level, and methane emission. The Crop Journal 5, 151–158.
https://doi.org/10.1016/j.cj.2016.06.002
Yao, F., Huang, J., Cui, K., Nie, L., Xiang, J., Liu, X., Wu, W., Chen, M., Peng, S., 2012. Agronomic performance of
high-yielding rice variety grown under alternate wetting and drying irrigation. Field Crops Research
126, 16–22. https://doi.org/10.1016/j.fcr.2011.09.018
Zhang, H., Xue, Y., Wang, Z., Yang, J., Zhang, J., 2009. An Alternate Wetting and Moderate Soil Drying Regime
Improves Root and Shoot Growth in Rice. Crop Science 49, 2246.
ACCEPTED MANUSCRIPT

ACC
EPTE
D M
ANU
SCR
IPT
b)
Baldo Gageron Gines Arelate J. Sendra Gleva
Vialone Arelate JSendra Vialone Puntal Gageron
Selenio Puntal Gleva Baldo Centauro Selenio
Centauro Loto Prometeo Loto Gines Prometeo
Puntal Gageron J. Sendra Gleva Arelate Centauro
Centauro Gines Vialone Selenio Vialone Gageron
Selenio Prometeo Baldo J. Sendra Puntal Loto
Gleva Arelate Loto Prometeo Gines Baldo
Baldo J. Sendra Puntal Gageron Loto Vialone
Gageron Gleva Gines Puntal Gines Selenio
Vialone Selenio Loto Prometeo Gleva J. Sendra
Prometeo Arelate Centauro Arelate Centauro Baldo
Centauro Baldo J. Sendra J. Sendra Selenio Centauro
Loto Vialone Selenio Gines Puntal Prometeo
Gageron Arelate Gines Gleva Gageron Baldo
Gleva Puntal Prometeo Vialone Arelate Loto
CF block 4 AWD block 4
CF Block 2
AWD block 1 CF block 1
AWD block 2
CF block 3AWD Block 3
Figure 1a. Top - split plot experimental design with four replicates (blocks) of continuously flooded (CF) in
orange and alternate wetting and drying (AWD) plots in green.
1b. Bottom - each block and treatment randomly contained the four cultivars that were focused on in this study
(Gleva, Arelate, Gageron and Prometeo) in shaded green (AWD) and orange (CF).
ACCEPTED MANUSCRIPT

ACC
EPTE
D M
ANU
SCR
IPT
Figure 2a. Top – mean soil water content (m3 m-3) on the AWD plots at 10, 20, 20 and 40 cm soil depth and on
the CF plots at 10 cm soil depth for the period between July and September 2017. 2b. Bottom – mean water
table depth (cm) on the left axis for the AWD and CF plots, and matric potential (kPa) on the right axis for the
AWD plots. Error bars indicate standard 1 error of the mean.
ACCEPTED MANUSCRIPT
ACC
EPTE
D M
ANU
SCR
IPT
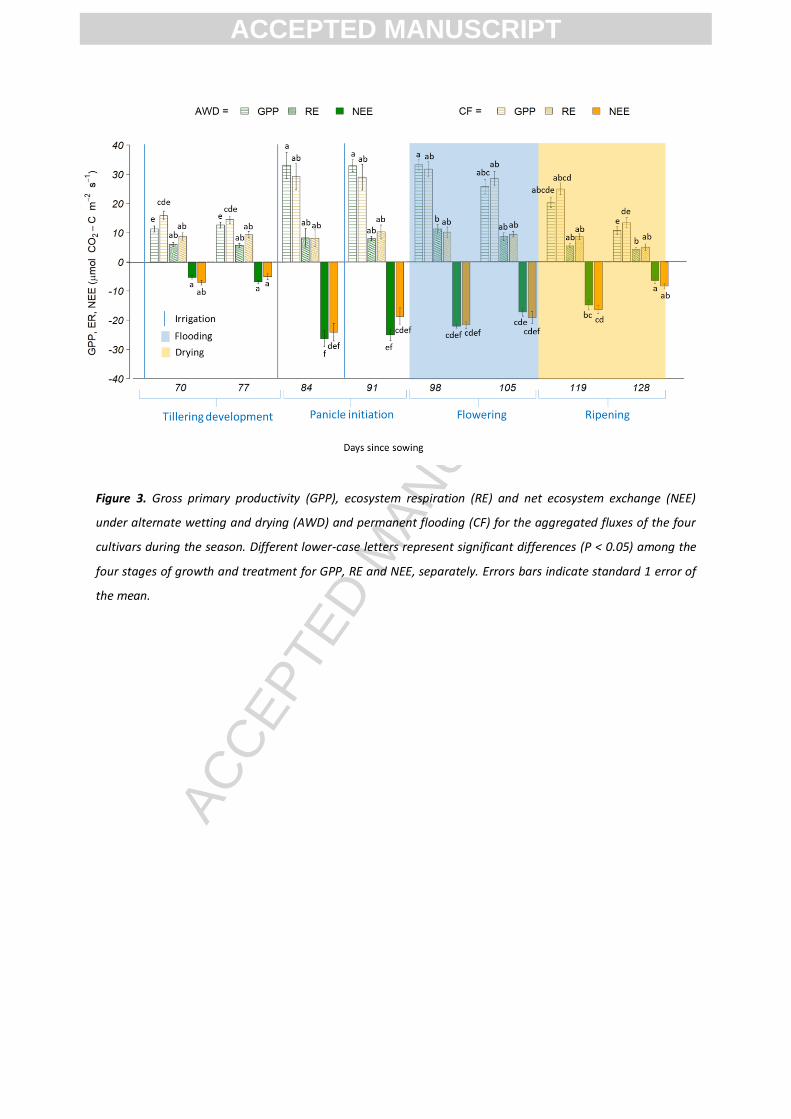
Figure 3. Gross primary productivity (GPP), ecosystem respiration (RE) and net ecosystem exchange (NEE)
under alternate wetting and drying (AWD) and permanent flooding (CF) for the aggregated fluxes of the four
cultivars during the season. Different lower-case letters represent significant differences (P < 0.05) among the
four stages of growth and treatment for GPP, RE and NEE, separately. Errors bars indicate standard 1 error of
the mean.
ACCEPTED MANUSCRIPT

ACC
EPTE
D M
ANU
SCR
IPT
Figure 4a. Top - contribution of heterotrophic respiration and autotrophic respiration to ecosystem respiration
for the four cultivars. Figure 4b. Bottom - contribution of heterotrophic respiration and autotrophic respiration
to ecosystem respiration for the aggregated cultivar data set over the growing season. Different lower-case
letters indicate significant differences (P < 0.05) among the different groups (3a: cultivars and treatment; 3b:
stages and growth and treatment) for heterotrophic respiration, autotrophic respiration and ecosystem
respiration separately. Errors bars indicate standard 1 error of the mean.
ACCEPTED MANUSCRIPT

ACC
EPTE
D M
ANU
SCR
IPT
Figure 5. Mass losses (%) of rice leaf litter from the decomposition experiment (n = 4) on the alternate wetting
and drying (AWD) and permanently flooded (CF) plots. Errors bars indicate standard 1 error of the mean and
dotted lines show the regression slopes.
ACCEPTED MANUSCRIPT

ACC
EPTE
D M
ANU
SCR
IPT
Figure 6. Mean aboveground (straw + grain) and belowground biomass (roots) for the four cultivars and the
seasonal mean of the agregated data for the AWD and CF treatments. Different lower case letters represent
significant differences (p > 0.05) among the cultivars and treatments for belowground, aboveground, total
biomass, grain and seasonal mean, separately. Errors bars indicate standard 1 error of the mean.
ACCEPTED MANUSCRIPT

ACC
EPTE
D M
ANU
SCR
IPT
Figure 7. Mean aboveground (straw + grain) and belowground biomass (roots) for the four cultivars of the
agregated data for the AWD and CF treatments at the four key growth stages. Different lower case letters
represent significant differences (p > 0.05) among the different stages of growth, treatments and cultivars for
belowground, aboveground and total biomass, separately. Errors bars indicate standard 1 error of the mean.
ACCEPTED MANUSCRIPT

ACC
EPTE
D M
ANU
SCR
IPT
Figure 8. Mean aboveground (straw + grain) and belowground biomass (roots) for the two treatments using
aggregated cultivar data at the four key growth stages. Different lower case letters represent significant
differences (p > 0.05) among the different stages of growth and treatments for belowground, aboveground and
total biomass, separately. Errors bars indicate standard 1 error of the mean.
ACCEPTED MANUSCRIPT
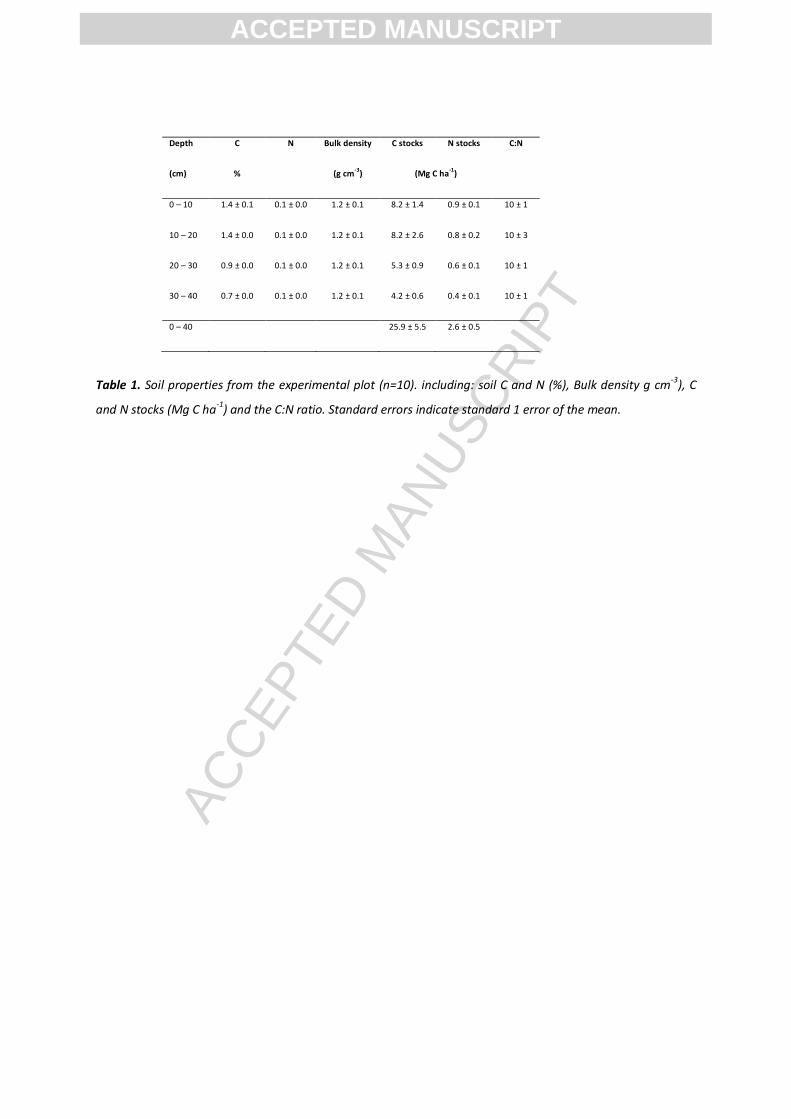
ACC
EPTE
D M
ANU
SCR
IPT
Depth C N Bulk density C stocks N stocks C:N
(cm) % (g cm-3
) (Mg C ha-1
)
0 – 10 1.4 ± 0.1 0.1 ± 0.0 1.2 ± 0.1 8.2 ± 1.4 0.9 ± 0.1 10 ± 1
10 – 20 1.4 ± 0.0 0.1 ± 0.0 1.2 ± 0.1 8.2 ± 2.6 0.8 ± 0.2 10 ± 3
20 – 30 0.9 ± 0.0 0.1 ± 0.0 1.2 ± 0.1 5.3 ± 0.9 0.6 ± 0.1 10 ± 1
30 – 40 0.7 ± 0.0 0.1 ± 0.0 1.2 ± 0.1 4.2 ± 0.6 0.4 ± 0.1 10 ± 1
0 – 40 25.9 ± 5.5 2.6 ± 0.5
Table 1. Soil properties from the experimental plot (n=10). including: soil C and N (%), Bulk density g cm-3), C
and N stocks (Mg C ha-1
) and the C:N ratio. Standard errors indicate standard 1 error of the mean.
ACCEPTED MANUSCRIPT

ACC
EPTE
D M
ANU
SCR
IPT
Agricultural practices and
water management
Date Day since
sowing
Product Commercial
product rate
Active ingredient: Applied rate
Pre-sowing fertilization 26 April -15 Verdazoto Dry manure: 12.5% N
(11 % organic N)
260 kg ha-1
Sowing 10 May 0
Weed control pre-emergence 11 May 1 Ronstar 1 l/ha Oxadiazon (380 g/L) 380 g/ha
Weed control post-emergence 8 June 30 Aura 0.6 l/ha Profoxydim (200 g/l) 120 g/ha
Facet 1.5 l/ha Quinclorac (250 g/l) 375 g/ha
Viper 1.5 l/ha Penoxsulam (20 g/l) 30 g/ha
AWD irrigation and CF flooded 14 June 36
AWD irrigation 20 June 42
CF drained in preparation for
fertilisation
27 June 49
Top-dress fertilization 30 June 52 (23-0-30) 300 kg ha-1
CF flooded and AWD irrigation 3 July 55
Fungicide treatment 25 July 77 Amistar
1L/ha Azoxystrobin (250 g/l) 250 g/ha
AWD irrigation 31 July 83
AWD flooded 8 August 92
AWD and CF drained 26 August 110
Harvest commenced 2 November 117
Table 2. Dates of the agricultural practices and water management that took place during the growing season.
Variables include: the date when each agricultural practice and water management took place, the day since
sowing, the product used and its commercial product rate, active ingredient and applied rate.
ACCEPTED MANUSCRIPT

ACC
EPTE
D M
ANU
SCR
IPT
Stage of plant growth Treatment (umol CO2- C m-2
s-1
) NEE (umol CO2- C m-2
s-1
)
NEE GPP ER Arelate Gageron Gleva Prometeo
Tillering (0-80 days) AWD
CF
-6.12 ± 0.44a
-6.13 ± 0.67a
11.91 ± 0.72a
15.14 ± 0.97a
5.79 ± 0.47bc
9.01 ± 0.84ab
-4.25 ± 0.62a
-7.98 ± 1.38ab
-6.71 ± 0.84a
-6.84 ± 0.59a
-7.28 ± 0.61a
-5.73 ± 0.70a
-6.23 ± 1.04a
-4.00 ± 1.93ab
Panicle initiation (81-95 days) AWD
CF
-25.67 ± 1.64ab
-20.88 ± 2.17b
33.03 ± 2.31b
29.11 ± 3.11b
8.06 ± 1.38abc
9.68 ± 1.75ab
-27.33 ± 2.10d
-19.23 ± 6.21bcd
-24.96 ± 3.36cd
-26.09 ± 3.00d
-28.43 ± 2.80d
-18.56 ± 4.71bcd
-21.22 ± 4.99c
-19.65 ± 3.22c
Flowering (96-118 days) AWD
CF
-19.64 ± 0.93c
-20.35 ± 1.20cd
29.60 ± 1.65b
30.16 ± 1.75b
9.95 ± 1.04a
9.82 ± 0.95ab
-18.53 ± 2.48bcd
-24.56 ± 3.26cd
-22.29 ± 1.50bcd
-18.95 ± 0.89bcd
-21.42 ± 0.76cd
-21.92 ± 1.41cd
-16.33 ± 1.58bc
-15.95 ± 2.22bc
Ripening (119 -135 days) AWD
CF
-10.68 ± 1.25cd
-12.32 ± 1.17d
15.54 ± 1.47a
19.15 ± 1.80a
4.86 ± 0.49c
6.83 ± 0.82abc
-12.16 ± 2.62abc
-12.58 ± 2.47abc
-13.54 ± 2.84ab
-16.00 ± 2.38abc
-9.33 ± 2.95ab
-12.24 ± 2.29abc
-7.67 ± 0.93ab
-8.47 ± 1.59ab
Season mean AWD
CF
-15.42 ± 0.96a
-14.66 ± 0.92a
22.41 ± 1.22a
23.14 ± 1.17a
7.14 ± 0.48a
8.77 ±0.53a
-15.57 ± 2.02a
-15.95 ± 2.12a
-16.87 ± 1.87a
-16.57 ± 1.69a
-16.62 ± 2.06a
-14.44 ± 1.77a
-12.50 ± 1.71a
-11.68 ± 1.65a
Table 3. Mean net ecosystem exchange (NEE), gross primary productivity (GPP) and ecosystem respiration (ER)
carbon dioxide (CO2) fluxes for the aggregated data set of the four cultivars at key phenological growth stages,
and mean NEE for the four cultivars, individually. Different letters down the columns represent significant
differences (p > 0.05) among the two treatments at different and growth stages. Standard errors indicate
standard 1 error of the mean.
ACCEPTED MANUSCRIPT
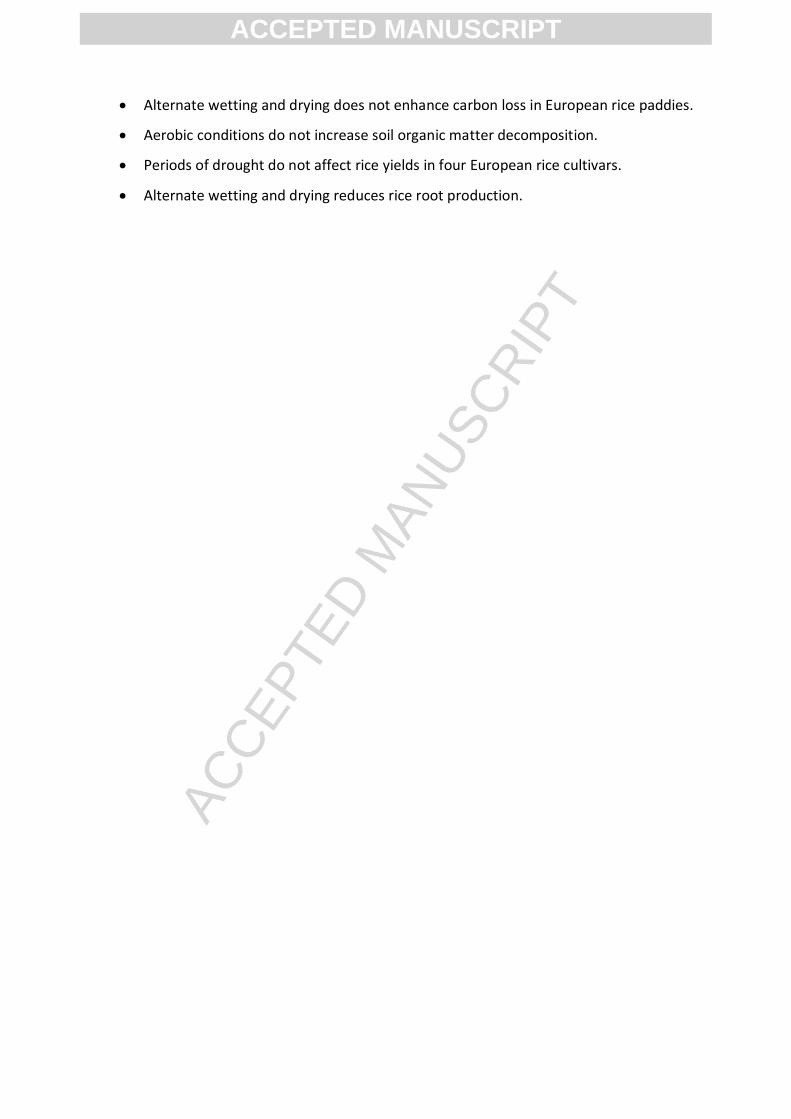
ACC
EPTE
D M
ANU
SCR
IPT
Alternate wetting and drying does not enhance carbon loss in European rice paddies.
Aerobic conditions do not increase soil organic matter decomposition.
Periods of drought do not affect rice yields in four European rice cultivars.
Alternate wetting and drying reduces rice root production.
ACCEPTED MANUSCRIPT

Figure 1

Figure 2

Figure 3

Figure 4

Figure 5
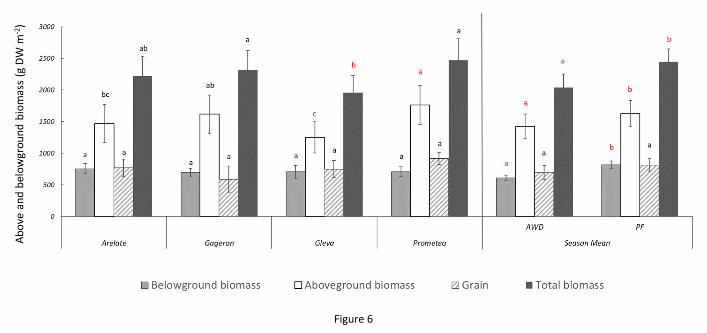
Figure 6

Figure 7

Figure 8