effects of strategic management determinants of …
TRANSCRIPT

EFFECTS OF STRATEGIC MANAGEMENT
DETERMINANTS OF CORPORATE GROWTH IN
MICRO-FINANCE INSTITUTIONS IN KENYA
STANLEY MITAU KAVALE
DOCTOR OF PHILOSOPHY
(Business Administration)
JOMO KENYATTA UNIVERSITY OF
AGRICULTURE AND TECHNOLOGY
2017
Effects of Strategic Management Determinants of Corporate
Growth in Micro-Finance Institutions in Kenya
Stanley Mitau Kavale
A Thesis Submitted in Partial Fullfilment for the Degree of Doctor
of Philosophy in Business Administration (Strategic Management) in
the Jomo Kenyatta University of Agriculture and Technology
2017

ii
DECLARATION
This thesis is my original work and has not been presented for a degree in any other
University.
Signature …………………………………………… Date: ………………….
Stanley Mitau Kavale
This thesis has been submitted for examination with our approval as University
Supervisors.
Signature …………………………………………… Date: ………………….
Dr. Fred Mugambi, PhD
JKUAT, Kenya
Signature …………………………………………… Date: ………………….
Prof. Gregory. S. Namusonge, PhD
JKUAT, Kenya

iii
DEDICATION
This study is dedicated to the Almighty God; the source of knowledge and wisdom.
His grace and internal strength enabled me to persistently carry on this study. This
study is also dedicated to my dear family. My wife Ruth, my daughter Faith and my
son Dan.

iv
ACKNOWLEDGEMENT
I would like to send my sincere gratitude of appreciation to Dr. Fred Mugambi, PhD
and Prof. Gregory Namusonge, PhD for their endless and tireless academic support
and guidance for this course. Your inspiration, insight, and the right mindset were
essential. Without your input, this thesis would be totally different. My family was
highly inspirational, encouraging and engaging. My colleagues played a key role in
the success of this study so far. Your valuable insights, advice and motivation kept
the study on course. Thank you all, and may God bless you.
v
TABLE OF CONTENTS
DECLARATION ................................................................................................... ii
DEDICATION ...................................................................................................... iii
ACKNOWLEDGEMENT .................................................................................... iv
TABLE OF CONTENTS ........................................................................................v
LIST OF TABLES ............................................................................................... xii
LIST OF FIGURES .............................................................................................. xv
LIST OF APPENDICES ......................................................................................xvi
ACRONYMS...................................................................................................... xvii
DEFINITION OF TERMS ..................................................................................xix
ABSTRACT ....................................................................................................... xxii
CHAPTER ONE .....................................................................................................1
INTRODUCTION ..................................................................................................1
1.1 Background .....................................................................................................1
1.1.1 Global Corporate Growth .........................................................................5
1.1.2 Corporate Growth in Kenya ......................................................................6
1.2 Statement of the Problem ................................................................................8
1.3 Research Objectives ........................................................................................9
1.3.1 General Objective .....................................................................................9

vi
1.3.2 Specific Objectives ...................................................................................9
1.4 Research Questions ...................................................................................... 10
1.5 Research Hypotheses .................................................................................... 11
1.6 Significance and Justification of the Study .................................................... 12
1.6.1 Managers of Microfinance Institutions .................................................... 12
1.6.2 Policy Makers ........................................................................................ 12
1.6.3 Scholars and Researchers........................................................................ 12
1.7 Scope of the Study? ...................................................................................... 13
1.8 Limitations of the Study ............................................................................... 13
CHAPTER TWO .................................................................................................. 14
LITERATURE REVIEW ..................................................................................... 14
2.1 Introduction .................................................................................................. 14
2.2 Theoretical Framework ................................................................................ 14
2.2.1 The Generic Strategy Theory .................................................................. 14
2.2.2 Competitive Advantage Theory .............................................................. 15
2.2.3 The Resource Dependency Theory ......................................................... 17
2.2.4 Organizational Growth Theory ............................................................... 18
2.4 Review of the Determinants of Corporate Growth ........................................ 22
2.4.2 Corporate Vision .................................................................................... 26

vii
2.4.3 Cost Leadership Strategy ........................................................................ 29
2.4.4 Product Differentiation Strategy ............................................................. 34
2.4.5 Pooling of Strategic Resources ............................................................... 40
2.4.6 Strategic Synergy .................................................................................. 42
2.4.7 Measurement of Corporate Growth ......................................................... 47
2.5 Empirical Review of Determinants of Corporate Growth ............................... 48
2.6 Critique of Existing literature ........................................................................ 51
2.7 Research Gaps ............................................................................................... 53
2.8 Summary ....................................................................................................... 54
CHAPTER THREE .............................................................................................. 55
RESEARCH METHODOLOGY ......................................................................... 55
3.1 Introduction ................................................................................................... 55
3.2 Research Design ............................................................................................ 55
3.3 Target Population .......................................................................................... 55
3.4 Sampling Frame ............................................................................................ 56
3.5 Sample Size and Sampling Techniques.......................................................... 56
3.6 Data Collection Methods ............................................................................... 58
3.6.1 Primary Data .......................................................................................... 59
3.6.2 Secondary Data ...................................................................................... 59

viii
3.7 Data Collection Procedures ........................................................................... 60
3.8 Pilot Study .................................................................................................... 60
3.8.1 Reliability ............................................................................................... 61
3.8.2 Validity .................................................................................................. 62
3.8.3 Diagnostic Tests ..................................................................................... 63
3.9 Data Analysis and Presentation ..................................................................... 63
3.9.1 Qualitative Analysis ............................................................................... 63
3.9.2 Quantitative Analysis ............................................................................. 64
3.9.3 Model Specification................................................................................ 64
3.9.4 Variable Definition and Operational Measurement of Key Variables ...... 65
CHAPTER FOUR................................................................................................. 69
RESEARCH RESULTS AND FINDINGS .......................................................... 69
4.1 Introduction ................................................................................................... 69
4.2 Response Rate ............................................................................................... 69
4.3 Reliability and Validity Results ..................................................................... 70
4.3.1 Reliability Results .................................................................................. 70
4.3.2 Validity Results ...................................................................................... 71
4.4 Demographic Characteristics ......................................................................... 71
4.4.2 Highest Level of Education .................................................................... 72
ix
4.4.3 Current Designation................................................................................ 73
4.4.4 Duration in Current Designation ............................................................. 74
4.4.5 Employee Duration in Organization ........................................................ 74
4.4.6 Organization Age ................................................................................... 75
4.5 Factor Results ............................................................................................... 76
4.5.1 Factor Results for Grand Strategy ........................................................... 76
4.5.2 Factor Results of Corporate Vision ......................................................... 79
4.5.3 Factor Results for Cost Leadership Strategy ........................................... 82
4.5.4 Factor Results for Differentiation Strategy .............................................. 85
4.5.5 Factor Analysis Results for Pooling Resources ....................................... 88
4.5.6 Factor Analysis for Strategic Synergy ..................................................... 91
4.5.7 Factor Analysis Results for Corporate Growth ........................................ 93
4.6 Data Normality, Linearity and Independence ................................................. 96
4.6.1 Outliers .............................................................................................. 96
4.6.2 Independent Errors ............................................................................ 97
4.6.3 Non-Zero Variances........................................................................... 97
4.6.4 Kolmogorrov-Smirnov (KS) one sample tests ......................................... 98
4.7 Demographic Results .................................................................................... 99
4.7.1 Grand Strategy on Corporate Growth .................................................... 100
x
4.7.2 Corporate Vision on Corporate Growth ................................................ 101
4.7.3 Cost Leadership on Corporate Growth .................................................. 102
4.7.4 Product Differentiation on Corporate Growth ....................................... 103
4.7.5 Pooling Strategic Resources on Corporate Growth ............................... 104
4.7.6 Strategic Synergy on Corporate Growth ............................................... 105
4.7.7 Measurement of Corporate Growth ....................................................... 106
4.7.8 Summary of Survey Variable Findings ................................................. 106
4.8 Quantitative Results ................................................................................... 108
4.8.1 Chi Sqare (χ)2- Tests ............................................................................. 108
4.8.2 Correlation Results ............................................................................... 113
4.8.3 Research Hypothesis Test ..................................................................... 116
4.8.4 Regression Results ............................................................................... 120
4.8.5 Overall Goodness-of-Fit ....................................................................... 121
4.8.7 Multiple Regression Results of Strategic Management Determinants on
Corporate Growth ......................................................................................... 122
4.9 Discussions of the Key Findings as Per Objective ....................................... 124
4.9.1 Effects of Grand Strategy on Corporate Growth .................................... 124
4.9.2 Effects of Corporate Vision on Corporate Growth ................................ 125
4.9.3 Effects of Cost Leadership Strategy on Corporate Growth .................... 125
4.9.4 Effects of Product Differentiation Strategy on Corporate Growth ......... 125

xi
4.9.5 Effects of Pooling of Strategic Resources on Corporate Growth ........... 126
4.9.6 Effects of Strategic Synergy on Corporate Growth ............................... 126
CHAPTER FIVE ................................................................................................ 127
SUMMARY, CONCLUSIONS AND RECOMMENDATIONS ....................... 127
5.1 Introduction ................................................................................................. 127
5.2 Summary as per Objective ........................................................................... 127
5.3 Conclusions................................................................................................. 129
5.4 Recommendations ....................................................................................... 130
5.4.1 Managerial Recommendations .............................................................. 130
5.4.2 Policy Recommendations ..................................................................... 131
5.5 Areas for Further Research .......................................................................... 132
REFERENCES ................................................................................................... 133
APPENDICES ..................................................................................................... 146
xii
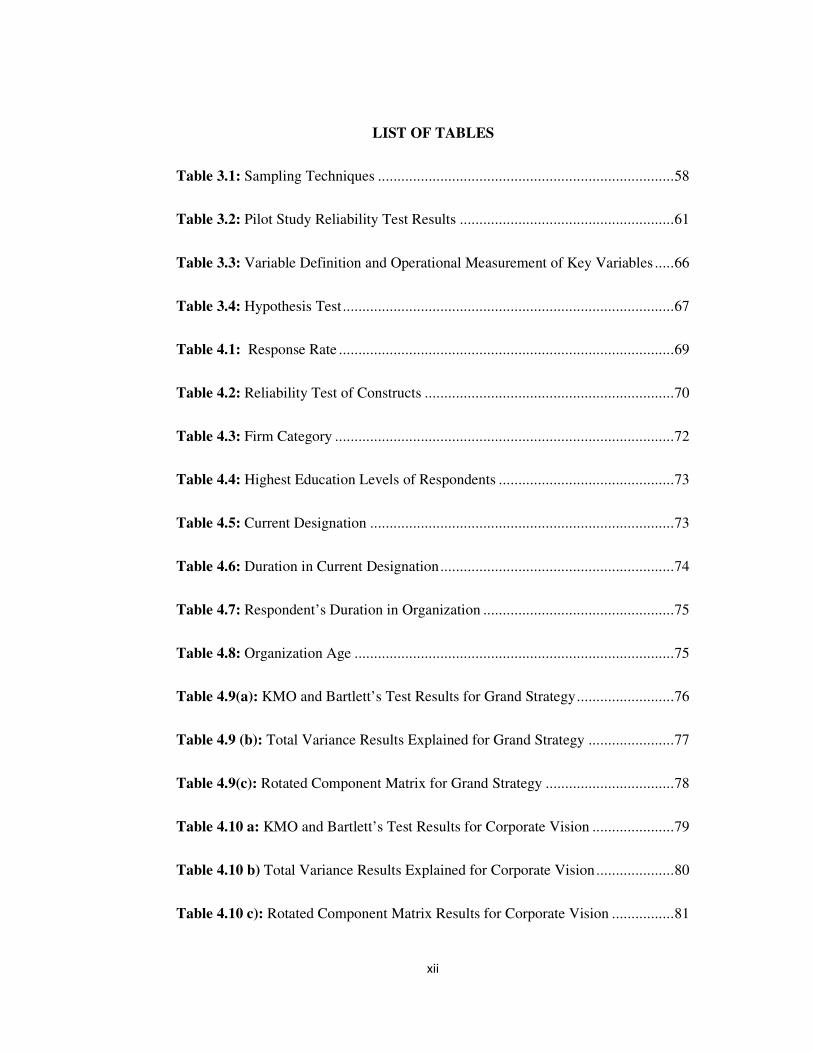
LIST OF TABLES
Table 3.1: Sampling Techniques ............................................................................ 58
Table 3.2: Pilot Study Reliability Test Results ....................................................... 61
Table 3.3: Variable Definition and Operational Measurement of Key Variables ..... 66
Table 3.4: Hypothesis Test ..................................................................................... 67
Table 4.1: Response Rate ...................................................................................... 69
Table 4.2: Reliability Test of Constructs ................................................................ 70
Table 4.3: Firm Category ....................................................................................... 72
Table 4.4: Highest Education Levels of Respondents ............................................. 73
Table 4.5: Current Designation .............................................................................. 73
Table 4.6: Duration in Current Designation ............................................................ 74
Table 4.7: Respondent’s Duration in Organization ................................................. 75
Table 4.8: Organization Age .................................................................................. 75
Table 4.9(a): KMO and Bartlett’s Test Results for Grand Strategy ......................... 76
Table 4.9 (b): Total Variance Results Explained for Grand Strategy ...................... 77
Table 4.9(c): Rotated Component Matrix for Grand Strategy ................................. 78
Table 4.10 a: KMO and Bartlett’s Test Results for Corporate Vision ..................... 79
Table 4.10 b) Total Variance Results Explained for Corporate Vision .................... 80
Table 4.10 c): Rotated Component Matrix Results for Corporate Vision ................ 81
xiii
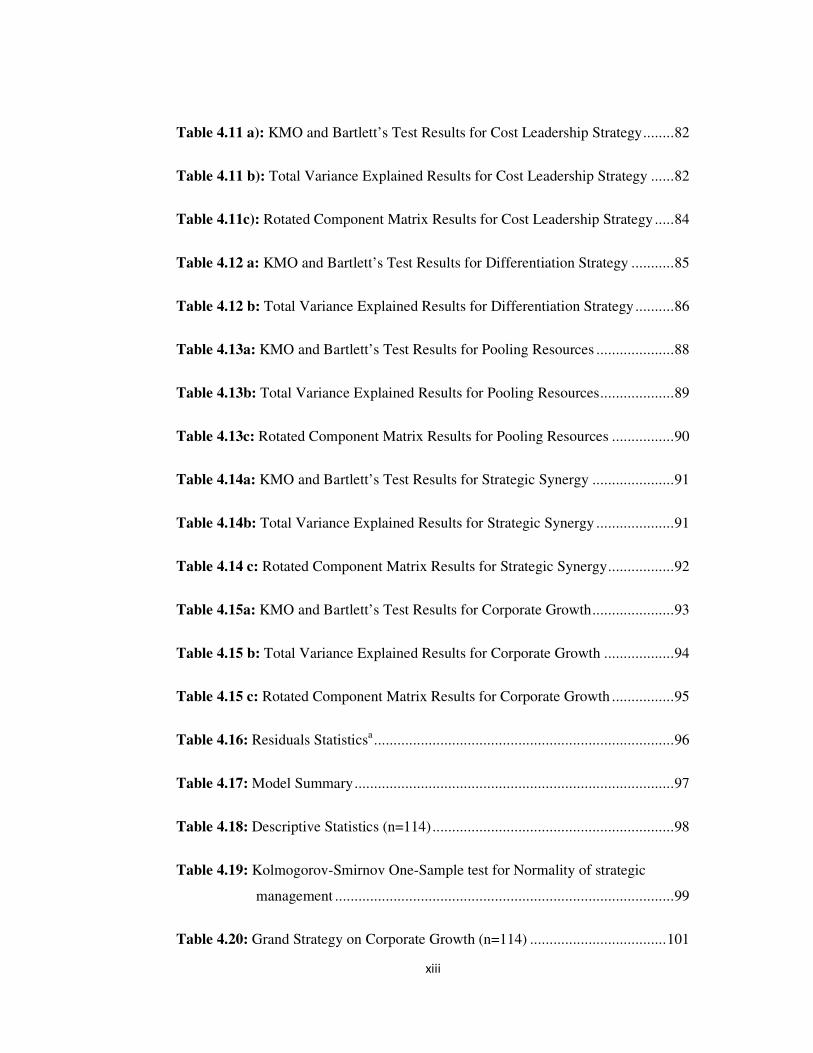
Table 4.11 a): KMO and Bartlett’s Test Results for Cost Leadership Strategy ........ 82
Table 4.11 b): Total Variance Explained Results for Cost Leadership Strategy ...... 82
Table 4.11c): Rotated Component Matrix Results for Cost Leadership Strategy ..... 84
Table 4.12 a: KMO and Bartlett’s Test Results for Differentiation Strategy ........... 85
Table 4.12 b: Total Variance Explained Results for Differentiation Strategy .......... 86
Table 4.13a: KMO and Bartlett’s Test Results for Pooling Resources .................... 88
Table 4.13b: Total Variance Explained Results for Pooling Resources ................... 89
Table 4.13c: Rotated Component Matrix Results for Pooling Resources ................ 90
Table 4.14a: KMO and Bartlett’s Test Results for Strategic Synergy ..................... 91
Table 4.14b: Total Variance Explained Results for Strategic Synergy .................... 91
Table 4.14 c: Rotated Component Matrix Results for Strategic Synergy ................. 92
Table 4.15a: KMO and Bartlett’s Test Results for Corporate Growth ..................... 93
Table 4.15 b: Total Variance Explained Results for Corporate Growth .................. 94
Table 4.15 c: Rotated Component Matrix Results for Corporate Growth ................ 95
Table 4.16: Residuals Statisticsa ............................................................................. 96
Table 4.17: Model Summary .................................................................................. 97
Table 4.18: Descriptive Statistics (n=114) .............................................................. 98
Table 4.19: Kolmogorov-Smirnov One-Sample test for Normality of strategic
management ....................................................................................... 99
Table 4.20: Grand Strategy on Corporate Growth (n=114) ................................... 101

xiv
Table 4.21: Corporate Vision on Corporate Growth (n=114) ................................ 102
Table 4.22: Cost Leadership Strategy on Corporate Growth (n=114) .................... 103
Table 4.23: Product Differentiation on Corporate Growth (n=114) ....................... 104
Table 4.24: Pooling of Strategic Resources on Corporate Growth (n=114) ........... 104
Table 4.25: Strategic Synergy and Corporate Growth (n=114) ............................. 105
Table 4.26: Corporate Growth (n=114) ................................................................ 106
Table 4.27: Summary Respondent’s Perception .................................................... 107
Table 4.28: χ2-tests Results on Grand Strategy Measures (n=114) ........................ 109
Table 4.29: χ2 –Test on Corporate Vision Measures (n=114) ............................... 109
Table 4.30: χ2 –Test Results on Cost Leadership Strategy Measures ..................... 110
Table 4.31: χ2 –Test Results on Differentiation Strategy Measures ....................... 111
Table 4.32: χ2 –Test Results on Pooling Strategic Resources Measures (n=114) ... 112
Table 4.33: χ2 –Test Results on Strategic Synergy Measures ................................ 112
Table 4.34: Correlations Matrix (N=114) ............................................................. 115
Table 4.35: Collinearity Coefficients .................................................................... 116
Table 4.36: Summary of Regression Coefficient and Test of Hypothesis .............. 120
Table 4.37: Model Summary ................................................................................ 121
Table 4.39: Multiple Regression Coefficients ....................................................... 122

xv
LIST OF FIGURES
Figure 2.1: Conceptual Framework ........................................................................ 21
xvi
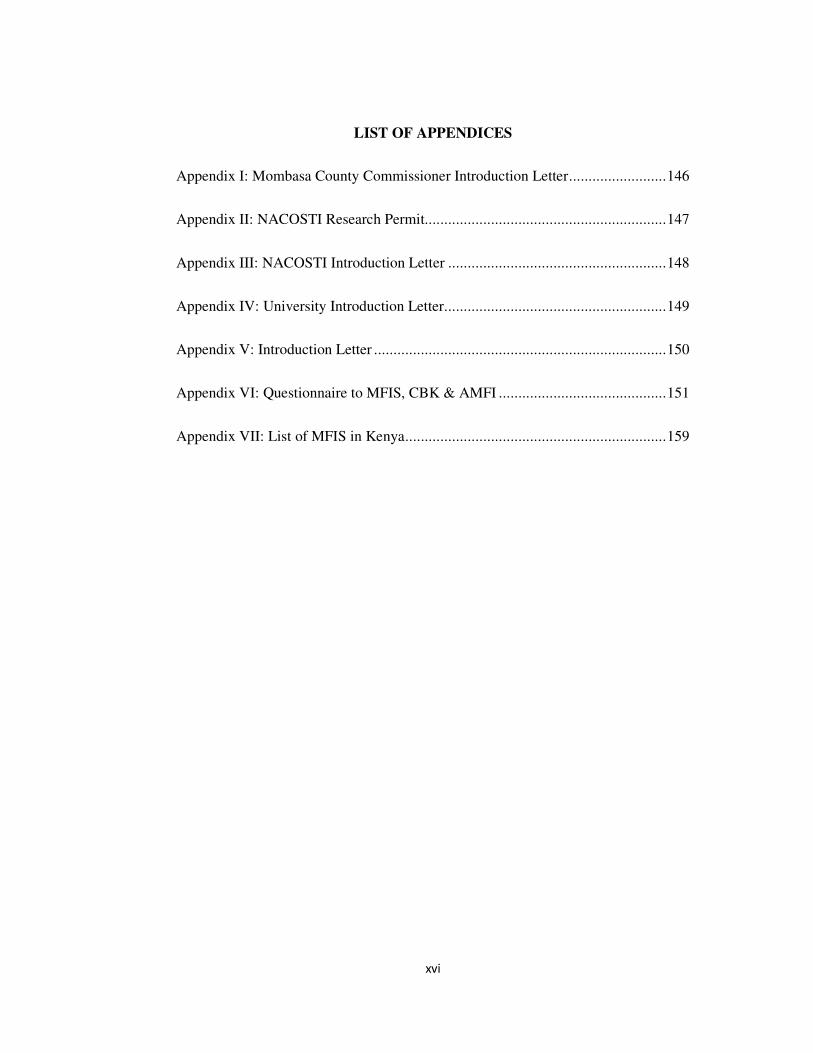
LIST OF APPENDICES
Appendix I: Mombasa County Commissioner Introduction Letter ......................... 146
Appendix II: NACOSTI Research Permit.............................................................. 147
Appendix III: NACOSTI Introduction Letter ........................................................ 148
Appendix IV: University Introduction Letter ......................................................... 149
Appendix V: Introduction Letter ........................................................................... 150
Appendix VI: Questionnaire to MFIS, CBK & AMFI ........................................... 151
Appendix VII: List of MFIS in Kenya ................................................................... 159

xvii
ACRONYMS
AAR American Air Rescue
AMFI Association of Microfinance Institutions
ANOVA Analysis of Variance
CBK Central Bank of Kenya
CG Corporate Growth
CL Cost Leadership
CV Corporate Vision
DS Differentiation Strategy
DTM Deposit Taking Microfinance
GDP Gross Domestic Product
GOK Government of Kenya
GS Grand Strategy
KMO Kaiser-Meyer-Olkin
KREP Kenya Rural Enterprise Program
MFIs Micro Finance Institutions
NACOSTI National Commission for Science, Technology and Innovation
PR Pooling Resources
R2 Coefficient of Determination

xviii
ROI Rate of Return
SACCO Savings and Credit Cooperative Society
SMEP Small and Micro Enterprise Programme
SMEs Small and Medium Sized Enterprises
SPSS Statistical Package for Social sciences
SS Strategic Synergy
VIHF Variance Inflation Factor

xix
DEFINITION OF TERMS
Competitive Positioning Exploitation of core competencies to gain a competitive
advantage and maintain it. It is the ability gained
through attributes and resources to perform at a higher
level than others in the same market or industry (Hitt,
Ireland & Hoskisson 2012).
Corporate Growth Change in size or magnitude of a firm from one period
of time to another. Marked and sustainable increase in
assets, market share, profitability, customer base,
branch network, capital base, and social impact (Coad,
2009).
Corporate Profitability Economic indicator that calculates net income using
profits from current production, book profits and after-
tax profits (Delmar, 2006).
Corporate Strategy How companies, create value across different
businesses. Asks how the corporation can add value
over and abovethat which a business unit creates by
itself. The overall scope and direction of a corporation
and the way in which its various business operations
work together to achieve particular goals (Pearce
& Robinson, 2013).
Corporate Vision An aspiration description of what an organization
would like to achieve or accomplish in the long-term
future. It is intended to serves as a clear guide for
choosing current and future courses of action (Hill &
Jones, 2009).
xx
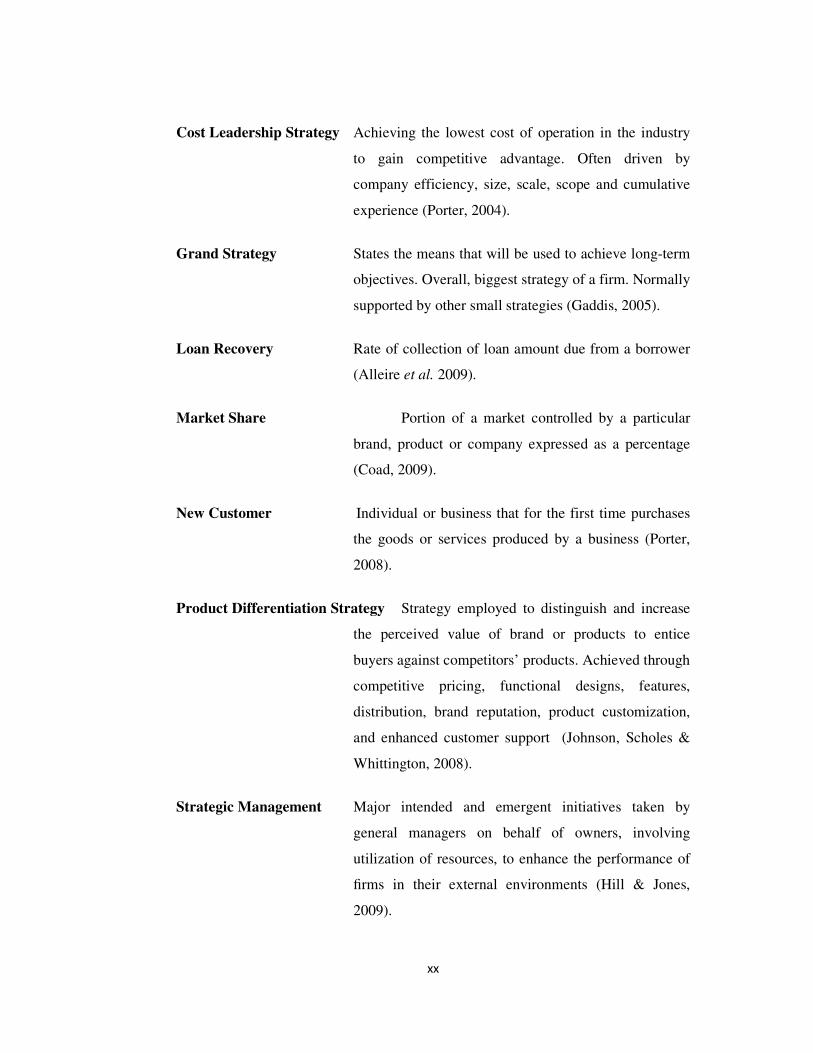
Cost Leadership Strategy Achieving the lowest cost of operation in the industry
to gain competitive advantage. Often driven by
company efficiency, size, scale, scope and cumulative
experience (Porter, 2004).
Grand Strategy States the means that will be used to achieve long-term
objectives. Overall, biggest strategy of a firm. Normally
supported by other small strategies (Gaddis, 2005).
Loan Recovery Rate of collection of loan amount due from a borrower
(Alleire et al. 2009).
Market Share Portion of a market controlled by a particular
brand, product or company expressed as a percentage
(Coad, 2009).
New Customer Individual or business that for the first time purchases
the goods or services produced by a business (Porter,
2008).
Product Differentiation Strategy Strategy employed to distinguish and increase
the perceived value of brand or products to entice
buyers against competitors’ products. Achieved through
competitive pricing, functional designs, features,
distribution, brand reputation, product customization,
and enhanced customer support (Johnson, Scholes &
Whittington, 2008).
Strategic Management Major intended and emergent initiatives taken by
general managers on behalf of owners, involving
utilization of resources, to enhance the performance of
firms in their external environments (Hill & Jones,
2009).

xxi
Strategic Partnerships Long term partnering of firms in industry by pooling of
resources together for mutual benefit. It is an
arrangement between two companies that have decided
to share resources to undertake a specific, mutually
beneficial project (Hitt, Ireland & Hoskisson 2012).
Strategic Resources Bundle of valuable interchangeable and intangible and
tangible resources at the firm's disposal that builds a
firms’ competitive advantage in industry (Crook,
Ketchen, Combs & Todd, 2008).
Strategic Synergy hoped-for or real effect resulting from different
individuals, departments, or companies working
together and stimulating new ideas that result in greater
productivity (Grant, 2008).
xxii
ABSTRACT
The main purpose of this study was to assess the strategic management determinants
of corporate growth of Microfinance Institutions (MFIs) in Kenya. The specific
objectives were; To assess the effects of grand strategy on the growth of Micro
Finance Institutions in Kenya; To assess the effects of corporate vision on the growth
of Micro Finance Institutions in Kenya; To establish the effects of cost leadership
strategy on the growth of Micro Finance Institutions in Kenya; To evaluate the
effects of product differentiation strategy on the growth of Micro Finance Institutions
in Kenya; To establish the effects of pooling of strategic resources on the growth of
Micro Finance Institutions in Kenya and To assess the effects of strategic synergy
on the growth of Micro Finance Institutions in Kenya. The study employed
descriptive and quantitative research designs. The target population was 57 firms and
the sample size was 32 firms arrived at through stratified and purposive sampling
methods. The primary data collection instruments were structured questionnaires on
effects of strategic management determinants on corporate growth. Secondary data
was collected from company records, texts and journals. A Cronbach alpha tool score
of above 7.0 was attained to test the data reliability and validity was tested using
Kaiser-Meyer-Olkin and Barttlets test. Data was analyzed using SPSS version 20.
The hypothesis was tested using Chisquare-test at 95% confidence level and
regression coefficients. Multiple linear regression analysis was employed to establish
the relationship between the strategic management determinants and corporate
growth. Data was presented in tables. The results established that Strategic synergy
and product differentiation strategy had the highest effects on corporate growth of
MFIs in Kenya. This was followed by pooling strategic resources, cost leadership
strategy, grand strategy and lastly corporate vision respectively. It was concluded
that MFIs needed to fully embrace strategic management determinants in order to
achieve sustainable competitive advantage, which in turn leads to corporate growth.
This study adds immensely to the already available literature on corporate growth.
Further, this study came up with a growth model that could be further tested to assess
its overall influence on corporate growth in MFIs. The study recommended that
MFIs should use grand strategy, corporate vision, cost leadership strategy,
differentiation strategy, pooling of resources strategy and strategic synergy in their
right mixes to propel corporate growth. Further, it recommended that policy makers
should come up with a framework to assist MFIs to differentiate their products and
encourage strategic partnerships that enhance value creation.

1
CHAPTER ONE
INTRODUCTION
1.1 Background
The growth of firms is something inherent to their actual existence. Throughout their
life, firms must grow continuously if they want to sustain their competitive position
within an environment where other rival firms may be growing at a faster pace
(Johnson, Scholes & Whittington, 2008). While some surveys show that growth is
not an objective for all firms, the ability of firms to grow is important, because it has
been suggested that firms with low or negative growth rates are more likely to fail
(Headd & Kirchhoff, 2007). What is perhaps more controversial and surprising is
that recent evidence suggests that the high growth firms are not necessarily newly
founded entrepreneurial startups, but rather tend to be larger and more mature firms
(Honjo & Haranda 2006; Coad, 2009).
The strategic orientation of a firm is its tendency towards valuing and prioritizing
certain strategically relevant actions rather than others. A firm could emphasize
activities that drive down its costs, respond aggressively to competitors, seek to
provide maximal customer value, or seek to speed up the pace of technological
innovations. Any of these thrusts, and many others, could potentially result in
favorable outcomes such as corporate growth (McKelvie & Wiklund, 2010; Cressy,
2009). Based on this, researchers have considered the performance effects of
strategic orientation construed in terms of Porter's (1980) generic strategies to
explain the choice of strategies to adopt for growth and sustainability thus creating
competitive advantage. Wheelen and Hunger, (2012), assert that although corporate
profitability measures generally rise with earnings and sales growth, an optimal point
exists beyond which further growth and sales growth destroys shareholder value.
They note that many firms go beyond this optimal point and conclude that corporate
managers need to abandon the habit of blindly increasing company size.
In today’s world of cutthroat competition, corporate growth is an ambiguous
phenomena and it can be measured and interpreted in a variety of different ways.

2
Corporate growth reflects the degree of success achieved in terms of stated
objectives and as the objectives differ widely so does the concept of corporate
growth (Aggarwal, 2012). Corporate growth can be defined in numerous ways and
be achieved in several strategic forms. In general, the matter of whether—and at
what rate—a company is growing can be highly ambiguous. A company can
experience strong sales growth, but simultaneously be losing market share and
experiencing financial losses. In such a case, the company's volume is rising, but that
of its competitors is rising even faster. And, on the bottom line, sales growth means
little when the company cannot turn a profit. The same company may be gaining
market share, but losing sales volume and money. This suggests that volume is
falling throughout the industry, but only less so for this company. In any case, it still
loses money on its operations. Contrally, a company's earnings may be rising, but
losing sales volume and market share. This is quite possibly the a favorable scenario,
because it suggests that the company is cutting marginal operations to concentrate on
what it does best—in effect, becoming smaller but more profitable. These criteria can
provide some insight into the true nature of the firm—whether it really is growing or
not (Saxena, & Maru, 2016).
Companies need to achieve a strategic balance between top and bottom line growth.
The strongest companies are those that recognize and understand the importance of
both innovation and improvement. These companies never stop growing and are the
true value growers. Canals (2000) developed an integrative model of corporate
growth explaining the nature of the factors influencing corporate growth. These are:
the firm’s internal and external context, the development of a business concept,
resources and capabilities, and the strategic investment decisions. Growth of
corporations is influenced by three major factors – the background/resource of the
entrepreneur, the nature of the firm, and the strategic decisions taken by the
owner/manager. Saxena and Maru, (2016) noted that determinants of firm growth are
summarized and classified into three dimensions: individual, organizational, and
environmental determinants. The growth of a firm is to a certain extent a matter of
decisions made by an individual entrepreneur. An entrepreneur’s personality traits,
growth motivation, individual competencies and personal background are the most

3
important determinants that determine the growth of a firm (Shane, Locke & Collins,
2003). Further, the growth of firms can be determined by the firm strategies, firm-
specific resources, the effectiveness and capabilities of the company's resources such
as labor, capital and knowledge acquired, organized and transformed into products
and services through the activities of the organization, practices and structures.
Lastly environmental factors affecting firm growth include dynamic environment,
Munificence (environment support) and heterogeneity. The top management needs to
develop both strategic and tactical skills and abilities. High growth firms make use of
external relations and growth is a combination of environmental and leadership
processes (Leitch, Hill & Neergaard, 2010).
Nevertheless, if a firm wishes to improve its relative position, then it will have to
grow faster. In short, enterprises must seek continuous growth with the aim of
increasing or simply maintaining their sales and profit levels, so that their survival
can be guaranteed. However, this does not mean that the growth of firms takes place
in an unplanned way; it actually occurs in a premeditated, organized way and is the
fruit of conscious strategic decisions taken by a firm in the ever-changing business
environment. Corporate growth is the responsibility of the top managers who must
concentrate on strategic planning and allocation of resources with the objective of
pursuing organizational efficiency (Gamble, 2011).
Corporate growth is often closely associated with firm overall success and survival
and it has been used as a simple measure of success in business. Growth has been
crafted as the most appropriate indicator of the performance for surviving
corporations. Moreover, corporate growth is an important precondition for the
achievement of other financial goals of business (Coad, 2009). From the point of
view of corporations, growth is usually a critical precondition for its longevity.
Cressy (2009) notes that young firms that grow have twice the probability of survival
as young non-growing firms. It has been also found that strong growth may reduce
the firm’s profitability temporarily, but increase it in the long run (McDougall et. al.,
2006). It is worth noting that corporate growth is essential for sustaining the viability,
dynamism and value-enhancing capability of firms. A growth-oriented firm is not
only able to attract the most talented executives but it would also be able to retain
4
them. Corporate growth leads to higher profits and increase in shareholders’ value.
Greiner (1998) pointed out that growth in corporations is a predetermined series of
evolution and revolution attributes. Gupta, Guha and Krishnaswami, (2013) notes
that there are two sets of thoughts prevailing among researchers; some suggest that
the growth path followed by the enterprise0 is linear or predictable, and others
suggest that the growth is fairly opportunistic term or unpredictable.
There is a need to have a sustainable growth approach instead of growing on the
basis of number of stages. As a result, an empirical research is required to find out
what makes corporate growth sustainable, and which contextual variables are
important for corporate growth. Thus, there is a need to understand the growth
phenomenon and its importance to conceptualize the phenomenon properly. There is
a lack of shared understanding on the causes, effects, and the process of growth.
Moreover, growth is a social construct; hence, there is lot of diversity in it. The
heterogeneity of the enterprise and entrepreneur's context add further challenges to
the study and understanding of growth. Thus, the three key questions related to
growth have to be addressed at least to some extent: why, how, and how much.
Further, there is still a lot of scope of exploration on growth as an internal process of
development Leitch et al. (2010). Penrose (1959) offered some strong principles
governing the growth of firms and the rate at which firms can grow successfully.
Firms are a bundle of internal and external resources that help a firm to grow and to
realize a competitive advantage. Firms consist of human and non-human resources,
under administrative coordination and integration. Human, and especially
managerial, resources are the most important, but a firm's uniqueness derives from
the distinction between its resources and the services that those resources can
provide. Even though individuals may hold critical resources, the firm's
organizational choices determine whether and how individual resources are
translated into organizational competence, which eventually lead to a firm's superior
economic position, thus corporate growth. Firm size is incidental to the growth
process, whereas firm growth is determined by the effective and innovative
managerial resources within the firm. Further, the availability of top managerial and
5
technical talent serves as an engine to a firm’s growth. Ignorance of these factors
results in failure and loss of competitive advantage (Hoskisson, 2013).
Gibrat (1931) developed a theoretical model to measure the relationship between
firm growth and its initial size. Gibrat’s Law, or the “Law of Proportionate Effect,”
states that firm growth is independent on initial size. While the results of some
studies concur with Gibrat's Law, especially the early studies, the results of other
studies do not, even support a negative relationship between growth and size and
confirm that smaller and younger firms grow faster than larger firms (Hill & Jones,
2012). Growth-oriented firms are a significant contributor in a nation's economic
gain, but the concept of growth is different for different entrepreneurs. However, for
growth to be realized and be sustainable, the combination of resources, distinctive
capabilities, distinctive competencies, and attributes must lead to competitive
advantage thus outperforming competitors. This is the basis of value creation that
when sustained, leads to competitive positioning. Sustained competitive positioning
leads to corporate growth. While a large number of applied papers observe a positive
link between innovation and firm growth, the complexity, diversity of innovation
strategies and the multiplicity of growth modes, requires a multidimensional
approach to examine the contribution of innovations on firm growth (Segerra &
Teruel, 2014).
1.1.1 Global Corporate Growth
Throughout history, economic growth has been fueled by rising productivity. Disparities
in GDP per capita among countries primarily reflect differences in economic productivity
and economic growth. As corporate managers improve efficiency, invest, and innovate to
be competitive, their collective actions expand the global economy. The past 50 years
have seen unusually rapid growth in GDP and GDP per capita. Given the demographic
drag that’s already coming into play, prospects for future growth will depend very heavily
on sustained productivity growth. But arriving at useful forecasts of the productivity of
future economies can be difficult. An analysis of the causes of differences in economic
productivity between industries, sectors, and countries is key to understanding corporate
growth. This analysis will help explain why some economies have thrived while others

6
have fallen behind. A closer look, however, reveals substantial opportunities to maintain
relatively high GDP growth rates in corporate in emerging economies. Whether these
opportunities are realized will depend on the reforms of policy makers and the ingenuity
of corporate managers and engineers, particularly in sectors with big productivity gaps to
foster corporate growth. The bottom line is that a productivity-based perspective on the
future of growth suggests that corporate growth progress today most likely will lead to
economic growth tomorrow (Ugheokea, Isab, & Noor, 2015).
It is important to accept sweeping generalizations regarding the state of a firm’s
competitiveness and the prospects for its future performance. On one side the macro level
insights can be generated only by rolling granular examination of individual businesses
up to the industry, sector, and country levels. The other side is to recognize productivity
improvements as the primary source of sustained and long-term economic growth. To
raise economic performance, we must focus on the causes of productivity differences
among companies, industries, sectors, and countries. If every country were to perform at
that level, global GDP would grow to nearly three and a half times its current size.
Currently, however, many countries lag significantly behind, especially in emerging
markets. Even China and India, which have experienced high levels of recent productivity
growth, lag substantially behind front-runners, such as the United States, in absolute
productivity levels. Economic productivity frontier has grown four times over since 1964,
and there are many good reasons to expect it will advance. Pushing out the frontier of
economic growth will require a willingness to make significant changes in business
processes and organizational structures, as well as trade-offs between mature businesses
with healthy cash flows, on the one hand, and disruptive (often digital) business models,
on the other, with the potential for self-cannibalization even as they offer a transformative
productivity potential (de Waal, 2010).
1.1.2 Corporate Growth in Kenya
After independence in 1963, Kenya promoted rapid economic growth through public
and private investment. The Gross Domestic Product (GDP) grew at an annual
average of 6.6% from 1963 to 1973. Kenya's economic performance during the
1980s and 1990s was far below its potential, as was corporate growth. The economy
7
grew by an annual average of 1.5% between 1997 and 2002, which was below the
population growth rate estimated at 2.5% per annum, leading to a decline in per
capita incomes. Increased government intrusion into the private sector and import
substitution policies made the manufacturing sector uncompetitive and unproductive.
Declining growth, retarded growth and in some cases corporate demise was
registered (GoK, 2010; Kipruto, 2012).
Kenya has a rapidly growing economy with investor confidence continuing to grow.
Its dominance in the East African region is based on a strong private sector that has
evolved under relatively market friendly policies. The recent planning documents,
the Economic Recovery Strategy and Kenya Vision 2030, detail carefully designed
strategies which focus on growing and developing Kenya and its economy. Kenya
aims to transform into a newly industrialised middle income country based on
economic, social and political pillars. Kenya’s economy is driven by agriculture
(contributing 24.6% of GDP), real estate and manufacturing and is forecast to grow
by more than 6% annually in the years ahead. The economy is well diversified and is
increasingly moving away from its agricultural dominance, with momentum picking
up within the real estate, manufacturing and financial services sectors (Rioba, 2015).
Kenya maintains a strategic shipping location in East Africa and is currently
expanding the port in Mombasa, a new port in Lamu and the new standard gauge
railway from Mombasa to Nairobi which will eventually extend to Uganda, Rwanda,
Burundi and South Sudan.
Simply put, this continual development requires substantial funding and as the
economic prospects are extremely attractive for both domestic and international
investors, many local companies are taking to debt financing to raise funds to meet
the demand across the economy (GOK, 2015). Muia, (2011) found out that firms can
be encouraged to embrace growth strategy especially when pursuing the profitability
and wealth objectives. Africa and particularly in Kenya, microfinance remains
primarily a supply-driven endeavor with a marginal number of methodologies
applied mainly to provide working capital loans to micro entrepreneurs, and
businessmen (GoK, 2010; Mwobobia, 2012). However, the Kenyan microfinance
industry is facing challenges that have affected the growth patterns of the MFIs.
8
1.2 Statement of the Problem
The main goal of every MFI is to operate profitably in order to maintain its stability
and improve growth and sustainability. However this is not always achieved (Hitt,
Ireland & Hoskisson, 2012). A key justification for the advancement of microfinance
is that, a microfinance sector that is both profitable and sustainable can ultimately
impact positively on economic growth and development. In essence, growth-oriented
firms are a significant contributor in a nation's economic gain. Saxena and Maru,
(2016) noted that firm growth is an important indicator of a thriving economy.
Greiner (1998) asserts that growth in firms takes place in series of steps and phases
of evolution and revolution. However, the basis and determinants of growth remain
heterogeneous. Mateev and Anastasov (2010), suggest there is a dearth of data on
how enterprises grow and what the influencing factors are.
Although the concept of microfinance has been present in Kenya for over twenty
years, the sector has fallen short on achieving widespread growth and sustainability.
Microfinance remains primarily a supply-driven endeavor with a marginal number of
methodologies applied mainly to provide working capital loans to micro
entrepreneurs and businessmen. The micro finance sector in Kenya faces a number of
constraints, among them management challenges, which need to be addressed to
enable them to improve outreach, growth and sustainability. These constraints have
contributed to a large extent to the poor performance and eventual demise of some
MFIs. For if MFIs are not profitable, growth remains a dream, thus unsustainable.
Although some progress has been made, the problem has not been solved yet, and the
overwhelming majority of people, especially in the rural areas, continue to have no
practical access to formal sector finance as most MFIs concentrate on urban clientele
(Kipruto, 2012). While a significant amount of research has been done on the
determinants of growth in large firms, much less is known in regard to MFIs,
especially in developing economies (Raymond, Bergeron, & Blili, 2005).
Determinants of firm growth have been studied in various disciplines, however, an
integrated analysis is still lacking. It is therefore of special interest to examine the
effects of determinants of firm growth in an integrated way, and to identify the most

9
important determinants of firm growth. There is a need to understand the growth
phenomenon and its importance to conceptualize the phenomenon properly.
However, there is a lack of shared understanding on the determinants, causes, effects,
and the process of growth. Saxena and Maru (2016), noted that many determinants of
firm growth are summarized and classified into three dimensions: individual,
organizational, and environmental determinants. Much research effort has been
targeted particularly at investigating the factors affecting firm growth, but to date
there is no comprehensive theory to explain which firms will grow or how they will
grow (Garnsey & Heffernan, 2011). It seems that not even very strong explanatory
factors have been identified, though various explanatory approaches have been
presented. These studies, though very important to the industry players, fell short in
identifying the effects of strategic management determinants of corporate growth.
Thus, there was a compelling need to establish the effects of strategic management
determinants of corporate growth in MFIs in Kenya. This is because the research
hypothesizes that the effects of strategic management determinants could be the
answer to the current growth dilemma facing MFIs.
1.3 Research Objectives
This study was guided by the general and specific objectives.
1.3.1 General Objective
The general objective of the study was to establish the effects of strategic
management determinants on corporate growth in Micro Finance Institutions in
Kenya.
1.3.2 Specific Objectives
The study was guided by the following specific objectives;
1. To determine the effects of grand strategy on the growth of Micro Finance
Institutions in Kenya

10
2. To find out the effects of corporate vision on the growth of Micro Finance
Institutions in Kenya
3. To establish the effects of cost leadership strategy on the growth of Micro Finance
Institutions in Kenya
4. To evaluate the effects of product differentiation strategy on the growth of Micro
Finance Institutions in Kenya
5. To identify the effects of pooling of strategic resources on the growth of Micro
Finance Institutions in Kenya
6. To find out the effects of strategic synergy on the growth of Micro Finance
Institutions in Kenya.
1.4 Research Questions
In order to understand how the objectives of this study were achieved, the following
research questions were used;
1. What is the effect of grand strategy on the growth of Micro Finance Institutions in
Kenya?
2. What is the effect of corporate vision on the growth of Micro Finance Institutions
in Kenya?
3. What is the effect of cost leadership strategy on the growth of Micro Finance
Institutions in Kenya?
4. What is the effect of differentiation strategy on the growth of Micro Finance
Institutions in Kenya?
5. What is the effect of pooling of strategic resources on the growth of Micro Finance
Institutions in Kenya?
11
6. How effective is strategic synergy on the growth of Micro Finance Institutions in
Kenya?
1.5 Research Hypotheses
The study was guided by the following null and alternate hypotheses;
1. Hypothesis One
HA1: Grand strategy has a significant effect on the growth of Micro Finance
Institutions in Kenya.
2. Hypothesis Two
HA2: Corporate vision has a significant effect on the growth of Micro Finance
Institutions in Kenya.
3. Hypothesis Three
HA3: Cost leadership strategy has a significant effect on the growth of Micro Finance
Institutions in Kenya.
4. Hypothesis Four
HA4: Product differentiation strategy has a significant effect on the growth of Micro
Finance Institutions in Kenya.
5. Hypothesis Five
Ha5: Pooling of strategic resources has a significant effect on the growth of Micro
Finance Institutions in Kenya.
6. Hypothesis Six
HA6: Strategic synergy has a significant effect on the growth of Micro Finance
Institutions in Kenya.

12
1.6 Significance and Justification of the Study
This study is important and essential to MFIs, policy makers, scholars and
researchers, and the community.
1.6.1 Managers of Microfinance Institutions
This study helps MFIs to wisely intervene in improving their performance by
assisting in tackling those factors that inhabit corporate growth and helping them to
embrace and deploy those factors that positively facilitate corporate growth. This
will lead to MFIs growth, sustainability and productivity. Given the chance in
successful corporate growth, the strategic management determinants of growth
would reduce managerial uncertainty in corporations. MFIs have an overwhelmingly
dominant position in developing-economy financial systems, and are extremely
important engines of economic growth (Maina, 2011). Moreso, with little formal
sector (bank) financing, MFIs are typically the most important and affordable source
of finance in the rural setup for the majority of firms and as such they are usually the
main rural depository points.
1.6.2 Policy Makers
This study assists the government, MFI regulators and policy Makers in formulating
and executing suitable operational guidelines, policy mechanisms and strategic
interventions that would improve the capacity of this sector. A sustainable sector
contributes directly to national growth and development, with the government being
a key beneficiary.
1.6.3 Scholars and Researchers
This study is a source of more valuable insight and information on the subject of
corporate growth of MFIs in Kenya. It has opened up space for more research on the
subject of corporate growth of firms in Kenya.
A successful MFIs sector contributes to financial deepening and financial
empowerment of the community. Through savings education and business skills

13
education, they contribute to increased marginal propensity to save and invest for the
common business in both urban and rural regions. Still, MFIs have managed to
account to a considerable share of the employment created both in the rural and
urban community.
1.7 Scope of the Study?
GoK (2010) under the Microfinance Act, MFIs in Kenya are classified and registered
into micro financing banks, non deposit taking MFIs, deposit taking MFIs (DTM)
and informal organizations supervised by an external agency other than the
government. This study focused on the micro financing banks, the deposit taking and
non deposit taking MFIs which have operations in Mombasa County and are five
years of age and above as per AMFI records as at 31st December, 2012. Mombasa
County is a cosmopolitan region which represents a substantial chunk of the
microfinance industry. The researcher believed that MFIs over five years of age have
key information about strategic management determinants of growth due to their
exposure and experience. Hence, the behavior and opinions of samples collected
from MFIs in Mombasa County would be a representative of the behavior and
opinions of the MFI industry elsewhere in the country.
1.8 Limitations of the Study
This study was faced with the challenge of the busy schedule of most MFI managers.
Quite often data collection was delayed due to some managers attending to
customers issues. Some meetings had to be rescheduled. A lot of patience was
deployed and despite this, the study was a success. Some respondents thought that
the information collected was very sensitive and that it may be used for personal
gain. This was overcome by explaining to them that the study was for academic
purposes only. The research permit from NACOSTI and introduction letter from the
Mombasa County Commissioner worked in hand to assure the respondents on the
purpose of the study, thus they provided all the needed information.

14
CHAPTER TWO
LITERATURE REVIEW
2.1 Introduction
This chapter focused on the literature review of the study and explains the empirical
studies on the strategic management determinants of corporate growth. It covered the
theoretical frame work, the conceptual framework, a review of the determinants,
measurement of corporate growth, critique of existing literature, research gaps and
summary of literature review.
2.2 Theoretical Framework
The theoretical framework explains the theoretical basis of a study. In this study, the
Generic Strategy Theory (Porter, 1980), Competitive Advantage Theory (Porter,
2004), The Resource Dependency Theory (Davis & Cobb, 2010) and the
Organizational Growth Model (Greiner, 1998) were identified.
2.2.1 The Generic Strategy Theory
Porter (1980) identified the generic strategy theory that has since become a game
changer in the world all over in building firms’ industry competitiveness which in
turn leads to corporate growth. This theory consists of cost leadership, differentiation
and focus strategies. Cost-leadership strategies require firms to develop policies
aimed at becoming and remaining the lowest cost producer and/or distributor in the
industry. A cost leadership firm can set prices at par with competitors thus enjoy big
margins or set prices lower than competitors and experience high sales hence high
margins. Cost leadership concentrates on construction of efficient-scale facilities,
tight cost and overhead control, minimization of operating expenses, reduction of
input costs, tight control of labor costs, and lower distribution costs (Johnson et. al.,
2008). Cost leadership is often driven by company efficiency, size, scale, scope and
cumulative experience (learning curve). A cost leadership strategy aims to exploit
scale of production, well-defined scope and other economies, producing highly
15
standardized products, using advanced technology. Cost leadership is different from
price leadership. A company could be the lowest cost producer yet not offer the
lowest-priced products or services.
Differentiation strategy requires firms to create something about its product that is
perceived as unique within its market. Whether the features are real, or just in the
mind of the customer, customers must perceive the product as having desirable
features not commonly found in competing products. The customers also must be
relatively price-insensitive. Customers must be willing to pay more than the marginal
cost of adding the differentiating feature if a differentiation strategy is to succeed.
Possible differentiation strategies include warranty, brand image, technology,
features, service, and dealer network among other dimensions. Differentiation does
not allow a firm to ignore costs; it makes a firm's products less susceptible to cost
pressures from competitors because customers see the product as unique and are
willing to pay extra to have the product with the desirable features (Hill & Jones,
2012). Porter (1980) notes that focus strategy involves concentrating on a particular
customer, product line, geographical area, channel of distribution, stage in the
production process, or market niche. The underlying premise of the focus strategy is
that the firm is better able to serve its limited segment than competitors serving a
broader range of customers. Firms using a focus strategy simply apply a cost-leader
or differentiation strategy to a segment of the larger market. Firms may thus be able
to differentiate themselves based on meeting customer needs through differentiation
or through low costs and competitive pricing for specialty goods (Wheelen &
Hunger, 2012).
2.2.2 Competitive Advantage Theory
Competitive advantage occurs when an organization acquires or develops an attribute
or combination of attributes that allows it to outperform its competitors. These
attributes can include access to natural resources, such as high grade ores or
inexpensive power, or access to highly trained and skilled personnel and human
resources. The term competitive advantage is the ability gained through attributes
and resources to perform at a higher level than others in the same industry or market
16
(Porter, 2004; Johnson et al., 2008). A firm is said to have a competitive advantage
when it is implementing a value creating strategy not simultaneously being
implemented by any current or potential player (Hill & Jones, 2012). Successfully
implemented strategies will lift a firm to superior performance by facilitating the
firm with competitive advantage to outperform current or potential players (Porter,
2008). To gain competitive advantage the firm manipulates the various resources and
capabilities over which it has direct control and these resources have the ability to
generate competitive advantage. Superior performance outcomes and superiority in
production resources reflects competitive advantage (Wheelen & Hunger, 2012;
Pearce & Robbinson, 2013).
As the focus of strategic management has shifted from planning processes to the
quest for profit, the theoretical foundations of the field have been driven by analysis
of sources of profit and the factors that result in differences in profitability between
firms. The firm may attain a position of advantage vis-a-vis its competitors within an
industry allowing it to earn a return in excess of the industry average. If this is
sustained over time, it creates a competitive edge (Ibrahimi, 2014). Van Duren,
(2005) views business strategy as the tools that manipulate the resources and create
competitive advantage, hence, viable business strategy may not be adequate unless it
possess control over unique assets, resources and capabilities that have the ability to
create such a unique advantage. Competitive advantage is a key determinant of
superior performance and it ensures survival and prominent positioning in the
market. Superior performance being the ultimate desired goal of a firm, competitive
advantage becomes the foundation highlighting the significant importance to develop
same (Hoskisson, 2013).

17
2.2.3 The Resource Dependency Theory
Resource dependence theory (RDT) is the study of how the external resources of
organizations affect the behavior of the organization. The procurement of external
resources is an important tenet of both the strategic and tactical management of any
company. Resource dependence theory (RDT) is concerned with how organisational
behaviour is affected by external resources the organisation utilises, such as raw
materials.
The resource dependency theory is important in explaining the actions of
organizations, by forming interlocks, alliances, joint ventures, and mergers and
acquisitions, in striving to overcome dependencies and improve an organizational
autonomy, legitimacy and competitiveness. It is instrumental to organizations on the
power to control resource allocation as the key to organizational growth and survival.
The theory’s central proposition is that organizations will try to manage their
resource dependencies with a variety of tactics, such as the cooptation of sources of
constraint, in order to achieve greater autonomy and thus reduce uncertainty in the
flow of needed resources from the environment. In essence, strategic partnerships
have the potential to address challenges and opportunities that could not have been
handled in the same way outside of a partnership (Davis & Cobb, 2010).
Perceived mutual dependencies between organizations can motivate potential
partners to come together and join forces when the organizations perceive critical
strategic interdependencies with other organizations in their environment (Drees &
Heugens 2013). Interdependence causes uncertainty in managing necessary resources
for organizational survival and drives organizations to seek complementary or
supplementary capabilities and resources in others. Because organizations are not
self sufficient and do not have control over all the resources they require, interaction
with others is necessary to advance one’s own interests. Thus, organizational
outcomes are based on interdependencies, because interdependence exists whenever
one actor does not entirely control all of the conditions necessary for the achievement
of an action or for obtaining the outcome desired from the action.
18
This means that a partnership within organizations is a way of gaining access to
critical resources necessary for their own success and survival (Peteraf & Barney,
2003).
When an organization does not have the necessary resources internally, it is
dependent on external actors who have these needed resources. These resources can
include financial resources, technical capabilities, knowledge, and organizational
legitimacy. Companies and organizations could address these issues strategically in a
partnership by using other organizations to fill their core needs. The main rationale
for creating strategic partnerships is the potential for value creation through pooling
organizations’ resources together. In essence, the procurement of external resources
is an important tenet of both the strategic and tactical management of any company
(Hillman, Whithers & Collins, 2009).
The theory is important because an organisation’s ability to gather, alter and exploit
raw materials faster than competitors can be fundamental to success. RDT is
underpinned by the idea that resources are key to organisational success and that
access and control over resources is a basis of power. Resources are often controlled
by organisations not in the control of the organisation needing them, meaning that
strategies must be carefully considered in order to maintain open access to resources.
Organisations typically build redundancy into resource acquisition in order to reduce
their reliance on single sources e.g. by liaising with multiple suppliers. Resource
dependence theory has implications regarding the optimal divisional structure of
organizations, recruitment of board members and employees, production strategies,
contract structure, external organizational links, and many other aspects of
organizational strategy.
2.2.4 Organizational Growth Theory
Greiner (1998) proposed a growth model that explained the growth in business
organizations as a predetermined series of evolution and revolution. The axes of
Greiner’s growth curve are based on the age of an organisation (x axis) and the size
of an organisation (the y axis). The quicker an organisation grows the steeper the
19
curve. In order to grow, the organization is supposed to pass through a series of
identifiable phases or stages of development and crisis. These phases are; growth
through creativity, growth through direction, growth through delegation, growth
through collaboration, growth through coordination and growth through Extra-
Organizational Solutions. Specifically, the sixth phase suggests that growth may
continue through merger, outsourcing, networks and other solutions involving other
companies. The Greiner Growth Model helps one think about the growth for your
organization, and therefore better plan for and cope with the next growth
transitions.Greiner’s model suggests how organizations grow, but the basic reasons
behind the growth process and its mechanics remain heterogeneous. However, worth
noting is that in corporations, the importation of materials and energy from the
environment not only sustains life but also contributes to growth. As they keep
growing, so does their ability to acquire resources. This means that the more they
grow, the more capacity in resources acquisition they have and the more resources
they can access. This growth and the increase in resource acquisition capabilities
provide a positive feedback loop, which continues until the organization matures
(Schimke, 2011).
If the resources in a niche or a domain are abundant, a business organization in that
niche is likely to run at a profit (provided that the relevant costs are under control),
which results in an improvement in return on investment (ROI), which tends to
attract more funds from the investors. The firm can use these funds to reinvest for
expansion, to gain more market control, and make even more profit. This positive
feedback will continue until limiting factors (e.g. an increase in competition or the
depletion of resources within a particular niche) take effect (Ansoff & Antoniou,
2006).
From this model, can we learn about the challenges of growing a business which may
include; Growth is hard, Growth poses many management and leadership challenges
(crises), Leadership and organisational structure have to evolve to reflect the growth
of a business, and that businesses that don’t adjust as they grow will experience
lower growth than those that do.

20
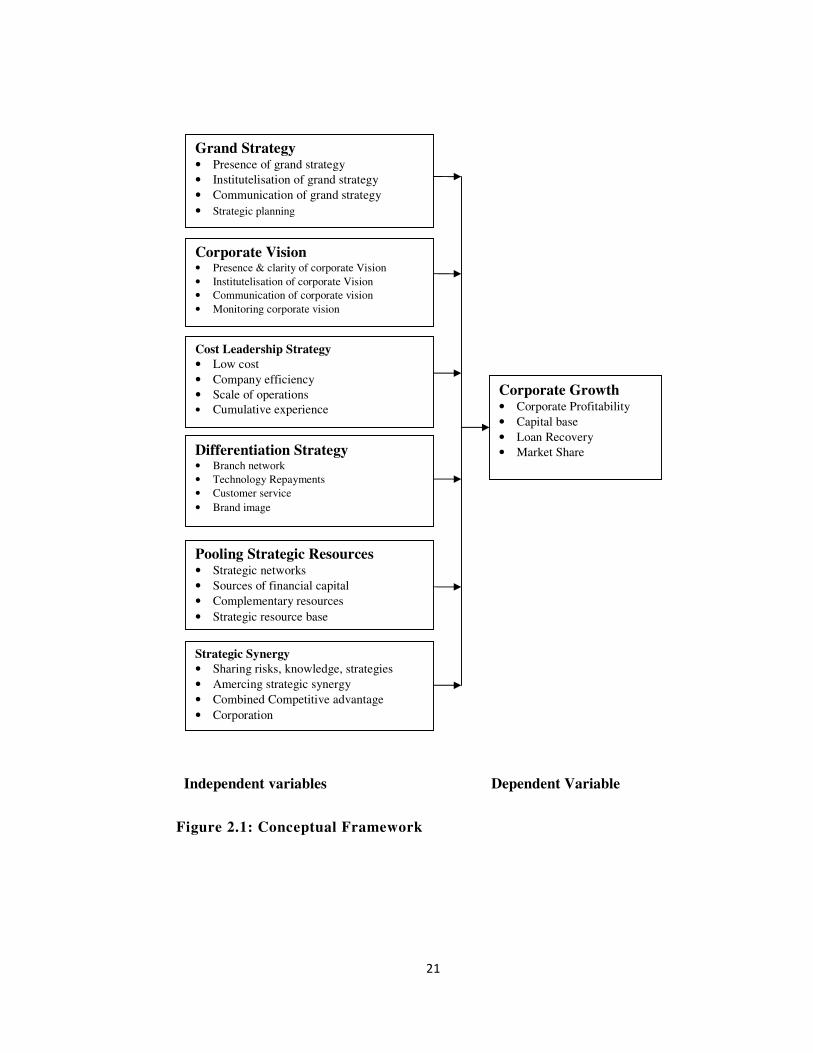
2.1 Conceptual Framework
The conceptual framework was derived from the theoretical framework of this study.
It was derived from the generic strategy theory, (Porter 1980), Competitive
Advantage Theory (Porter, 2004), The Resource Dependency Theory (Davis &
Cobb, 2010) and The Organizational Growth Theory, (Greiner, 1998). The
independent variables of the study were grand strategy, corporate vision, cost
leadership strategy, product differentiation strategy, pooling of strategic resources
and strategic synergy. The depended variable was corporate growth. The relationship
between the independent variables and the depended variable was established by the
regression model and the conceptual frame work of the study as shown.
21
Independent variables Dependent Variable
Figure 2.1: Conceptual Framework
Corporate Growth • Corporate Profitability
• Capital base
• Loan Recovery
• Market Share
Grand Strategy • Presence of grand strategy
• Institutelisation of grand strategy
• Communication of grand strategy
• Strategic planning
Pooling Strategic Resources • Strategic networks
• Sources of financial capital
• Complementary resources
• Strategic resource base
Differentiation Strategy • Branch network
• Technology Repayments
• Customer service
• Brand image
Strategic Synergy
• Sharing risks, knowledge, strategies
• Amercing strategic synergy
• Combined Competitive advantage
• Corporation
Corporate Vision • Presence & clarity of corporate Vision
• Institutelisation of corporate Vision
• Communication of corporate vision
• Monitoring corporate vision
Cost Leadership Strategy
• Low cost
• Company efficiency
• Scale of operations
• Cumulative experience

22
2.4 Review of the Determinants of Corporate Growth
2.4.1 Grand Strategy
Grand strategy helps to exercise the choice of direction that an organization adopts as
a whole (Hill & Jones, 2012). It is primarily about the choice of the tactics and
techniques for the firm as a whole and managing various product lines and business
units for maximum value. Grand strategies, often called master or business strategies
provide basic direction for strategic actions. They are the basis of coordinated and
sustained efforts directed toward achieving long-term business objectives. Even
though each product line or business unit has its own competitive or cooperative
strategy that it uses to obtain its own competitive advantage in the marketplace, the
corporation must coordinate these different business strategies so that the corporation
as a whole succeeds as a “family” (Wheelen & Hunger, 2012). Grand strategy
answers the questions of "in which businesses should we compete and how? and how
does being in that business add to the competitive advantage of the firm’s portfolio,
as well as the competitive advantage of the corporation as a whole.
Grand strategy includes decisions regarding the flow of firm resources to and from a
company’s product lines and business units. Through a series of coordinating
activities, a company transfers skills and capabilities developed in a one unit to other
units that may need such resources. In this way, it attempts to obtain synergies
among numerous product lines and business units so that the corporate whole is
greater than the sum of its individual business unit parts. It is through competitive
techniques and tactics this is achieved (Porter, 2008; Kutllovci, Shala & Troni,
2012). The role of grand strategy is to co-ordinate and direct all the resources of a
firm towards the attainment of its goals and objectives and vision. It is a statement of
strategic action. A grand strategy states the means that will be used to achieve long-
term objectives.

23
Examples of business grand strategies include; concentration strategy, market
development strategy, expansion or growth strategy, product development strategy,
innovation strategy, integration strategy, divestiture, liquidation strategy, stability
strategy and retrenchment or divestment strategy whichever is overarching (Barney
& Hesterly, 2006). Product development, innovation and technology are key
determinants of growth in the banking industry in Kenya (Akotch, & Munyoki,
2016).
Just as every product or business unit must follow a business strategy to improve its
competitive position, every corporation must decide its orientation towards growth
by asking the following three questions: Should we expand, cut back, or continue our
operations unchanged?. Should we concentrate our activities within our current
industry or should we diversify into other industries?. If we want to grow and expand
nationally and/or globally, should we do so through internal development or through
external acquisitions, mergers, or strategic alliances? Firms choose expansion
strategy when their perceptions of resource availability and past financial
performance are both high (Hill & Jones, 2012). A grand strategy is a comprehensive
general plan of major actions through which a firm intends to achieve its long-term
objectives and is supported by coordinated and sustained strategic management
efforts. Grand strategies tend to be associated with a top down management style,
which underpin sustained efforts directed toward achieving long-term business
objectives. Pearce and Robinson (2013) argue that general consensus exists on the
need for generic strategies that provide basic direction for strategic actions in order to
achieve long-term business objectives. They describe grand strategies as indicating
the time period over which long-range objectives are to be achieved.
Accordingly, grand strategies are the overall driver of strategic actions; however,
using the concept of grand strategies requires caution as many firms may operate in
more than one environment or indeed have different interpretations or perceptions of
an environment (Rothaermel, 2013). At the core of grand strategy must be a clear
logic of how the corporate objectives, will be achieved. Most of the strategic choices
of successful corporations have a central economic logic that serves as the fulcrum
for profit creation. Some of the major economic reasons for choosing a particular

24
type grand strategy are: Exploiting operational economies and financial economies of
scope, uncertainty avoidance and efficiency, possession of management skills that
help create corporate advantage, overcoming the inefficiency in factor markets and
long term profit potential of a business (Ansoff, 2007).
The essence of strategic positioning is to choose activities that yield superior
profitability because they are different from rivals’ and thus create a sustainable
competitive advantage. Note that competitive advantage is not necessarily enduring,
which is why strategy must be distinguished from operational effectiveness. The
reason why strategic planning is a primary concern not only to business managers in
particular but also other practitioners is that it may lead to significant benefits for a
firm. In effect, an explicit process of strategy formulation can determine a firm’s
long-run competitive strength and generate a persistently higher rate of profit than its
rivals by creating a sustainable competitive advantage. However, in order to compete
successfully in the long-run a firm must first choose an appropriate strategic plan
(Gamble, 2011). Strategic planning has a positive impact on performance, and a
notable relationship between managers having a planning orientation and financial
performance, with entrepreneurial, opportunistic managers doing best if they
engaged in formal planning.
However, planning seems more beneficial over the longer term than the short term.
Better performing firms are more likely to engage in sophisticated strategic planning,
consider a wider range of issues and to have longer time horizons. Although in small
firm formal strategic planning may be limited, performance is not strongly associated
with formal strategic planning but operational planning correlates better with
enhanced profits and sales than does strategic planning. Strategic planning is
beneficial to small firms, though these benefits are more likely to be felt in highly
competitive industries as it helps small firms make better strategic decisions and
enhances business performance (Pearce & Robbinson, 2013).
The purpose of strategic planning is to develop a blueprint for growing a business.
The management team creates a plot for a larger, more profitable company. The heart
of the planning process is envisioning the actions that must be taken, and the
25
expenditures that must be made, to accelerate the companys growth. Effective
planning requires an attitude of never being satisfied with the company’s current
performance. A basic principle of planning is that a company’s future is to a great
extent in its own hands. Businesses grow by uncovering opportunities to acquire
additional customers and increase market share. Planning encourages creative
strategic thinking, a mindset of continually seeking out emerging markets for the
company’s existing products and services. Planning also encourages innovation,
finding new products or services that the company could offer to the marketplace.
Growing a business requires deploying resources in a manner that maximizes
revenues. Planning involves making decisions about the best possible uses for the
company’s resources, which include people, capital, productive capacity and brand
recognition. Companies do not have unlimited resources. Planning provides the
information the management team needs to prioritize expenditures. Planning also
helps a company avoid making poor strategic choices, such as wasting resources on
entering markets where competitors have an insurmountable advantage (de Waal,
2010).
A major benefit of the planning process is encouraging all members of an
organization to work in harmony toward common objectives. Goals are set for all
levels of the organization and communicated to all employees. Everyone knows what
they are responsible for and what the highest priorities are. All team members
understand their best efforts are required for the company to reach its overall goals.
Planning opens lines of communication between functional areas so projects that
require cooperation can be completed on time. This coordinated effort helps the
company grow because more can be accomplished in the same amount of time
(Rothaermel, 2013). Rapidly growing companies are those that have identified a
market need or customer problem, and created product or services that efficiently and
cost effectively solve the problem. These solutions are significantly more beneficial
for the customer than those the competition is providing. Planning helps companies
identify markets that are large and growing, which makes it easier for the company to
build revenues. Planning also helps companies gain a clear picture of the competitors
they will be going up against.
26
They are better able to develop strategies that take advantage of competitors
weaknesses. Planning also helps a company creates marketing messages that
showcase competitive advantages to customers (Ansoff & Antoniou, 2006).
2.4.2 Corporate Vision
A vision statement is a company's road map, indicating both what the company
wants to become and guiding transformational initiatives by setting a defined
direction for the company's growth. Vision statements undergo minimal revisions
during the life of a business, unlike operational goals which may be updated from
year-to-year. Vision statements can range in length from short sentences to multiple
pages. Vision statements are also formally written and referenced in company
documents rather than, for example, general principles informally articulated by
senior management. The creation of a broad statement about the company’s values,
purpose, and future direction is the first step in the strategic-planning process. The
vision statement must express the company’s core ideologies—what it stands for and
why it exists—and its vision for the future, that is, what it aspires to be, achieve, or
create. Commonly cited traits of a good vision include; concise, clear, future-
oriented, stable, challenging, abstract and inspiring. Vision statements serve as
foundations for a broader strategic plan, motivate existing employees and attract
potential employees, help company focus and facilitate the creation of core
competencies and help companies differentiate (Darbi, & Phanuel, 2012).
Corporate vision serves as the framework for a roadmap and guides every aspect of
business by describing what needs to be accomplished in order to continue achieving
sustainable, quality growth. Corporate vision is an essential factor in building
scalable organizations that last for the long haul and reveals how companies can stay
their course, even as they grow. Growing companies require a vision-a precise idea
of their raison d'etre, strategy and values that are both inspiring and concrete enough
to guide corporate action.

27
A company's vision should describe a future that is more attractive than the present,
and its leaders should recognize that diverse viewpoints as debates are essential to
vision development (Johnson et al., 2008). Corporate strategy unifies the
organization through the corporate vision, which directly influences corporate
growth (Wheelen & Hunger, 2012).
A clearly articulated vision, fully implemented across an organization, makes a
profoundly positive difference. Visions, therefore, must describe the desired long-
term future of the organization—a future that typically is not quite achievable, but
not so fantastic as to seem like a ridiculous pipedream. The vision-development
process is therefore a balancing act. It requires imagination, a mental capacity for
synthesis, and a trust in intuition. Visions need to challenge people, evoke a feeling
that draws people towards wanting to be a part of something quite special. When a
vision is framed as something that is achievable within a set amount of years, then it
falls into the terrain of a strategic plan. Corporate vision relates to an organization’s
purpose and is typically communicated in some written form. Vision is a statement
from the organization that answers questions about where we’re going. Moreover,
firms with clearly communicated, widely understood, and collectively vision have
been shown to perform better than those without them, with the caveat that they
related to effectiveness only when strategy, mission, goals and objectives are aligned
with them as well (Collins & Porras, 2004).
Typically, vision statements are relatively brief, sometimes the vision statement is
also captured in a short tag line. To reiterate, mission statements are longer than
vision statements, often because they convey the organizations core values. Mission
statements answer the questions of “Who are we?” and “What does our organization
value?” Vision statements typically take the form of relatively brief, future-oriented
statements—vision statements answer the question “Where is this organization
going?” Increasingly, organizations also add a values statement which either
reaffirms or states outright the organization’s values that might not be evident in the
mission or vision statements (Lipton, 2003). Vision statements provide a vehicle for
communicating an organization’s future to all key stakeholders. Typically, these
statements would be widely circulated and discussed often so that their meaning is

28
widely understood, shared, and internalized. The better employees understand an
organization’s future, through its vision, the better able they will be to understand the
strategy and its implementation (Kantabutra, 2008). More important is the fact that
vision creates a target for strategy development. That is, one criterion of a good
strategy is how well it helps the firm achieve its vision. To better understand the
relationship among mission, vision, and strategy, it is sometimes helpful to visualize
them collectively as a funnel.
At the broadest part of the funnel, you find the inputs into the mission statement.
Toward the narrower part of the funnel, you find the vision statement, which has
distilled down the mission in a way that it can guide the development of the strategy.
In the narrowest part of the funnel you find the strategy —it is clear and explicit
about what the firm will do, and not do, to achieve the vision. Vision statements also
provide a bridge between the mission and the strategy. In that sense the best vision
statements create a tension and restlessness with regard to the status quo—that is,
they should foster a spirit of continuous innovation and improvement.
Indeed, firms with profound vision statements have the ability to displace
competitors with stronger reputations and deeper pockets through their ambition to
stretch their organizations in more innovative ways. The vision provide a high-level
guide, and the strategy provides a specific guide, to the goals and objectives showing
success or failure of the strategy and satisfaction of the larger set of objectives stated
in the mission. The vision statement is a narrower, future-oriented declaration of the
organization’s purpose and aspirations. Together, mission and vision guide strategy
development, help communicate the organization’s purpose to stakeholders, and
inform the goals and objectives set to determine whether the strategy is on track
(Lipton, 2003).
29
2.4.3 Cost Leadership Strategy
Cost leadership strategy involves the firm winning market share by appealing to cost-
conscious or price-sensitive customers. This is achieved by having the lowest prices
in the target market segment, or at least the lowest price to value ratio (price
compared to what customers receive). To succeed at offering the lowest price while
still achieving profitability and a high return on investment, the firm must be able to
operate at a lower cost than its rivals. There are three main ways to achieve this. The
first approach is achieving a high asset utilization. In service industries, this may
mean for example a restaurant that turns tables around very quickly, or an airline that
turns around flights very fast. In manufacturing, it will involve production of high
volumes of output. These approaches mean fixed costs are spread over a larger
number of units of the product or service, resulting in a lower unit cost, i.e. the firm
hopes to take advantage of economies of scale and experience curve effects. For
industrial firms, mass production becomes both a strategy and an end in itself. Higher
levels of output both require and result in high market share, and create an entry
barrier to potential competitors, who may be unable to achieve the scale necessary to
match the firms low costs and prices (Wheelen & Hunger, 2012).
Another dimension is achieving low direct and indirect operating costs. This is
achieved by offering high volumes of standardized products, offering basic no-frills
products and limiting customization and personalization of service. Production costs
are kept low by using fewer components, using standard components, and limiting
the number of models produced to ensure larger production runs. Overheads are kept
low by paying low wages, locating premises in low rent areas, and establishing a
cost-conscious culture. Maintaining this strategy requires a continuous search for
cost reductions in all aspects of the business. This will include outsourcing,
controlling production costs, increasing asset capacity utilization, and minimizing
other costs including distribution, research and development, and advertising. The
associated distribution strategy is to obtain the most extensive distribution possible.
Promotional strategy often involves trying to make a virtue out of low cost product
features. The third dimension is control over the value chain encompassing all
functional groups (finance, supply/procurement, marketing, inventory, information

30
technology) to ensure low costs. For supply/procurement chain this could be
achieved by bulk buying to enjoy quantity discounts, squeezing suppliers on price,
instituting competitive bidding for contracts, working with vendors to keep
inventories low using methods such as Just-in-Time purchasing or Vendor-Managed
Inventory. Other procurement advantages could come from preferential access to raw
materials, or backward integration (Barney & Hesterly, 2006).
Cost leadership is different from price leadership. A company could be the lowest
cost producer, yet not offer the lowest-priced products or services. If so, that
company would have a higher than average profitability. However, cost leader
companies do compete on price and are very effective at such a form of competition,
having a low cost structure and management. Firms pursuing a strategy of cost
leadership will benefit more from the use of leverage in terms of the increased
managerial efficiency which corresponds to be monitored by lenders. Accordingly,
Porter (1985) suggested that cost leadership firms need to control costs tightly,
refrain from incurring too many expenses from innovation or marketing, and cut
prices when selling their products (Porter, 1985). A cost leadership strategy aims to
exploit scale of production, well defined scope and other economies, producing
highly standardized products, and using high technology. Firms that succeed in cost
leadership often have the following internal strengths: Access to the capital required
to make a significant investment in production assets, skill in designing products for
efficient manufacturing, high level of expertise in manufacturing process
engineering, and efficient distribution channels.
To succeed at offering the lowest price while still achieving profitability and a high
return on investment, the firm must be able to operate at a lower cost than its rivals
(Porter, 2004; Atikiya, Mukulu, Kihoro & Waiganjo, 2015). Cost leadership is often
driven by company efficiency, size, scale, scope and cumulative experience (learning
curve). To succeed at offering the lowest price while still achieving profitability and
a high return on investment, the firm must be able to operate at a lower cost than its
rivals. There are three main ways to achieve this; achieving a high asset turnover,
achieving low direct and indirect operating costs and control over the
supply/procurement chain to ensure low costs. The control over the

31
supply/procurement chain aims at ensuring low costs. This could be achieved by bulk
buying to enjoy quantity discounts, squeezing suppliers on price, instituting
competitive bidding for contracts, working with vendors to keep inventories low
using methods such as Just-in-Time purchasing or Vendor-Managed Inventory (Hill
& Jones, 2012).
Understanding the nature of costs and their drivers it is essential to define a firm’s
cost positioning (Porter, 1985). Thus, “cost driver” is a characteristic of an activity
or event that causes that activity or event to incur costs and can be more or less under
a firm's control. Moreover, Grant (2005) states that the relative importance of the
cost drivers varies: (i) across industries; (ii) across firms within an industry;
and (iii) across the different activities within a firm. Thus, by identifying the
different cost drivers, a company can detect its cost position in relation to its rivals
(and how it differs), and investigate ways of how they could improve its cost
efficiency. Cost leadership strategy is an integrated set of action taken to produce
goods or services with features that are acceptable to customers at the lowest cost,
relative to that of competitors. Cost Leadership also tends to be more competitor
oriented rather than customer oriented (Atikiya et al, 2015). Porter (1980), posit that
a firm that successfully pursues cost leadership strategy emphasizes vigorous pursuit
of cost reduction, tight cost and overhead control, research and development and
advertisement among others to achieve a low cost position.
Sustained cost leadership strategy leads to competitive positioning (derived from
sustained competitive advantage) while sustained competitive positioning leads to
corporate growth. Porter (2004) outlines three conditions for the sustainability of
competitive advantage: Hierarchy of source (durability and imitability), number of
distinct sources and constant improvement and upgrading (Valipour, Birjandi &
Honarbakhsh, 2012). Profitability may vary depending on the wellness of fit between
the firm and the selected strategy, which make the decision of which strategy to
adopt key to the benefits of strategic planning and requires that the choice be well
founded.
32
The challenge lies in selecting the cost strategy that best suits the firm’s strengths
and resources and is least replicable by competitors and this in turn necessitates
knowledge about the firm, its business environment and competitors (Uddin &
Akhter, 2011).
The cost leadership strategy uses the lower production unit price as strategic key
element to gain bigger market share or higher profits as the competition and probably
driving some competitors out of the market. The cost leadership strategy’s key
competitive advantage is the lower price in comparison or the lowest price in the
entire market and therefore appealing to cost-conscious or price-sensitive industries
and consumers. In reference to the competitive analysis in these markets the buyers
have significant power to bargain prices, it is easy for them to switch between
manufacturers and the products are very alike. The products serve basic needs and
consumers all use them in a similar way. To achieve and sustain the cost leadership
companies pursue strategies to cut down costs to a minimum through e.g. spreading
fixed cost over a large product volume to benefit from the economies of scale.
Furthermore, production costs are cut down by producing more and more
standardized products and the outsourcing of e.g. overhead activities. Companies
pursuing cost leadership have to be a step ahead of their competition to sustain the
profitable cost gap, predict changes in customer behavior or substitute products and
keep pricing aggressive but not cutting down their own profit (Smit, 2010).
Generally, cost of doing business is a significant determinant of corporate growth
(Kamaku & Waari, 2016).
Low cost strategy relative to competitors is the theme running through the entire
overall cost leadership strategy and the objective is clearly overall industry cost
leadership. Attaining cost leadership typically requires aggressive construction of
efficient scale facilities and vigorous pursuit of cost reductions through experience,
tight cost and overhead control, avoidance of marginal customer accounts, and cost
minimization in areas like research and development, service, sales force, and
advertising. When attempting to achieve an overall cost leadership position, low cost
relative to competitors is the theme running through the entire strategy. To
understand how overall cost leadership strategy may generate superior profitability, it
33
is necessary to identify the benefits of a low-cost position. A low-cost position gives
a firm a defense against rivalry from competitors, because its lower costs mean that it
can still earn returns after its competitors have competed away their profits through
rivalry. A low-cost position defends the firm against powerful buyers because buyers
can exert power only to drive down prices to the level of the next most efficient
competitor.
Low cost provides a defense against powerful suppliers by providing more flexibility
to cope with input cost increases. The factors that lead to a low-cost position usually
also provide substantial entry barriers in terms of scale economies or cost
advantages. Finally, a low-cost position usually places the firm in a favorable
position vis-à-vis substitutes relative to its competitors in the industry (Hill & Jones,
2012). Because scale economies and cost advantages tend to defend a firm against
powerful buyers and suppliers and provide substantial entry barriers, achieving a low
overall cost position often requires a high relative market share. In other words, cost
advantages can create value for a firm by reducing the five threats of entry, rivalry,
substitutes, suppliers and buyers. More specifically, there are six main cost
advantages, or, sources of cost advantages for firms that successfully adopt cost
leadership: size differences and economies of scale, size differences and
diseconomies of scale, experience differences and learning-curve economies,
differential low-cost access to productive inputs, technological advantages
independent of scale, and policy choices (Porter, 2004; Johnson et al., 2008;
Hoskisson, 2013).
Porter (1985) introduces various cost drivers, their nature and characteristics within a
business. These are: (i) Economies of scale:exist when the costs of performing an
activity decrease as the scale of the activity increases; (ii) Economies of
Learning: are cost savings that derive from “learning by doing”; (iii) Capacity
Utilisation: refers to the relationship between the ‘potential output’ that could be
produced and the ‘actual output’ that is produced with the existing installed
equipment, if the capacity was fully used; (iv) Linkages: costs with a company
interrelate to each other. Linkages (internal and external) refer to the costs incurred
by most activities that are significantly affected by those activities that ‘link’ with it.
34
Koskei and Njoroge, (2014) noted that interest rates is a key determinant of growth
and expansion; (v) Interrelationships: refers to those costs occurring from the
relationships of mutual dependence between a company’s part of its business with
another; (vi) Degree of Integration: involves ownership or control of ‘inputs’ to a
company’s processes or the channels of product distribution; (vii) Timing: in relation
to a company’s choices in relation to its business cycle (i.e. introduction of new
technology) or market conditions (i.e. ‘first mover’ advantage); (viii) Policy
Choices: refers to the cost of various value activities that are affected by policy
choices a company makes; (ix) Location: relates to the geographic location of a value
activity that can affect its cost; and(x) Institutional factors: refer to a number of
regulations imposed by governments that can affect a company’s ability to produce
economically.
There are pitfalls to the low-cost strategy that must be carefully avoided. Low Cost
and Poor Quality: In an industry or market segment where quality is the most
important feature to customers, appearing to be the low-cost operator is not always
desirable. There’s an amazing phenomenon in pricing, where an increase in price
leads to an increase in sales because of a basic guideline that is programmed into
customers mind. Customers are so used to better products costing more, that when
something costs more they assume that it is better. Further, low-price customers tend to
be disloyal: Another possible disadvantage in competing on low price is that
customers are not as ‘sticky’ as those who buy from a business for brand reasons
(Johnson et al., 2008).
2.4.4 Product Differentiation Strategy
A differentiation strategy calls for the development of a product or service that offers
unique attributes that are valued by customers and that customers perceive to be
better than or different from the products of the competition. The value added by the
uniqueness of the product may allow the firm to charge a premium price for it. The
firm hopes that the higher price will more than cover the extra costs incurred in
offering the unique product. Firms that succeed in a differentiation strategy often
have critical internal strengths: Access to leading scientific research, highly skilled
35
and creative product development team, strong sales team with the ability to
successfully communicate the perceived strengths of the product and corporate
reputation for quality and innovation (Hitt et al., 2012). When using differentiation
strategy, a company focuses its efforts on providing a unique product or service.
Since, the product or service is unique this strategy provides high customer loyalty.
Product differentiation fulfills a customer need and involves tailoring the product or
service to the customer. This allows organizations to charge a premium price to
capture market share. The differentiation strategy is effectively implemented when
the business provides unique or superior value to the customer through product
quality, features, or after-sale support.
Firms following a differentiation strategy can charge a higher price for their products
based on the product characteristics, the delivery system, the quality of service, or
the distribution channels. The differentiation strategy appeals to a sophisticated or
knowledgeable consumer interested in a unique or quality product and willing to pay
a higher price (Pearce & Robinson, 2013). Differentiation consists in differentiating
the product or service offered by the firm, in other words, creating something that is
perceived industry-wide as being unique. Differentiation may be achieved in various
ways, for example through design, brand image, technology, features, customer
service, and dealer network. Muthini and Bichanga, (2014) noted that technology is a
key determinant of the Nairobi stock market growth. Bases of differentiation may be
sorted into three categories. Firstly, to implement differentiation, a firm may focus
directly on product (or service) attributes, i.e. product features, product complexity,
timing of product introduction, or location.
Secondly, a firm may focus on the relationship between itself and its customers, for
example through product customization, consumer marketing and product reputation.
Finally, differentiation may be implemented by focusing on the linkage within or
between firms, which includes linkage within functions of a firm, linkage with other
firms, product mix, distribution channels and service support. Ideally, the firm should
differentiate itself along several dimensions (Porter, 2004; Rothaermel, 2015).
Differentiation may generate superior profitability for the reason that “[it] provides
insulation against competitive rivalry because of brand loyalty by customers and
36
resulting lower sensitivity to price. It also increases margins, which avoids the need
for a low-cost position. The resulting customer loyalty and the need for a competitor
to overcome uniqueness provide entry barriers. Differentiation yields higher margins
with which to deal with supplier power, and it clearly mitigates buyer power, since
buyers lack comparable alternatives and are thereby less price sensitive. Finally, the
firm that has differentiated itself to achieve customer loyalty should be better
positioned vis-à-vis substitutes than its competitors. Besides reducing the five threats
of entry, rivalry, substitutes, suppliers and buyers, differentiation creates value by
enabling a firm to charge a premium price that is greater than the extra cost incurred
by differentiation (Barney & Hesterly, 2006).
Creative firms will always manage to differentiate themselves from competitors. As
rivals try to imitate these firms’ last differentiation move, creative firm will already
be working on new moves and therefore they always remain one step ahead of
competition. In general, bases for differentiation that are costly to duplicate include
links between functions, timing, location, reputation, distribution channels, and
service and support. A differentiation strategy is appropriate where the target
customer segment is not price-sensitive, the market is competitive or saturated,
customers have very specific needs which are possibly under-served, and the firm
has unique resources and capabilities which enable it to satisfy these needs in ways
that are difficult to copy. These could include patents or other intellectual property,
unique technical expertise, talented personnel, or innovative processes. Successful
brand management also results in perceived uniqueness even when the physical
product is the same as competitors.
Sustained product differentiation leads to competitive positioning that leads to
corporate growth (Johnson et al., 2008). New technologies improve efficiency,
enable greater production, and are a source of profit for firms. Technological
capabilities benefit firms in several ways: they enhance firm efficiency, reduce costs,
and broaden market share, both locally and globally. Business that adopts greater
levels of technological sophistication can be expected to grow more rapidly than a
similar firm that don’t.

37
Low technological capabilities hinder and discourage firms from fully reaching their
potential. In fact, firms with high levels of technological advancement tend to report
high levels of corporate performance (Colombelli, 2014).
The effect of an increase in differentiation on market share is dependent on two
opposing forces. On the one hand, an increase in differentiation most likely leads to a
high cost position independent of scale, which result in a high average cost position
(“cost increasing effect”). On the other hand, improved differentiation generates
competitive advantage, which leads to increased market share, and following, to a
low average cost position. Which one of the two forces dominates, and consequently,
determines the total effect of improved differentiation on market share depends on
the situation (“cost reducing effect”). Valipour et al. (2012) notes that differentiation
should be translated into product improvement in order for the cost reducing effect to
dominate. The reason is that an increase in product quality is believed to have
beneficial effects on the relative product demand: When increased demand is
addressed by mean of a raise in volumes, there may be indirect beneficial effects on
relative direct cost position via a positive influence on market position. In other
words, market share growth implies that economies may be achieved, which in turn
results in reduced average costs (Porter, 2004; Hill & Jones, 2012).
As differentiation increases, customers tend to become less price-sensitive, which
allows firms to increase prices provided that differentiation does not induce costs
which are superior to the price increase, profit margins increase. However, it is worth
noting that differentiation does not need to be compromised by lower costs, provided
that a firm can establish access to low labor costs. Differentiation leads to greater
market share, provided that the product appeals to customers. This implies that a firm
must identify and pursue customer preferences if it wishes to gain increased market
shares through differentiation. More specifically, when customer preferences are
favorable, differentiation allows a firm to expand its market shares via decreased
price elasticity of demand (Porter, 2004; Valipour et al., 2012).
38
Product differentiation is a marketing strategy that businesses use to distinguish a
product from similar offerings on the market. The differentiation strategy the
business uses must target a segment of the market and deliver the message that the
product is positively different from all other similar products available by
highlighting the benefits. When a company uses a differentiation strategy that
focuses on the cost value of the product versus other similar products on the market,
it creates a perceived value among consumers and potential customers. A strategy
that focuses on value highlights the cost savings or durability of a product in
comparison to other products. The product differentiation strategy also allows
business to compete in areas other than price. Product differentiation strategy may
focus on the quality and design of their products and gain a competitive advantage in
the market without decreasing their price. A successful product differentiation
strategy creates brand loyalty among customers. The same strategy that gains market
share through perceived quality or cost savings may create loyalty from consumers.
The company must continue to deliver quality or value to consumers to maintain
customer loyalty. In a competitive market, when a product doesn't maintain quality,
customers may turn to a competitor (Smit, 2010).
A product differentiation strategy that focuses on the quality and design of the
product may create the perception that there's no substitute available on the market.
Although competitors may have a similar product, the differentiation strategy focuses
on the quality or design differences that other products don't have. The business
gains an advantage in the market, as customers view the product as unique. One
positive of a successful differentiation strategy is that the company may charge a
premium for its product or service. The company does so with confidence because of
a highly developed and strong corporate identity. The company can readily pass
along higher supplier costs to its customers because of the lack of substitute or
alternative products on the market. Having a loyal customer following helps stabilize
the company's revenue and lessens the impact of market downturns because of
customer loyalty in good times and bad.
39
Product differentiation is not always a straight success. Imitation is the sincerest form
of flattery. A company that succeeds in implementing a differentiation strategy must
worry about competitors' copying its business methods and stealing away its
customers. In addition, implementing a differentiation strategy is costly. It may take
years before a company achieves a strong brand image that sets it apart. During that
time, the company faces the risk of changing consumer tastes or preferences. In such
a case, the company may not have sufficient customer demand to offset its higher
costs, which may lead to a loss. As a result, a differentiation strategy may not be
ideal for every company (Hill & Jones, 2012). It is difficult to maintain
differentiation for an indefinite amount of time because of competition. Many
companies attempt to find the right balance by competing on such things as price,
service and quality, or on any combination of attributes that it believes are important
to its customers to gain a competitive advantage. For example, a company that
differentiates itself based on price may sacrifice quality to attract customers who are
price sensitive. During market downturns, the company may enjoy higher sales than
one that competes based on differentiation quality.
A differentiation strategy is appropriate where the target customer segment is not
price-sensitive, the market is competitive or saturated, customers have very specific
needs which are possibly under-served, and the firm has unique resources and
capabilities which enable it to satisfy these needs in ways that are difficult to copy.
These could include patents or other Intellectual Property, unique technical expertise,
talented personnel or innovative processes. Successful differentiation is displayed
when a company accomplishes either a premium price for the product or service,
increased revenue per unit, or the consumers' loyalty to purchase the company's
product or service (brand loyalty). Differentiation drives profitability when the added
price of the product outweighs the added expense to acquire the product or service
but is ineffective when its uniqueness is easily replicated by its competitors. This
drives corporate growth (Coad, 2009).
40
2.4.5 Pooling of Strategic Resources
Strategic partnering is an idea that is loosely used to describe anything from
teamwork to strategic alliances to contractual partnerships. Therefore, it is the
process of two or more entities coming together for the purpose of creating
synergistic solutions to their mutual challenges (Dada, Ahmad & Bello, 2015).
Through pooling of strategic resources, strategic partners are able to enter new
markets with little investment, be more effective, drive cost benefits or leverage
strengths, and be more competitive. Grant (2008) states that for complete strategies,
as opposed to individual projects, creating option value means positioning the firm
such that a wide array of opportunities become available. Firms taking advantage of
strategic partnerships can utilize other company's strengths to make both firms
stronger in the long run. Typically two companies form a strategic partnership when
each possesses one or more business assets that will help the other, but that each
respective other does not wish to develop internally.
An organization might form partnerships with customers, suppliers or even
competitors (Crook, Ketchen, Combs & Todd, 2008). Partners may provide the
strategic partnerships with resources such as products, distribution channels,
manufacturing capability, project funding, capital equipment, knowledge, expertise,
intellectual property and organizational legitimacy (Luypaert, 2008). In essence,
strategic partnerships have the potential to address challenges and opportunities that
could not have been handled in the same way outside of a partnership. It is of
essential importance to integrate strategic alliance management into the overall
corporate strategy to advance products and services, enter new markets and leverage
technology and research and development (Davis & Cobb, 2010).
Perceived mutual dependencies between organizations can motivate potential
partners to come together and join forces when the organizations perceive critical
strategic interdependencies with other organizations in their environment (Drees &
Heugens, 2013). Interdependence causes uncertainty in managing necessary
resources for organizational survival and drives organizations to seek complementary
or supplementary capabilities and resources in others. Because organizations are not
41
self sufficient and do not have control over all the resources they require, interaction
with others is necessary to advance one’s own interests. This means that partnerships
are ways of gaining access to critical resources necessary for their own success and
survival. The main rationale for creating strategic partnerships is the potential for
value creation through pooling organizations’ resources together. In essence the
procurement of external resources is an important tenet of both the strategic and
tactical management of any company (Qing, Weijing, & Wenhui, 2012). Presence of
a large base of resources allows an organization to outlast competitors by practicing a
differentiation strategy. An organization with greater resources can manage risk and
sustain profits more easily than one with fewer resources. This provides the
foundation for corporate growth (Margarita, 2009).
Dynamic capabilities are central to the development of a sustainable growth path.
Evidence suggests that dynamic capabilities have a positive effect on firm
performance, both measured in terms of market and financial performance relative to
firm’s main competitors and industry averages. Qualitative evidence suggests that
dynamic capabilities are positively linked to the substantive capability development,
and that capability development is a mediator of the relationship between dynamic
capabilities and firm performance (Crook et al., 2008). Strategic alliances are
increasingly becoming popular day by day. To achieve competitive advantages firms
combine their assets and capabilities in a cooperative policy that is termed as
strategic alliance. Strategic alliance is considered as an essential source of resource-
sharing, learning, and thereby competitive advantage in the competitive business
world. Management of alliance and value creation to attain competitive advantage is
very important in strategic alliance.
Formation of relational capital demands an integrative approach to manage the
contemporary conflict, and firms get the opportunity of both at the same time. Thus,
as linkages between them strategic alliance involve firms with some degree of
exchange and sharing of resources and capabilities to co-develop or distribute goods
or services. The achievement of competitive advantages is not possible by one firm
itself because it does not possess required all resources and knowledge needed to
enhance market competitiveness (Peteraf & Barney, 2003). In both developing and

42
developed countries, small firms have less access to external financing, which leads
small firms being more restrained in their operations and growth compared to large
firms. Ala and Ngugi, (2013) noted that access to financial services improves MFIs
growth in Kenya. Developing countries provide further evidence that small firms
face greater financing obstacles than large firms do. Actually in most economies,
access to financing is among the most binding obstacles while other obstacles appear
to matter much less (Dada et al., 2015; Nyamita, Dorasamy & Garbharran, 2015).
2.4.6 Strategic Synergy
Strategic partnerships are becoming an important form of business activity in many
industries, particularly in view of the realization that companies are competing on a
global field. Strategic partnerships are not a panacea for every company and every
situation. However, through strategic partnerships, companies can improve their
competitive positioning, gain entry to new markets, supplement critical skills, and
share the risk and cost of major development projects (Qi, Sutton & Zheng, 2015).
Synergy is derived from the Greek word “synergos” meaning working together, it is
the interaction of multiple elements within a given system to produce an enhance
effects different or greater than the sum of their individual (Davis & Cobb, 2010).
Thus, synergy is the ability of the group to outperform far and above the individual
member. Moreover, synergy’s value creation ability stem from an opportunity to
utilize specialized resources to reduce costs or create ability or charge high price or
both. In essence, it is a system created to constitute a set of interacting component
working together with a common objective to achieve a designated goal (Enz, 2008).
Synergy is the concept that the value and performance of two companies combined
will be greater than the sum of the separate individual parts. Synergy is a term that is
most commonly used in the context of mergers and acquisitions. Synergy, or the
potential financial benefit achieved through the combining of companies, is often a
driving force behind a merger. Shareholders will benefit if a company's post-merger
share price increases due to the synergistic effect of the deal. The expected synergy
achieved through the merger can be attributed to various factors, such as increased
revenues, combined talent and technology, or cost reduction. Synergy is a value

43
creating process that stems from an opportunity to utilize specialized resources to
reduce cost or charge high price or both. It connotes interaction of multiple elements
in a given system working together to produce an output greater than the sum of their
individual combine. Hence, the axiom of synergy posits that 2+2=5. In view of the
above, the simultaneous application of synergistic and strategic management
principles will help in overcoming the continuous increase in corporate adversaries in
pursuance of its mission (Dada et al., 2015).
Davis and Cobb, (2010) opine that synergy is based on the premise collaboration,
enhance the capacity of an organization in achieving a greater height far and above
individual’s ability. It is a process through which parties who see different aspect of
the problem or units involve in different aspect of tasks, explore constructively their
differences and search for solutions that are above their individual purview. Porter
(1985) contends that instead of assuming a zero sum relationship between different
units, there is the possibility of two or more units synergizing their efforts to achieve
greater feats. Corporate synergy can be realized when a company acquire or merge
with another with another company/unit. The entire process revolves around a
combination of corporate entities to create more income, increase cash flows, cash
slack, debt capacity by combining with cash extensive project firm with cash rich
firm with little or no debt, tax benefits by the utilizing the unused tax benefits,
management and cost synergy involving joining efforts that produce greater output
than acting alone, resulting into appreciable cost reduction.
Synergistic strategy entails units/organizations supporting each other by leveraging
their complimentary strength to attain a maximum output far and above individual’s
capacity. That is, it is a collaborative process through which parties which see
different aspects of the problem constructively explore their differences and proffer
solutions that span wider than their limited individual vision by combining their
human and material resources in pursuance of a goal which is far beyond individual’s
reach (Margarita, (2009). Strategic partnerships aim at amercing strategic synergy
and creating synergistic solutions where each partner hopes that the benefits from the
partnerships will be greater than those from individual efforts. The Strategic
partnerships often involve technology transfer (access to knowledge and expertise),

44
economic specialization, shared expenses and risk (Davis & Cobb, 2010). Strategic
synergy describes the mutual benefits a business experiences by strategically
organizing itself to maximize cooperation and innovation. In simple terms, a
synergistic organization achieves more as a group than its parts could in isolation.
Strategic alliances can help firms gain knowledge and expertise. Further, when
partners contribute skills, brands, market knowledge, and assets, there is a synergistic
effect.
Gitau and Wanjau, (2013) noted that staff competence is a key factor affecting
performance of insurance firms. The result is a set of resources that is more valuable
than if the firms had kept them separate. Increasing synergy requires a careful
analysis of your organization’s current strategies to identify better ways of doing
business. Eliminating structural redundancy and sharing successful strategies also
increases synergy by identifying ways to streamline operations and allowing each
partner to focus on being maximally efficient. In either case, the partners benefit
from the synergistic connection in ways that neither could alone. It is this bundle of
benefits that leads to corporate growth (Abuzaid, 2014).
The basis for a competitive advantage of a firm lies primarily in the application of
the bundle of valuable, rare, in imitable, inter-changeable and intangible assets,
resources and capabilities at the firm's disposal. To transform a short-run competitive
advantage into a sustained competitive advantage requires that these resources are
heterogeneous in nature and not perfectly mobile (Peteraf & Barney, 2003).
Effectively, this translates into valuable resources that are neither perfectly imitable
nor substitutable without great effort. If these conditions hold, the firm’s bundle of
resources can assist the firm to sustain above average returns. It is this protection and
sustainability of competitive advantage that brings in corporate growth (Porter &
Kramer, 2008). Management and value creation to attain competitive advantage is
very important in strategic alliances. This involves firms exchanging and sharing of
resources and capabilities to co-develop or distribute goods or services.
45
The achievement of competitive advantages may not be possible by one firm itself
because it does not possess required all resources and knowledge to be
entrepreneurial and innovative in dynamic competitive markets. Inter -
organizational relationships create the opportunity to share the resources and
capabilities of firms while working with partners to develop additional resources and
capabilities as the function for new competitive advantages. Managing an alliance
focuses on leveraging the differences to create value for the customer, dealing with
internal challenges, managing daily competition of the alliance with competitors and
risk management which has become a company-wide concern (Kavale, 2007; Drees
& Heugens, 2013).
Small businesses in search of growth favor alliances because they can quickly and
inexpensively provide access to technology, expertise, marketing, production,
distribution and other capabilities. Businesses that participate in alliances grow
faster, increase productivity faster and report higher revenues than abstainers.
Synergy is the benefit most alliances are after. If you have a product but lack
distribution, you may seek synergy by allying with a company that has good
distribution and no competing product. Companies that own technologies that can be
combined with others to create a compelling product are also potential allies. In
international alliances, one company can provide local market skills while another
supplies imported products or technologies. Partners may also benefit by purchasing
cooperatively, marketing jointly, combining research and development, co-
sponsoring training, or agreeing to set standards in a new technology (Reuers, 2004).
Organizations strive to achieve positive synergy or strategic fit by combining
multiple products, business lines, or markets. The potential benefits that firms may
realize from strategic alliances include; ease of market entry, shared risks, shared
knowledge and expertise, and competitive advantage. These are the launching pads
for strategic synergy (Uddin & Akhter, 2011).
Competition becomes more effective when partners leverage off each other’s
strengths, bringing synergy into the process that would be hard to achieve if
attempting to enter a new market or industry alone. Forming strategic alliances with
an established company with a good reputation can help create favorable brand

46
image and efficient distribution networks. Even established reputable companies
need to introduce new brands to market. Most times smaller companies can achieve
speed to market quicker than bigger more established companies. Leveraging off the
alliance will help to capture the shelf space which is vital for the success of any
brand (Reur, 2004; Uddin & Akhter, 2011).
Entering new markets further confers benefits such as economies of scale and scope
in marketing and distribution. The cost of entering a new market may be beyond the
capabilities of a single firm but, by entering into a strategic partnership with another
firm, it will achieve the benefit of rapid entry while keeping the cost down. Choosing
a strategic partnership as the entry mode may overcome the remaining obstacles,
which could include entrenched competition and hostile government regulations.
Risk sharing is another common rationale for undertaking a cooperative arrangement
- when a market has just opened up, or when there is much uncertainty and instability
in a particular market, sharing risks becomes particularly important. The competitive
nature of business makes it difficult for business entering a new market or launching
a new product, and forming a strategic alliance is one way to reduce or control a
firm’s risks (Cui, & O’Connor, 2012).
Most firms are competent in some areas and lack expertise in other areas; as such,
forming a strategic alliance can allow ready access to knowledge and expertise in an
area that a company lacks. The information, knowledge and expertise that a firm
gains can be used, not just in the joint venture project, but for other projects and
purposes. The expertise and knowledge can range from learning to deal with
government regulations, production knowledge, or learning how to acquire
resources. A learning organization is a growing organization and it derives synergy
thus competitive advantage. Achieving synergy and a competitive advantage may be
another reason why firms enter into a strategic alliance. As compared to entering a
market alone, forming strategic partnerships becomes a way to decrease the risk of
market entry, international expansion, research and development. Competition
becomes more effective when partners leverage off each other’s strengths, bringing
synergy into the process that would be hard to achieve if attempting to enter a new
market or industry alone. Forming strategic partnerships with an established
47
company with a good reputation can help create favourable brand image and efficient
distribution networks. Even established reputable companies need to introduce new
brands to market. Leveraging off the alliance will help to capture the shelf space
which is vital for the success of any brand (Ireland, Hitt, & Vaidyanath, 2002).
2.4.7 Measurement of Corporate Growth
Since firm growth is fundamentally a multidimensional phenomenon, researchers
have used different growth measures for different forms of growth. Possible growth
indicators include; assets, employment, market share, physical output, profits, stock
market value and sales (Delmar, Davidsson & Gartner, 2003). However, the selection
of growth indicator depends on the research question and the type of firms that are
included in the sample (Davidsson et. al. 2002). The interpretation of growth metric
also depends on the length of time over which it is measured and due to the
possibility of the exit of a firm that may again make comparisons misleading.
Since there is no one best measure of firm growth, researchers have advocated
composite measures using multiple indicators to measure heterogeneity in firm
growth. The two basic approaches commonly used in literature to measure firm
growth are the absolute and relative growth. Absolute growth measures the absolute
increase or decrease in numbers of firm size whereas relative growth measures the
growth rate in percentage terms. The challenge is to develop better knowledge about
the relative and combined effects of many predictors under different circumstances
(Boom & Reenen, 2006; Delmar, 2006). Using multiple measures help not only in
providing a “big picture” of the empirical relationships but also allow comparisons
with the earlier studies. Davidsson et al., (2006) stated that growth can be measured
with a range of different indicators, the most frequently suggested being sales,
employment, assets, physical output, market share and profits (Delen, Kuzey &
Uyar, 2013; Nyamita et al., 2015).
Namusonge, (2010), introduced the concept of entrepreneurship in growth and
pointed out that returns on investment and the number of employees are key metrics
of growth. Growth metrics can further be divided into quantitative and qualitative
48
measures. Quantitative measures include firm productivity, financial profitability,
asset base, return on investment (ROI), percentage of market share, volume of sales,
capital base, volume of loans disbursed, stock turnover and rate of new customers
among others (Pervan & Milkota, 2013). Qualitative measures include customer
service, social and environmental impact, financial deepening, and economic
empowerment (Meyer, 2007). Both Quantitative and relative metrics of growth were
deployed for this study. Corporate growth was measured by corporate profitability,
capital base, loan recovery and market share.
2.5 Empirical Review of Determinants of Corporate Growth
Different theories have attempted to identify the main factors underlying firm
growth. They can be divided into two main schools: the first addresses the influence
of firm size and age on growth, while the second deals with the influence of variables
such as strategy, organization and the characteristics of the firm’s owners/managers.
In the first theory, Gibrat’s law hypothesized that growth is independent of size and
that firm growth decreases with firm size and age. More empirical literature has
suggested that firm growth is determined not only by the traditional characteristics of
size and age but also by other firm-specific characteristics (Gibrat, 1931; Pearce &
Robinson, 2013). Gibrat in the stochastic model of firm growth, gave explanations of
firm growth behavior. In his “law of Proportional effect”, he laid out the principle
that growth of firms is a random process and the expected increase in firm size is
proportional to the current size of the firm.
While there may be a large number of systematic factors affecting growth,
collectively they exercise only a limited influence on firms' proportionate growth.
Peteraf and Baney (2003), notes that resource based view considers the firm as a
collection of resources and the focus is on the activities it can perform with those
resources. They analyzed the process of growth in terms of the speed with which
firms could accumulate and assimilate such resources, and the opportunities for
further growth which arise when firm’s internal resources are under used. Firm
growth is dependent on the path taken by the organization and is an organizational
outcome resulting from the combinations of firm specific resources, capabilities and

49
routines (Coad, 2009). Thus, firms’ resource characteristics were considered to lead
to heterogeneity in the firm’s performance. It can be understood that the differences
in firm size (and hence firm growth) are due to the division between the objectives of
control and ownership structures. When ownership is separate from firm control, the
managers, who control the firm, tend to enhance the firm size to maximize their
satisfaction instead of firm value. Thus, there are different types of firm behaviors
which lead to different levels of performance and growth (Honjo & Harada, 2006).
Firm growth also depends on the prevailing macro-economic conditions and on the
degree of concentration or competition in the industry. Zhou and Wit (2009) studied
the determinants of firm growth in an integrated way and classified the determinants
into three dimensions: individual, organizational and environmental determinants.
Firm growth is not static in nature. Firms grow in many different ways and the
patterns of growth can vary significantly and have different causes (Delmar et al.,
2003). Research on firm growth has identified three major strategic choices for firm
growth, viz., undertaking internal expansion, conducting Mergers & Acquisitions and
developing trust based network relationships. Further, a firm’s growth and survival
depends on its capacity to learn and adapt its strategies to the changing environment
(Johnson et al. 2008; Pearce & Robinson, 2013).
A firm can grow by expansion of the current activities which is referred as “organic
growth”. Firms can also grow by acquiring existing firms. Trust based relationships
are based on interpersonal relationships to form networks and alliances. Different
types of growth have different implications for the firm managers and also have
different impact on the firm performance. Firms that grow organically show a
smoother growth pattern over time compared to firms that grow mainly through
acquisitions. Firms early in their life cycle and small firms tend to take the organic
growth path whereas mature and large firms predominantly grow by acquiring
existing businesses (Davidsson et al., 2006; Gupta et al., 2013).
The degree of indebtedness positively affects firm growth, so is the effect of external
finance and cash flow. Honjo and Harada (2006) found out that on average, young
firms are more likely to experience positive growth; moreover, turnover growth is
50
positively associated with firms’ size, process innovation, product innovation,
strategy and organisational changes. The inter-relationship between growth and
profitability is complex and is the reason for the mixed picture provided by the
empirical evidences. There are theoretical arguments that growth affects future
profitability and profitability supports future growth. But, the exact nature of these
relationships and causality remains unresolved. Intuitively, it can be argued that
firms with better financial performance will reinvest their profits for further growth.
This means that more efficient and profitable firms will have higher growth rates.
This makes the relationship between financial performance and expansionary
investment even more unique as firms face the constraint of sourcing external
financing for further investment (Coad, 2009; Kirui, 2014, Delen et al., 2013).
Greiner (1998) asserts that growth in firms takes place in series of steps and phases
of evolution and revolution. Hermelo and Vossolo, (2007) found out that technology,
diversification and productivity increases corporate growth in Ethiopia. Mengistie,
(2012) established that labor quality, asset, productivity, and leverage positively
affect growth. Mulunga, (2010), found out that lack of regulatory and policy
framework, lack of capital and high operational costs negatively affected the growth
of MFIs in Namibia. Alleire et al., (2009) identified cultural, institutional, economic,
geographic and legal framework as factors that foster the growth of MIFs. Bigsten
and Gebreeyesus, (2011) examined the relationships between firm growth and firm
size, age, and labor productivity.
Mwobobia (2012) identified lack of finance, discrimination, problems with the city
council, multiple duties, poor access to justice, and lack of education as negatively
affecting corporate growth. Muia (2011) identified profitability, industry
concentration, sales growth, stock market index, and Gross Domestic Product growth
as the major factors influencing growth of firms in Kenya. Maina (2011) found out
that information technology, funds, technical skills and market research positively
affect growth of MFIs. Namusonge (2010) identified strategies used by businesses
during the growth process, and identified barriers and incidents which facilitate or
hinder the growth of Small and Micro Enterprises during the growth process. Coad
(2009) posts that firm growth is a stochastic process and is randomly distributed
51
across firms, and that it is independent of firm-specific characteristics such as firm
size and firm age. Not only firm-specific characteristics, principally size and age, but
also other characteristics, such as research and development, innovation, strategy and
finance, affect firm growth (McKelvie & Wiklund, 2010; Coad, 2014).
2.6 Critique of Existing literature
Saxena and Maru (2016) did a study about determinants of firm growth and
classified them into three dimensions: individual, organizational, and environmental
determinants. Among the organizational determinants, formulation, preparedness to
grow, organizational learning, financial performance have positive impacts on firm
growth. Market orientation, entrepreneurial orientation, competitive intensity shows
a negative relationship. This study recommended that interlinks between different
growth indicators should be investigated further. This study contradicted general
theory that organizational competiveness, market orientation and entrepreneurial
orientation are key drivers of corporate growth. Sarwoko and Frisdiantara (2016) did
a study about growth determinants of Small Medium Enterprises and found out that
individual factors, organizational factors and environmental factors directly
influenced corporate growth in SMEs. It recommended that businesses should
cultivate the ability to cope with environmental change and that managerial input
should be organized and structured so that businesses can grow. This study, though
very insightful, was very general. From its recommendations, it shows that all three
factors positively affect SMEs growth. In practice, every individual factor has
different effects in every different SME. Still on management discretion, there are
still serious questions about whether corporate managers are consciously or
deliberatively strategic in their management styles. Even casual observation would
suggest that crisis management on a day-to-day basis is a fact of life in many
corporations. The rejoinder would be that these are generally not the types of
concerns which are successful in growing.

52
For strategic management perspectives on growth to be sufficiently plausible to act
as the main conceptual framework for corporations’ growth, it would seem essential
to be able to demonstrate more substantial longer-term vision and strategic intent
amongst the corporate managers.
Bouazza et al. (2015) reported that the growth of SMEs in Algeria is hampered by
several interrelated factors, which include business environmental factors that are
beyond the SMEs’ control and internal factors of the SMEs. The external factors
include the legal and regulatory framework, access to external financing, and human
resources capacities. The internal factors comprise entrepreneurial characteristics,
management capacities, marketing skills, and technological capacities. It
recommended that the government should create a meaningful and comprehensive
policy to improve the country's business climate. This study assumed that external
factors are beyond the SMEs control thus recommends government interventions. In
practice, firms lobby governments and thus have some control on the external
factors. Gupta et al. (2013), studied the influence of internal and external
environmental factor on the growth patterns of SMEs. They recommended that the
subset of the factors should be taken for more intensive study. Greiner (1998) asserts
that growth in firms takes place in series of steps and phases of evolution and
revolution. However, the basis and determinants of growth remain heterogeneous.
Like most models – it is simplistic. Not every business will suffer crises as it grows –
many adapt easily without suffering any obvious panics or crises. The model doesn’t
really take account of the pace of growth, particularly in an increasingly dynamic
external environment. While resource dependence theory is one of many theories of
organizational studies that characterize organizational behavior, it is not a theory that
explains an organization's performance per se. It explains the interplay between
organizational resources and how to manipulate the resources for competitive
advantage. The challenge is that there are organizations with a lot of resources, yet
their performance is dismal, as they cannot translate the resources into competitive
capabilities that propel corporate growth.
53
These studies failed to identify the effects of strategic management determinants of
corporate growth. This research therefore critiqued the above researches by
establishing the effects of strategic management determinants of corporate growth.
2.7 Research Gaps
The complexity and the uncertainty surrounding the phenomenon of firm growth
have led to the emergence of various theories predicting the evolution of firms. Muia
(2011) identified profitability, industry concentration, sales growth, stock market
index, and Gross Domestic Product growth as the major factors influencing growth
of firms in Kenya. Hermelo and Vossolo, (2007) found out that technology,
diversification and productivity increases corporate growth in Ethiopia. Mulunga
(2010), found out that lack of regulatory and policy framework, lack of capital and
high operational costs negatively affected the growth of MFIs in Namibia. These
studies, though very important to the industry, fell short in identifying the effects of
strategic management determinants of corporate growth. Rumanyika (2014),
identified inadequate business training, insufficient capital, competition, ant-
entrepreneurial culture, bureaucratic procedures in business registration, high taxes,
technological barrier/backwardness, theft/cheating and lack of trust, poor
infrastructure, and corruption as factors that significantly affect potential growth of
SMEs in Tanzania. Despite it being a wider study, it failed to study the effects of
strategic management determinants of corporate growth.
Kinyua et al. (2016), found out that stakeholder management strategies significantly
influenced financial performance of deposit taking SACCOs in Kenya. Just like the
previous research, this study failed to capture the effects of strategic management
determinants of growth. Saxena and Maru, (2016) classified determinants of growth
into three dimensions: individual, organizational, and environmental determinants.
They recommended that interlinks between different growth indicators should be
investigated further. However, under the organizational determinants they failed to
identify the strategic management determinants of corporate growth and their effects
on corporate growth. Bouazza et al. (2015) noted that the growth of SMEs in Algeria
is hampered by business environmental factors and internal factors. This study
54
recommended that government should create a meaningful and comprehensive policy
to improve the country's business climate. This study was too general and failed to
specifically identify the strategic management determinants and consequently what
their effects are to SMEs growth. There is a lack of shared understanding on the
causes, effects, and the process of growth (Leitch et al., 2010). This is a clear
indication that strategic management determinants of corporate growth have not been
well illustrated. More so, key documentation on the effects of strategic management
determinants of corporate growth in Kenya is sufficiently lacking. To fill this gap,
this study went out to establish the effects of strategic management determinants of
corporate growth of MFIs in Kenya.
2.8 Summary
The chapter reviewed the theories related to the study which included Porter’s
generic theory, the competitive advantage theory, the resource based theory, and the
organizational growth model. It also covered the area of strategic management
determinants and their effect on corporate growth of MFIs. The conceptualized
strategic management determinants of corporate growth ware; grand strategy,
corporate vision, cost leadership strategy, differentiation strategy, pooling staretgic
resources and strategic synergy. The linkages among the variables were determined
and a conceptual framework was hypothesized and relevant gaps explained.
55
CHAPTER THREE
RESEARCH METHODOLOGY
3.1 Introduction
This chapter presented an overview of the methodological perspective of this
research. It therefore focused on the research design, the target population, sampling
frame, sample size, sampling techniques, data collection procedures, pilot test,
validity and reliability of data collection instruments, data processing, analysis
techniques and presentation, variable definition and variable measurement.
3.2 Research Design
This study used descriptive and quantitative research designs to assess the strategic
management determinants of corporate growth in Micro Finance Institutions in
Kenya. Bowen (2005); Njanja, Ogutu and Pellisier (2012); Namusonge, Nteere and
Mukulu (2012) have used both designs in their studies successfully. Descriptive
design was preferred because it ensures complete description and analysis of
phenomena making sure that there is minimum bias in the collection and analysis of
data (Creswell, 2013). Quantitative design was most appropriate to underscore the
relationship between the independent and the dependent variables. Quantitative data
was collected from the respondents and company journals and websites. Quantitative
research allowed the researcher to use independent and dependent variables to
establish relationships between the constructs (Bryman, 2012). Therefore, this study
applied quantitative research design to determine the effects of strategic management
determinants on corporate growth of MFIs in Kenya.
3.3 Target Population
Target population refers to the group of people or things of interest that the
researcher wishes to study (Sekeran, 2010). The target population was 57 firms (55
MFIs and 2 MFI regulators). The selection of the MFIs was justified by the fact that
these MFIs were assumed to have been in operation for more than five years and had
56
registered growth in their operations. The MFIs selected were deemed to have been
operating in Mombasa County as at 31st December, 2012 as per AMFI records.
3.4 Sampling Frame
The list of 55 MFIs operating in Mombasa county and two MFI regulators formed
the sampling frame of the study as shown in appendix VII. This was derived from
AMFIs list as at December, 2012. The unit of observation and analysis was the MFIs.
This study used firm age as the key variable to categorize firms into four clusters.
Category A consisted of firms with age limit of 5-10 years, category B, age limit 10-
15, and category C 15 years and over while category D consisted of the two MFI
regulators. MFIs under five years of age were not included in the study; the
researcher believed this is a period too short to identify a reliable growth path.
Moreover, recent evidence suggests that the high growth firms are not necessarily
newly founded entrepreneurial startups, but rather tend to be larger and more mature
firms (Coad, 2009).
3.5 Sample Size and Sampling Techniques
In every MFI selected for study; the chief operations managers, marketing managers,
regional managers, branch managers, chief credit officers and chief cashiers were
interviewed while at CBK and AMFI, the board members, operations managers,
chief administrators, branch managers and the chief communications officer were
interviewed. These are the top officers in the firms who are involved in strategic
management; therefore they were in a position to provide valuable and credible
information about strategic management determinants of corporate growth.
Both stratified sampling and purposive sampling methods were deployed. Stratified
sampling method was used to divide the population into distinct, independent strata
that enabled the researcher to draw inferences about specific subgroups that may be
lost in a more generalized random sample thus lead to more efficient statistical
estimates (Creswell, 2013). Stratified sampling was used to divide the target group
into four strata. Purposive sampling was used to ensure that the elements in each
stratum had certain characteristics relevant to the study. The main goal of purposive
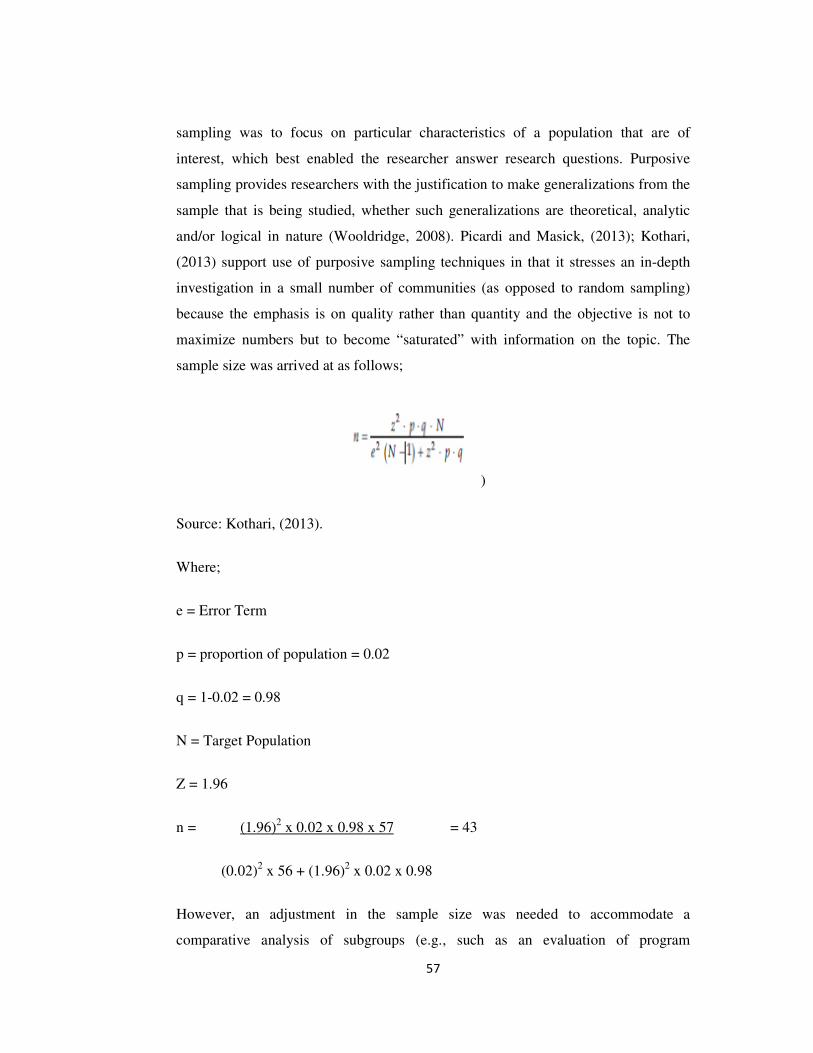
57
sampling was to focus on particular characteristics of a population that are of
interest, which best enabled the researcher answer research questions. Purposive
sampling provides researchers with the justification to make generalizations from the
sample that is being studied, whether such generalizations are theoretical, analytic
and/or logical in nature (Wooldridge, 2008). Picardi and Masick, (2013); Kothari,
(2013) support use of purposive sampling techniques in that it stresses an in-depth
investigation in a small number of communities (as opposed to random sampling)
because the emphasis is on quality rather than quantity and the objective is not to
maximize numbers but to become “saturated” with information on the topic. The
sample size was arrived at as follows;
)
Source: Kothari, (2013).
Where;
e = Error Term
p = proportion of population = 0.02
q = 1-0.02 = 0.98
N = Target Population
Z = 1.96
n = (1.96)2 x 0.02 x 0.98 x 57 = 43
(0.02)2 x 56 + (1.96)
2 x 0.02 x 0.98
However, an adjustment in the sample size was needed to accommodate a
comparative analysis of subgroups (e.g., such as an evaluation of program

58
participants with nonparticipants). Kish, (1965) says that 30 to 200 elements are
sufficient when the attribute is present 20 to 80 percent of the time (i.e., the
distribution approaches normality). As a result, the sample size was adjusted to 32
through purposive sampling method. From category A, 4 firms were selected for
study, while from category B, 10, category C, 16 and category D all 2 firms. These
32 firms were a representative of the study population.
Table 3.1: Sampling Techniques
Firm
category
Age Target
Population
Sample Size % of Sample
Size
Category A
Category B
Category C
Category D
Category D
0-5 years
5-10 years
10-15 years
>15 years
CBK
AMFI
13
14
13
16
1
1
0
4
10
16
1
1
0
30
80
100
100
100
Total 57 32 56.1
Out of the 32 firms, five (5) questionnaires were distributed to each therefore totaling
to 160 the number of questionnaires administered in this study. Five questionnaires
were sufficient to capture information about the effects of strategic management
determinants of growth from different departments in the organizations.
3.6 Data Collection Methods
This section outlined the method used to collect both primary data and secondary
data.

59
3.6.1 Primary Data
The main instruments of primary data collection for this study were questionnaires.
Structured questionnaires were most appropriate for their ability to be easily
administered, completed and analyzed (Creswell, 2013). Valid and detailed questions
about the effects of strategic management determinants of corporate growth in MFIs
were structured. Items in the questionnaire were arranged in a logical sequence
according to the themes being studied and items that would elicit similar responses
were grouped together. Linkert type scale was used to construct the structured
questionnaire. The questionnaire consisted of two main sections. Section one covered
the general information about the study population. The second part focused on the
effects of strategic management determinants of corporate growth and the metrics of
corporate growth. The Likert-type scale that ranges from 1(no extent) to 5 (greatest
extent) was used to quantify the responses to questions in section two.
3.6.2 Secondary Data
Secondary data is data collected by someone other than the user. Secondary data
collection and analysis saves time that would otherwise be spent collecting data and,
particularly in the case of quantitative data, provides larger and higher-quality
databases that would be unfeasible for any individual researcher to collect on their
own (Kothari, 2013). This wealth of background work means that secondary data
generally have a pre-established degree of validity and reliability which need not be
re-examined by the researcher who is re-using such data. It is also helpful in the
research design of subsequent primary research and can provide a baseline with
which the collected primary data results can be compared to (Picardi & Masick,
2014). For this study, secondary data was from company records, journals and texts
on strategic management determinants of corporate growth. By combining multiple
data sources researchers can hope to overcome the weakness or intrinsic biases and
the problems that come from single data source studies. This aids in confirming
research results and conclusions (Stake, 2010). This study harmonized data responses
from the MFIs, the regulators and data mined from company records. Internal
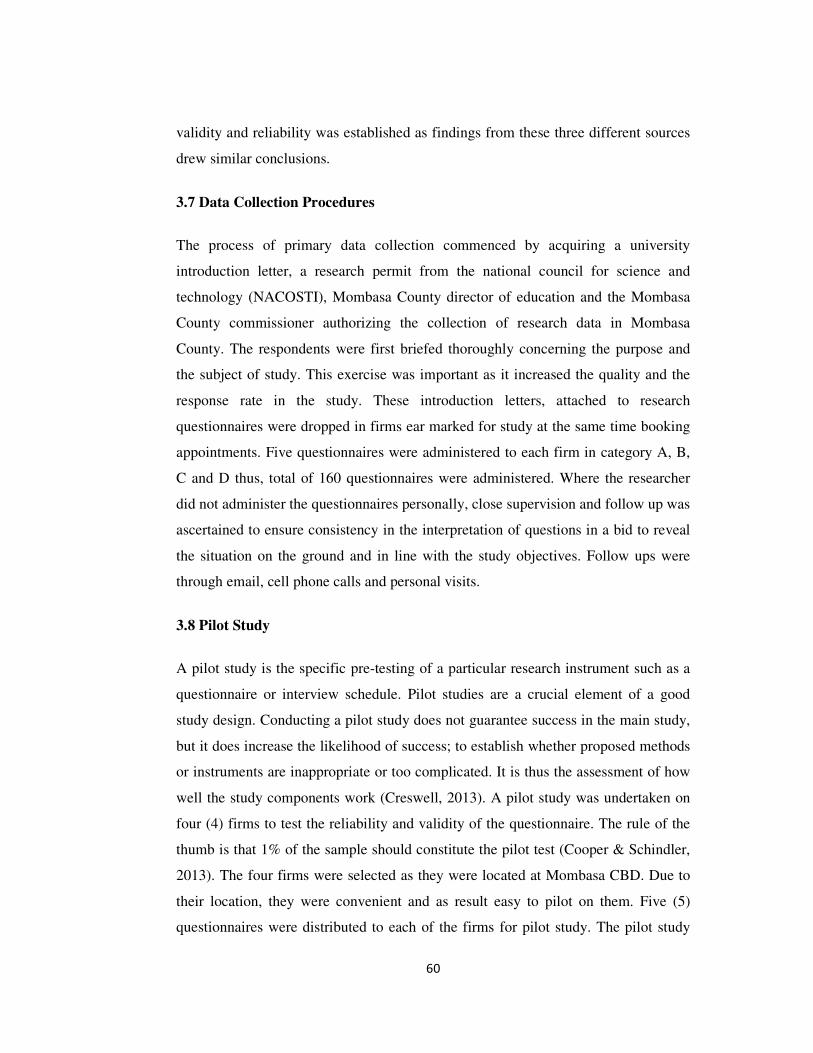
60
validity and reliability was established as findings from these three different sources
drew similar conclusions.
3.7 Data Collection Procedures
The process of primary data collection commenced by acquiring a university
introduction letter, a research permit from the national council for science and
technology (NACOSTI), Mombasa County director of education and the Mombasa
County commissioner authorizing the collection of research data in Mombasa
County. The respondents were first briefed thoroughly concerning the purpose and
the subject of study. This exercise was important as it increased the quality and the
response rate in the study. These introduction letters, attached to research
questionnaires were dropped in firms ear marked for study at the same time booking
appointments. Five questionnaires were administered to each firm in category A, B,
C and D thus, total of 160 questionnaires were administered. Where the researcher
did not administer the questionnaires personally, close supervision and follow up was
ascertained to ensure consistency in the interpretation of questions in a bid to reveal
the situation on the ground and in line with the study objectives. Follow ups were
through email, cell phone calls and personal visits.
3.8 Pilot Study
A pilot study is the specific pre-testing of a particular research instrument such as a
questionnaire or interview schedule. Pilot studies are a crucial element of a good
study design. Conducting a pilot study does not guarantee success in the main study,
but it does increase the likelihood of success; to establish whether proposed methods
or instruments are inappropriate or too complicated. It is thus the assessment of how
well the study components work (Creswell, 2013). A pilot study was undertaken on
four (4) firms to test the reliability and validity of the questionnaire. The rule of the
thumb is that 1% of the sample should constitute the pilot test (Cooper & Schindler,
2013). The four firms were selected as they were located at Mombasa CBD. Due to
their location, they were convenient and as result easy to pilot on them. Five (5)
questionnaires were distributed to each of the firms for pilot study. The pilot study
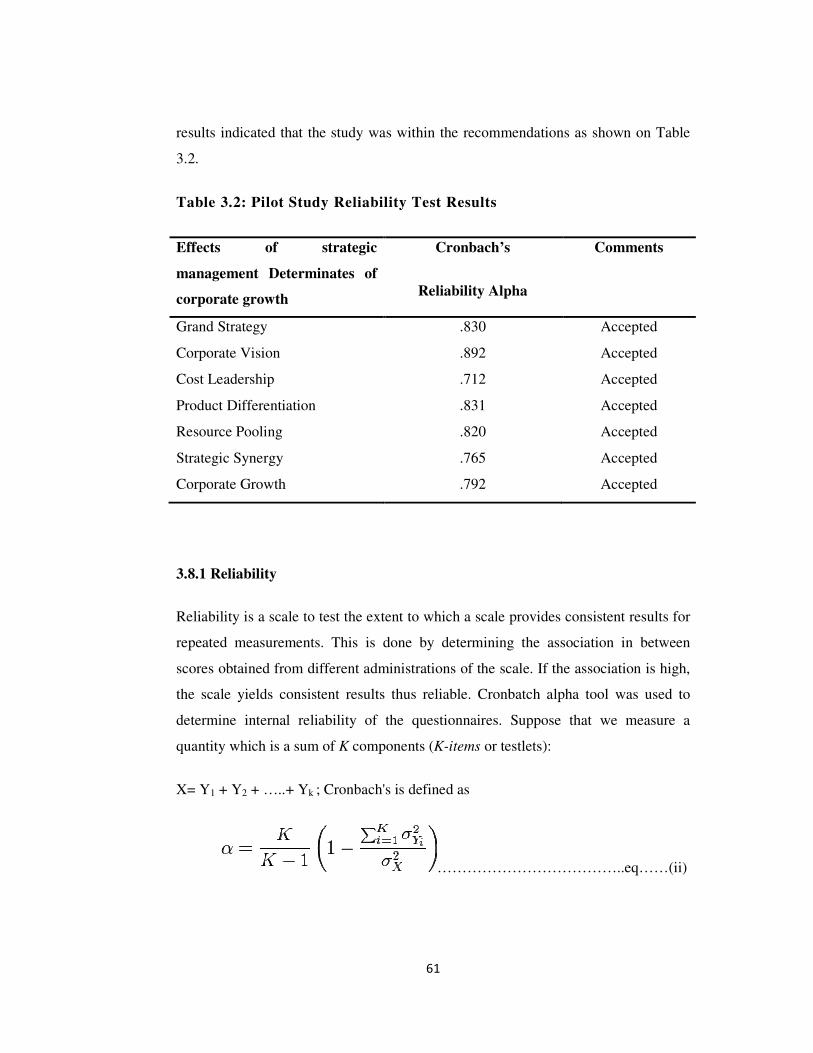
61
results indicated that the study was within the recommendations as shown on Table
3.2.
Table 3.2: Pilot Study Reliability Test Results
Effects of strategic
management Determinates of
corporate growth
Cronbach’s
Reliability Alpha
Comments
Grand Strategy .830 Accepted
Corporate Vision .892 Accepted
Cost Leadership .712 Accepted
Product Differentiation .831 Accepted
Resource Pooling .820 Accepted
Strategic Synergy .765 Accepted
Corporate Growth .792 Accepted
3.8.1 Reliability
Reliability is a scale to test the extent to which a scale provides consistent results for
repeated measurements. This is done by determining the association in between
scores obtained from different administrations of the scale. If the association is high,
the scale yields consistent results thus reliable. Cronbatch alpha tool was used to
determine internal reliability of the questionnaires. Suppose that we measure a
quantity which is a sum of K components (K-items or testlets):
X= Y1 + Y2 + …..+ Yk ; Cronbach's is defined as
………………………………..eq……(ii)

62
Where; -sum of K components
K-items or testlets
is the variance of the observed total test scores, and
the variance of component i for the current sample of persons.
Cronbatch alpha scores range from zero to unit one (0-1) with 0 indicating lack of
reliability while 1 indicates perfect reliability. All scores tested for this study were
above 0.7 which is the generally recommended score (Eisinga, Grotnhuis & Pelzer,
2012).
3.8.2 Validity
Validity is the degree to which data analysis results actually represent the
phenomenon under study. In fact, it indicates how accurate the data obtained in the
study represent the variables of the study. Validity is the extent to which a concept,
conclusion or measurement is well-founded and corresponds accurately to the real
world. The validity of a measurement is considered to be the degree to which the tool
measures what it claims to measure. It refers to whether a study is able to
scientifically answer the questions it is intended to answer (Cohen, Marion &
Morrisson, 2011). Validity is important because it can help determine what types of
tests to use, and help to make sure researchers are using methods that are not only
ethical, and cost-effective, but also a method that truly measures the idea or construct
in question (Cooper & Schindler, 2013). Content validity is a non-statistical type of
validity that involves the systematic examination of the test content to determine
whether it covers a representative sample of the behavior domain to be measured.
Content validity evidence involves the degree to which the content of the test
matches a content domain associated with the construct. A test has content validity
built into it by careful selection of which items to include. Items are chosen so that
they comply with the test specification which is drawn up through a thorough
examination of the subject domain. By using a panel of experts to review the test

63
specifications and the selection of items the content validity of a test can be
improved (Cosby, 2008). Factor analysis was used to test validity of the constructs.
KMOs measure of sampling adequacy and Bartlett’s tests of simplicity ware
deployed to test whether the relationship among the variables was significant or not.
KMO ranges from 0 to +1 and the generally acceptable score is 0.5. Bartlett’s test
shows the validity and suitability of responses collected to the problem under study.
Bartlett’s tests of simplicity ware deployed to test whether the relationship among the
variables was significant or not.
3.8.3 Diagnostic Tests
The data collected was checked for accuracy before proceeding with analysis. Data
accuracy was ascertained. Various tests were used to test the relationship between
variables, levels of significance, reliability and demographic data analysis.
Specifically, the study conducted Cronbach's alpha test, KMOs measure of sampling
adequacy and Bartlett’s tests of simplicity, demographic characteristic were tested
using percentages, mean and standard deviation, factor analysis, data normality,
linearity and independence was tested (outliers, independent errors, non zero
variances), Kolmogorrov-Smirnov (KS) one sample tests, χ2- Tests, correlation
analysis, collinearity tests, multiple regression, hypothesis testing, model summary,
ANOVA and finaly, the model was generated and interpreted.
3.9 Data Analysis and Presentation
Administered questionnaires were checked for completeness, accuracy and
consistency then presented for editing, classification, cleaning, transformation,
tabulation and coding. Data was analyzed using qualitative and quantitative
techniques.
3.9.1 Qualitative Analysis
Qualitative analysis was based on analytic methods and was used to support the
quantitative analysis. Qualitative data analysis was done using variables description,
comparison and descriptive statistics (Picardi & Masick, 2013).
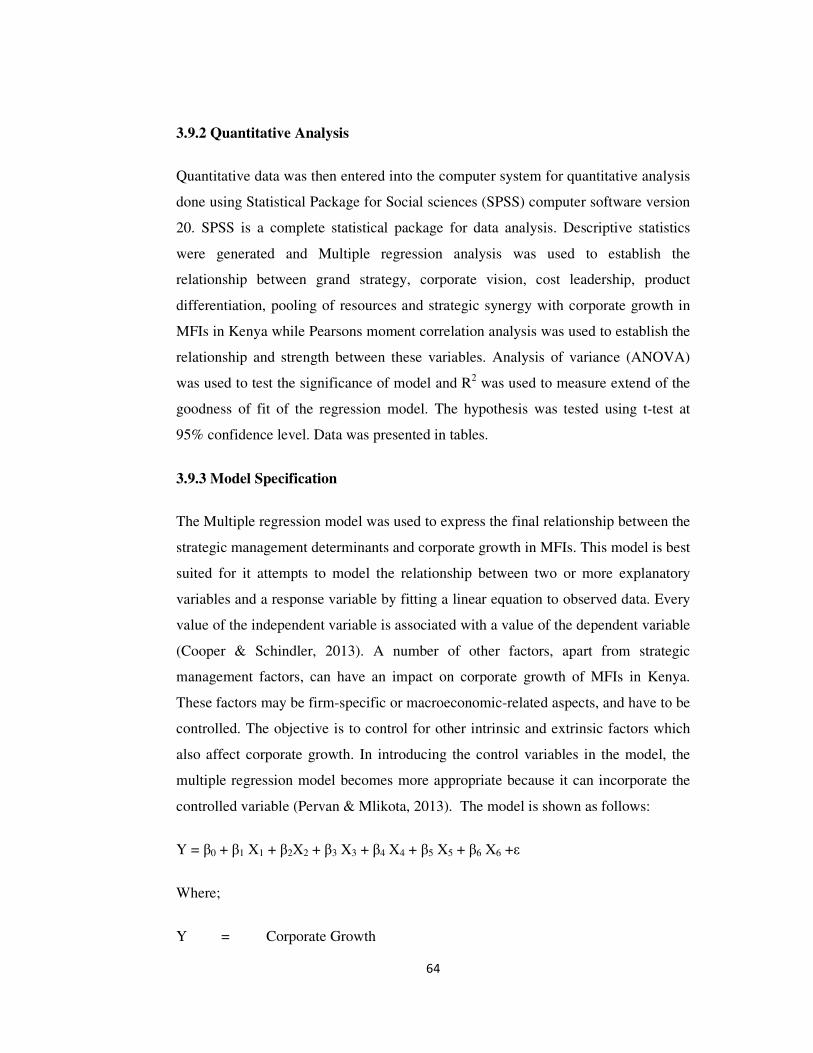
64
3.9.2 Quantitative Analysis
Quantitative data was then entered into the computer system for quantitative analysis
done using Statistical Package for Social sciences (SPSS) computer software version
20. SPSS is a complete statistical package for data analysis. Descriptive statistics
were generated and Multiple regression analysis was used to establish the
relationship between grand strategy, corporate vision, cost leadership, product
differentiation, pooling of resources and strategic synergy with corporate growth in
MFIs in Kenya while Pearsons moment correlation analysis was used to establish the
relationship and strength between these variables. Analysis of variance (ANOVA)
was used to test the significance of model and R2 was used to measure extend of the
goodness of fit of the regression model. The hypothesis was tested using t-test at
95% confidence level. Data was presented in tables.
3.9.3 Model Specification
The Multiple regression model was used to express the final relationship between the
strategic management determinants and corporate growth in MFIs. This model is best
suited for it attempts to model the relationship between two or more explanatory
variables and a response variable by fitting a linear equation to observed data. Every
value of the independent variable is associated with a value of the dependent variable
(Cooper & Schindler, 2013). A number of other factors, apart from strategic
management factors, can have an impact on corporate growth of MFIs in Kenya.
These factors may be firm-specific or macroeconomic-related aspects, and have to be
controlled. The objective is to control for other intrinsic and extrinsic factors which
also affect corporate growth. In introducing the control variables in the model, the
multiple regression model becomes more appropriate because it can incorporate the
controlled variable (Pervan & Mlikota, 2013). The model is shown as follows:
Y = β0 + β1 X1 + β2X2 + β3 X3 + β4 X4 + β5 X5 + β6 X6 +ε
Where;
Y = Corporate Growth
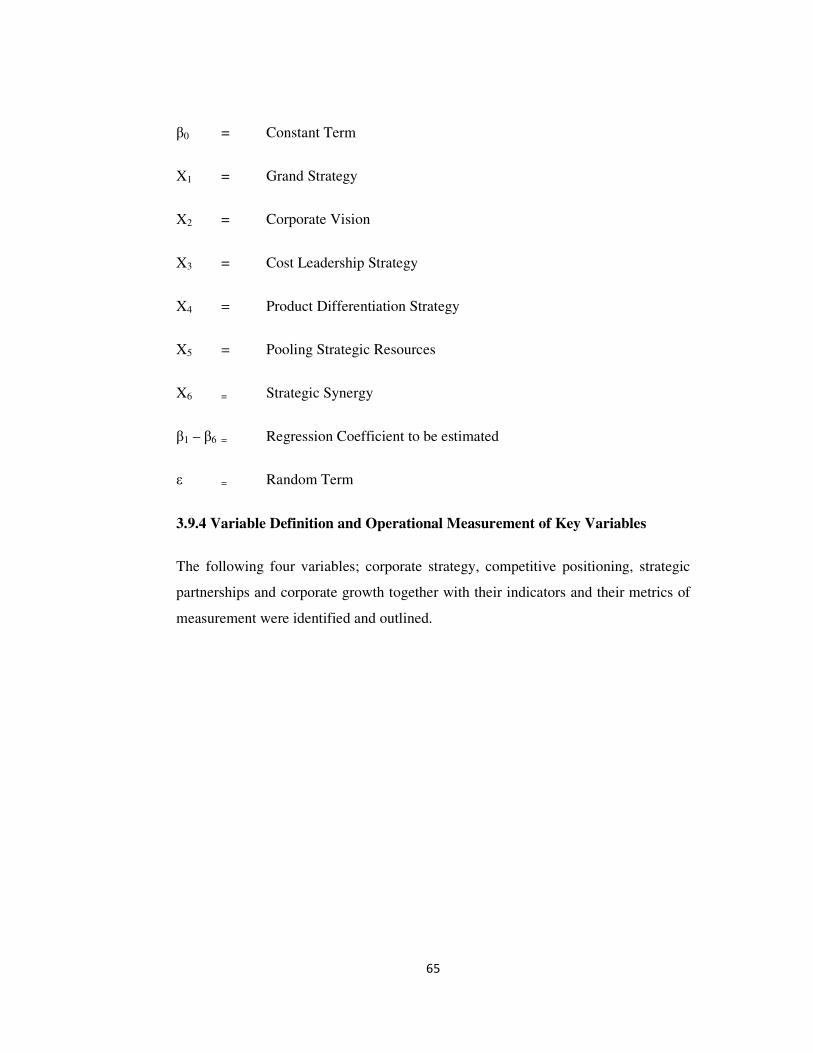
65
β0 = Constant Term
X1 = Grand Strategy
X2 = Corporate Vision
X3 = Cost Leadership Strategy
X4 = Product Differentiation Strategy
X5 = Pooling Strategic Resources
X6 = Strategic Synergy
β1 – β6 = Regression Coefficient to be estimated
ε = Random Term
3.9.4 Variable Definition and Operational Measurement of Key Variables
The following four variables; corporate strategy, competitive positioning, strategic
partnerships and corporate growth together with their indicators and their metrics of
measurement were identified and outlined.
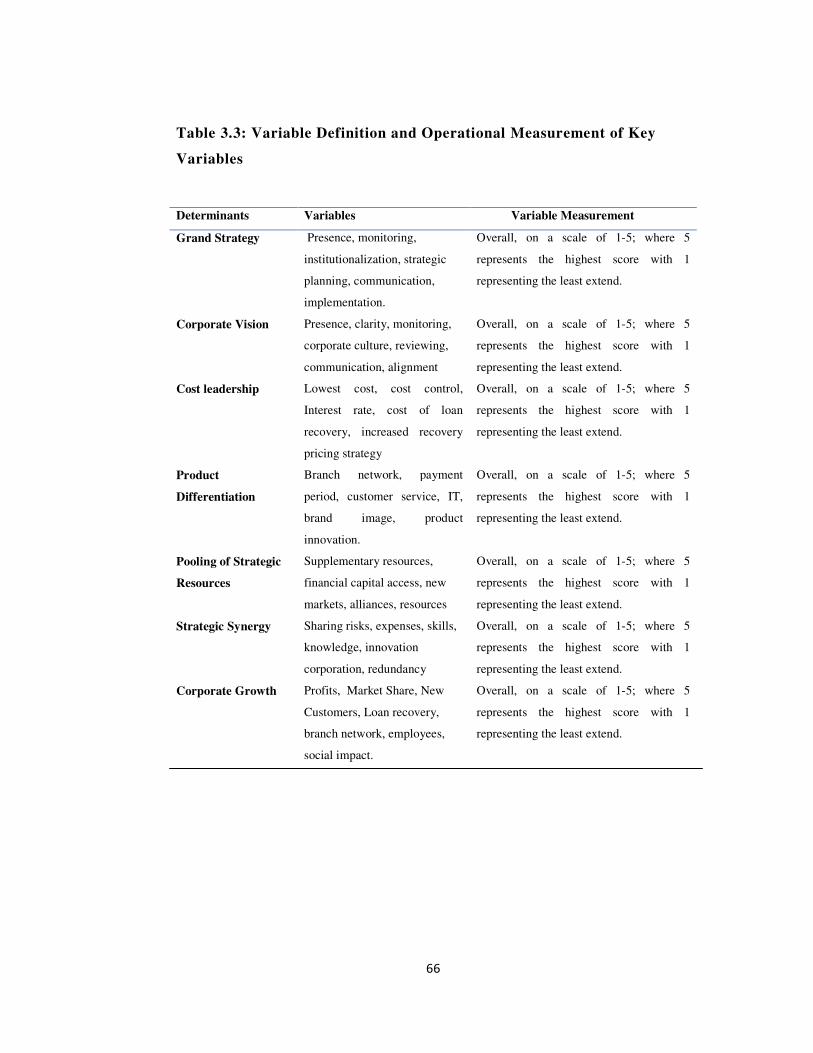
66
Table 3.3: Variable Definition and Operational Measurement of Key
Variables
Determinants Variables Variable Measurement
Grand Strategy
Presence, monitoring,
institutionalization, strategic
planning, communication,
implementation.
Overall, on a scale of 1-5; where 5
represents the highest score with 1
representing the least extend.
Corporate Vision
Presence, clarity, monitoring,
corporate culture, reviewing,
communication, alignment
Overall, on a scale of 1-5; where 5
represents the highest score with 1
representing the least extend.
Cost leadership
Lowest cost, cost control,
Interest rate, cost of loan
recovery, increased recovery
pricing strategy
Overall, on a scale of 1-5; where 5
represents the highest score with 1
representing the least extend.
Product
Differentiation
Branch network, payment
period, customer service, IT,
brand image, product
innovation.
Overall, on a scale of 1-5; where 5
represents the highest score with 1
representing the least extend.
Pooling of Strategic
Resources
Supplementary resources,
financial capital access, new
markets, alliances, resources
Overall, on a scale of 1-5; where 5
represents the highest score with 1
representing the least extend.
Strategic Synergy Sharing risks, expenses, skills,
knowledge, innovation
corporation, redundancy
Overall, on a scale of 1-5; where 5
represents the highest score with 1
representing the least extend.
Corporate Growth
Profits, Market Share, New
Customers, Loan recovery,
branch network, employees,
social impact.
Overall, on a scale of 1-5; where 5
represents the highest score with 1
representing the least extend.
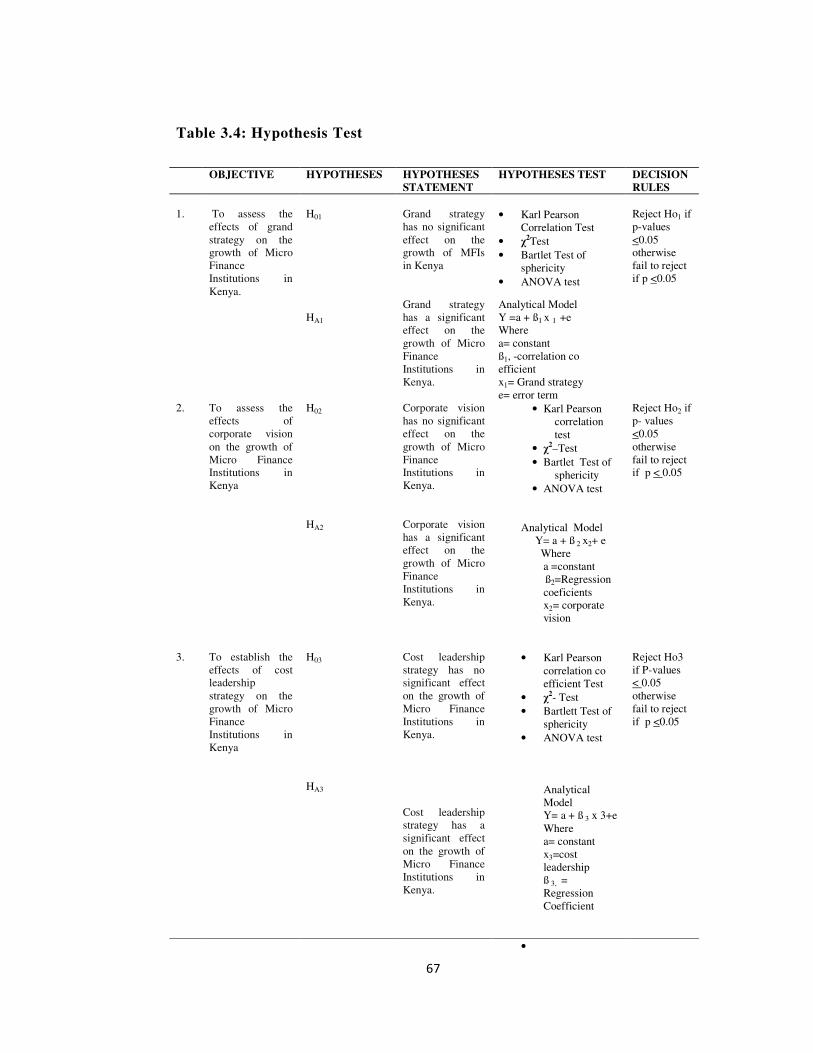
67
Table 3.4: Hypothesis Test
OBJECTIVE HYPOTHESES HYPOTHESES
STATEMENT
HYPOTHESES TEST DECISION
RULES
1. To assess the
effects of grand
strategy on the
growth of Micro
Finance
Institutions in
Kenya.
H01 Grand strategy
has no significant
effect on the
growth of MFIs
in Kenya
• Karl Pearson
Correlation Test
• χ2Test
• Bartlet Test of
sphericity
• ANOVA test
Reject Ho1 if
p-values
<0.05
otherwise
fail to reject
if p <0.05
HA1
Grand strategy
has a significant
effect on the
growth of Micro
Finance
Institutions in
Kenya.
Analytical Model
Y =a + ß1 x 1 +e
Where
a= constant
ß1, -correlation co
efficient
x1= Grand strategy
e= error term
2. To assess the
effects of
corporate vision
on the growth of
Micro Finance
Institutions in
Kenya
H02
HA2
Corporate vision
has no significant
effect on the
growth of Micro
Finance
Institutions in
Kenya.
Corporate vision
has a significant
effect on the
growth of Micro
Finance
Institutions in
Kenya.
• Karl Pearson
correlation
test
• χ2–Test
• Bartlet Test of
sphericity
• ANOVA test
Analytical Model
Y= a + ß 2 x2+ e
Where
a =constant
ß2=Regression
coeficients
x2= corporate
vision
Reject Ho2 if
p- values
<0.05
otherwise
fail to reject
if p < 0.05
3. To establish the
effects of cost
leadership
strategy on the
growth of Micro
Finance
Institutions in
Kenya
H03
HA3
Cost leadership
strategy has no
significant effect
on the growth of
Micro Finance
Institutions in
Kenya.
Cost leadership
strategy has a
significant effect
on the growth of
Micro Finance
Institutions in
Kenya.
• Karl Pearson
correlation co
efficient Test
• χ2- Test
• Bartlett Test of
sphericity
• ANOVA test
Analytical
Model
Y= a + ß 3 x 3+e
Where
a= constant
x3=cost
leadership
ß 3, =
Regression
Coefficient
Reject Ho3
if P-values
< 0.05
otherwise
fail to reject
if p <0.05
•
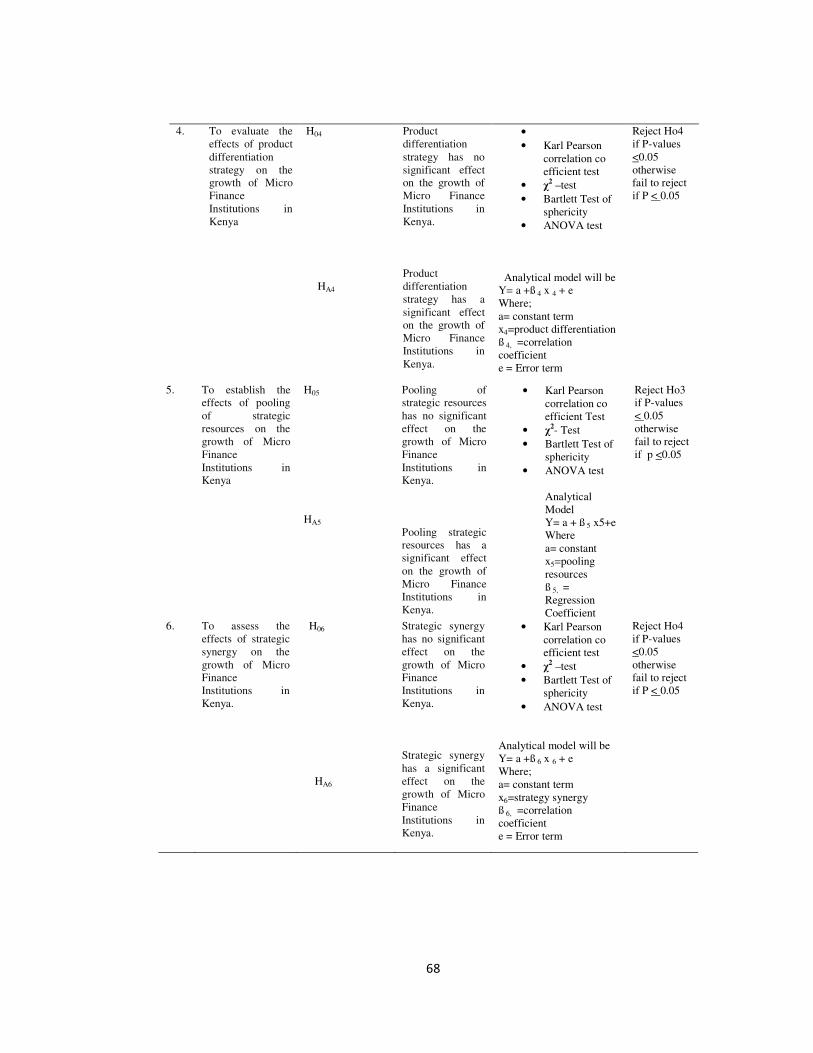
68
4. To evaluate the
effects of product
differentiation
strategy on the
growth of Micro
Finance
Institutions in
Kenya
H04
HA4
Product
differentiation
strategy has no
significant effect
on the growth of
Micro Finance
Institutions in
Kenya.
Product
differentiation
strategy has a
significant effect
on the growth of
Micro Finance
Institutions in
Kenya.
•
• Karl Pearson
correlation co
efficient test
• χ2 –test
• Bartlett Test of
sphericity
• ANOVA test
Analytical model will be
Y= a +ß 4 x 4 + e
Where;
a= constant term
x4=product differentiation
ß 4, =correlation
coefficient
e = Error term
Reject Ho4
if P-values
<0.05
otherwise
fail to reject
if P < 0.05
5. To establish the
effects of pooling
of strategic
resources on the
growth of Micro
Finance
Institutions in
Kenya
H05
HA5
Pooling of
strategic resources
has no significant
effect on the
growth of Micro
Finance
Institutions in
Kenya.
Pooling strategic
resources has a
significant effect
on the growth of
Micro Finance
Institutions in
Kenya.
• Karl Pearson
correlation co
efficient Test
• χ2- Test
• Bartlett Test of
sphericity
• ANOVA test
Analytical
Model
Y= a + ß 5 x5+e
Where
a= constant
x5=pooling
resources
ß 5, =
Regression
Coefficient
Reject Ho3
if P-values
< 0.05
otherwise
fail to reject
if p <0.05
6. To assess the
effects of strategic
synergy on the
growth of Micro
Finance
Institutions in
Kenya.
H06
HA6
Strategic synergy
has no significant
effect on the
growth of Micro
Finance
Institutions in
Kenya.
Strategic synergy
has a significant
effect on the
growth of Micro
Finance
Institutions in
Kenya.
• Karl Pearson
correlation co
efficient test
• χ2 –test
• Bartlett Test of
sphericity
• ANOVA test
Analytical model will be
Y= a +ß 6 x 6 + e
Where;
a= constant term
x6=strategy synergy
ß 6, =correlation
coefficient
e = Error term
Reject Ho4
if P-values
<0.05
otherwise
fail to reject
if P < 0.05

69
CHAPTER FOUR
RESEARCH RESULTS AND FINDINGS
4.1 Introduction
In this chapter, data from the questionnaires was analyzed and interpreted. Various
tests were used to test the relationship between variables, levels of significance,
reliability and demographic data analysis. Specifically, the study used Cronbach's
alpha test, descriptive statistics tests, KMO and Bertllets test, K test, χ2 -test, Pearson
correlation, ANOVA and multiple Regression analysis.
4.2 Response Rate
Out of the 160 questionnaires administered, 114 were filled and returned, which
represents 71.25% response rate as shown in table 4.1.
Table 4.1: Response Rate
Education Level Frequency Percent
Responded 114 71.25
Non Response 46 28.75
Totals 160 100.0
This response rate was considered satisfactory to make conclusions for the study.
Creswell, (2013) observed that a 50% response rate is adequate, 60% and above
good, while 70% rate is very good. The recorded high response rate can be attributed
to the data collection procedures, where the study pre-notified the potential
respondents (managers, assistant managers, chief executive officers and others) of
the intended study, and utilized a self-administered questionnaire where the
respondent’s queries were addressed immediately. Further, a research permit from
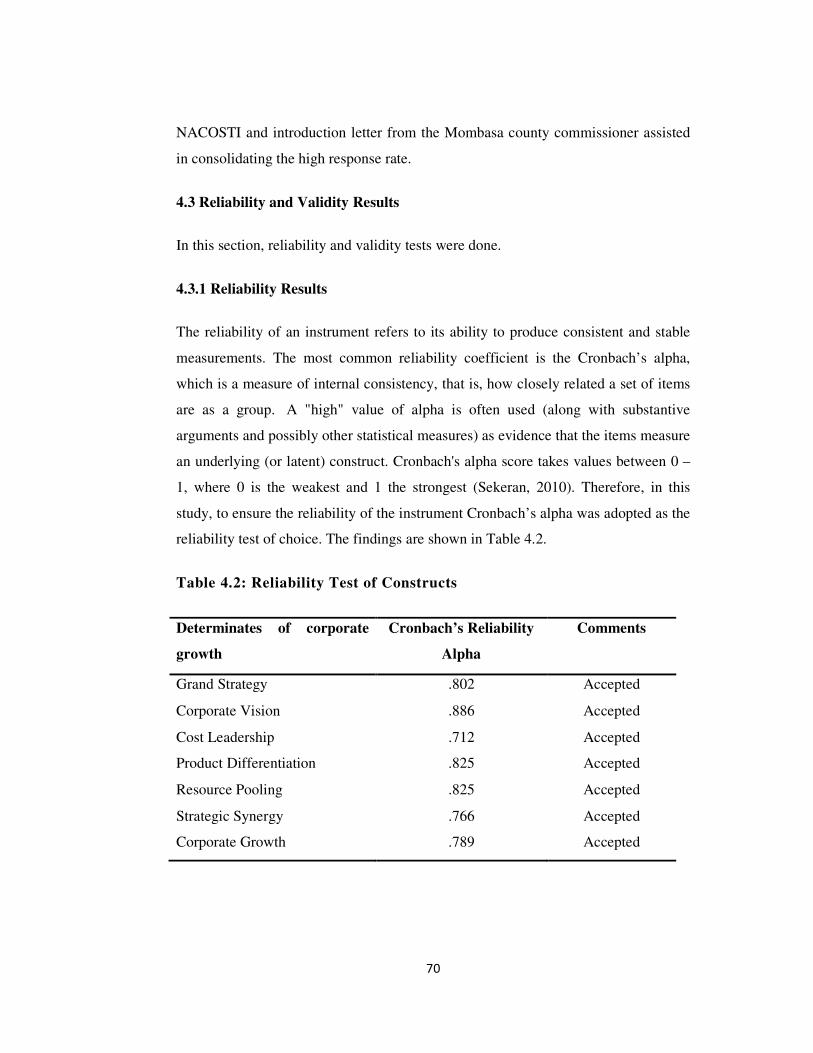
70
NACOSTI and introduction letter from the Mombasa county commissioner assisted
in consolidating the high response rate.
4.3 Reliability and Validity Results
In this section, reliability and validity tests were done.
4.3.1 Reliability Results
The reliability of an instrument refers to its ability to produce consistent and stable
measurements. The most common reliability coefficient is the Cronbach’s alpha,
which is a measure of internal consistency, that is, how closely related a set of items
are as a group. A "high" value of alpha is often used (along with substantive
arguments and possibly other statistical measures) as evidence that the items measure
an underlying (or latent) construct. Cronbach's alpha score takes values between 0 –
1, where 0 is the weakest and 1 the strongest (Sekeran, 2010). Therefore, in this
study, to ensure the reliability of the instrument Cronbach’s alpha was adopted as the
reliability test of choice. The findings are shown in Table 4.2.
Table 4.2: Reliability Test of Constructs
Determinates of corporate
growth
Cronbach’s Reliability
Alpha
Comments
Grand Strategy .802 Accepted
Corporate Vision .886 Accepted
Cost Leadership .712 Accepted
Product Differentiation .825 Accepted
Resource Pooling .825 Accepted
Strategic Synergy .766 Accepted
Corporate Growth .789 Accepted
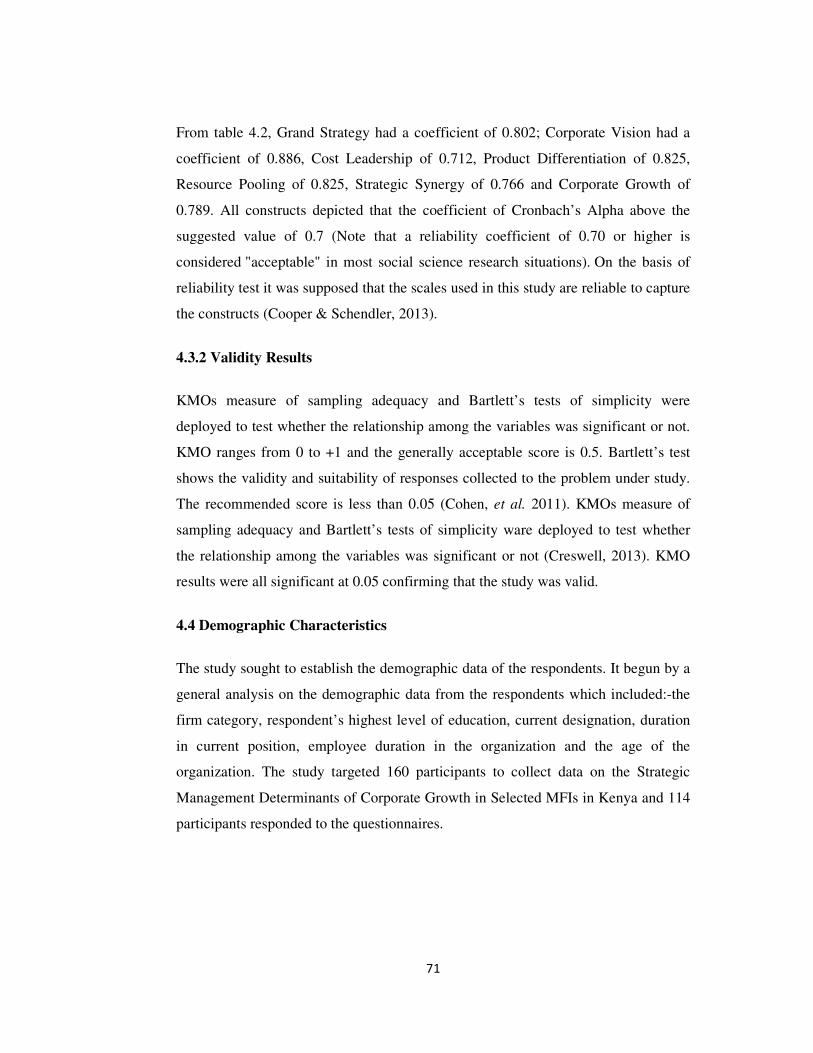
71
From table 4.2, Grand Strategy had a coefficient of 0.802; Corporate Vision had a
coefficient of 0.886, Cost Leadership of 0.712, Product Differentiation of 0.825,
Resource Pooling of 0.825, Strategic Synergy of 0.766 and Corporate Growth of
0.789. All constructs depicted that the coefficient of Cronbach’s Alpha above the
suggested value of 0.7 (Note that a reliability coefficient of 0.70 or higher is
considered "acceptable" in most social science research situations). On the basis of
reliability test it was supposed that the scales used in this study are reliable to capture
the constructs (Cooper & Schendler, 2013).
4.3.2 Validity Results
KMOs measure of sampling adequacy and Bartlett’s tests of simplicity were
deployed to test whether the relationship among the variables was significant or not.
KMO ranges from 0 to +1 and the generally acceptable score is 0.5. Bartlett’s test
shows the validity and suitability of responses collected to the problem under study.
The recommended score is less than 0.05 (Cohen, et al. 2011). KMOs measure of
sampling adequacy and Bartlett’s tests of simplicity ware deployed to test whether
the relationship among the variables was significant or not (Creswell, 2013). KMO
results were all significant at 0.05 confirming that the study was valid.
4.4 Demographic Characteristics
The study sought to establish the demographic data of the respondents. It begun by a
general analysis on the demographic data from the respondents which included:-the
firm category, respondent’s highest level of education, current designation, duration
in current position, employee duration in the organization and the age of the
organization. The study targeted 160 participants to collect data on the Strategic
Management Determinants of Corporate Growth in Selected MFIs in Kenya and 114
participants responded to the questionnaires.
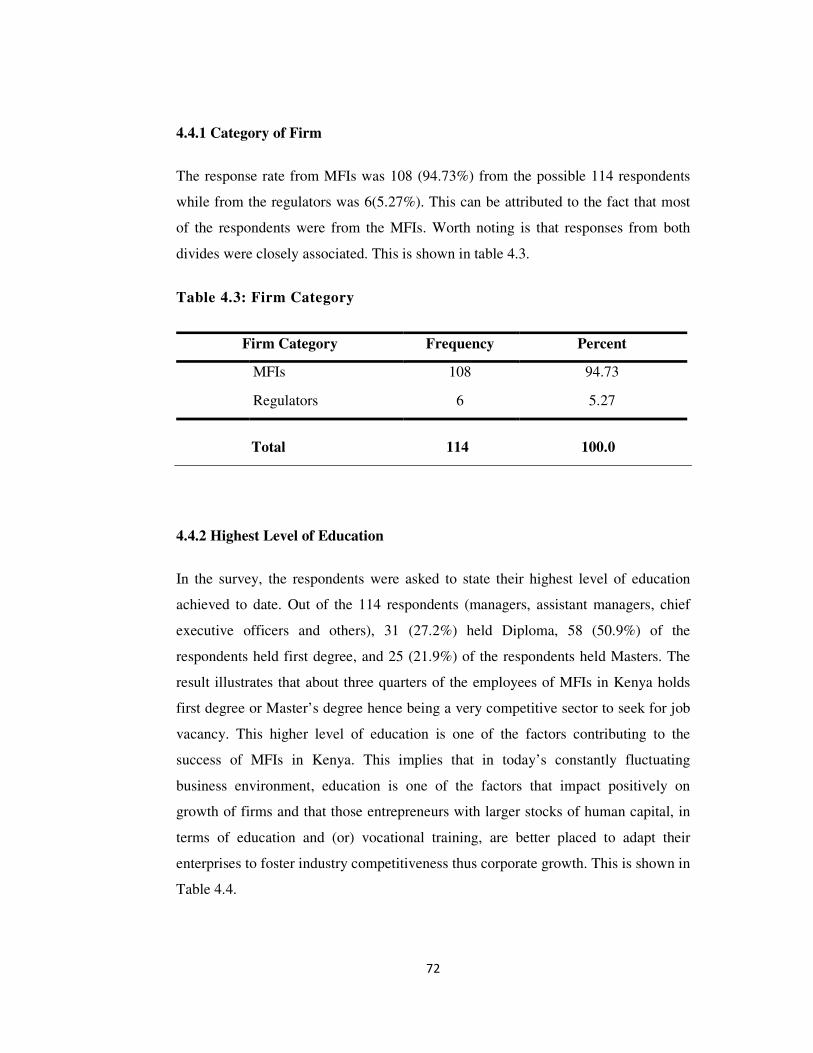
72
4.4.1 Category of Firm
The response rate from MFIs was 108 (94.73%) from the possible 114 respondents
while from the regulators was 6(5.27%). This can be attributed to the fact that most
of the respondents were from the MFIs. Worth noting is that responses from both
divides were closely associated. This is shown in table 4.3.
Table 4.3: Firm Category
Firm Category Frequency Percent
MFIs 108 94.73
Regulators 6 5.27
Total 114 100.0
4.4.2 Highest Level of Education
In the survey, the respondents were asked to state their highest level of education
achieved to date. Out of the 114 respondents (managers, assistant managers, chief
executive officers and others), 31 (27.2%) held Diploma, 58 (50.9%) of the
respondents held first degree, and 25 (21.9%) of the respondents held Masters. The
result illustrates that about three quarters of the employees of MFIs in Kenya holds
first degree or Master’s degree hence being a very competitive sector to seek for job
vacancy. This higher level of education is one of the factors contributing to the
success of MFIs in Kenya. This implies that in today’s constantly fluctuating
business environment, education is one of the factors that impact positively on
growth of firms and that those entrepreneurs with larger stocks of human capital, in
terms of education and (or) vocational training, are better placed to adapt their
enterprises to foster industry competitiveness thus corporate growth. This is shown in
Table 4.4.
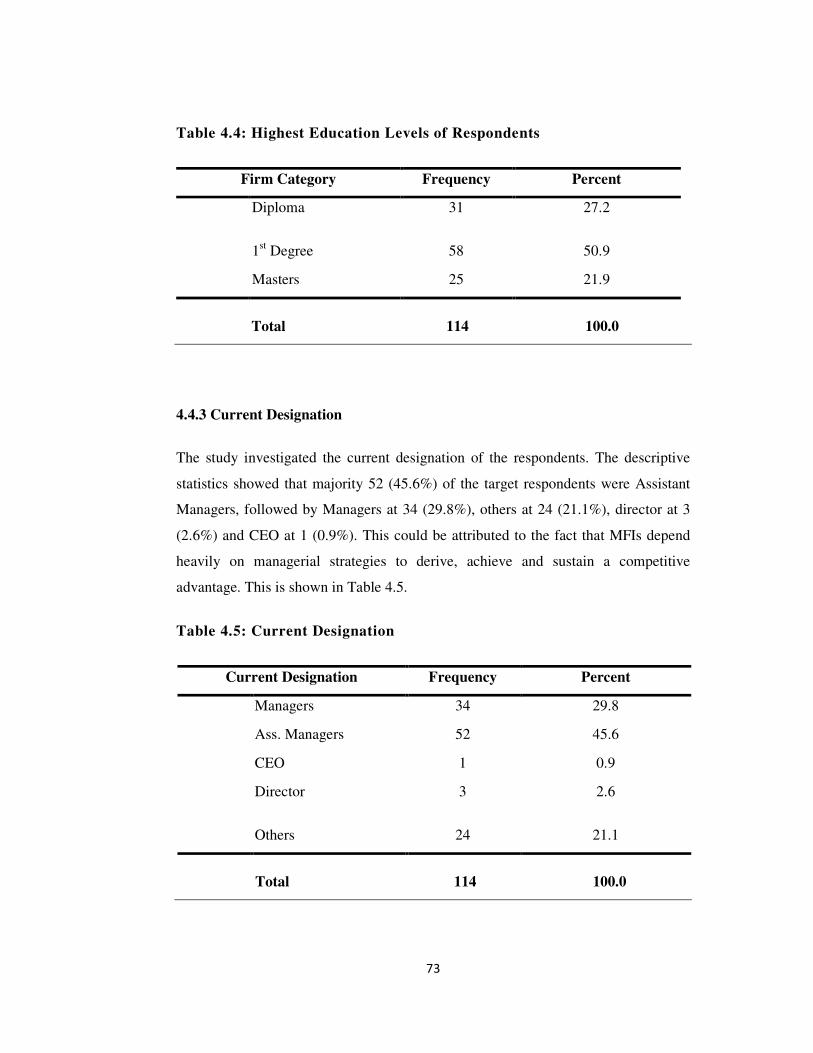
73
Table 4.4: Highest Education Levels of Respondents
Firm Category Frequency Percent
Diploma
1st Degree
31
58
27.2
50.9
Masters 25 21.9
Total 114 100.0
4.4.3 Current Designation
The study investigated the current designation of the respondents. The descriptive
statistics showed that majority 52 (45.6%) of the target respondents were Assistant
Managers, followed by Managers at 34 (29.8%), others at 24 (21.1%), director at 3
(2.6%) and CEO at 1 (0.9%). This could be attributed to the fact that MFIs depend
heavily on managerial strategies to derive, achieve and sustain a competitive
advantage. This is shown in Table 4.5.
Table 4.5: Current Designation
Current Designation Frequency Percent
Managers 34 29.8
Ass. Managers 52 45.6
CEO 1 0.9
Director
Others
3
24
2.6
21.1
Total 114 100.0

74
4.4.4 Duration in Current Designation
The descriptive statistics generated showed that fifty eight (50.9%) of the
respondents indicated that they have stayed in current designation position between 0
– 5 years, fifty one (44.7 %) between 5 – 10 years and only five (4.4%) over 10
years. The findings indicate that, less than 5% of the respondents will hold current
designation position for over 10 years. This infers that, majority of the respondents
will change designation position in less than 10 years of serving a particular position.
This implies that employee retention rate is moderate. A high retention rate would be
most appropriate for firms in such a competitive environment. This is shown in Table
4.6.
Table 4.6: Duration in Current Designation
Duration Frequency Percent
0-5
5-10
58
51
50.09
44.7
Over 10 5 4.4
Total 114 100.0
4.4.5 Employee Duration in Organization
The study sampled 114 respondents, and evaluated the employee’s duration in the
organization, where the findings showed that, 25 (21.9%) of the respondents are
employed for less than 5 years, 62 (54.4%) between 5 – 10 years and 27 (23.7%) for
over 10 years. The inferential statistics indicate that, 87 (76.3%) of the respondents
are retained in the organization for more than 5 years. Therefore, it can be deducted
that, more than three quarters of the employees of MFIs in Kenya are retained for
less than ten years. A high retention rate would be most appropriate for firms in such
a competitive environment. This is shown in Table 4.7.
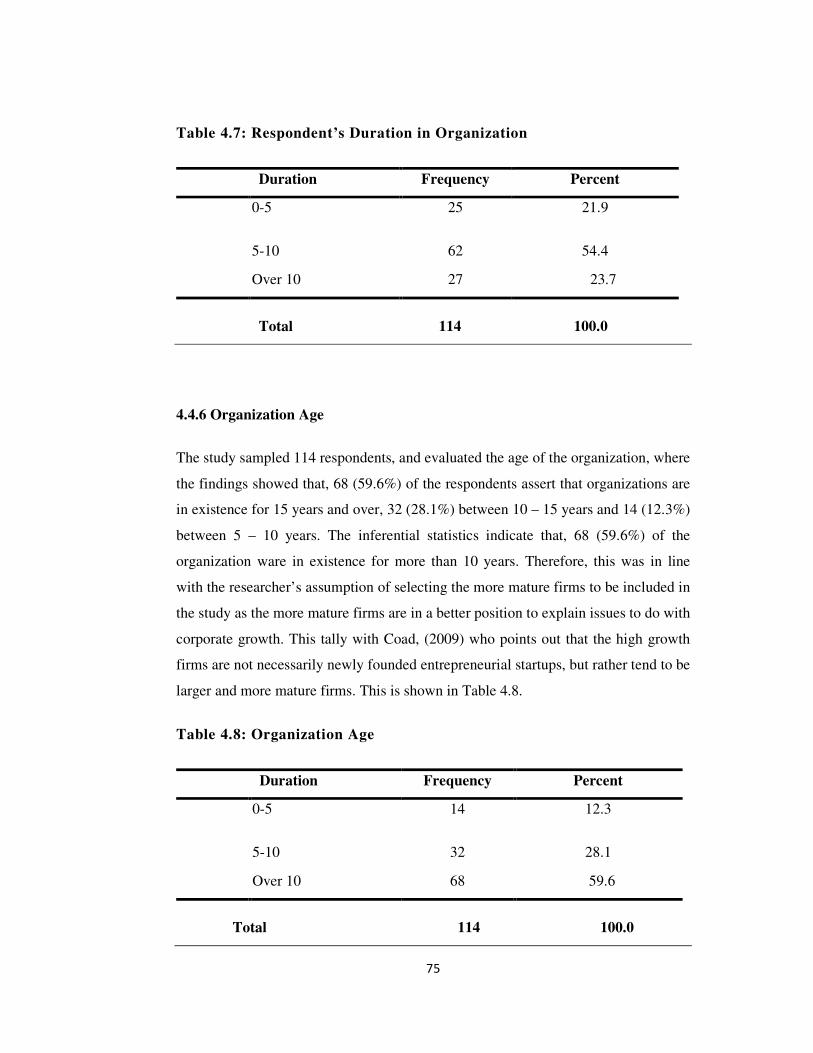
75
Table 4.7: Respondent’s Duration in Organization
Duration Frequency Percent
0-5
5-10
25
62
21.9
54.4
Over 10 27 23.7
Total 114 100.0
4.4.6 Organization Age
The study sampled 114 respondents, and evaluated the age of the organization, where
the findings showed that, 68 (59.6%) of the respondents assert that organizations are
in existence for 15 years and over, 32 (28.1%) between 10 – 15 years and 14 (12.3%)
between 5 – 10 years. The inferential statistics indicate that, 68 (59.6%) of the
organization ware in existence for more than 10 years. Therefore, this was in line
with the researcher’s assumption of selecting the more mature firms to be included in
the study as the more mature firms are in a better position to explain issues to do with
corporate growth. This tally with Coad, (2009) who points out that the high growth
firms are not necessarily newly founded entrepreneurial startups, but rather tend to be
larger and more mature firms. This is shown in Table 4.8.
Table 4.8: Organization Age
Duration Frequency Percent
0-5
5-10
14
32
12.3
28.1
Over 10 68 59.6
Total 114 100.0
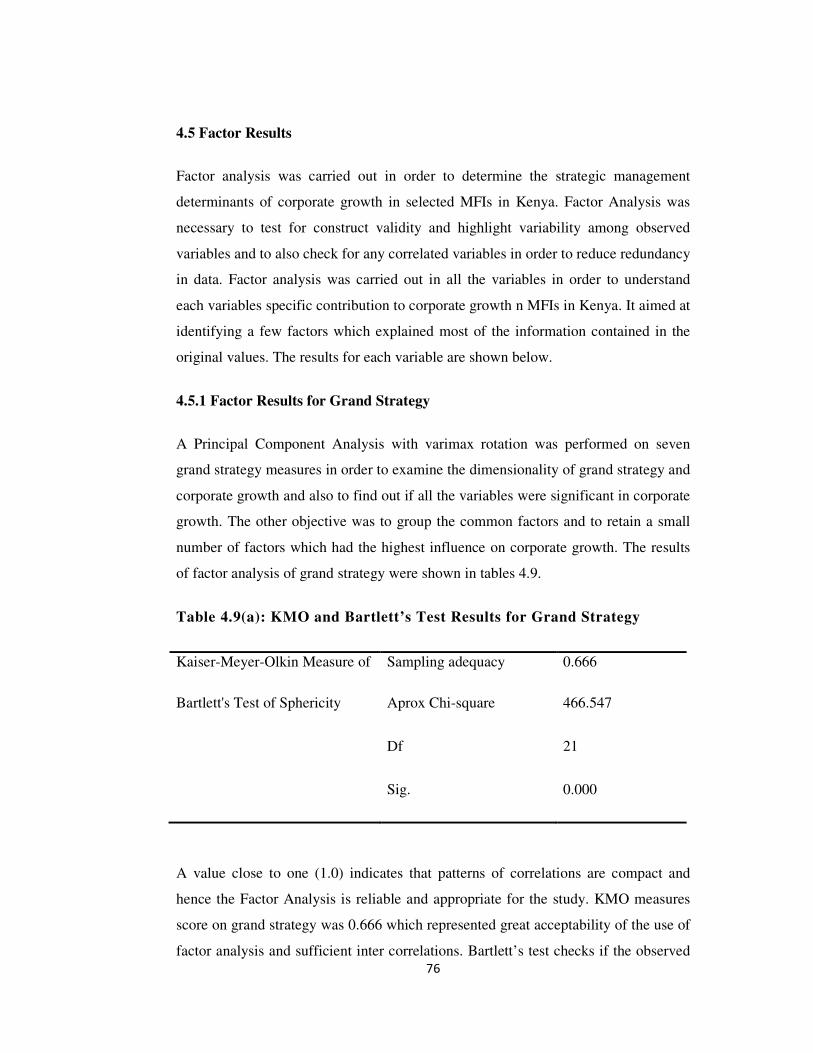
76
4.5 Factor Results
Factor analysis was carried out in order to determine the strategic management
determinants of corporate growth in selected MFIs in Kenya. Factor Analysis was
necessary to test for construct validity and highlight variability among observed
variables and to also check for any correlated variables in order to reduce redundancy
in data. Factor analysis was carried out in all the variables in order to understand
each variables specific contribution to corporate growth n MFIs in Kenya. It aimed at
identifying a few factors which explained most of the information contained in the
original values. The results for each variable are shown below.
4.5.1 Factor Results for Grand Strategy
A Principal Component Analysis with varimax rotation was performed on seven
grand strategy measures in order to examine the dimensionality of grand strategy and
corporate growth and also to find out if all the variables were significant in corporate
growth. The other objective was to group the common factors and to retain a small
number of factors which had the highest influence on corporate growth. The results
of factor analysis of grand strategy were shown in tables 4.9.
Table 4.9(a): KMO and Bartlett’s Test Results for Grand Strategy
Kaiser-Meyer-Olkin Measure of Sampling adequacy 0.666
Bartlett's Test of Sphericity Aprox Chi-square
Df
Sig.
466.547
21
0.000
A value close to one (1.0) indicates that patterns of correlations are compact and
hence the Factor Analysis is reliable and appropriate for the study. KMO measures
score on grand strategy was 0.666 which represented great acceptability of the use of
factor analysis and sufficient inter correlations. Bartlett’s test checks if the observed
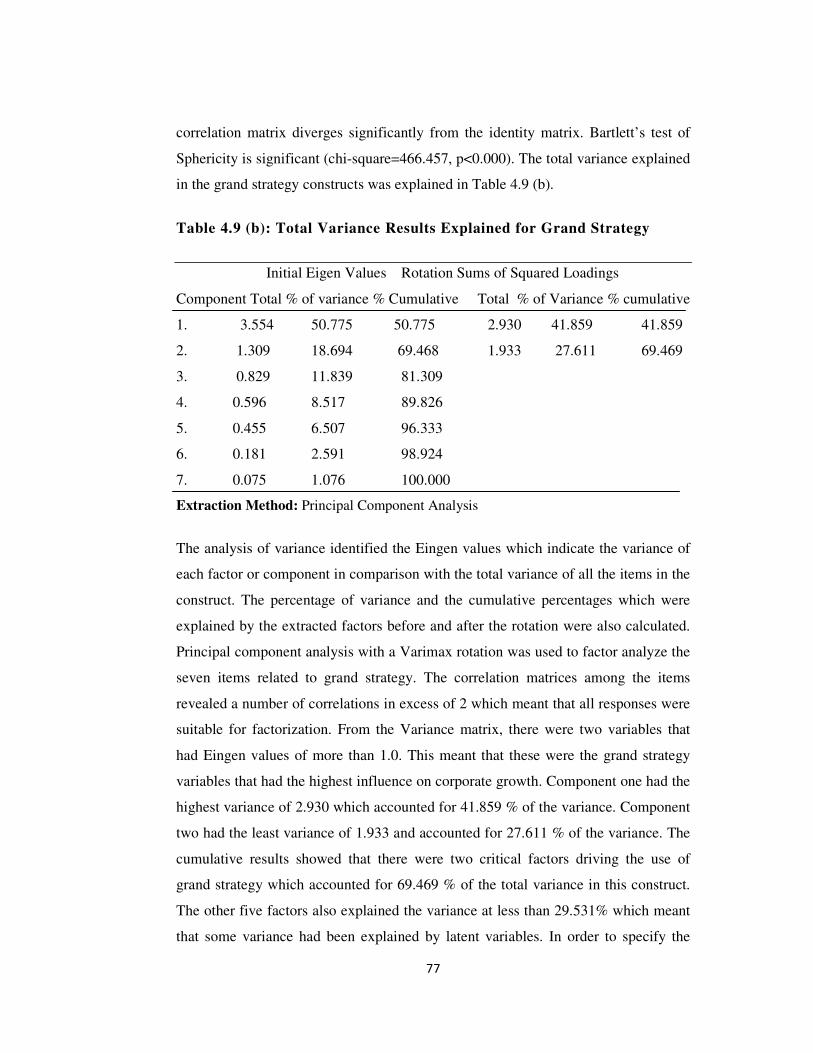
77
correlation matrix diverges significantly from the identity matrix. Bartlett’s test of
Sphericity is significant (chi-square=466.457, p<0.000). The total variance explained
in the grand strategy constructs was explained in Table 4.9 (b).
Table 4.9 (b): Total Variance Results Explained for Grand Strategy
Initial Eigen Values Rotation Sums of Squared Loadings
Component Total % of variance % Cumulative Total % of Variance % cumulative
1. 3.554 50.775 50.775 2.930 41.859 41.859
2. 1.309 18.694 69.468 1.933 27.611 69.469
3. 0.829 11.839 81.309
4. 0.596 8.517 89.826
5. 0.455 6.507 96.333
6. 0.181 2.591 98.924
7. 0.075 1.076 100.000
Extraction Method: Principal Component Analysis
The analysis of variance identified the Eingen values which indicate the variance of
each factor or component in comparison with the total variance of all the items in the
construct. The percentage of variance and the cumulative percentages which were
explained by the extracted factors before and after the rotation were also calculated.
Principal component analysis with a Varimax rotation was used to factor analyze the
seven items related to grand strategy. The correlation matrices among the items
revealed a number of correlations in excess of 2 which meant that all responses were
suitable for factorization. From the Variance matrix, there were two variables that
had Eingen values of more than 1.0. This meant that these were the grand strategy
variables that had the highest influence on corporate growth. Component one had the
highest variance of 2.930 which accounted for 41.859 % of the variance. Component
two had the least variance of 1.933 and accounted for 27.611 % of the variance. The
cumulative results showed that there were two critical factors driving the use of
grand strategy which accounted for 69.469 % of the total variance in this construct.
The other five factors also explained the variance at less than 29.531% which meant
that some variance had been explained by latent variables. In order to specify the

78
number of factors that were influencing grand strategy and evaluate what variables to
retain, factor loadings were taken into account and the minimum factor loadings of
0.664 were considered to be moderately high. The factors affecting every one
variable were all loaded up together and given a name so that the factors were
reduced to a minimum of two. The researcher, however chose to delete one variable
(presence of grand strategy) in grand strategy which did not relate to either factor 1
or 2 in order to continue working out for further relationships as shown in Table 4.9
(c).
Table 4.9(c): Rotated Component Matrix for Grand Strategy
Grand Strategy Measures Component
1 2
Communication of grand strategy 0.863
Institutionalization of grand strategy 0.827
Continuously monitoring of grand strategy 0.945
Techniques and tactics of grand strategy 0.893
Strategic decisions and choices 0.664
Effectiveness of grand strategy 0.765
Extraction Method: Principal Component Analysis. Rotation Method: Varimax
with Kaiser Normalization. a Rotation converged in 3 iterations
From the rotation matrix in Table 4.9(c) a two factor solution was obtained
explaining 69.469 % of the total variance in grand strategy. These two factors were
grouped as GS1 and GS2. GS1 had four items namely; communication of grand
strategy, continuous monitoring of grand strategy, techniques and tactics of grand
strategy and strategic decisions and choices. This factor was named monitoring of
grand strategy. GS2 had two items namely; institutionalization of grand strategy and
effectiveness of grand strategy and this factor was named institutionalization of
grand strategy. The results meant that the six constructs in grand strategy were
correlated to the two factors or they could be grouped into two. Using the two
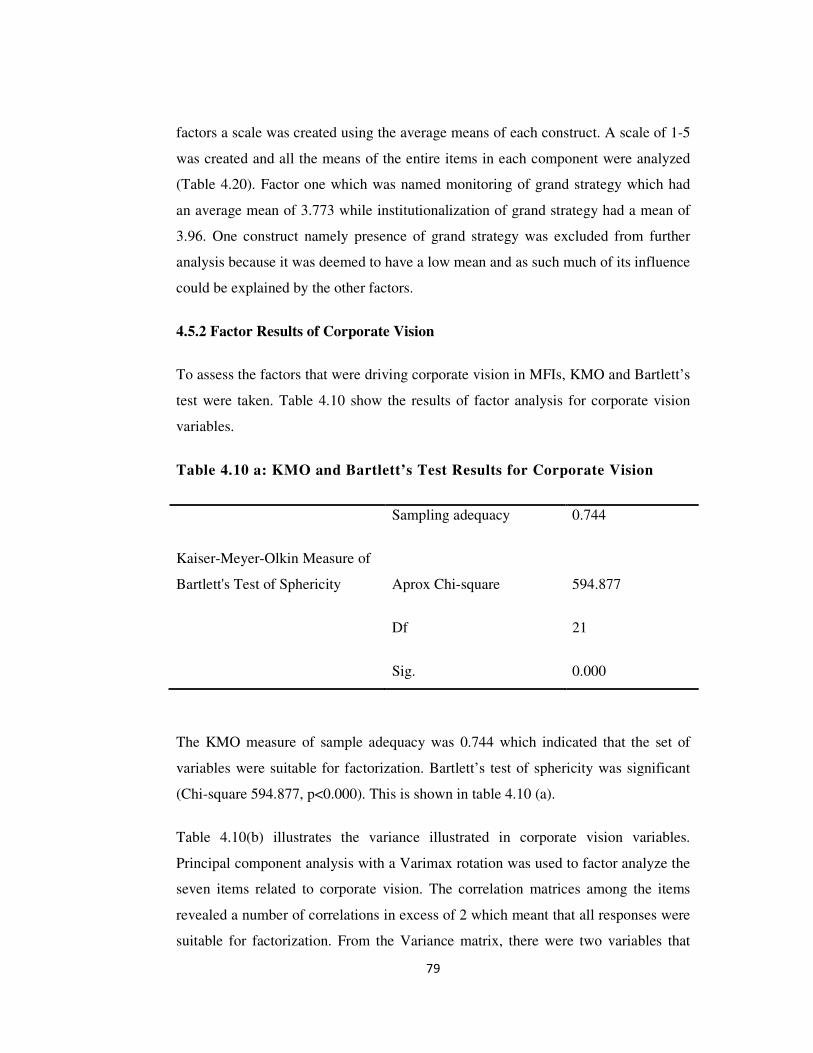
79
factors a scale was created using the average means of each construct. A scale of 1-5
was created and all the means of the entire items in each component were analyzed
(Table 4.20). Factor one which was named monitoring of grand strategy which had
an average mean of 3.773 while institutionalization of grand strategy had a mean of
3.96. One construct namely presence of grand strategy was excluded from further
analysis because it was deemed to have a low mean and as such much of its influence
could be explained by the other factors.
4.5.2 Factor Results of Corporate Vision
To assess the factors that were driving corporate vision in MFIs, KMO and Bartlett’s
test were taken. Table 4.10 show the results of factor analysis for corporate vision
variables.
Table 4.10 a: KMO and Bartlett’s Test Results for Corporate Vision
Kaiser-Meyer-Olkin Measure of
Sampling adequacy 0.744
Bartlett's Test of Sphericity Aprox Chi-square
Df
Sig.
594.877
21
0.000
The KMO measure of sample adequacy was 0.744 which indicated that the set of
variables were suitable for factorization. Bartlett’s test of sphericity was significant
(Chi-square 594.877, p<0.000). This is shown in table 4.10 (a).
Table 4.10(b) illustrates the variance illustrated in corporate vision variables.
Principal component analysis with a Varimax rotation was used to factor analyze the
seven items related to corporate vision. The correlation matrices among the items
revealed a number of correlations in excess of 2 which meant that all responses were
suitable for factorization. From the Variance matrix, there were two variables that
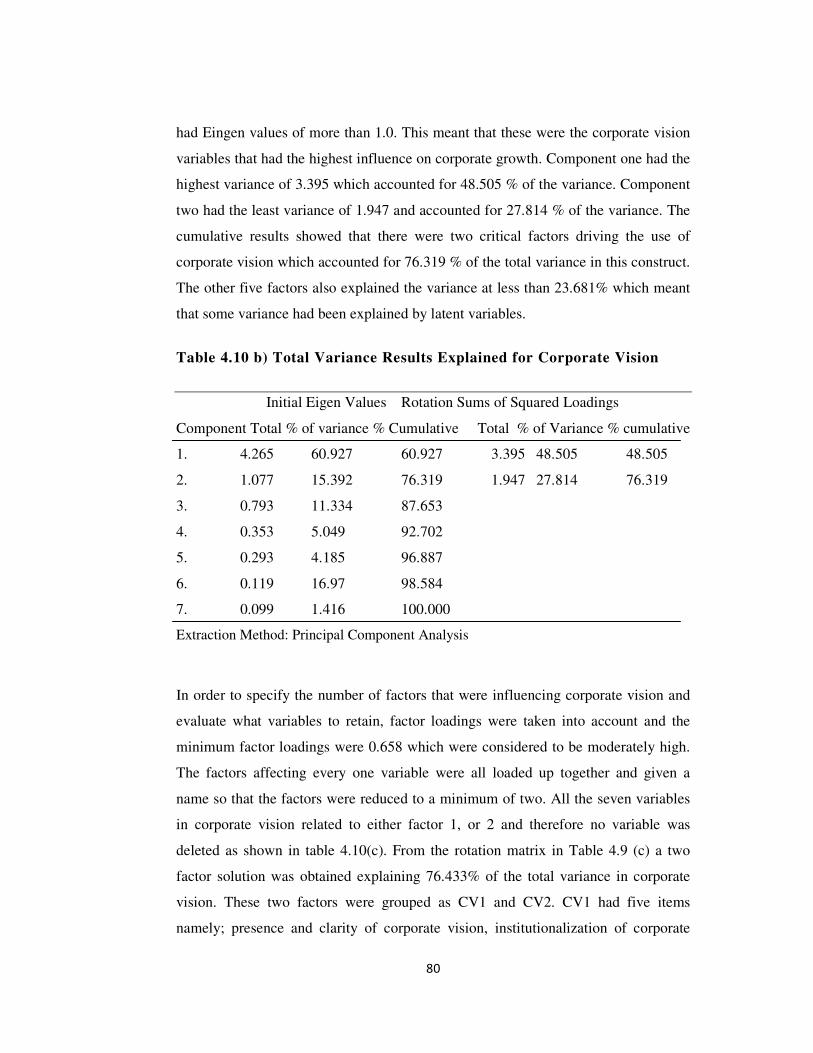
80
had Eingen values of more than 1.0. This meant that these were the corporate vision
variables that had the highest influence on corporate growth. Component one had the
highest variance of 3.395 which accounted for 48.505 % of the variance. Component
two had the least variance of 1.947 and accounted for 27.814 % of the variance. The
cumulative results showed that there were two critical factors driving the use of
corporate vision which accounted for 76.319 % of the total variance in this construct.
The other five factors also explained the variance at less than 23.681% which meant
that some variance had been explained by latent variables.
Table 4.10 b) Total Variance Results Explained for Corporate Vision
Initial Eigen Values Rotation Sums of Squared Loadings
Component Total % of variance % Cumulative Total % of Variance % cumulative
1. 4.265 60.927 60.927 3.395 48.505 48.505
2. 1.077 15.392 76.319 1.947 27.814 76.319
3. 0.793 11.334 87.653
4. 0.353 5.049 92.702
5. 0.293 4.185 96.887
6. 0.119 16.97 98.584
7. 0.099 1.416 100.000
Extraction Method: Principal Component Analysis
In order to specify the number of factors that were influencing corporate vision and
evaluate what variables to retain, factor loadings were taken into account and the
minimum factor loadings were 0.658 which were considered to be moderately high.
The factors affecting every one variable were all loaded up together and given a
name so that the factors were reduced to a minimum of two. All the seven variables
in corporate vision related to either factor 1, or 2 and therefore no variable was
deleted as shown in table 4.10(c). From the rotation matrix in Table 4.9 (c) a two
factor solution was obtained explaining 76.433% of the total variance in corporate
vision. These two factors were grouped as CV1 and CV2. CV1 had five items
namely; presence and clarity of corporate vision, institutionalization of corporate
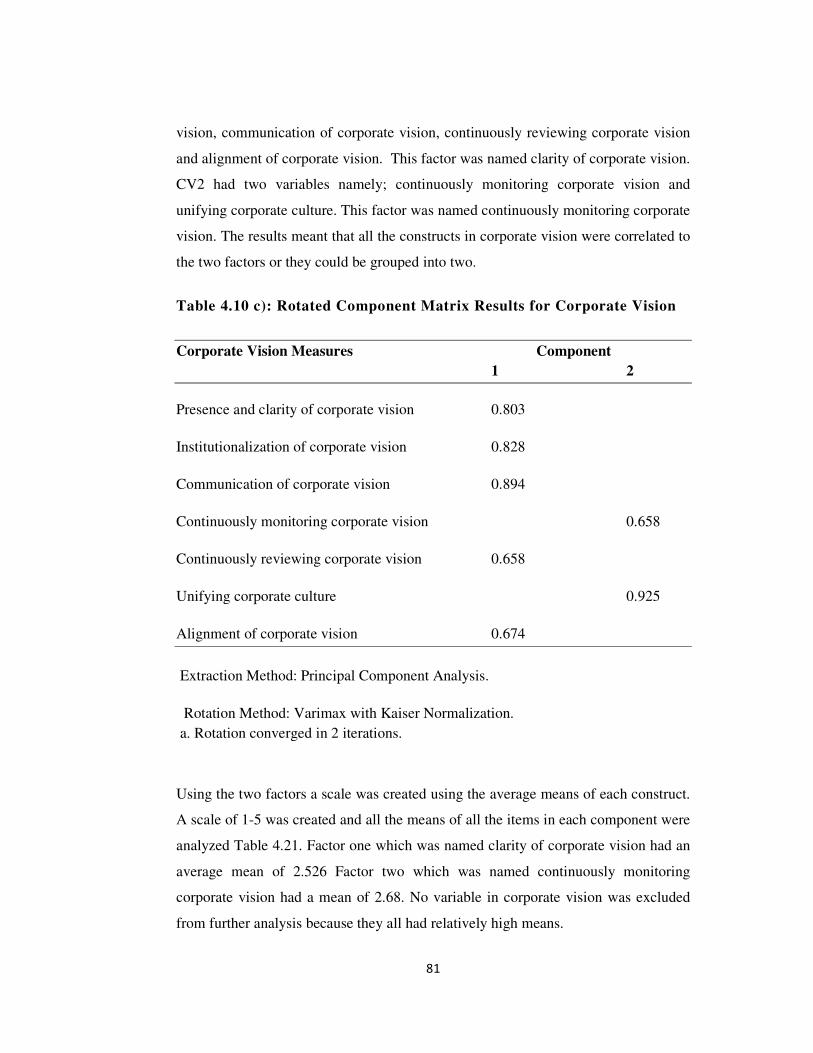
81
vision, communication of corporate vision, continuously reviewing corporate vision
and alignment of corporate vision. This factor was named clarity of corporate vision.
CV2 had two variables namely; continuously monitoring corporate vision and
unifying corporate culture. This factor was named continuously monitoring corporate
vision. The results meant that all the constructs in corporate vision were correlated to
the two factors or they could be grouped into two.
Table 4.10 c): Rotated Component Matrix Results for Corporate Vision
Corporate Vision Measures Component
1 2
Presence and clarity of corporate vision 0.803
Institutionalization of corporate vision 0.828
Communication of corporate vision 0.894
Continuously monitoring corporate vision 0.658
Continuously reviewing corporate vision 0.658
Unifying corporate culture 0.925
Alignment of corporate vision 0.674
Extraction Method: Principal Component Analysis.
Rotation Method: Varimax with Kaiser Normalization.
a. Rotation converged in 2 iterations.
Using the two factors a scale was created using the average means of each construct.
A scale of 1-5 was created and all the means of all the items in each component were
analyzed Table 4.21. Factor one which was named clarity of corporate vision had an
average mean of 2.526 Factor two which was named continuously monitoring
corporate vision had a mean of 2.68. No variable in corporate vision was excluded
from further analysis because they all had relatively high means.
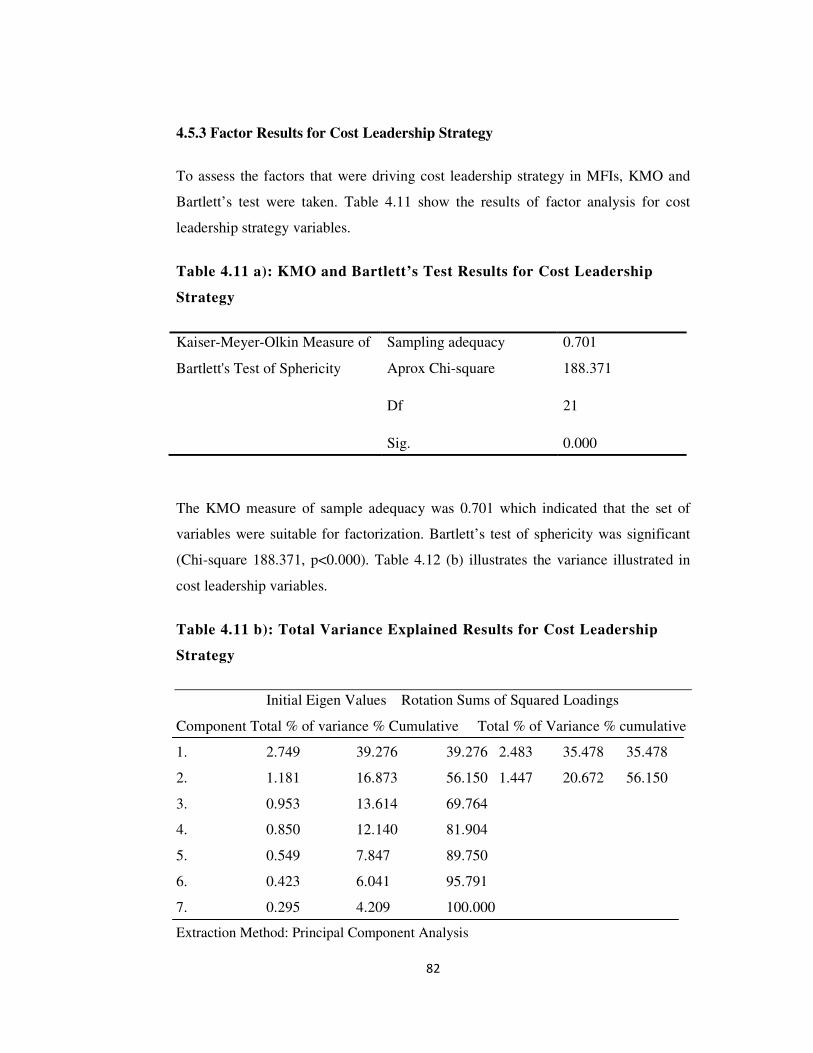
82
4.5.3 Factor Results for Cost Leadership Strategy
To assess the factors that were driving cost leadership strategy in MFIs, KMO and
Bartlett’s test were taken. Table 4.11 show the results of factor analysis for cost
leadership strategy variables.
Table 4.11 a): KMO and Bartlett’s Test Results for Cost Leadership
Strategy
Kaiser-Meyer-Olkin Measure of Sampling adequacy 0.701
Bartlett's Test of Sphericity Aprox Chi-square
Df
Sig.
188.371
21
0.000
The KMO measure of sample adequacy was 0.701 which indicated that the set of
variables were suitable for factorization. Bartlett’s test of sphericity was significant
(Chi-square 188.371, p<0.000). Table 4.12 (b) illustrates the variance illustrated in
cost leadership variables.
Table 4.11 b): Total Variance Explained Results for Cost Leadership
Strategy
Initial Eigen Values Rotation Sums of Squared Loadings
Component Total % of variance % Cumulative Total % of Variance % cumulative
1. 2.749 39.276 39.276 2.483 35.478 35.478
2. 1.181 16.873 56.150 1.447 20.672 56.150
3. 0.953 13.614 69.764
4. 0.850 12.140 81.904
5. 0.549 7.847 89.750
6. 0.423 6.041 95.791
7. 0.295 4.209 100.000
Extraction Method: Principal Component Analysis
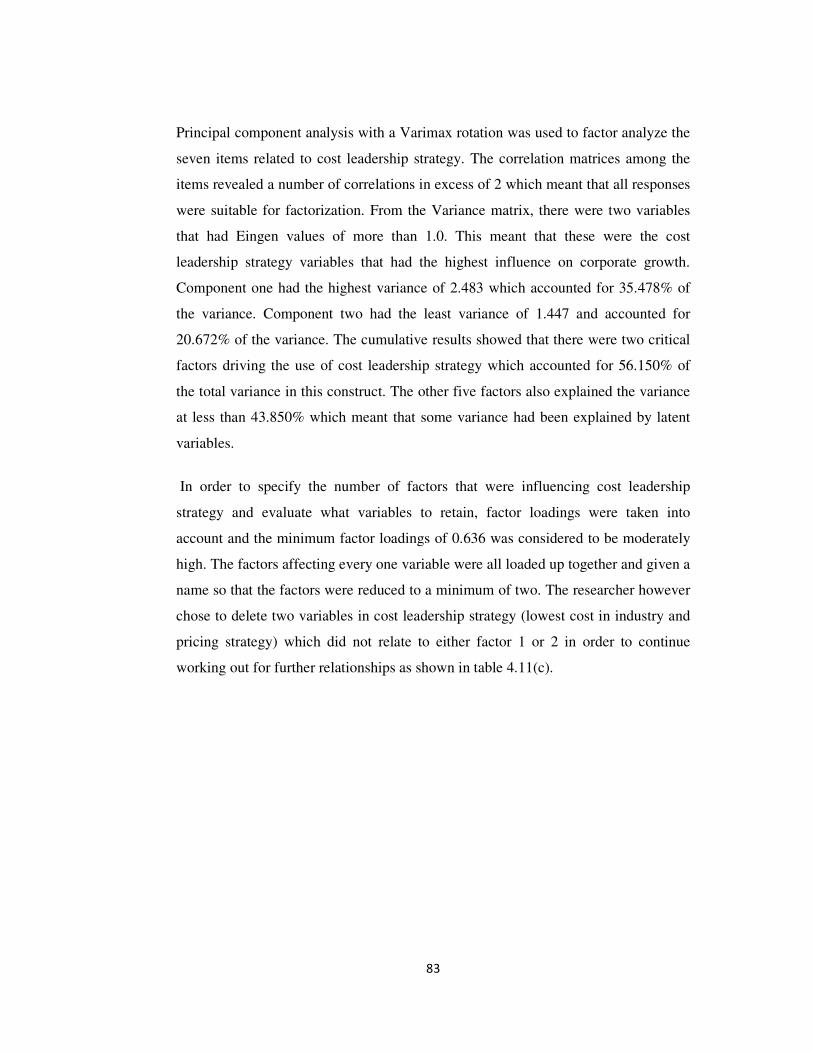
83
Principal component analysis with a Varimax rotation was used to factor analyze the
seven items related to cost leadership strategy. The correlation matrices among the
items revealed a number of correlations in excess of 2 which meant that all responses
were suitable for factorization. From the Variance matrix, there were two variables
that had Eingen values of more than 1.0. This meant that these were the cost
leadership strategy variables that had the highest influence on corporate growth.
Component one had the highest variance of 2.483 which accounted for 35.478% of
the variance. Component two had the least variance of 1.447 and accounted for
20.672% of the variance. The cumulative results showed that there were two critical
factors driving the use of cost leadership strategy which accounted for 56.150% of
the total variance in this construct. The other five factors also explained the variance
at less than 43.850% which meant that some variance had been explained by latent
variables.
In order to specify the number of factors that were influencing cost leadership
strategy and evaluate what variables to retain, factor loadings were taken into
account and the minimum factor loadings of 0.636 was considered to be moderately
high. The factors affecting every one variable were all loaded up together and given a
name so that the factors were reduced to a minimum of two. The researcher however
chose to delete two variables in cost leadership strategy (lowest cost in industry and
pricing strategy) which did not relate to either factor 1 or 2 in order to continue
working out for further relationships as shown in table 4.11(c).
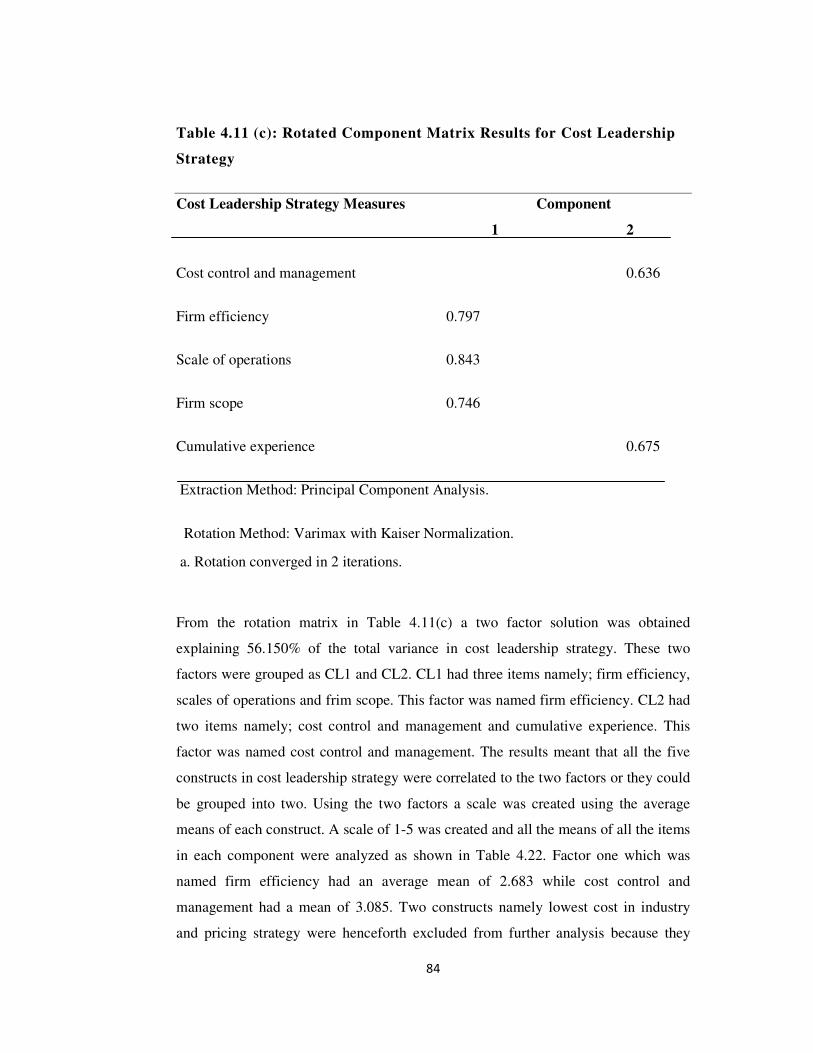
84
Table 4.11 (c): Rotated Component Matrix Results for Cost Leadership
Strategy
Cost Leadership Strategy Measures Component
1 2
Cost control and management 0.636
Firm efficiency 0.797
Scale of operations 0.843
Firm scope 0.746
Cumulative experience 0.675
Extraction Method: Principal Component Analysis.
Rotation Method: Varimax with Kaiser Normalization.
a. Rotation converged in 2 iterations.
From the rotation matrix in Table 4.11(c) a two factor solution was obtained
explaining 56.150% of the total variance in cost leadership strategy. These two
factors were grouped as CL1 and CL2. CL1 had three items namely; firm efficiency,
scales of operations and frim scope. This factor was named firm efficiency. CL2 had
two items namely; cost control and management and cumulative experience. This
factor was named cost control and management. The results meant that all the five
constructs in cost leadership strategy were correlated to the two factors or they could
be grouped into two. Using the two factors a scale was created using the average
means of each construct. A scale of 1-5 was created and all the means of all the items
in each component were analyzed as shown in Table 4.22. Factor one which was
named firm efficiency had an average mean of 2.683 while cost control and
management had a mean of 3.085. Two constructs namely lowest cost in industry
and pricing strategy were henceforth excluded from further analysis because they

85
were deemed to have low means and as such much of their influence could be
explained by the other factors.
4.5.4 Factor Results for Differentiation Strategy
This study sought to establish the effects of differentiation strategy in corporate
growth. Factor analysis was done on the differentiation strategy measures to check
for any factors that were not key to the study, to validate the responses and also to
check for consistency. The results of the factor analysis were shown in tables 4.12.
Table 4.12 a: KMO and Bartlett’s Test Results for Differentiation
Strategy
Kaiser-Meyer-Olkin Measure of Sampling adequacy 0.745
Bartlett's Test of Sphericity Aprox Chi-square
Df
Sig.
480.630
21
0.000
The KMO measure of sample adequacy was 0.745 which indicated that the set of
variables were suitable for factorization. Bartlett’s test of sphericity was significant
(Chi-square 480.630, p<0.000). Table 4.12 (b) illustrates the variance illustrated in
differentiation strategy variables.

86
Table 4.12 b: Total Variance Explained Results for Differentiation
Strategy
Initial Eigen Values Rotation Sums of Squared Loadings
Component Total % of variance % Cumulative Total % of Variance % cumulative
1. 3.788 54.110 54.110 3.469 49.553 49.553
2. 1.075 15.352 69.462 1.394 19.909 69.462
3. 0.807 11.530 80.993
4. 0.702 10.024 91.017
5. 0.382 5.452 96.469
6. 0.155 2.213 98.682
7. 0.092 1.318 100.000
Extraction Method: Principal Component Analysis
Principal component analysis with a Varimax rotation was used to factor analyze the
seven items related to differentiation strategy. The correlation matrices among the
items revealed a number of correlations in excess of 2 which meant that all responses
were suitable for factorization. From the Variance matrix, there were two variables
that had Eingen values of more than 1.0. This meant that these were the
differentiation strategy variables that had the highest influence on corporate growth.
Component one had the highest variance of 3.469 which accounted for 49.553% of
the variance. Component two had the least variance of 1.394 and accounted for
19.909% of the variance. The cumulative results showed that there were two critical
factors driving the use of differentiation strategy which accounted for 69.462% of the
total variance in this construct. The other five factors also explained the variance at
less than 30.538% which meant that some variance had been explained by latent
variables.
In order to specify the number of factors that were influencing differentiation
strategy and evaluate what variables to retain, factor loadings were taken into
account and the minimum factor loadings were 0.646 which were considered to be

87
moderately high. The factors affecting every one variable were all loaded up together
and given a name so that the factors were reduced to a minimum of two. All the
seven variables in differentiation strategy related to either factor 1 or 2 and were all
retained for further analysis as shown in Table 4.12 (c).
Table 4.12 c) Rotated Component Matrix Results for Differentiation Strategy
Differentiation Strategy Measures Component
1 2
Wide branch network 0.740
Grace payment period 0.646
Customer service 0.772
Mobile phone repayments 0.849
Brand image 0.873
Product innovation 0.652
Service differentiation 0.936
Extraction Method: Principal Component Analysis.
Rotation Method: Varimax with Kaiser Normalization.
a. Rotation converged in 3 iterations.
From the rotation matrix in Table 4.12 (c) a two factor solution was obtained
explaining 69.462% of the total variance in differentiation strategy. These two
factors were grouped as DS1 and DS2. DS1 had six items namely; wide branch
network, grace payment period, customer service, mobile phone repayments, brand
image and product innovation. This factor was named customer service. DS2 had
only one item namely; service differentiation. This factor was named service
differentiation. The results meant that all the constructs in product differentiation
strategy were correlated to the two factors or they could be grouped into two.
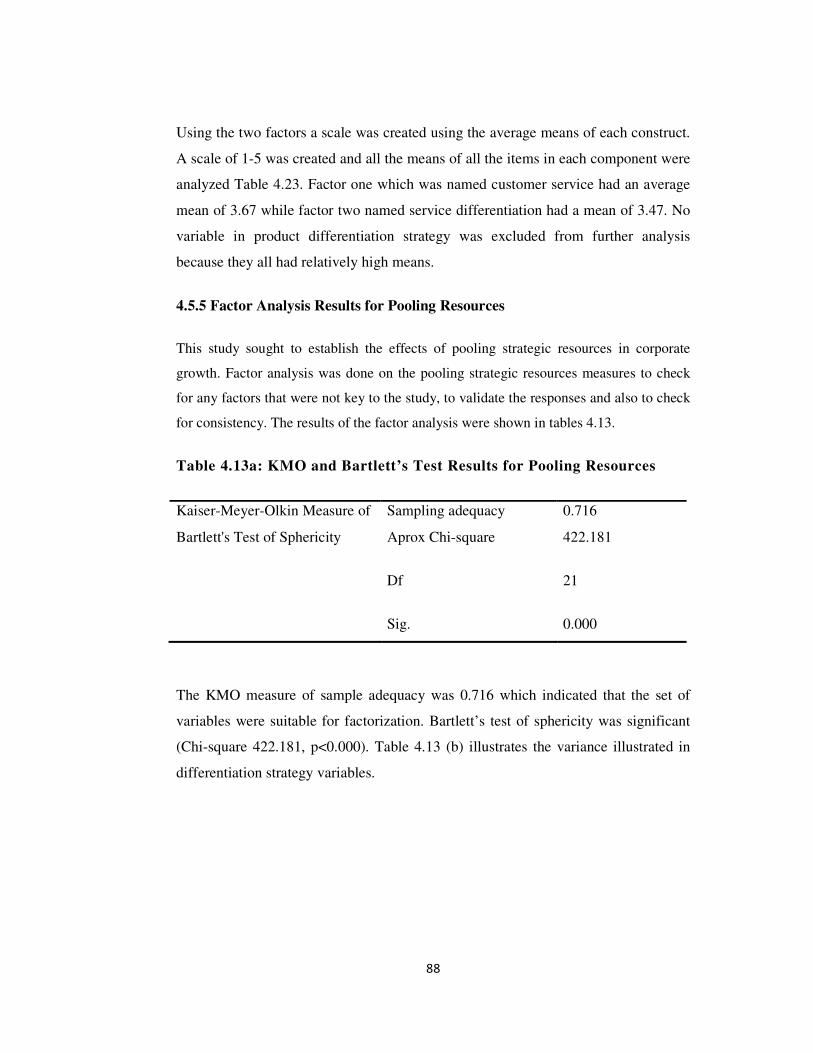
88
Using the two factors a scale was created using the average means of each construct.
A scale of 1-5 was created and all the means of all the items in each component were
analyzed Table 4.23. Factor one which was named customer service had an average
mean of 3.67 while factor two named service differentiation had a mean of 3.47. No
variable in product differentiation strategy was excluded from further analysis
because they all had relatively high means.
4.5.5 Factor Analysis Results for Pooling Resources
This study sought to establish the effects of pooling strategic resources in corporate
growth. Factor analysis was done on the pooling strategic resources measures to check
for any factors that were not key to the study, to validate the responses and also to check
for consistency. The results of the factor analysis were shown in tables 4.13.
Table 4.13a: KMO and Bartlett’s Test Results for Pooling Resources
Kaiser-Meyer-Olkin Measure of Sampling adequacy 0.716
Bartlett's Test of Sphericity Aprox Chi-square
Df
Sig.
422.181
21
0.000
The KMO measure of sample adequacy was 0.716 which indicated that the set of
variables were suitable for factorization. Bartlett’s test of sphericity was significant
(Chi-square 422.181, p<0.000). Table 4.13 (b) illustrates the variance illustrated in
differentiation strategy variables.
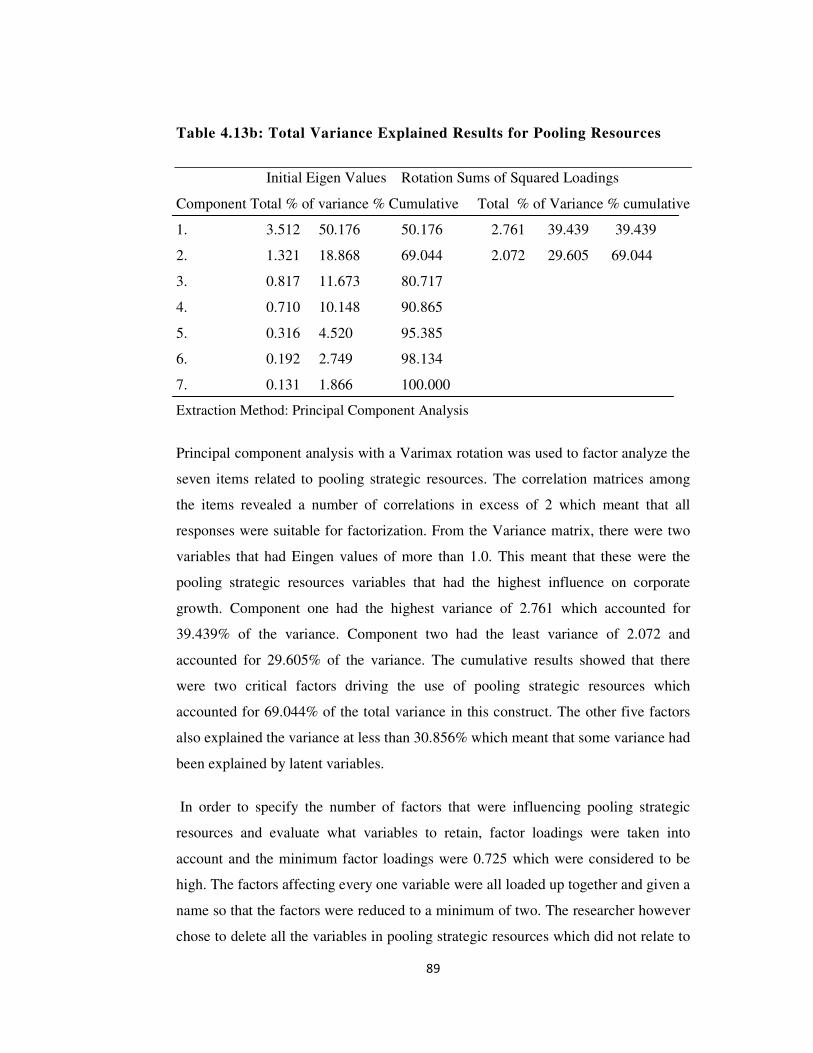
89
Table 4.13b: Total Variance Explained Results for Pooling Resources
Initial Eigen Values Rotation Sums of Squared Loadings
Component Total % of variance % Cumulative Total % of Variance % cumulative
1. 3.512 50.176 50.176 2.761 39.439 39.439
2. 1.321 18.868 69.044 2.072 29.605 69.044
3. 0.817 11.673 80.717
4. 0.710 10.148 90.865
5. 0.316 4.520 95.385
6. 0.192 2.749 98.134
7. 0.131 1.866 100.000
Extraction Method: Principal Component Analysis
Principal component analysis with a Varimax rotation was used to factor analyze the
seven items related to pooling strategic resources. The correlation matrices among
the items revealed a number of correlations in excess of 2 which meant that all
responses were suitable for factorization. From the Variance matrix, there were two
variables that had Eingen values of more than 1.0. This meant that these were the
pooling strategic resources variables that had the highest influence on corporate
growth. Component one had the highest variance of 2.761 which accounted for
39.439% of the variance. Component two had the least variance of 2.072 and
accounted for 29.605% of the variance. The cumulative results showed that there
were two critical factors driving the use of pooling strategic resources which
accounted for 69.044% of the total variance in this construct. The other five factors
also explained the variance at less than 30.856% which meant that some variance had
been explained by latent variables.
In order to specify the number of factors that were influencing pooling strategic
resources and evaluate what variables to retain, factor loadings were taken into
account and the minimum factor loadings were 0.725 which were considered to be
high. The factors affecting every one variable were all loaded up together and given a
name so that the factors were reduced to a minimum of two. The researcher however
chose to delete all the variables in pooling strategic resources which did not relate to
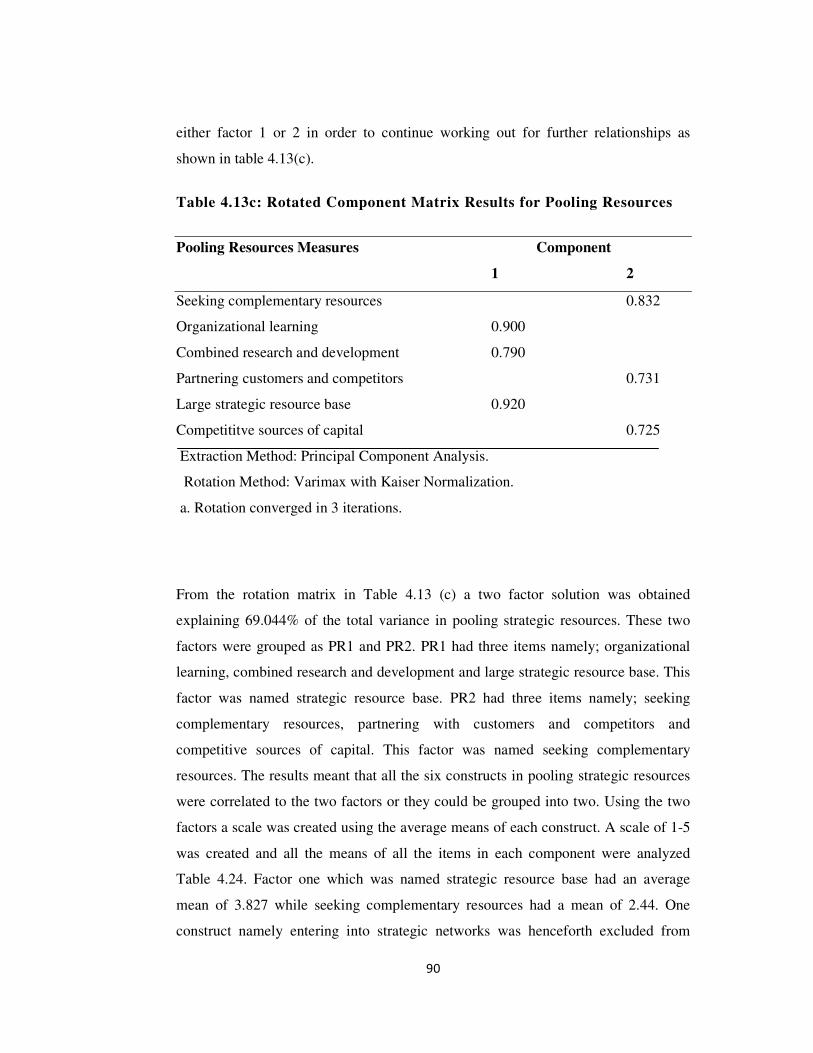
90
either factor 1 or 2 in order to continue working out for further relationships as
shown in table 4.13(c).
Table 4.13c: Rotated Component Matrix Results for Pooling Resources
Pooling Resources Measures Component
1 2
Seeking complementary resources 0.832
Organizational learning 0.900
Combined research and development 0.790
Partnering customers and competitors 0.731
Large strategic resource base 0.920
Competititve sources of capital 0.725
Extraction Method: Principal Component Analysis.
Rotation Method: Varimax with Kaiser Normalization.
a. Rotation converged in 3 iterations.
From the rotation matrix in Table 4.13 (c) a two factor solution was obtained
explaining 69.044% of the total variance in pooling strategic resources. These two
factors were grouped as PR1 and PR2. PR1 had three items namely; organizational
learning, combined research and development and large strategic resource base. This
factor was named strategic resource base. PR2 had three items namely; seeking
complementary resources, partnering with customers and competitors and
competitive sources of capital. This factor was named seeking complementary
resources. The results meant that all the six constructs in pooling strategic resources
were correlated to the two factors or they could be grouped into two. Using the two
factors a scale was created using the average means of each construct. A scale of 1-5
was created and all the means of all the items in each component were analyzed
Table 4.24. Factor one which was named strategic resource base had an average
mean of 3.827 while seeking complementary resources had a mean of 2.44. One
construct namely entering into strategic networks was henceforth excluded from
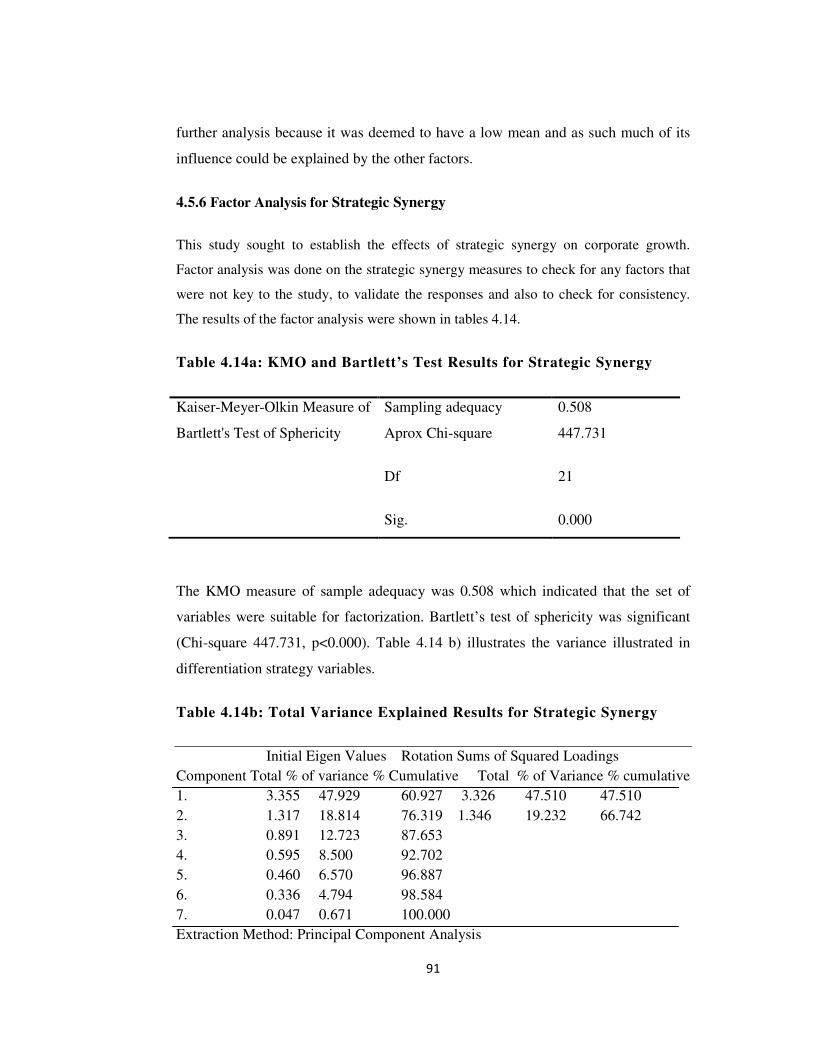
91
further analysis because it was deemed to have a low mean and as such much of its
influence could be explained by the other factors.
4.5.6 Factor Analysis for Strategic Synergy
This study sought to establish the effects of strategic synergy on corporate growth.
Factor analysis was done on the strategic synergy measures to check for any factors that
were not key to the study, to validate the responses and also to check for consistency.
The results of the factor analysis were shown in tables 4.14.
Table 4.14a: KMO and Bartlett’s Test Results for Strategic Synergy
Kaiser-Meyer-Olkin Measure of Sampling adequacy 0.508
Bartlett's Test of Sphericity Aprox Chi-square
Df
Sig.
447.731
21
0.000
The KMO measure of sample adequacy was 0.508 which indicated that the set of
variables were suitable for factorization. Bartlett’s test of sphericity was significant
(Chi-square 447.731, p<0.000). Table 4.14 b) illustrates the variance illustrated in
differentiation strategy variables.
Table 4.14b: Total Variance Explained Results for Strategic Synergy
Initial Eigen Values Rotation Sums of Squared Loadings
Component Total % of variance % Cumulative Total % of Variance % cumulative
1. 3.355 47.929 60.927 3.326 47.510 47.510
2. 1.317 18.814 76.319 1.346 19.232 66.742
3. 0.891 12.723 87.653
4. 0.595 8.500 92.702
5. 0.460 6.570 96.887
6. 0.336 4.794 98.584
7. 0.047 0.671 100.000
Extraction Method: Principal Component Analysis
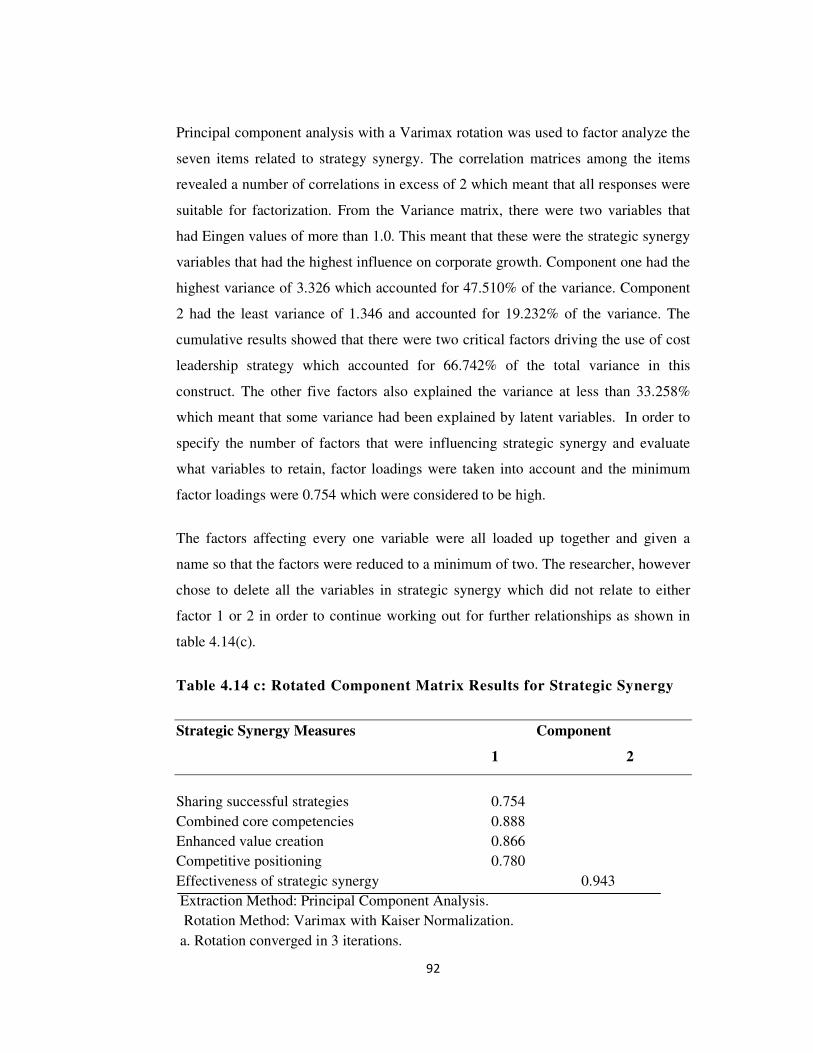
92
Principal component analysis with a Varimax rotation was used to factor analyze the
seven items related to strategy synergy. The correlation matrices among the items
revealed a number of correlations in excess of 2 which meant that all responses were
suitable for factorization. From the Variance matrix, there were two variables that
had Eingen values of more than 1.0. This meant that these were the strategic synergy
variables that had the highest influence on corporate growth. Component one had the
highest variance of 3.326 which accounted for 47.510% of the variance. Component
2 had the least variance of 1.346 and accounted for 19.232% of the variance. The
cumulative results showed that there were two critical factors driving the use of cost
leadership strategy which accounted for 66.742% of the total variance in this
construct. The other five factors also explained the variance at less than 33.258%
which meant that some variance had been explained by latent variables. In order to
specify the number of factors that were influencing strategic synergy and evaluate
what variables to retain, factor loadings were taken into account and the minimum
factor loadings were 0.754 which were considered to be high.
The factors affecting every one variable were all loaded up together and given a
name so that the factors were reduced to a minimum of two. The researcher, however
chose to delete all the variables in strategic synergy which did not relate to either
factor 1 or 2 in order to continue working out for further relationships as shown in
table 4.14(c).
Table 4.14 c: Rotated Component Matrix Results for Strategic Synergy
Strategic Synergy Measures Component
1 2
Sharing successful strategies 0.754
Combined core competencies 0.888
Enhanced value creation 0.866
Competitive positioning 0.780
Effectiveness of strategic synergy 0.943
Extraction Method: Principal Component Analysis.
Rotation Method: Varimax with Kaiser Normalization.
a. Rotation converged in 3 iterations.

93
From the rotation matrix in Table 4.14(c) a two factor solution was obtained
explaining 66.742% of the total variance in strategic synergy. These two factors were
grouped as SS1 and SS2. SS1 had four items namely; Sharing successful strategies,
Combined core competencies , Enhanced value creation and competitive
Posistioning. This factor was named sharing risks and expenses. SS2 had only one
item namely effectiveness of strategic synergy. This factor was named effectiveness
of strategic synergy. The results meant that all the constructs in strategic synergy
were correlated to the two factors or they could be grouped into two. Using the two
factors a scale was created using the average means of each construct. A scale of 1-5
was created and all the means of all the items in each component were analyzed
Table 4.25. Factor one which was named sharing risks and expenses had an average
mean of 4.315 while factor two named effectiveness of strategic synergy had a mean
of 1.66 Two constructs namely sharing successful strategies and amercing strategic
synergy were henceforth excluded from further analysis because they were deemed
to have low means and as such much of their influence could be explained by the
other factors.
4.5.7 Factor Analysis Results for Corporate Growth
This study sought to establish the metrics of corporate growth. Factor analysis was done
on the corporate growth measures to check for any factors that were not key to the study,
to validate the responses and also to check for consistency. The results of the factor
analysis were shown in Table 4.15. The KMO measure of sample adequacy was 0.617
which indicated that the set of variables were suitable for factorization. Bartlett’s test
of sphericity was significant (Chi-square 505.131, p<0.000).
Table 4.15a: KMO and Bartlett’s Test Results for Corporate Growth
Kaiser-Meyer-Olkin Measure of Sampling adequacy 0.617
Bartlett's Test of Sphericity Aprox Chi-square
Df
Sig.
505.131
28
0.000

94
Table 4.15b illustrates the variance illustrated in differentiation strategy variables.
Table 4.15 b: Total Variance Explained Results for Corporate Growth
Initial Eigen Values Rotation Sums of Squared Loadings
Component Total % of variance % Cumulative Total % of Variance % cumulative
1. 3.699 46.237 46.237 2.774 34.670 34.670
2. 1.390 17.379 63.616 2.297 28.711 63.381
3. 1.025 12.818 76.433 1.044 13.052 76.433
4. 0.856 10.705 87.139
5. 0.402 5.029 92.167
6. 0.324 4.053 96.221
7. 0.229 2.859 99.080
8. 0.074 0.920 100.000
Extraction Method: Principal Component Analysis
Principal component analysis with a Varimax rotation was used to factor analyze the
eight items related to corporate growth. The correlation matrices among the items
revealed a number of correlations in excess of 3 which meant that all responses were
suitable for factorization. From the Variance matrix, there were three variables that
had Eingen values of more than 1.0. This meant that these were the corporate growth
variables that had the highest influence on corporate growth. Component one had the
highest variance of 2.774 which accounted for 34.670% of the variance. Component
two had a variance of 2.297 and accounted for 28.711% of the variance while
component three had the least variance of 1.044 and accounted for 13.052% of the
variance. The cumulative results showed that there were three critical factors driving
corporate growth which accounted for 76.433% of the total variance in this construct.
The other five factors explained the variance at less than 23.567% which meant that
some variance had been explained by latent variables.
In order to specify the number of factors that were influencing corporate growth and
evaluate what variables to retain, factor loadings were taken into account and the
minimum factor loadings were 0.635 which were considered to be moderately high.
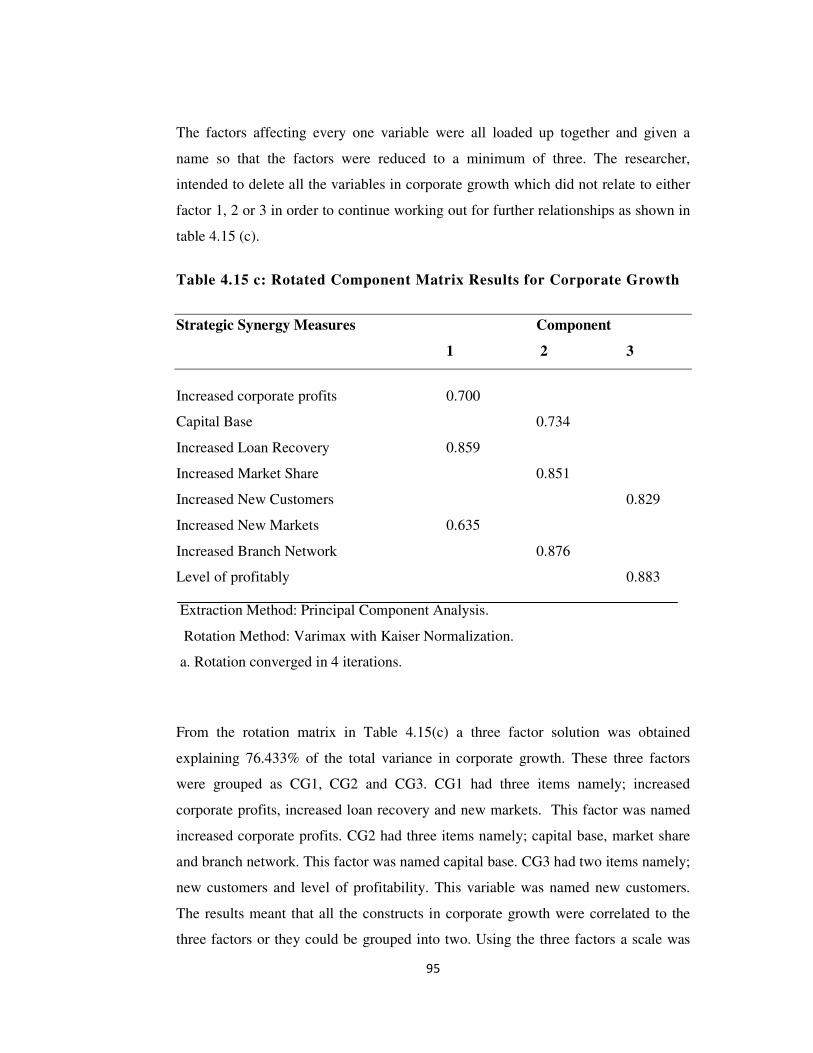
95
The factors affecting every one variable were all loaded up together and given a
name so that the factors were reduced to a minimum of three. The researcher,
intended to delete all the variables in corporate growth which did not relate to either
factor 1, 2 or 3 in order to continue working out for further relationships as shown in
table 4.15 (c).
Table 4.15 c: Rotated Component Matrix Results for Corporate Growth
Strategic Synergy Measures Component
1 2 3
Increased corporate profits 0.700
Capital Base 0.734
Increased Loan Recovery 0.859
Increased Market Share 0.851
Increased New Customers 0.829
Increased New Markets 0.635
Increased Branch Network 0.876
Level of profitably 0.883
From the rotation matrix in Table 4.15(c) a three factor solution was obtained
explaining 76.433% of the total variance in corporate growth. These three factors
were grouped as CG1, CG2 and CG3. CG1 had three items namely; increased
corporate profits, increased loan recovery and new markets. This factor was named
increased corporate profits. CG2 had three items namely; capital base, market share
and branch network. This factor was named capital base. CG3 had two items namely;
new customers and level of profitability. This variable was named new customers.
The results meant that all the constructs in corporate growth were correlated to the
three factors or they could be grouped into two. Using the three factors a scale was
Extraction Method: Principal Component Analysis.
Rotation Method: Varimax with Kaiser Normalization.
a. Rotation converged in 4 iterations.
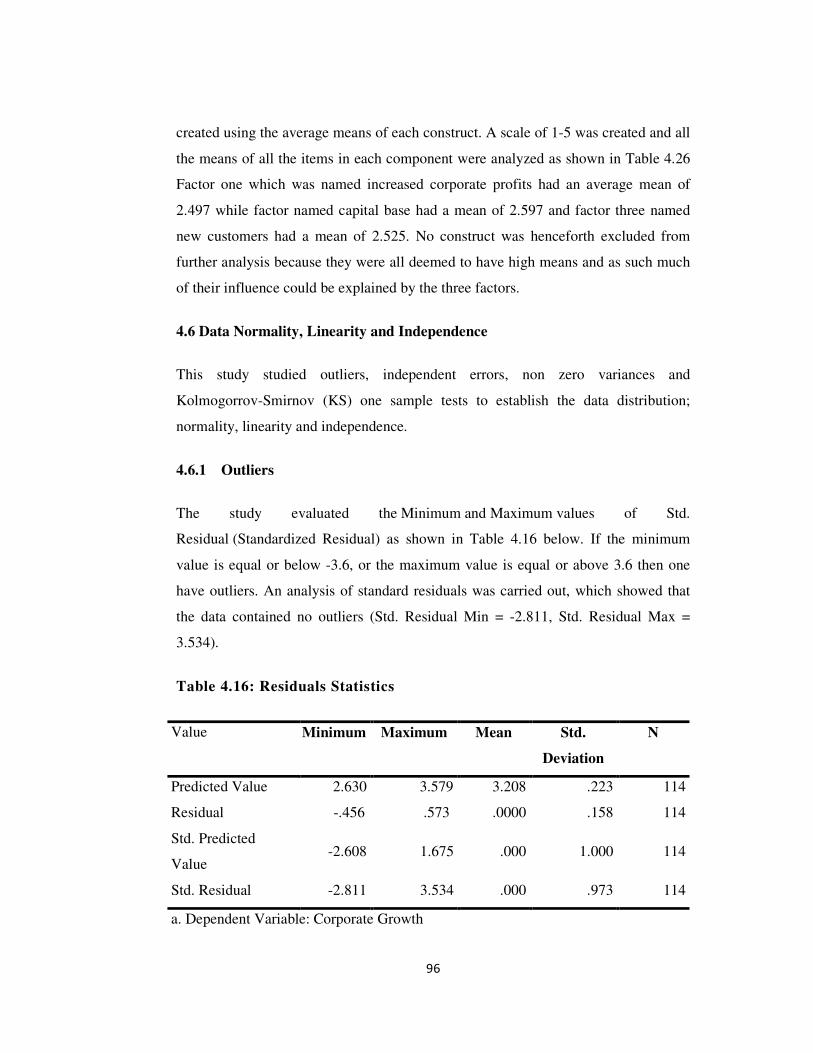
96
created using the average means of each construct. A scale of 1-5 was created and all
the means of all the items in each component were analyzed as shown in Table 4.26
Factor one which was named increased corporate profits had an average mean of
2.497 while factor named capital base had a mean of 2.597 and factor three named
new customers had a mean of 2.525. No construct was henceforth excluded from
further analysis because they were all deemed to have high means and as such much
of their influence could be explained by the three factors.
4.6 Data Normality, Linearity and Independence
This study studied outliers, independent errors, non zero variances and
Kolmogorrov-Smirnov (KS) one sample tests to establish the data distribution;
normality, linearity and independence.
4.6.1 Outliers
The study evaluated the Minimum and Maximum values of Std.
Residual (Standardized Residual) as shown in Table 4.16 below. If the minimum
value is equal or below -3.6, or the maximum value is equal or above 3.6 then one
have outliers. An analysis of standard residuals was carried out, which showed that
the data contained no outliers (Std. Residual Min = -2.811, Std. Residual Max =
3.534).
Table 4.16: Residuals Statistics
Value Minimum Maximum Mean Std.
Deviation
N
Predicted Value 2.630 3.579 3.208 .223 114
Residual -.456 .573 .0000 .158 114
Std. Predicted
Value -2.608 1.675 .000 1.000 114
Std. Residual -2.811 3.534 .000 .973 114
a. Dependent Variable: Corporate Growth
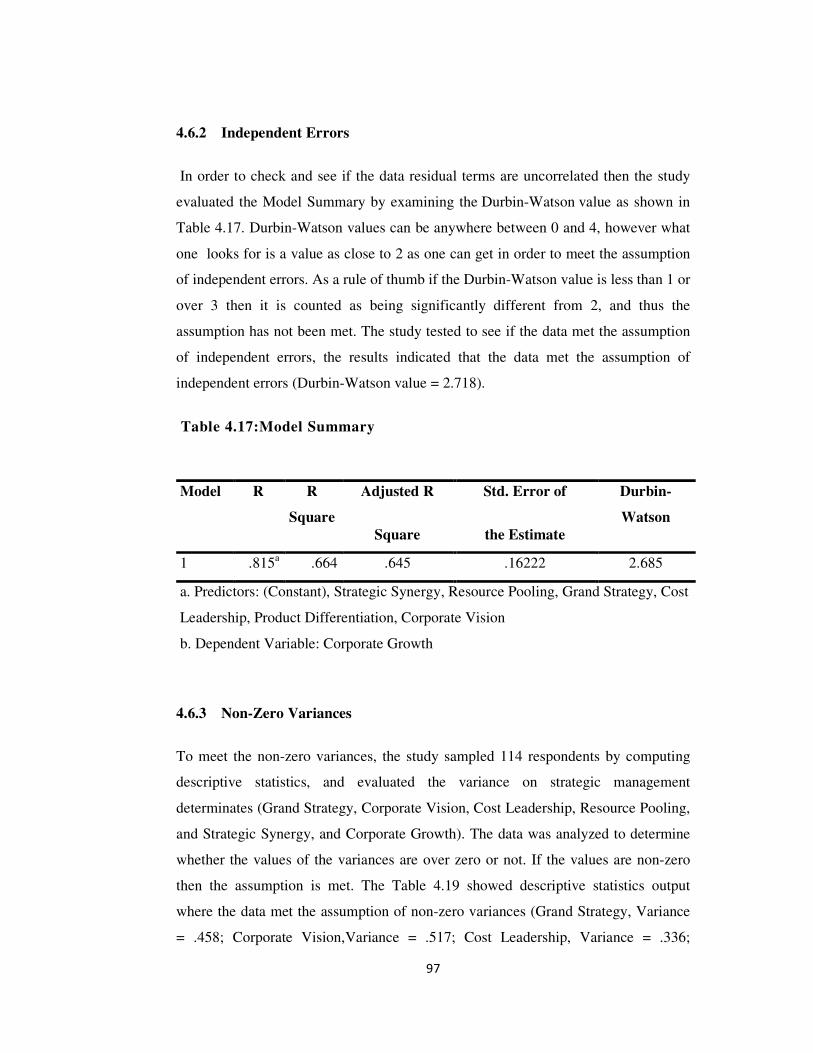
97
4.6.2 Independent Errors
In order to check and see if the data residual terms are uncorrelated then the study
evaluated the Model Summary by examining the Durbin-Watson value as shown in
Table 4.17. Durbin-Watson values can be anywhere between 0 and 4, however what
one looks for is a value as close to 2 as one can get in order to meet the assumption
of independent errors. As a rule of thumb if the Durbin-Watson value is less than 1 or
over 3 then it is counted as being significantly different from 2, and thus the
assumption has not been met. The study tested to see if the data met the assumption
of independent errors, the results indicated that the data met the assumption of
independent errors (Durbin-Watson value = 2.718).
Table 4.17:Model Summary
4.6.3 Non-Zero Variances
To meet the non-zero variances, the study sampled 114 respondents by computing
descriptive statistics, and evaluated the variance on strategic management
determinates (Grand Strategy, Corporate Vision, Cost Leadership, Resource Pooling,
and Strategic Synergy, and Corporate Growth). The data was analyzed to determine
whether the values of the variances are over zero or not. If the values are non-zero
then the assumption is met. The Table 4.19 showed descriptive statistics output
where the data met the assumption of non-zero variances (Grand Strategy, Variance
= .458; Corporate Vision,Variance = .517; Cost Leadership, Variance = .336;
Model R R
Square
Adjusted R
Square
Std. Error of
the Estimate
Durbin-
Watson
1 .815a .664 .645 .16222 2.685
a. Predictors: (Constant), Strategic Synergy, Resource Pooling, Grand Strategy, Cost
Leadership, Product Differentiation, Corporate Vision
b. Dependent Variable: Corporate Growth

98
Product Differentiation, Variance = .221; Resource Pooling,Variance = .385;
Strategic Synergy,Variance = .275; and Corporate Growth,Variance = .579).
Table 4.18: Descriptive Statistics (n=114)
Variable Minimu
m
Maximu
m
Mea
n
Std.
Deviation
Varianc
e
Grand Strategy
2 5 3.207
7 .27212 .458
Corporate Vision 1 4 3.834
8 .71005 .517
Cost Leadership
2 4 2.57 .719 .336
Product
Differentiation 3 4 2.842
1 .64436 .221
Resource Pooling
2 4 3.64 .470 .385
Strategic Synergy
2 4 3.134
5 .65920 .275
Corporate Growth
2 4 3.640
4 .55633 .579
4.6.4 Kolmogorrov-Smirnov (KS) one sample tests
Kolmogorrov-Smirnov is a non-parametric goodness-of-fit test which is used to
compare the cumulative distribution function for variables within the specified
distribution. The results of K-S test for the key study variables indicated that the data
relating to all the study variables was normally distributed. Similarly, one-sample t-
tests for the quality of means conducted on the study variables indicated that there
was no significant difference expected in the respective mean scores at 95 percent
confidence level. These findings mean that correlation and regression analysis among
other statistical tests could be appropriate.

99
Table 4.19: Kolmogorov-Smirnov One-Sample test for Normality of
strategic management
Items Aggregate Mean Score of Strategic Management
Determinants of Corporate Growth
GS CV CL PD PR SS CG_____
Normal Parameters Mean 3.79 2.57 2.69 3.64 3.07 3.66 3.21
Std. Dev..677 .719 .580 .470 .621 5.24 2.72
Most Extreme Absolute.280 .287 .165 .336 .427 .216 2.16
differences Positive.011 .039 .035 .041 .427 .146 2.16
Negative-.280 -.287 -.165 -.336 .000 -.216 -.168
Kolmogorov-Smirnov Z .882 .904 .520 1.060 1.347 .682 .682
Asymp. Sig (2-tailed) .418 .387 .949 .211 .053 .741 .741
a Test distribution is Normal.
b Calculated from data.
Overall verdict: Test distribution is normal
From table 4.19, the data on strategic management determinants did not deviate
significantly from the normal distribution and for this reason it was safe to use
statistical tests and procedures that assume normality of the variables. Further,
statistics on corporate growth indicate that the data did not deviate significantly from
the normal distribution. As a result, it would be statistically admissible to use
statistical tests and procedures that assume normality of the data; in this study
regression and correlation analysis.
4.7 Demographic Results
In statistical analysis and probability, mean square is used to refer to measures of
the central tendency either of a probability distribution or of the random
variable characterized by that distribution. Therefore, the study sampled 114
respondents, and evaluated the distribution of the respondent perception on strategic

100
management determinants (Grand Strategy, Corporate Vision, Cost Leadership,
Product Differentiation, Resource Pooling, and Strategic Synergy) of corporate
growth. The data was analyzed using descriptive statistics by computing means of
each strategic management determinants. The means were then evaluated against the
questionnaires approximate survey value coded to the survey labels, as shown in
table 4.20 below. The responses were mapped to questionnaires as; 1 = “No Extend”,
2 = “Small Extend”, 3 = “Moderate Extend”, 4 = “Great Extend” and 5 = “Greatest
Extend”. The study findings were presented as follows;
4.7.1 Grand Strategy on Corporate Growth
The study sought to assess the effects of grand strategy on corporate growth of
microfinance institutions in Kenya. Table 4.21 summarizes respondents' level of
agreement on the effects of grand strategy on corporate growth of MFIs in Kenya.
From table 4.20 below, majority of the respondents agreed that institutionalization of
grand strategy strongly affected corporate growth of MFIs in Kenya with highest
mean score of 4.32. Further, more respondents indicated that communication of
grand strategy increased corporate growth with a mean of 4.15. A notable number of
respondents agreed that continuously monitoring grand strategy improves corporate
growth in MFIs in Kenya with a mean score of 3.847. The inferential statistics
indicate that an overall mean score of 3.835 (inferring to survey value (4), coded as
great extend) was achieved for effects of grand strategy on corporate growth of MFIs
in Kenya. This implies that majority of firms were aware of the need for a grand
strategy as the firms had a grand strategy in operation.

101
Table 4.20: Grand Strategy on Corporate Growth (n=114)
Sub-variable Mean S.D
Mean 1 Mean 2
Presence of grand strategy 3.86 1.080
Institutionalization of grand strategy 4.32 0.672
Communication of grand strategy 4.15 0.823
Continuously monitoring grand strategy 3.87 0.572
Strategic planning 3.21 1.525
Effectiveness of grand strategy 3.60 0.966
Grand 3.77 3.835 3.96
4.7.2 Corporate Vision on Corporate Growth
The study sought to assess the effects of corporate vision on corporate growth of
microfinance institutions in Kenya. Table 4.21 summarizes respondents' level of
agreement on the effects of corporate vision on corporate growth of MFIs in Kenya.
Majority of the residents agreed that continuously monitoring corporate vision
increases corporate growth with a mean of 2.82. A number of respondents agreed
that Communication of corporate vision increases corporate growth with a mean of
2.81. and a notable number of respondents agreed that proper alignment of corporate
vision increases corporate growth in MFIs in Kenya with a mean score of 2.6. The
inferential statistics indicate that an overall mean score of 2.603 (inferring to survey
value (3), coded as moderate extend) was achieved for effects of corporate vision on
corporate growth of MFIs in Kenya.
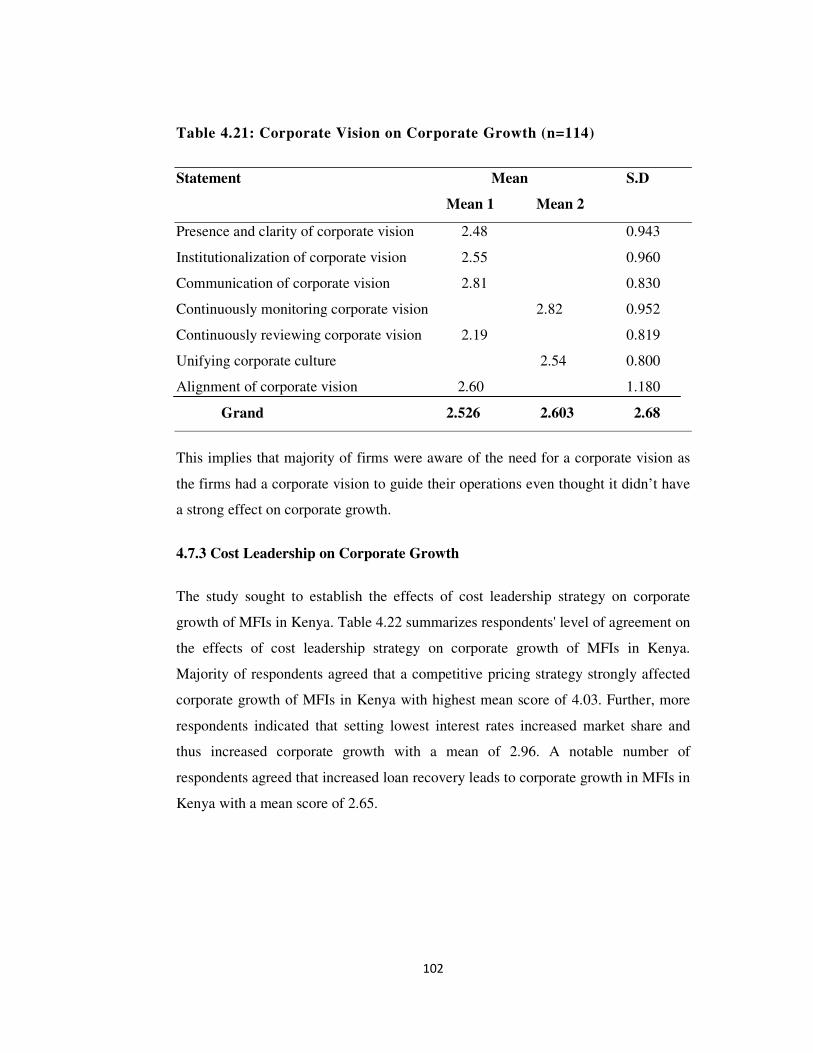
102
Table 4.21: Corporate Vision on Corporate Growth (n=114)
Statement Mean S.D
Mean 1 Mean 2
Presence and clarity of corporate vision 2.48 0.943
Institutionalization of corporate vision 2.55 0.960
Communication of corporate vision 2.81 0.830
Continuously monitoring corporate vision 2.82 0.952
Continuously reviewing corporate vision 2.19 0.819
Unifying corporate culture 2.54 0.800
Alignment of corporate vision 2.60 1.180
Grand 2.526 2.603 2.68
This implies that majority of firms were aware of the need for a corporate vision as
the firms had a corporate vision to guide their operations even thought it didn’t have
a strong effect on corporate growth.
4.7.3 Cost Leadership on Corporate Growth
The study sought to establish the effects of cost leadership strategy on corporate
growth of MFIs in Kenya. Table 4.22 summarizes respondents' level of agreement on
the effects of cost leadership strategy on corporate growth of MFIs in Kenya.
Majority of respondents agreed that a competitive pricing strategy strongly affected
corporate growth of MFIs in Kenya with highest mean score of 4.03. Further, more
respondents indicated that setting lowest interest rates increased market share and
thus increased corporate growth with a mean of 2.96. A notable number of
respondents agreed that increased loan recovery leads to corporate growth in MFIs in
Kenya with a mean score of 2.65.
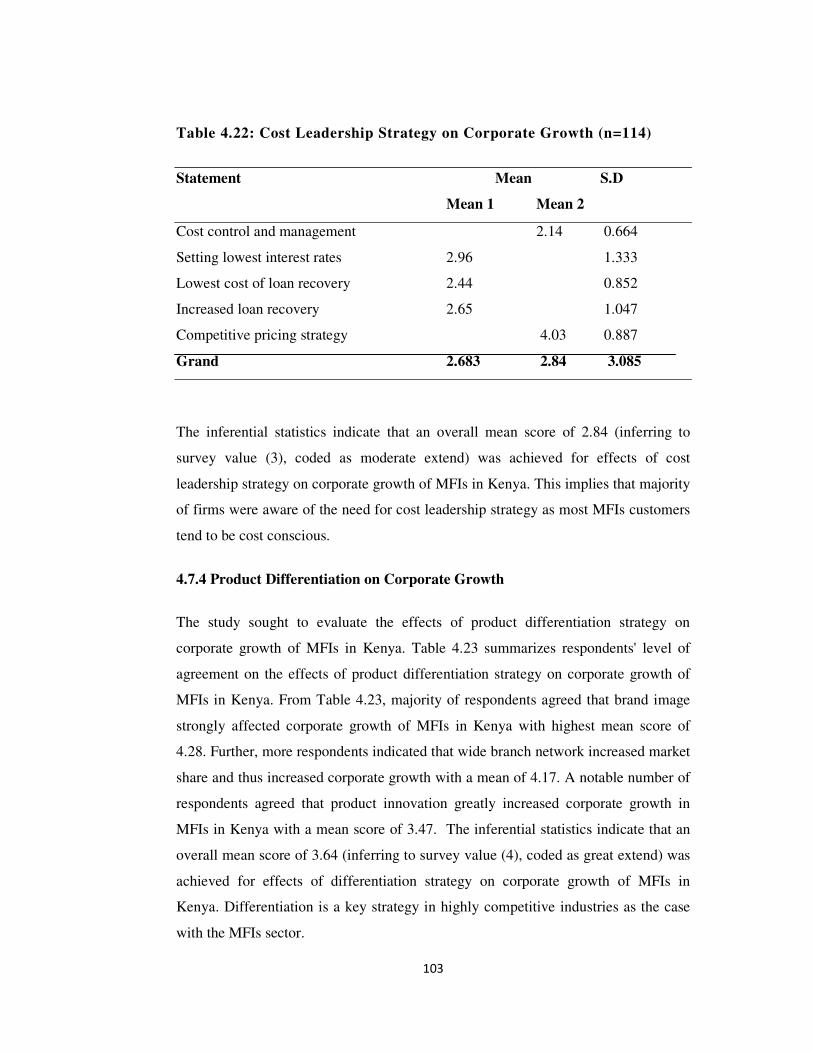
103
Table 4.22: Cost Leadership Strategy on Corporate Growth (n=114)
Statement Mean S.D
Mean 1 Mean 2
Cost control and management 2.14 0.664
Setting lowest interest rates 2.96 1.333
Lowest cost of loan recovery 2.44 0.852
Increased loan recovery 2.65 1.047
Competitive pricing strategy 4.03 0.887
Grand 2.683 2.84 3.085
The inferential statistics indicate that an overall mean score of 2.84 (inferring to
survey value (3), coded as moderate extend) was achieved for effects of cost
leadership strategy on corporate growth of MFIs in Kenya. This implies that majority
of firms were aware of the need for cost leadership strategy as most MFIs customers
tend to be cost conscious.
4.7.4 Product Differentiation on Corporate Growth
The study sought to evaluate the effects of product differentiation strategy on
corporate growth of MFIs in Kenya. Table 4.23 summarizes respondents' level of
agreement on the effects of product differentiation strategy on corporate growth of
MFIs in Kenya. From Table 4.23, majority of respondents agreed that brand image
strongly affected corporate growth of MFIs in Kenya with highest mean score of
4.28. Further, more respondents indicated that wide branch network increased market
share and thus increased corporate growth with a mean of 4.17. A notable number of
respondents agreed that product innovation greatly increased corporate growth in
MFIs in Kenya with a mean score of 3.47. The inferential statistics indicate that an
overall mean score of 3.64 (inferring to survey value (4), coded as great extend) was
achieved for effects of differentiation strategy on corporate growth of MFIs in
Kenya. Differentiation is a key strategy in highly competitive industries as the case
with the MFIs sector.
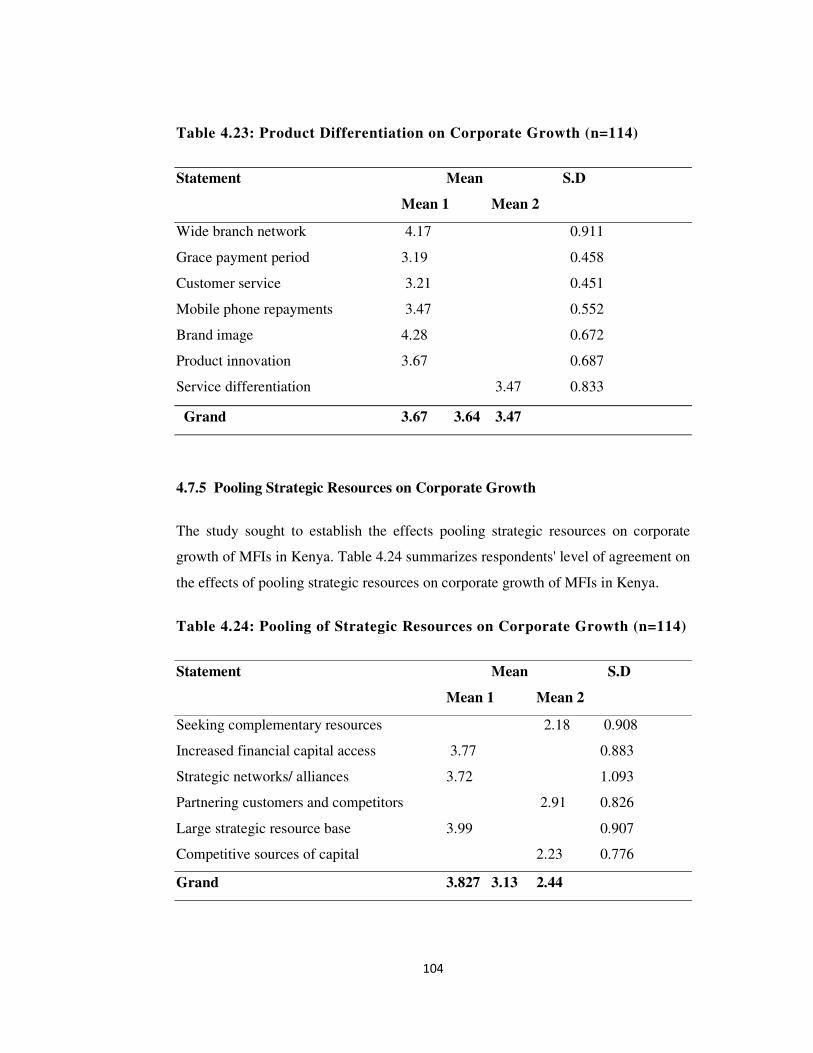
104
Table 4.23: Product Differentiation on Corporate Growth (n=114)
Statement Mean S.D
Mean 1 Mean 2
Wide branch network 4.17 0.911
Grace payment period 3.19 0.458
Customer service 3.21 0.451
Mobile phone repayments 3.47 0.552
Brand image 4.28 0.672
Product innovation 3.67 0.687
Service differentiation 3.47 0.833
Grand 3.67 3.64 3.47
4.7.5 Pooling Strategic Resources on Corporate Growth
The study sought to establish the effects pooling strategic resources on corporate
growth of MFIs in Kenya. Table 4.24 summarizes respondents' level of agreement on
the effects of pooling strategic resources on corporate growth of MFIs in Kenya.
Table 4.24: Pooling of Strategic Resources on Corporate Growth (n=114)
Statement Mean S.D
Mean 1 Mean 2
Seeking complementary resources 2.18 0.908
Increased financial capital access 3.77 0.883
Strategic networks/ alliances 3.72 1.093
Partnering customers and competitors 2.91 0.826
Large strategic resource base 3.99 0.907
Competitive sources of capital 2.23 0.776
Grand 3.827 3.13 2.44
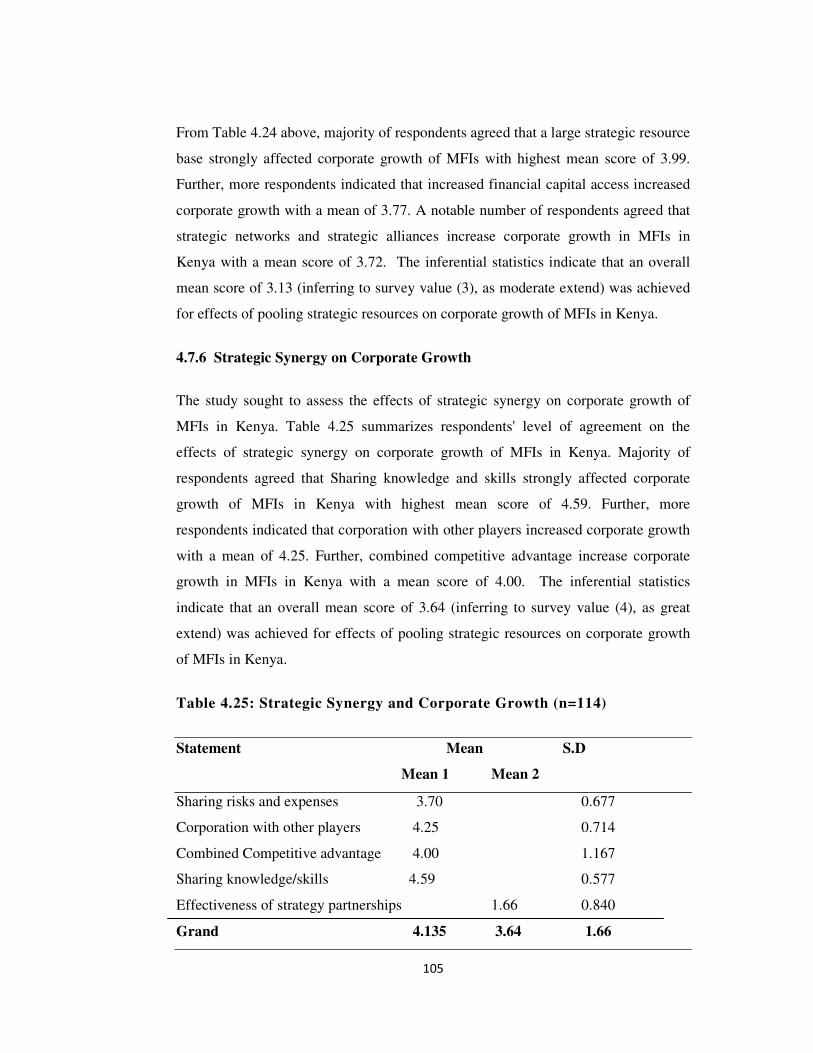
105
From Table 4.24 above, majority of respondents agreed that a large strategic resource
base strongly affected corporate growth of MFIs with highest mean score of 3.99.
Further, more respondents indicated that increased financial capital access increased
corporate growth with a mean of 3.77. A notable number of respondents agreed that
strategic networks and strategic alliances increase corporate growth in MFIs in
Kenya with a mean score of 3.72. The inferential statistics indicate that an overall
mean score of 3.13 (inferring to survey value (3), as moderate extend) was achieved
for effects of pooling strategic resources on corporate growth of MFIs in Kenya.
4.7.6 Strategic Synergy on Corporate Growth
The study sought to assess the effects of strategic synergy on corporate growth of
MFIs in Kenya. Table 4.25 summarizes respondents' level of agreement on the
effects of strategic synergy on corporate growth of MFIs in Kenya. Majority of
respondents agreed that Sharing knowledge and skills strongly affected corporate
growth of MFIs in Kenya with highest mean score of 4.59. Further, more
respondents indicated that corporation with other players increased corporate growth
with a mean of 4.25. Further, combined competitive advantage increase corporate
growth in MFIs in Kenya with a mean score of 4.00. The inferential statistics
indicate that an overall mean score of 3.64 (inferring to survey value (4), as great
extend) was achieved for effects of pooling strategic resources on corporate growth
of MFIs in Kenya.
Table 4.25: Strategic Synergy and Corporate Growth (n=114)
Statement Mean S.D
Mean 1 Mean 2
Sharing risks and expenses 3.70 0.677
Corporation with other players 4.25 0.714
Combined Competitive advantage 4.00 1.167
Sharing knowledge/skills 4.59 0.577
Effectiveness of strategy partnerships 1.66 0.840
Grand 4.135 3.64 1.66

106
4.7.7 Measurement of Corporate Growth
A number of questions were asked to determine the extent of contribution of metrics
of corporate growth in MFIs in Kenya. Table 4.26 summarizes respondents' level of
agreement on the extend of effects of metrics of corporate growth of MFIs in Kenya.
Majority of respondents agreed that market share was a key metric for measuring
corporate growth of MFIs in Kenya with highest mean score of 3.12. Further, more
respondents indicated that corporate profits was big contributor to corporate growth
in MFIs in Kenya with a mean of 2.95. A notable number of respondents agreed that
rate of loan recovery increase corporate growth in MFIs in Kenya with a mean score
of 2.79. The inferential statistics indicate that an overall mean score of 2.54
(inferring to survey value (3), as moderate extend) was achieved for contribution of
metrics of corporate growth of MFIs in Kenya.
Table 4.26: Corporate Growth (n=114)
Statement Mean S.D
Mean 1 Mean 2 Mean 3
Corporate profits 2.95 1.316
Capital Base 2.38 1.193
Loan Recovery 2.79 1.537
Market Share 3.12 1.325
Entry of New Customers 2.40 0.761
Entry in New Markets 1.75 0.673
Branch Network 2.29 1.322
Level of profitability 2.65 1.197
Grand 2.497 2.597 2.52 2.54
4.7.8 Summary of Survey Variable Findings
This part sought to establish the overall survey variable findings for strategic
management determinants of corporate growth in MFIs in Kenya. This is presented
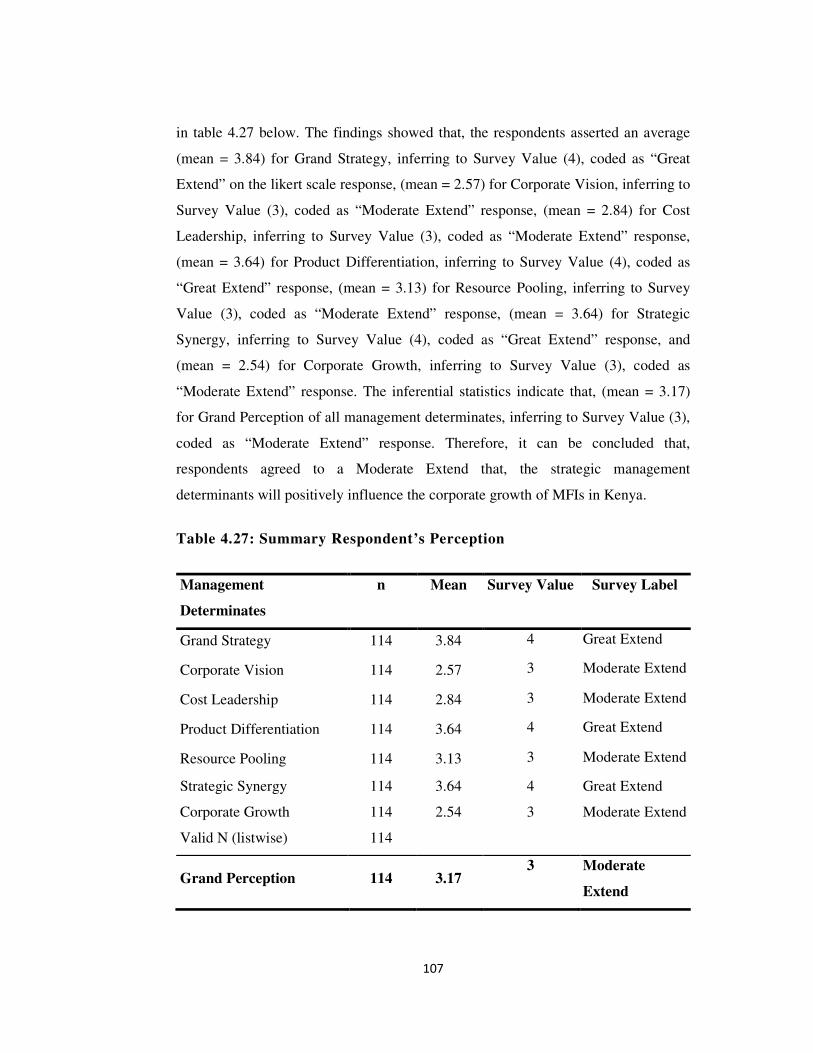
107
in table 4.27 below. The findings showed that, the respondents asserted an average
(mean = 3.84) for Grand Strategy, inferring to Survey Value (4), coded as “Great
Extend” on the likert scale response, (mean = 2.57) for Corporate Vision, inferring to
Survey Value (3), coded as “Moderate Extend” response, (mean = 2.84) for Cost
Leadership, inferring to Survey Value (3), coded as “Moderate Extend” response,
(mean = 3.64) for Product Differentiation, inferring to Survey Value (4), coded as
“Great Extend” response, (mean = 3.13) for Resource Pooling, inferring to Survey
Value (3), coded as “Moderate Extend” response, (mean = 3.64) for Strategic
Synergy, inferring to Survey Value (4), coded as “Great Extend” response, and
(mean = 2.54) for Corporate Growth, inferring to Survey Value (3), coded as
“Moderate Extend” response. The inferential statistics indicate that, (mean = 3.17)
for Grand Perception of all management determinates, inferring to Survey Value (3),
coded as “Moderate Extend” response. Therefore, it can be concluded that,
respondents agreed to a Moderate Extend that, the strategic management
determinants will positively influence the corporate growth of MFIs in Kenya.
Table 4.27: Summary Respondent’s Perception
Management
Determinates
n Mean Survey Value Survey Label
Grand Strategy 114 3.84 4 Great Extend
Corporate Vision 114 2.57 3 Moderate Extend
Cost Leadership 114 2.84 3 Moderate Extend
Product Differentiation 114 3.64 4 Great Extend
Resource Pooling 114 3.13 3 Moderate Extend
Strategic Synergy 114 3.64 4 Great Extend
Corporate Growth 114 2.54 3 Moderate Extend
Valid N (listwise) 114
Grand Perception 114 3.17 3 Moderate
Extend
108
4.8 Quantitative Results
Descriptive statistics was used to analyze questionnaires in order to establish trends
in data. Data was then subjected to inferential statistics to establish relationships
between variables. Hypothesis was tested using t- test and the multiple regression
model in order to link the relationships between strategic management determinants
and corporate growth. The quantitative findings of the research were presented using
correlation analysis table and regression analysis table. The hypothesis was tested at
95% confidence level (α = 0.05) using the F-test, χ2-test and Karl Pearson’s
coefficient of correlation.
4.8.1 Chi Sqare (χ)2- Tests
χ2- Tests were carried out on all variables to test for the equality of means in order to
either accept or reject the alternative hypothesis that there was a significance effect
of strategic management determinants on corporate growth of MFIs in Kenya. That
is, if χ2-value = 0 (Ha: theres a significance difference expected between the means,
at α = 0.05, 2-tailed), Accept Ha if P-value ≤ α , otherwise reject Ha if P-value > α .
a) χ2-tests Results on Grand Strategy Measures
Grand strategy objective was assessed by seven measures but after factor analysis
these measures were reduced to six. The six variables were; presence of grand
strategy, institutionalization of grand strategy, communication of grand strategy,
continuously monitoring grand strategy, presence of strategic planning and
effectiveness of grand strategy.
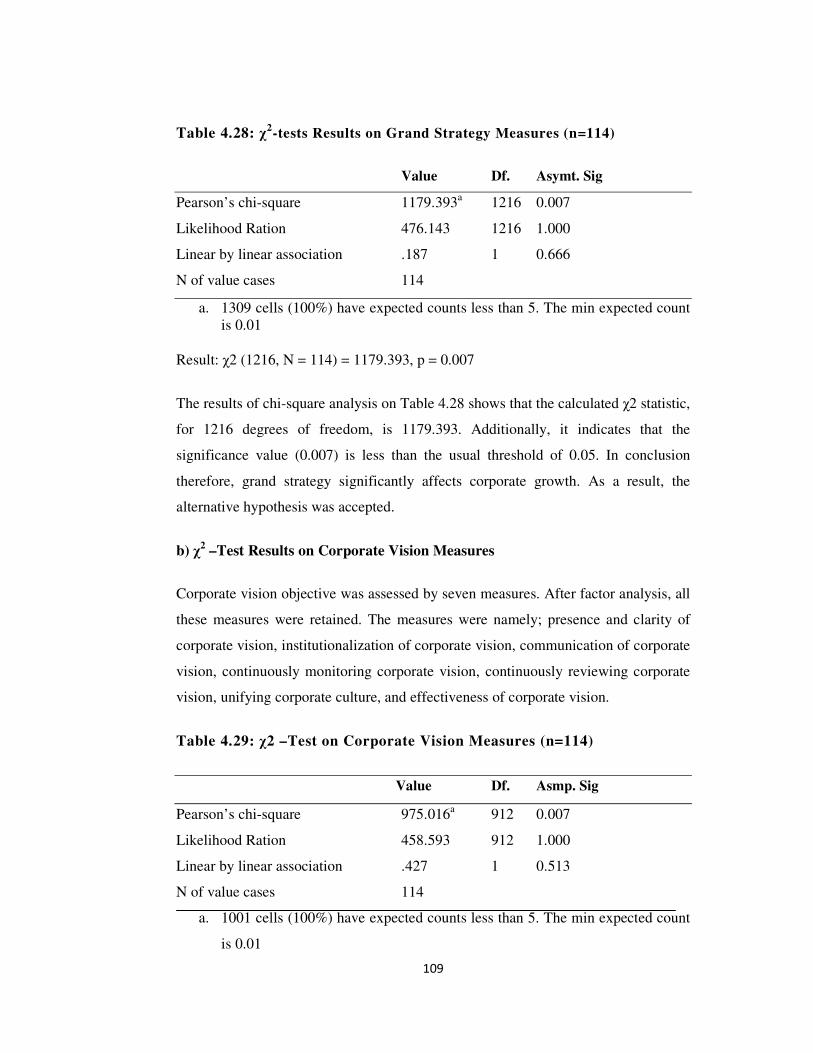
109
Table 4.28: χ2-tests Results on Grand Strategy Measures (n=114)
Value Df. Asymt. Sig
Pearson’s chi-square 1179.393a 1216 0.007
Likelihood Ration 476.143 1216 1.000
Linear by linear association .187 1 0.666
N of value cases 114
a. 1309 cells (100%) have expected counts less than 5. The min expected count
is 0.01
Result: χ2 (1216, N = 114) = 1179.393, p = 0.007
The results of chi-square analysis on Table 4.28 shows that the calculated χ2 statistic,
for 1216 degrees of freedom, is 1179.393. Additionally, it indicates that the
significance value (0.007) is less than the usual threshold of 0.05. In conclusion
therefore, grand strategy significantly affects corporate growth. As a result, the
alternative hypothesis was accepted.
b) χ2 –Test Results on Corporate Vision Measures
Corporate vision objective was assessed by seven measures. After factor analysis, all
these measures were retained. The measures were namely; presence and clarity of
corporate vision, institutionalization of corporate vision, communication of corporate
vision, continuously monitoring corporate vision, continuously reviewing corporate
vision, unifying corporate culture, and effectiveness of corporate vision.
Table 4.29: χ2 –Test on Corporate Vision Measures (n=114)
Value Df. Asmp. Sig
Pearson’s chi-square 975.016a 912 0.007
Likelihood Ration 458.593 912 1.000
Linear by linear association .427 1 0.513
N of value cases 114
a. 1001 cells (100%) have expected counts less than 5. The min expected count
is 0.01
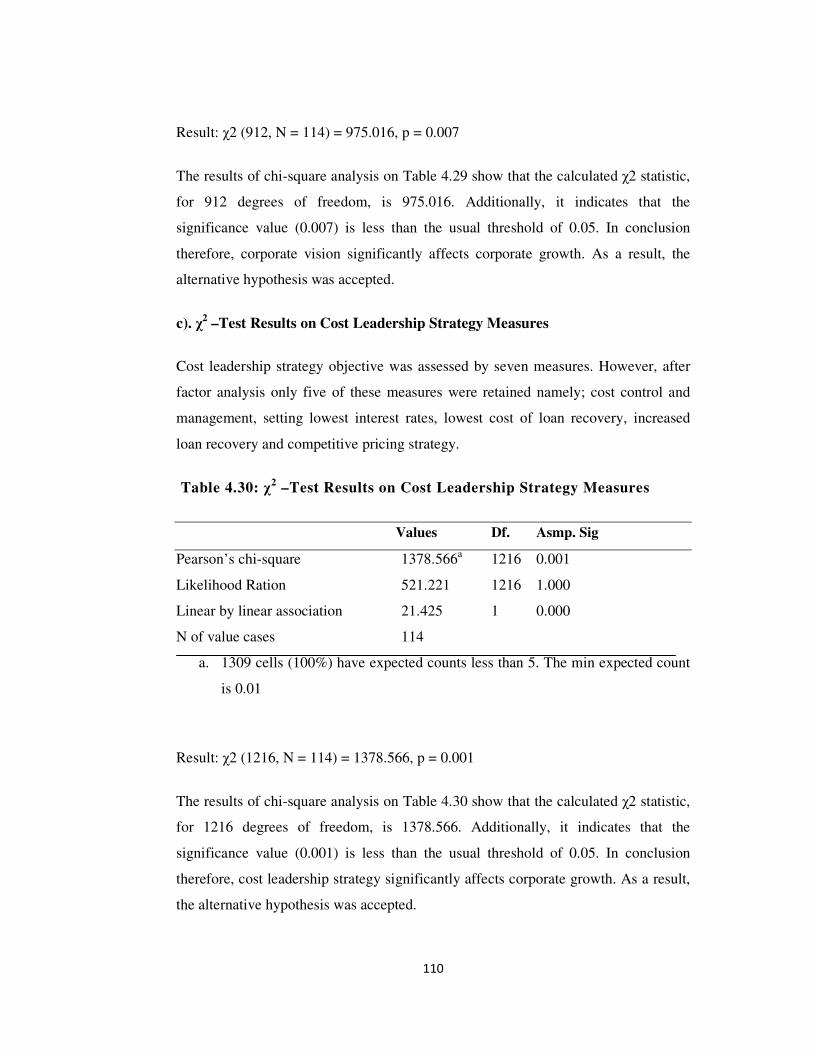
110
Result: χ2 (912, N = 114) = 975.016, p = 0.007
The results of chi-square analysis on Table 4.29 show that the calculated χ2 statistic,
for 912 degrees of freedom, is 975.016. Additionally, it indicates that the
significance value (0.007) is less than the usual threshold of 0.05. In conclusion
therefore, corporate vision significantly affects corporate growth. As a result, the
alternative hypothesis was accepted.
c). χ2 –Test Results on Cost Leadership Strategy Measures
Cost leadership strategy objective was assessed by seven measures. However, after
factor analysis only five of these measures were retained namely; cost control and
management, setting lowest interest rates, lowest cost of loan recovery, increased
loan recovery and competitive pricing strategy.
Table 4.30: χ2 –Test Results on Cost Leadership Strategy Measures
Values Df. Asmp. Sig
Pearson’s chi-square 1378.566a 1216 0.001
Likelihood Ration 521.221 1216 1.000
Linear by linear association 21.425 1 0.000
N of value cases 114
a. 1309 cells (100%) have expected counts less than 5. The min expected count
is 0.01
Result: χ2 (1216, N = 114) = 1378.566, p = 0.001
The results of chi-square analysis on Table 4.30 show that the calculated χ2 statistic,
for 1216 degrees of freedom, is 1378.566. Additionally, it indicates that the
significance value (0.001) is less than the usual threshold of 0.05. In conclusion
therefore, cost leadership strategy significantly affects corporate growth. As a result,
the alternative hypothesis was accepted.

111
d). χ2 –Test on Results Product Differentiation Strategy Measures
Differentiation strategy objective was assessed by seven measures and after factor
analysis all these measures were retained. The variables were; wide branch network,
grace payment period, customer service, mobile phone repayments, brand image,
product innovation and service differentiation.
Table 4.31: χ2 –Test Results on Differentiation Strategy Measures
Values Df. Asymp. sig
Pearson’s chi-square 1254.571a 912 0.000
Likelihood Ration 439.658 912 1.000
Linear by linear association 38.780 1 0.000
N of value cases 114
a. 1001 cells (100%) have expected counts less than 5. The min expected count
is 0.01.
Result: χ2 (912, N = 114) = 1254.571, p = 0.000
The results of chi-square analysis on Table 4.31 show that the calculated χ2 statistic,
for 1216 degrees of freedom, is 1378.566. Additionally, it indicates that the
significance value (0.001) is less than the usual threshold of 0.05. In conclusion
therefore, product differentiation strategy significantly affects corporate growth. As a
result, the alternative hypothesis was accepted.
e). χ2 –Test Results on Pooling Strategic Resources Measures
Pooling resources objective was assessed by seven measures but after factor analysis
these measures were reduced to six. The variables were; seeking complementary
resources, financial capital access, strategic networks, partnering with customers and
competitors, large strategic resource base and competitive sources of capital.
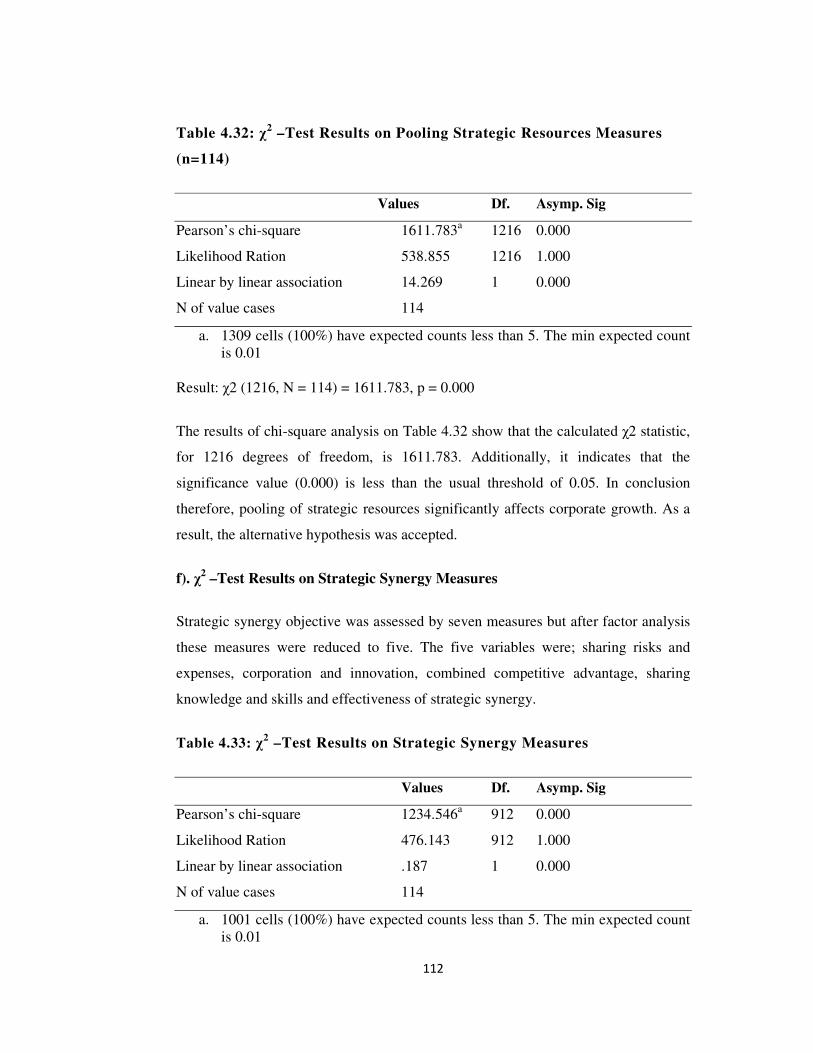
112
Table 4.32: χ2 –Test Results on Pooling Strategic Resources Measures
(n=114)
Values Df. Asymp. Sig
Pearson’s chi-square 1611.783a 1216 0.000
Likelihood Ration 538.855 1216 1.000
Linear by linear association 14.269 1 0.000
N of value cases 114
a. 1309 cells (100%) have expected counts less than 5. The min expected count
is 0.01
Result: χ2 (1216, N = 114) = 1611.783, p = 0.000
The results of chi-square analysis on Table 4.32 show that the calculated χ2 statistic,
for 1216 degrees of freedom, is 1611.783. Additionally, it indicates that the
significance value (0.000) is less than the usual threshold of 0.05. In conclusion
therefore, pooling of strategic resources significantly affects corporate growth. As a
result, the alternative hypothesis was accepted.
f). χ2 –Test Results on Strategic Synergy Measures
Strategic synergy objective was assessed by seven measures but after factor analysis
these measures were reduced to five. The five variables were; sharing risks and
expenses, corporation and innovation, combined competitive advantage, sharing
knowledge and skills and effectiveness of strategic synergy.
Table 4.33: χ2 –Test Results on Strategic Synergy Measures
Values Df. Asymp. Sig
Pearson’s chi-square 1234.546a 912 0.000
Likelihood Ration 476.143 912 1.000
Linear by linear association .187 1 0.000
N of value cases 114
a. 1001 cells (100%) have expected counts less than 5. The min expected count
is 0.01

113
Result: χ2 (912, N = 114) = 1234.546, p = 0.000
The results of chi-square analysis on Table 4.33 show that the calculated χ2 statistic,
for 912 degrees of freedom, is 1234.546. Additionally, it indicates that the
significance value (0.000) is less than the usual threshold of 0.05. In conclusion
therefore, strategic synergy significantly affects corporate growth. As a result, the
alternative hypothesis was accepted.
4.8.2 Correlation Results
Correlation refers to a technique used to measure the relationship between two or
more variables. When two variables are correlated, it means that they vary together.
Positive correlation means that high values on one variable are associated with high
values on the other, and that low values on one are associated with low values scores
on the other (Struwig & Stead, 2013). The interpretation of correlation, needs four
types of information; correlation coefficient value, correlation coefficient sign,
correlation significance, and correlation effective size. Correlation coefficient value
is a numerical number between 0.0 and 1.0. The closer the correlation is to 1.0, the
stronger the relationship between the two variables. The sign of the correlation
coefficient means either a positive or negative correlation coefficient. The positive
correlation coefficient means that the variables move in the same direction, while
negative correlation means variables move in opposite directions. The correlation
significance is indicated by a probability value of less than 0.05. This means that the
probability of obtaining such a correlation coefficient by chance is less than five
times out of 100, so the result indicates the presence of a relationship. Finally, the
correlation effective size is the coefficient of determination and is defined as r2. The
coefficient of determination can vary from 0 to 1.00 and indicates that the proportion
of variation in the values can be predicted from the relationship between the two
variables.
Therefore, the study conducted correlation analysis and computed seven strategic
management determinants scales of; Grand Strategy, Corporate Vision, Cost
Leadership, Product Differentiation, Resource Pooling, Strategic Synergy and

114
Corporate Growth on data for 114 respondents. The results suggested that 12 out of
21 correlations were positive and statistically significant and were greater or equal to
r(112) = 0.086, p < .01, two-tailed. 5 out of 21 correlations were positive and not
statistically significant and were greater or equal to r(112) = 0.028, p < .01, two-
tailed. One out of 21 correlations were negative and statistically significant and were
greater or equal to r(112) = -.375, p < .01, two-tailed. The other 3 out of 21
correlations of strategic management determinates were negative and statistically not
significant, and were less than r (112) =.-.091, p = ns, p<.01 two-tailed. In general,
the results suggested that, an increase of strategic management determinants
increases the corporate growth in MFIs in Kenya.
Table 4.34 summarizes the correlation output computed by SPSS Version 20 for
Strategic Management Determinates of Corporate Growth. In summary it can be
deducted that, the six variables of grand strategy, corporate vision, cost leadership
strategy, product differentiation strategy, pooling strategic resources and strategic
synergy had statistically significant relationship with corporate growth of the MFIs in
Kenya. It is worth noting that correlation can only indicate the presence or absence of
a relationship, not the nature of the relationship. Correlation is not causation. There is
always the possibility that a third variable may influence correlation results.
Therefore, other confirmatory tests such as regression should be conducted.
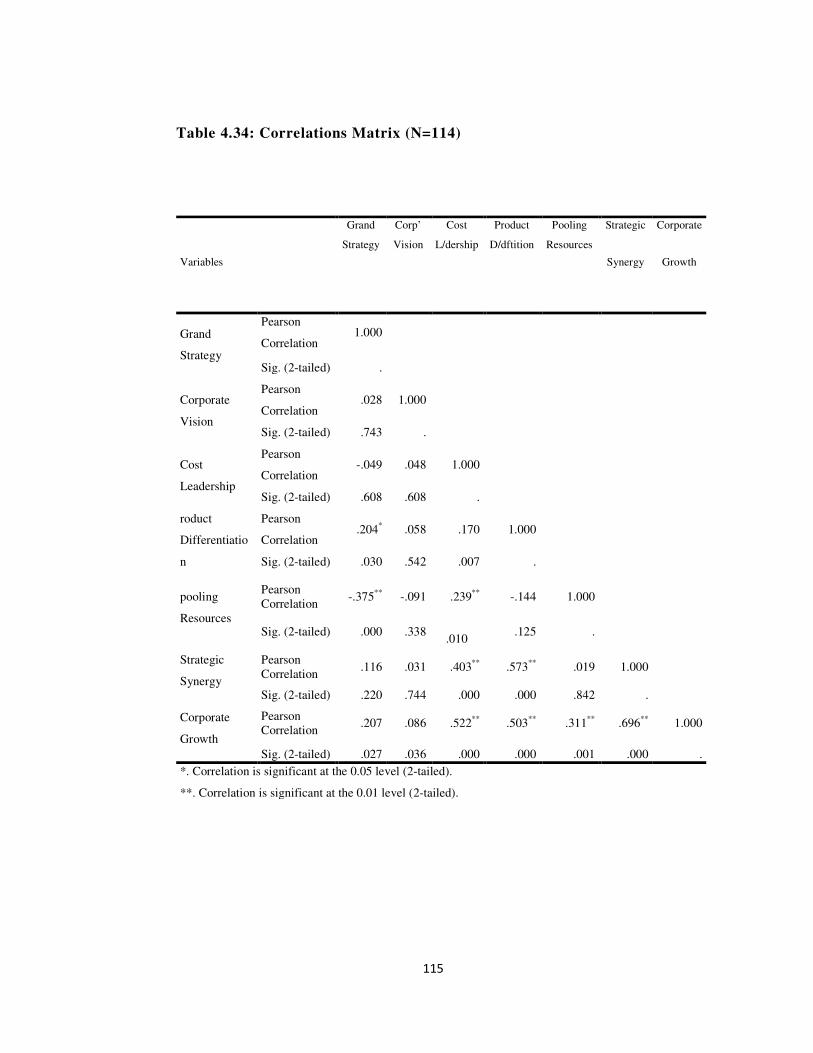
115
Table 4.34: Correlations Matrix (N=114)
Variables
Grand
Strategy
Corp’
Vision
Cost
L/dership
Product
D/dftition
Pooling
Resources
Strategic
Synergy
Corporate
Growth
Grand
Strategy
Pearson
Correlation 1.000
Sig. (2-tailed) .
Corporate
Vision
Pearson
Correlation .028 1.000
Sig. (2-tailed) .743 .
Cost
Leadership
Pearson
Correlation -.049 .048 1.000
Sig. (2-tailed) .608 .608 .
roduct
Differentiatio
n
Pearson
Correlation .204
* .058 .170 1.000
Sig. (2-tailed) .030 .542 .007 .
pooling
Resources
Pearson
Correlation -.375
** -.091 .239
** -.144 1.000
Sig. (2-tailed) .000 .338
.010 .125 .
Strategic
Synergy
Pearson
Correlation .116 .031 .403
** .573
** .019 1.000
Sig. (2-tailed) .220 .744 .000 .000 .842 .
Corporate
Growth
Pearson
Correlation .207 .086 .522
** .503
** .311
** .696
** 1.000
Sig. (2-tailed) .027 .036 .000 .000 .001 .000 .
*. Correlation is significant at the 0.05 level (2-tailed).
**. Correlation is significant at the 0.01 level (2-tailed).

116
4.8.3 Research Hypothesis Test
In this subsection, collineality and hypothesis tests were done and reported below.
a). Collinearity
Data normality, linearity and independence had been tested as shown in tables 4.16,
4.17, and 4.18 respectively. Thus, testing collinearity was necessary. In order the
data to meet the assumption of collinearity, the study evaluated the Coefficients as
shown in Table 4.35 in the regression analysis output results. The interpretations of
the heading Collinearity Statistics, under which are two subheadings, Tolerance
and VIF (Variance Inflation Factor) are analyzed. If the VIF value is greater than 10,
or the Tolerance is less than 0.10, then one have concerns over multi-collinearity.
Otherwise, one’s data has met the assumption of collinearity. The study tested to see
if the data met the assumption of collinearity, the results indicated that multi-
collinearity was not a concern (Grand Strategy, Tolerance = .715, VIF = 1.398;
Corporate Vision, Tolerance = .060, VIF = .974; Cost Leadership Vision, Tolerance
= .248, VIF = .747; Product Differentiation, Tolerance = .318, VIF = .418; Resource
Pooling, Tolerance = .296, VIF = .645; Strategic Synergy, Tolerance = .349, VIF =
.359).
Table 4.35: Collinearity Coefficients
Unstandardized Standardized Collinearity statistics
Coefficients Coefficients
Variables Beta Std. Error Beta Tolerance VIF t p
(Constant) .921 .202 4.562 .000
Grand Strategy .067 .025 .174 .715 1.398 2.621 .000
Corporate Vision .023 .021 .060 .974 1.026 1.049 .279
Cost Leadership .105 .027 .248 .747 1.339 3.827 .010
Product Differentiation .184 .050 .318 .418 2.390 3.672 .000
Resource Pooling .122 .029 .296 .645 1.551 4.234 .000
Strategic Synergy .170 .0436 .349 .359 2.786 3.724 .000

117
b). Hypotheses Decisions
In this subsection, the hypotheses test results were explained.
1. Hypothesis One
HO1: Grand strategy has no significant effect on the growth of Micro Finance
Institutions in Kenya.
HA1: Grand strategy has a significant effect on the growth of Micro Finance
Institutions in Kenya.
HO1 postulates that grand strategy has no significant effects on corporate growth of
microfinance institutions in Kenya, while HA1 postulates that grand strategy has a
significant effect on corporate growth of microfinance institutions in Kenya. The
results in table 4.35 failed to provide support for HO1 hence the HO1 was rejected and
instead the HA1 was accepted. Therefore, grand strategy was found to have a
statistically significant effects on corporate growth in MFIs in Kenya (β = 0.174; t =
2.621; p < 0.05).
2. Hypothesis Two
HO2: Corporate vision has no significant effect on the growth of Micro Finance
Institutions in Kenya.
HA2: Corporate vision has a significant effect on the growth of Micro Finance
Institutions in Kenya.
HO2 postulates that corporate vision has no significant effects on corporate growth of
microfinance institutions in Kenya, while HA2 postulates that corporate vision has a
significant effect on corporate growth of microfinance institutions in Kenya. The
results in table 4.35 failed to provide support for HA2 hence the HA2 was rejected and
instead the HO2 was accepted. Therefore, Corporate vision was found to have
statistically no significant effects on corporate growth in MFIs in Kenya (β = 0.060; t
= 1.049; p >0.05).
118
3. Hypothesis Three
HO3: Cost leadership strategy has no significant effect on the growth of Micro
Finance Institutions in Kenya.
HA3: Cost leadership strategy has a significant effect on the growth of Micro Finance
Institutions in Kenya.
HO3 postulates that Cost leadership has no significant effects on corporate growth of
microfinance institutions in Kenya, while HA3 postulates that Cost leadership has a
significant effect on corporate growth of microfinance institutions in Kenya. The
results in table 4.35 failed to provide support for HO3 hence the HO3 was rejected.
Therefore, cost leadership was found to have statistically significant effects on
corporate growth in MFIs in Kenya (β = 0.248; t =3.827; p < 0.05).
4. Hypothesis Four
HO4: Product differentiation strategy has no significant effect on the growth of Micro
Finance Institutions in Kenya.
HA4: Product differentiation strategy has a significant effect on the growth of Micro
Finance Institutions in Kenya.
HO4 postulates that product differentiation strategy has no significant effects on the
growth of Micro Finance Institutions in Kenya, while HA4 postulates that product
differentiation strategy has a significant effect on the growth of Micro Finance
Institutions in Kenya. The results in table 4.35 failed to provide support for HO4
hence the HO4 was rejected and instead the HA4 was accepted. Therefore, product
differentiation strategy was found to have statistically significant effects on corporate
growth in MFIs in Kenya (β = .318; t =3.672; p < 0.05).
119
5. Hypothesis Five
HO5: Pooling of strategic resources has no significant effect on the growth of Micro
Finance Institutions in Kenya.
HA5: Pooling of strategic resources has a significant effect on the growth of Micro
Finance Institutions in Kenya.
HO5 postulates that Pooling of strategic resources has no significant effects on the
growth of Micro Finance Institutions in Kenya, while HA5 postulates that product
differentiation strategy has a significant effect on the growth of Micro Finance
Institutions in Kenya. The results in table 4.35 failed to provide support for HO5
hence the HO5 was rejected and instead the HA5 was accepted. Therefore, product
differentiation strategy was found to have significant effects on corporate growth in
MFIs in Kenya (β = .296; t =4.234; p < 0.05).
6. Hypothesis Six
HO6: Strategic synergy has no significant effect on the growth of Micro Finance
Institutions in Kenya.
HA6: Strategic synergy has a significant effect on the growth of Micro Finance
Institutions in Kenya.
HO6 postulates that Strategic synergy has no significant effects on corporate growth
of microfinance institutions in Kenya, while HA6 postulates that Strategic synergy has
a significant effect on corporate growth of microfinance institutions in Kenya. The
results in table 4.35 failed to provide support for HO6 hence the HO6 was rejected and
instead the HA6 was accepted. Therefore, Strategic synergy was found to have
statistically significant effects on corporate growth in MFIs in Kenya (β = .349; t
=3.724; p < 0.05).
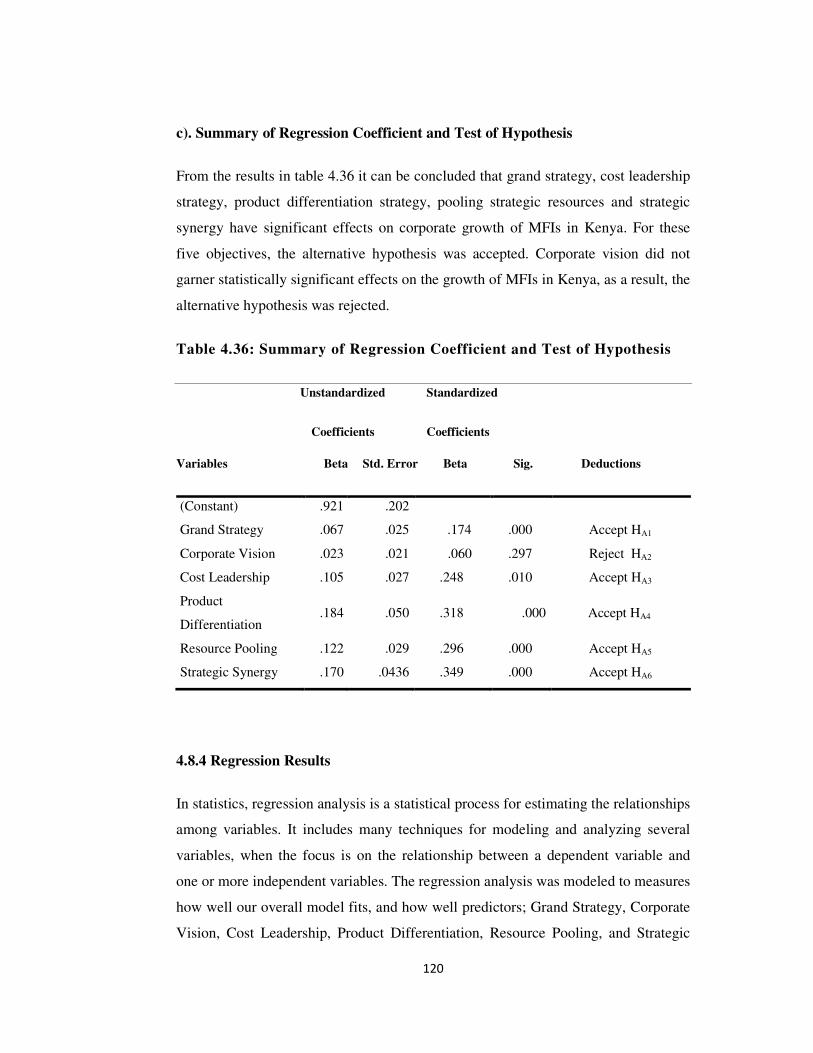
120
c). Summary of Regression Coefficient and Test of Hypothesis
From the results in table 4.36 it can be concluded that grand strategy, cost leadership
strategy, product differentiation strategy, pooling strategic resources and strategic
synergy have significant effects on corporate growth of MFIs in Kenya. For these
five objectives, the alternative hypothesis was accepted. Corporate vision did not
garner statistically significant effects on the growth of MFIs in Kenya, as a result, the
alternative hypothesis was rejected.
Table 4.36: Summary of Regression Coefficient and Test of Hypothesis
Unstandardized Standardized
Coefficients Coefficients
Variables Beta Std. Error Beta Sig. Deductions
(Constant) .921 .202
Grand Strategy .067 .025 .174 .000 Accept HA1
Corporate Vision .023 .021 .060 .297 Reject HA2
Cost Leadership .105 .027 .248 .010 Accept HA3
Product
Differentiation .184 .050 .318 .000 Accept HA4
Resource Pooling .122 .029 .296 .000 Accept HA5
Strategic Synergy .170 .0436 .349 .000 Accept HA6
4.8.4 Regression Results
In statistics, regression analysis is a statistical process for estimating the relationships
among variables. It includes many techniques for modeling and analyzing several
variables, when the focus is on the relationship between a dependent variable and
one or more independent variables. The regression analysis was modeled to measures
how well our overall model fits, and how well predictors; Grand Strategy, Corporate
Vision, Cost Leadership, Product Differentiation, Resource Pooling, and Strategic

121
Synergy, are able to predict Corporate Growth. The linear regression analysis
modeled the relationship between the dependent variable (Corporate Growth) and
independent variables (Grand Strategy, Corporate Vision, Cost Leadership, Product
Differentiation, Resource Pooling, and Strategic Synergy).
4.8.5 Overall Goodness-of-Fit
The regression model summary gives the measures of how well one’s overall model
fits, and how well predictors; Grand Strategy, Corporate Vision, Cost Leadership,
Product Differentiation, Resource Pooling, and Strategic Synergy, are able to predict
Corporate Growth. The first measure in the Table 4.37 below is called R. This is a
measure of how well predictors predict the outcome, but the study needed to take the
square of R (R2) to get a more accurate measure. This gives the study the amount of
variance in corporate growth explained by the independent variables or predictors.
The R2 varies between 0 and 1. In the study R = .664, representing a 66.4% of the
variance in Corporate Growth can be explained by the predictor variables above,
although this does not imply causality. The final column gives us the standard error
of the estimate. This is a measure of how much R is predicted to vary from one
sample to the next. The R2 is a statistic used in the context of statistical
models whose main purpose is either the prediction of future outcomes or the testing
of hypotheses, on the basis of other related information. An R2 = 1 indicates that the
regression line perfectly fits the data. In Table 4.38 below, an R2 = .664 indicates that
the regression line moderately fits the data. Using the enter method it was found that
the strategic management determinates explain a significant amount of the variance
in the value of Corporate Growth (F(6, 107) = 35.165, p < .05, R2 = .664,
R2Adjusted = .645).
Table 4.37: Model Summary
Model R R Square Adjusted R
Square
Std. Error of
the Estimate
1 .815a .664 .645 .16222

122
4.8.7 Multiple Regression Results of Strategic Management Determinants on
Corporate Growth
A multiple regression was conducted to see if Strategic Management Determinants
(Grand Strategy, Corporate Vision, Cost Leadership, Product Differentiation,
Resource Pooling, and Strategic Synergy) predicted the Corporate Growth in MFIs in
Kenya. Table 4.39 shows the coefficients of Multiple Regression.
Table 4.39: Multiple Regression Coefficients
Unstandardized Standardized
Coefficients Coefficients
Variables Beta Std. Error Beta T Sig.
(Constant) .921 .202 4.562
Grand Strategy .067 .025 .174 2.621 0.000
Corporate Vision .023 .021 .060 1.049 0.297
Cost Leadership .105 .027 .248 3.827 0.010
Product
Differentiation .184 .050 .318 3.672 0.000
Resource Pooling .122 .029 .296 4.243 0.000
Strategic Synergy .170 .0436 .349 3.724 0.000
From table 4.40, the regression equation was formulated as follows:
Y = 0.921+ 0.067X1 + 0.023X2+ 0.105X3 + 0.184X4 + 0.122 X5 + 0.170X6
Regression coefficients represent the mean change in the dependent variable for one
unit of change in the predictor variable while holding other predictors in the model
constant. This statistical control that regression provides is important because it
isolates the role of one variable from all of the others in the model. The regression
coefficient is the slope of the regression line. It gives the information for writing the
regression equation. The slope is how steep the line regression line is. A slope of 0 is

123
a horizontal line, a slope of 1 is a diagonal line from the lower left to the upper right,
and a vertical line has an infinite slope. The intercept is where the regression line
strikes the Y axis when the independent variable has a value of 0. The study had six
predictor variables (Grand Strategy, Corporate Vision, Cost Leadership, Product
Differentiation, Resource Pooling, and Strategic Synergy). Therefore, a linear
regression model with six predictor variables can be expressed with the following
equation:
Y = β0 + β1X1 + β2X2 + β3X3 + β4X4 + β5X5 + β6X6 + e.
The variables in the model are Y, the dependent variable (Corporate Growth); X1, the
first predictor variable (Grand Strategy); X2, the second predictor variable (Corporate
Vision); X3, the third predictor variable (Cost Leadership); X4, the fourth predictor
variable (Product Differentiation); X5, the fifth predictor variable (Resource
Pooling); X6, the sixth predictor variable (Strategic Synergy); and e, the residual
error, which is an unmeasured variable. The parameters in the model are β0, the Y-
intercept (Constant = .921); β1, the first regression coefficient (Grand Strategy =
.067); β2, the second regression coefficient (Corporate Vision = .023); β3, the third
regression coefficient (Cost Leadership = .105); β4, the fourth regression coefficient
(Product Differentiation = .184); β5, the fifth regression coefficient (Resource
Pooling = .122); and β6, the sixth regression coefficient (Strategic Synergy = .170).
The study modeled Corporate Growth (Y) based on the strategic management
determinants in the Grand Strategy (X1), Corporate Vision (X2), Cost Leadership
(X3), Product Differentiation (X4), Resource Pooling (X5), and Strategic Synergy
(X6).
a). Interpreting the Intercept (β0)
The Y-intercept (β0), can be interpreted as the value one would predict for Y if X1 =
0,X2 = 0, X3 = 0, X4 = 0, X5 = 0, and X6 = 0. The study would expect the Corporate
Growth to be 0.921. However, this is only a meaningful interpretation if it is
reasonable that if X1 = 0, X2 = 0, X3 = 0, X4 = 0, X5 = 0, and X6 = 0, and if the
dataset actually included values for if X1, X2, X3, X4, X5, and X6 that were near 0. If

124
neither of these conditions is true, then β0 really has no meaningful interpretation. It
just anchors the regression line in the right place.
b). Interpreting Coefficients of Categorical Predictor Variables
Similarly, B1 is interpreted as the difference in the predicted value in Y for each one-
unit difference in X1, if X2, X3, X4, X5, and X6 remains constant. However, since X1
is a categorical variable coded as;1 = “No Extend”, 2 = “Small Extend”, 3 =
“Moderate Extend”, 4 = “Great Extend” and 5 = “Greatest Extend therefore, a one
unit difference represents switching from one category to the other. B1 is then the
average difference in Y between the category for which X1 = 1 (the reference group)
and the category for which X1 = 2, X1 = 3, X1 = 4, or X1 = 5, (the comparison
group). Therefore, the study compared a one unit increase to Grand Strategy while
the rest of the variables = 0, then study would predict the Corporate Growth to as
shown below.
Y = 0.921 + 0.067(1) + 0.023(0)+ 0.15(0)+ 0.184(0)+ 0.122(0)+ 0.170(0) then
Y = 0.921 + 0.067= .988
4.9 Discussions of the Key Findings as Per Objective
This section discusses the key research findings presented in the previous sections
based on the objectives and hypothesis of the study. The general objective of the
study was to establish the strategic management determinants of corporate growth in
selected MFIs in Kenya. The six specific objectives and thus the six variables under
study were; grand strategy, corporate vision, cost leadership strategy, differentiation
strategy, pooling of strategic resources and strategic synergy. The summary of key
findings as per each objective has been presented as follows;
4.9.1 Effects of Grand Strategy on Corporate Growth
The findings revealed a statistically significant positive relationship exists between
grand strategy and corporate growth. This implies that if grand strategy is deployed
in MFIs, corporate growth increases. Hill and Jones (2012) points out that the grand

125
strategy helps to exercise the choice of direction of an organization and derive a
competitive advantage for the firm. Thus, the role of grand strategy is to coordinate
and direct all the resources of a firm towards the attainment of its goals and
objectives. These findings are consistent with Porter (2008) who noted that through
competitive techniques and tactics growth is achieved.
4.9.2 Effects of Corporate Vision on Corporate Growth
The results indicate a positive though not statistically significant relationship
between corporate vision and corporate growth. This implies that a good corporate
vision may be a weak determinant of corporate growth. This is supported by Johnson
et al. (2008), who say that corporate vision is an essential factor in building scalable
organizations that last for the long haul and reveals how companies can stay their
course, even as they grow. It unifies the organization and thus directly influences
corporate growth.
4.9.3 Effects of Cost Leadership Strategy on Corporate Growth
The findings revealed that there is a statistically strong positive relationship between
cost leadership strategy and corporate growth in MFIs. This implies that if firms
engage cost leadership strategy, corporate growth increases. However, to succeed in
cost leadership strategy and still achieve profitability and high return on investment,
a firm must be able to operate at a lower cost than its rivals. This can be achieved
through high asset turnover, low operating costs and control over the
supply/procurement chain to ensure low costs. These findings are consistent with
Porter (2004) who found out that sustained cost leadership strategy leads to
competitive positioning, which then leads to corporate growth. These findings are in
tandem with overall cost leadership strategy as most MFIs customers tent to be price
sensitive (Valipour et al., 2012).
4.9.4 Effects of Product Differentiation Strategy on Corporate Growth
The findings revealed a statistically significant positive relationship between product
differentiation strategy and corporate growth. This implies that if MFIs immensely

126
increase product differentiation, corporate growth increases. This basically
encourages MFIs managers to highly differentiate their products and services. Worth
noting is that firms that succeed in differentiation strategy have critical internal
strengths that can cover for the high prices of differentiation. Johnson et al. (2008)
post that differentiation strategy is appropriate when the customers are not price-
sensitive, market is competitive and saturated, customers have specific needs that are
under served, and the firm has unique resources and capabilities that are unique to
copy.
4.9.5 Effects of Pooling of Strategic Resources on Corporate Growth
The findings revealed a positive statistically significant relationship between pooling
of strategic resources and corporate growth. This implies that as MFIs immensely
increase pooling of strategic resources, corporate growth increases. The presence of a
large base of resources allows an organization to outlast competitors by sharing risks
and expenses. Synergy is derived from technology transfer, economic specialization,
shared expenses and risk. Through synergy, firms enjoy mutual benefits. In fact,
synergistic organizations achieve more as a group than each firm could in isolation.
Thus, partners benefit from the synergistic connection in ways that neither could
alone. It is this bundle of benefits that leads to corporate growth (Cobb & Davis,
2010).
4.9.6 Effects of Strategic Synergy on Corporate Growth
The findings revealed a positive statistically significant relationship between
strategic synergy and corporate growth. This implies that as MFIs immensely
increase strategic synergy, corporate growth increases. Gaddis, (2005), supports the
idea and points out that in practice; strategic synergy is expected to bring benefits
greater to the parties than individual strategies. This is achieved from valuable, rare,
in imitable, interchangeable and intangible assets, resources and capabilities of the
firm. It is this bundle of benefit that lead to competitive advantage which in return
leads to corporate growth (Cobb & Davis, 2010).
127
CHAPTER FIVE
SUMMARY, CONCLUSIONS AND RECOMMENDATIONS
5.1 Introduction
This chapter serves to demonstrate the achievements of the objectives of the study
and presents in brief the results of these efforts. This is based on the results of 114
respondents out of 160 respondents targeted. Thereafter, the conclusions,
recommendations and suggestions for further research are also included.
5.2 Summary as per Objective
This section summarizes the findings in each objective.
a). The Effects of Grand Strategy on Corporate Growth
The study found out that grand strategy positively and statistically significantly
affected corporate growth in MFIs in Kenya. From the findings, continuously
monitoring grand and strategy were the highest contributors to corporate growth.
The key roles of grand strategy are to co-ordinate and direct all the resources of a
firm towards the attainment of its goals and objectives - it is a statement of strategic
action. A grand strategy states the means that will be used to achieve long-term
objectives. Grand strategies provide basic direction for strategic actions. They are the
basis of coordinated and sustained efforts directed toward achieving long-term
business objectives. Basically, apart from just having grand strategies, managers
must make sure that grand strategies are effectively and efficiently communicated
and closely and continuously monitored in the course of the MFIs operations.
b). The Effects of Corporate Vision on Corporate Growth
The study found out that corporate vision did not significantly affect corporate
growth of MFIs in Kenya. A unifying corporate culture, communication of corporate
vision and institutionalization of corporate vision were key contributors to the effects
of corporate vision on corporate growth. A company's vision should describe a future

128
that is more attractive than the present and unifies the organization through a sense of
togetherness. Even though all the firms studied had a working corporate vision, their
contribution to corporate growth was neglible.
c). The Effects of Cost Leadership Strategy on Corporate Growth
The study found out that cost leadership strategy had a positive statistically
significant effect on corporate growth in MFIs. Setting lowest interest rates,
increased loan recovery and lowest costs in loan recovery topped as key contributors
of cost leadership strategy. Cost leadership is often driven by company efficiency,
size, scale, scope and cumulative experience (learning curve). To succeed at offering
the lowest price while still achieving profitability and a high return on investment,
the firm must be able to operate at a lower cost than its rivals. Therefore, managers
need to be cost conscious by being cost leaders in industry as most MFIs customers
tend to be cost conscious.
d). The Effects of Differentiation Strategy on Corporate Growth
The study found out that differentiation strategy had a positive statistically
significant effect on corporate growth in MFIs. Service differentiation, brand image
and mobile repayments were key contributors to firm differentiation. When using
differentiation strategy, a firm needs to focus its efforts on providing a unique
product or service. Since, the product or service is unique this strategy provides high
customer loyalty. Product differentiation fulfills a customer need and involves
tailoring the product or service to the customer. Differentiation overlast competitors
and therefore managers must ensure their firms are well differentiated so as to remain
competitive.
e). The Effects of Pooling Strategic Resources on Corporate Growth
The study found out that pooling strategic resources had a positive statistically
significant effect on corporate growth in MFIs. Increased financial capital access,
creating strategic resource base, and seeking complementary resources were key
contributors to corporate growth in MFIs. Through pooling of strategic resources,
129
strategic partners are able to enter new markets with little investment, be more
effective, drive cost benefits or leverage strengths, and be more competitive. As a
result, MFI managers need to encourage partnerships with other players in the
industry to help create a pool of strategic resources that benefit all partners.
f). The Effects of Strategic Synergy on Corporate Growth
The study found out that strategic synergy had a positive statistically significant
effect on corporate growth in MFIs. Sharing risks and expenses, sharing knowledge
and skills and effectiveness of strategic partnerships were key contributors of
corporate growth in MFIs. In effect, firms taking advantage of strategic partnerships
can utilize other company's strengths to make both firms stronger in the long run.
Strategic partnerships have the potential to address challenges and opportunities that
could not have been handled in the same way outside of a partnership. As a result
managers are challenged to cultivate strategic synergy in their partnerships with other
firms.
5.3 Conclusions
The conclusions were based on the objectives of the study that strategic management
determinants had significant effects on corporate growth in MFIs. The results
established that strategic management determinants were found to significantly and
positively affect corporate growth. It was concluded that MFIs needed to fully
embrace strategic management determinants in order to achieve sustainable
competitive advantage, which in turn leads to corporate growth. Specifically;
Based on grand strategy, this study concludes that an increase in grand strategy
deployment increases corporate growth of in MFIs in Kenya. Grand strategy had a
positive significant relationship with corporate growth. On corporate vision, this
study concludes that corporate vision had the least significant effect on corporate
growth. Crafting good vision statement and institutionalizing it increases corporate
growth. Cost leadership strategy had insignificant effect on corporate growth in MFIs
in Kenya. Product differentiation strategy was the highest determinant of corporate
growth of MFIs in Kenya. Increased product differentiation pays off as corporate
130
growth increases. On pooling strategic resources, this study concludes that pooling of
strategic resources increases corporate growth of MFIs.
Lastly, this study concludes that strategic synergy is a key contributor of corporate
growth. Strategic synergy builds on strengths of partners to increase corporate
growth. The five key strategic management determinants; viz grand strategy, cost
leadership, product differentiation strategy, pooling strategic resources and strategic
synergy were consistently found to have a great role in the corporate growth in MFIs
in Kenya. The extent of their effects on corporate growth from the strongest is;
strategic synergy, product differentiation strategy, pooling strategic resources, cost
leadership strategy, grand strategy and lastly corporate vision. Basically, with these
variables improved, corporate growth increases profusely.
5.4 Recommendations
Based on the study findings and the conclusions drawn, the following
recommendations were made;
5.4.1 Managerial Recommendations
On grand strategy, MFIs managers should formulate, institutionalize, communicate
and continuously monitor their grand strategy. Grand strategy formulation and
communication is seen as a key factor in corporate growth as it binds the
organization together thus having a strategic focus. Grand strategy helps to exercise
the choice of direction that an organization adopts as a whole as it is primarily about
the choice of the tactics and techniques for the firm as a whole and managing various
product lines and business units for maximum value. Managers of MFIs should
facilitate drafting of clear visions, institutionalize, communicate and continuously
monitor and review progress of their corporate visions.
On cost leadership, managers should focus on good cost management practices in
addition to setting low interest rates to derive competitiveness. Cost leadership
strategy is an integrated set of action taken to produce goods or services with features
that are acceptable to customers at the lowest cost, relative to that of competitors. It
131
tends to be more competitors oriented rather than customer oriented. Managers
should pursue cost reduction, tight cost and overhead control to achieve a low cost
position. Product differentiation is key to corporate growth. Managers should create,
protect and maintain differentiated products and services in order to be competitive
in industry.
Managers need to encourage their firms to partner with others in industry so as to
share and benefit from each other thus creating competitive advantage for all
partners. MFIs Managers should create, amerce and maintain strategic synergy
within their MFIs and even between competitors. Strategic partnerships aim at
amercing strategic synergy and creating synergistic solutions where each partner
hopes that the benefits from the partnerships will be greater than those from
individual efforts.
5.4.2 Policy Recommendations
Policy makers should find out ways of crafting, institutionalizing and communicating
grand strategies to increase corporate growth of MFIs in Kenya. This will go a long
way in increasing corporate growth. The government of Kenya should enhance the
CBK controlling unit to ensure MFIs formulate grand strategies and make sure these
grand strategies are followed to create corporate growth. Policy makers should find
out ways of reducing operating costs of MFIs in Kenya; especially the cost of capital.
This being a key cost center in operations, if properly addressed will go a long way
to help the industry. Further, the government of Kenya should find ways of reducing
operating costs of MFIs in Kenya. This can be done through tax subsidies amid
providing affordable financial capital through affordable interest rates. Moreover, the
government should make a greater effort to create a meaningful and comprehensive
policy to improve the country's financial business climate, which is currently not
very conducive to the development of the private sector. The government should
improve MFIs access to affordable financing especially by reducing the base lending
rate and ensuring there is financial deepening. Policy makers should find ways of
encouraging MFIs to create and maintain differentiation of their products and
services, and formulate ways of guiding the MFIs to create, amerce and sustain

132
competitive advantage. Bilateral cooperation should be encouraged and undertaken
between MFIs in Kenya to help create strategic synergy especially on technology
transfer and pooling capital base which will provide affordable sources of finance.
5.5 Areas for Further Research
The main objective of this study was to establish the strategic management
determinants of corporate growth of selected MFIs in Kenya. This study
recommends that a further study should be carried out to establish the specific effects
of corporate vision on corporate growth. Secondly, further research should be done
to examine the effect of strategic management determinants on corporate growth in
other industries, sectors and subsectors both in the private and public domain
especially on the competitive sectors like the Small and Medium sized Enterprises,
the manufacturing sector and the education sector.
133
REFERENCES
Abuzaid, A. (2014) The Impact of Strategic Alliance Partner Characteristics on
Firms’ Innovation: Evidence from Jordan. International Journal of
Business and Management; 9(3), 77-87.
Aggarwal, P. (2012). Corporate growth determinants in India: An empirical study.
Delhi: LAP Lambert Academic Publishing.
Akotch, W. F. & Munyoki, J. M. (2016). Determinants of growth in the banking
industry in Kenya. African journal of marketing management, 8(1), 1-
11.
Ala, M. O. & Ngugi, P. K. (2013). Influence of mobile banking on growth of Micro
Finance Institutions in Kenya. International Journal of Social Science
and Entrepreneurship, 1(2), 132-151.
Allaire, V., Ashta, A., Karuna, K. & Laurence, A. (2009). Institutional analysis to
explain the success of Morrocan microfinance institutions. Retrieved
from: http://difusion.ulb.ac.be.
Ansoff, I. (2007). Strategic Management. Classic Edition. New York: Palgrave
Macmillan.
Atikiya, R., Mukulu, E., Kihoro, J., & Waiganjo, E., (2015). Effect of cost
leadership strategy on the performance of manufacturing firms in Kenya.
Strategic Journals. 2(8), 134-143.
Barney, J.B. & Hesterly, W.S. (2006). Strategic Management and Competitive
Advantage Concepts and Cases: Saddle River: Pearson/Prentice-Hall.
Baum, J. & Wally, S. (2003). Strategic decision speed and firm performance.
Strategic Management Journal, 24(11), 1107-1129.
134
Bigsten, A. & Gebreeyesus, M (2007). The small, the young and the productive. The
determinants of manufacturing firm growth in Ethiopia. Retrieved
from:http://www.journals.uchicago.edu/cgi-bin/resolve
Bouazza, A., Diabate, A. & Abada, O., (2015). Establishing the Factors Affecting the
Growth of Small and Medium-sized Enterprises in Algeria. American
International Journal of Social Science, 4(2), 101-115.
Bowen, G. (2005). Preparing a qualitative research-based dissertation: Lessons
learned. The Qualitative Report, 10(2), 208-222.
Bryman, A. (2012). Business research methods (4th
ed.). Oxford: Oxford University
Press.
Canals, J., (2000). Managing corporate growth. Oxford: Oxford University Press.
Central Bank of Kenya, (2010). Kenya Finance Directory. Nairobi: Government
Printer.
Coad, A. (2009). The growth of firms: A survey of theories and empirical evidence.
Cheltenham: Edward Elgar Publishing.
Coad, A., Daunfeldt, S., Hölzl, W., Johansson, D. & Nightingale, P. (2014) High
growth firms: introduction to the special section. Industrial and
Corporate Change. 23(1), 91-112.
Collins, J., & Porras, J.(2004). Built to Last: Successful Habits of Visionary
Companies. New York: Harper Collins Publishers.
Colombelli, A., Krafft, J., & Quatraro, F. (2014). High growth firms and
technological knowledge: Do gazelles follow exploration or exploitation
strategies?. Industrial and Corporate Change. 23(1), 50-62.
Cooper, D. R., & Schindler, P. S. (2013). Business Research Methods. New York:
McGraw-Hill/Irwin.
135
Cozby, P. (2008), Methods in Behavioral Research. New York: McGraw-Hill.
Cressy, R. (2009). Determinants of small firm survival and growth. The Oxford
handbook of Entrepreneurship. Oxford: Oxford Press.
Creswell, J. (2013). Research design: Qualitative, quantitative and mixed methods
approaches. (4th
ed.). New Delhi: Sage Publications.
Crook, T., Ketchen Jr., D., Combs, J., & Todd, S. (2008). Strategic resources and
performance: A meta-analysis. Strategic Management Journal, 29(3),
1141-1154.
Cui, A. S., & O’Connor, G. (2012). Alliance Portfolio Resource Diversity and Firm
Innovation. Journal of Marketing, 76(4), 24–43.
Dada, A., Ahmad, N. & Bello, Z. (2015) The Synergistic-Strategy as an Effective
Management tool for Corporate Growth and Development. Journal of
Business and Management, 7(3), 5-31.
Darbi, K. & Phanuel, W. (2012). "Of Mission and Vision Statements and Their
Potential Impact on Employee Behaviour and Attitudes: The Case of A
Public But Profit-Oriented Tertiary Institution. International z Journal of
Business and Social Science, 3(14), 15-26.
Davidsson, P, Delmar, F, & Wiklund, J. (2006). Entrepreneurship and the growth of
firms. Cheltenham: Edward Elgar Publishing.
Davidsson, P., Kirchhoff, B., Hatemi, J. & Gustavsson, H. (2002). Empirical analysis
of business growth factors using Swedish data. Journal of Small Business
Management, 40(4), 332-349.
Davis, G. & Cobb, J. (2010). Resource dependence theory: Past and future. Bingley:
Emerald Group Publishing Limited.

136
De Jorge, J. & Castillo, L. (2011). Corporate growth, age and ownership structure:
Empirical evidence in Spanish firms. Journal of Business Economics and
Management, 12(1), 164-196.
De Waal, A. (2010). The Characteristics of a High Performance Organization, Social
Science Research Network, Retrieved from: http://ssrn.com/
Delen, D., Kuzey, C., & Uyar, A. (2013). Measuring firm performance using
financial ratios: Adecision tree approach. Expert Systems with
Applications, 40(10), 3970-3983.
Delmar, F. (2006). Measuring growth: Methodological considerations and empirical
results, entrepreneurship and the growth of firms. Cheltenham: Edward
Elgar Publishing.
Delmar, F., Davidsson, P. & Gartner, W. (2003). Arriving at the high-growth firm.
Journal of Business Venturing, 18(2), 189-216.
Drees, J. & Heugens, P. (2013). Synthesizing and extending resource dependence
theory: A meta-analysis. Journal of Management, 39(2), 1666-1698.
Eisinga, R., Te Grotenhuis, M., & Pelzer, B. (2013). The reliability of a two-item
scale: Pearson, Cronbach or Spearman-Brown? International Journal of
Public Health, 58(4), 637–642.
Enz, C.A (2008). Creating a competitive advantage by building resource capability.
Cornell Hospitality Quarterly, 4(1), 73-78.
Evangelia, P. & Bassima, C. (2002). Growth determinants of micro-businesses in
Canada. Retrieved from: http://publications.gc.ca/pub
Freel, M. & Robson, P. (2004). Small firm innovation, growth and performance.
Evidence from Scotland and Northern England. International Small
Business Journal, 22(6), 561-575.
137
Gaddis, J. (2005). Strategies of containment. Oxford: Oxford University Press.
Gamble, J. (2011). Essentials of Strategic Management (2nd
ed).New York: Richard
Irwin.
Garnsey, E., Stam, E. & Heffernan, P. (2011). New firm growth: Exploring processes
and paths. Industry and Innovation, 13(1), 1-20.
Gibrat, R. (1931). Les in´egalit´es ´economiques. Paris: Librairie du Receuil Sirey.
Gitau W, J. & Wanjau L, K. (2013). Factors Affecting the growth of Insurance
Brokerage Firms in Kenya Survey of Insurance Brokerage Firms in
Nairobi, International Journal of Social Science and Entrepreneurship,
1(2), 245-259.
Grant, R. (2008). The resource-based theory of competitive advantage: Implications
for strategy formulation. California Management Review, 33, 114-135.
Greiner, L. (1998). Evolution and Revolution as Organizations Grow. Harvard
Business Review, 76(3), 55-68.
Gupta, P., Guha, S. & Krishnaswami, S. (2013). Firm growth and its determinants.
Journal of Innovation and Entrepreneurship, 2(15), 1-15.
Headd, B. & Kirchhoff, B. 2007: Small business growth: Searching for stylized facts.
Retrieved from: http://www.sba.gov/advo/./s/sol/wpaper
Hermelo, F. & Vassolo, R. (2007). The determinants of firm’s growth: An empirical
examination. Retrieved from: http://ideas.repec.org/s/pch/abante
Hill, C. & Jones, G., (2012). Strategic management theory, An integrated approach.
(10th
ed.). Mason: Wiley India.
Hillman, A., Withers, M. & Collins, B. (2009). Resource dependence theory: A
review. Journal of Management 35(6), 1404-1427.
138
Hitt, M., Ireland, R. & Hoskisson, R. (2012). Strategic management; competitiveness
and globalization (4th
ed.). Cincinnati, Ohio: South-Western College
Publishing.
Hollander, M., Wolfe, D.A., & Chicken, E. (2014). Nonparametric Statistical
Methods. Chicago: John Wiley and Sons.
Honjo, Y., & Harada, N., (2006). SME policy, financial structure and firm growth:
Evidence from Japan. Small Business Economies 27(4), 289-300.
Hoskisson, R. (2013). Competing for Advantage. (3rd ed.). Mason: South-Western.
Ibraimi, S. (2014). Performance Determinants of Manufacturing Firms: Analysis
from a Strategic Management Perspective. International Journal of
Academic Research in Economics and Management Sciences. 3(2), 26-
36.
Ireland, R. D., Hitt, M. A., & Vaidyanath, D. (2002). Alliance Management as a
Source of Competitive Advantage. Journal of Management, 28(3), 413–
446.
Johnson, G., Scholes, K. & Whittington, R. (2008). Exploring corporate strategy:
texts and cases, (8th
ed.) London: Prentice Hall International.
Kamaku, D. K. & Waari, D. N. (2016). Firm Level Determinants of Manufacturing
Firms’ Growth in Kenya: 2000-2011. International Journal of
Economics, Commerce and Management United Kingdom. 4(2), 162.
Kantabutra, S. (2008). What Do We Know About Vision? The Journal of Applied
Business Research – Second Quarter. 24(2), 127-136.
Kavale, S. (2007). A study of Strategic Alliances in Kenya. Retrieved from:
http://erepository.uonbi.ac.ke.
Kazmi, A. (2002). Strategic management and business policy. Delhi: McGraw Hill.

139
Kinyua, J., Iravo, M. & Namusonge, G. (2016). Stakeholder Management Strategies
and Financial Performance of Deposit Taking Saccos in Kenya.
Retrieved from: [email protected].
Kipruto, K. (2012). The role of Micro-finance institutions in alleviating poverty
among small scale farmers in Kenya: Evidence from small-scale wheat
farming in Moiben division, Uasin Gishu County. International Journal
of Current Research 4(02), 247-251.
Kirui, K. (2014). Firm Access to External Financing; Corporate Investment and
Economic Growth in Kenya. Retrieved from:
http://erepository.uonbi.ac.ke.
Kish, L. (1965). Survey Sampling. New York: John Wiley and Sons, Inc.
Koskei, K. J & Moronge, M. (2014). Factors Influencing Growth of Hostels in
Kenya. A Case of Hostels In Juja. European Journal of Business
Management, 1(11), 141-161.
Kothari, C.R. (2013). Research Methodology-Methods and Techniques (3rd
ed.). New
Delhi: New Age International Publishers Ltd.
Kutllovci, E., Shala, V. & Troni, B. (2012). Business strategy, the Key determinants
of SME growth in Kosovo. Retrieved from:
www.managementjournal.info
Leitch, C, Hill, F, & Neergaard, H. (2010). Entrepreneurial and business growth and
the quest for a ‘comprehensive theory’: tilting at windmills?
Entrepreneurship Theory and Practice. 34(2), 249–260.
Lipton, M. (2003). Guiding Growth: How Vision Keeps Companies on Course.
Boston: Harvard Business School Publishing Corporation.
140
Lockett, A, Hayton, J, & Ucbasaran, D. (2015). Entrepreneurial leadership,
capabilities and firm growth International Small Business. Journal 33(1),
89–105.
Luypaert, P. (2008). Determinants of growth through M & As: Empirical results
from Belgum. Retrieved from:http://www.ehsal.be
Maina, W. (2011). Factors influencing the growth of micro finance institutions in
Nyeri Central Disstrict, Nyeri County Kenya. Retrieved from:
http://erepository.uonbi.ac.ke.
Margarita, I. (2009) Importance of Strategic Alliances in Company’s Activity.
Intellectual Economics. 4(5), 39–46.
Mashenene, G. & Rumanyika, J. (2014). Business Constraints and Potential Growth
of Small and Medium Enterprises in Tanzania: A Review. European
Journal of Business and Management. 6(32), 14-24.
McDougall, P. & Covin, J., Robinson, R. & Herron, L. (2006). The effects of
industry growth and strategic breadth on new venture performance and
strategy content. Strategic Management Journal 15(7), 537-554.
McGrath, J., Kroeger, F., Traem, M. & Rockenhaeuser, J., (2000). The value
growers: Achieving competitive advantage through long-term growth
and profits. New York: McGraw-Hill.
McKelvie, A. & Wiklund, J. (2010). Advancing firm growth research: A focus on
growth mode instead of growth rate. Entrepreneurship Theory and
Practice, 34(2), 261–288.
Mengistie, N. (2012). The determinants of firm growth for Ethiopian large and
medium scale manufacturing industries: A dynamic panel study.
International Journal of Advances in Management and Economics. 1(3),
42-46.
141
Meyer, M.H., (2007). The fast path to corporate growth: Leveraging knowledge and
technologies to new market applications. Oxford: Oxford University
Press.
Muia, F. (2011). Determinants of Growth of Firms Through Mergers and
Acquisitions in Kenya: A Study of Firms Listed at the Nairobi Stock
Exchange. African Journal of Business and Management. 2(7). Retrieved
from http://www.aibuma.org.
Mulunga, A. (2010). Factors affecting the growth of microfinance institutions in
Namibia. Retrieved from: http://hdl.handle.net/10019.1/8504.
Muthini, J. & Bichanga, J. (2014). Determinants of stock market growth at the
Nairobi Stock Exchange (NSE). International Journal of Business and
Law Research. 2(2), 63-70.
Mwobobia, F. (2012). The challenges facing small-scale women entrepreneurs: A
case of Kenya. International Journal of Business Administration, 3(2),
112.
Namusonge, G. (2010). Determinants of growth oriented small and medium
enterprises: A survey of Nairobi Province. Germany: Verlag Dr.
Müller.
Namusonge, G., Nteere, K. & Mukulu, E. (2012). Pedagogical approaches
determining the performance of entreprenurship education in Kenya
public universities. International Journal of Humanities and Social
Science 2(13), 238-246.
Njanja, W., Ogutu, M., & Pellisier, R. (2012). The effects of the external
environment on internal management strategies within micro, small and
medium enterprises; Kenyan case. [Electronic version].
International Journal of Business and Management 7(3), 194-205.

142
Nyamita, O., Dorasamy, N., & Garbharran, H., (2015). How Debt Financing
Decisions Relate With Financial Performance of State-Owned
Corporations In Kenya. International Business and Economics Research
Journal. 14(4), 701-726.
Pearce, J. & Robinson, R. (2013). Strategic Management; Planning for Domestic and
Global Competitiveness. (13th
ed.). Chicago: Richard D. Irwin, Inc.
Pervan, M., & Mlikota, M. (2013). What determines the profitability of companies:
Case for Croatian food and beverage industry. Ekonomska istraživanja,
26(1), 277-286.
Peteraf, M.A. & Barney, J.B. (2003). Unraveling the resource-based tangle.
Managerial and Decision Economics, 24(4), 309-323.
Picardi, C. A., & Masick, K. D. (2014). Research Methods: Designing
andconducting research with a real-World Focus. U.S.A.: SAGE
Publications, Porter, M. (1980). Competitive strategy: Techniques for
analyzing industries and competitors. New York: Free Press.
Porter, M. & Kramer, M. (2006). Strategy and society; The link between competitive
advantage and corporate social responsibility. Harvard Business Review.
December, 78-92.
Porter, M. (2008). The five competitive forces that shape strategy. Harvard Business
Review. January, 79-93.
Porter, M.E. (2004). Competitive advantage: Creating and sustaining superior
performance, Free Press, Reprinted in Abridged Form in: De Wit, B. &
Meyer, R., Strategy. Process, Content, Context. An International
Perspective, (3rd ed.). London: Thomson.
Qi, J., Sutton, N. K., & Zheng, Q. (2015). The Value of Strategic Alliances in
Acquisitions and IPOs, Financial Management, 44(2), 387-430.
143
Qin, Y., Adleer, H. & Cai, A. (2012). Successful growth strategies of three Chinese
domestic hotel companies. Journal of management and strategy, 3(1),
40-53.
Qing, Z., Weijing, D., & Wenhui, H. (2012). Technological Standard Alliance in
China: Partner Selection and Innovation Performance. Journal of Science
and Technology Policy in China, 3(3), 196–209.
Raymond, L., Bergeron, F., & Blili, S., (2005). The assimilation of E-business in
manufacturing SMEs: Determinants and effects on growth and
internationalization. Electronic Markets 15(2), 106-118.
Reuer, J., (2004). Strategic Alliances: Theory and Evidence. New York, NY: Oxford
University Press.
Rioba, E. M., (2015). Manufacturing Industry and Economic Growth in Kenya: A
Kaldorian Approach. Social Sciences Research. Network. Retrieved
from: http://dx.doi.org/10.2139/ssrn.2656957.
Roberts, J., (2004). The modern firm: Organizational design for performance and
growth. Oxford: Oxford University Press.
Rothaermel, F. (2015). Strategic Management: Concepts. New York. McGraw-Hill.
Saxena, M., & Maru, S. (2016).To Study the Impact of Determinants of Growth on
Firm’s Performance With Respect to IT Industry. International Journal
of Research Granthaalayah, 4(1), 108-118.
Schimke, A. (2011): Factors affecting the growth of manufacturing firms: Analysis of
growth atages: A case of German firms. Retrieved from:
http://www.ersa.org
Segarra, A. & Teruel, M. (2015). High-growth firms and innovation: an empirical
analysis for Spanish firms. Small Business Economics. 43(4), 805-821.
144
Sekaran, U. (2010) Research methods for business: A skill building approach (5th
ed). New Jersey: John Wiley and Sons.
Smit, A. J. (2010). The competitive advantage of nations: is Porter’s Diamond
Framework a new theory that explains the international competitiveness
of countries? Southern African Business Review, 14(1), 105-130.
Stake, R.E. (2010). Qualitative research: Studying how things work. New York:
Guilford Press.
Stock, H. & Mark, W. (2007). Introduction to econometrics. (2nd ed.). Boston:
Pearson Education.
Struwig, F., & Stead, G. (2013). Research: Planning, Designing and Reporting.
Pretoria; Pearson Education.
The Kenyan constitution, (2006). The Micro Finance Act. Nairobi: Government
Printer.
Uddin, M. & Akhter, B. (2011) Strategic Alliance and Competitiveness: Theoretical
Framework. Journal of Arts Science & Commerce. 2(1), 43-54.
Ugheokea, S., Isab, M., & Noor, W. (2015), Understanding the Business
Environment Implication for Corporate Performance. Retrieved from:
Universiti Utara Malaysia.
Uzel, M., Namusonge, G. & Obwogi, H. (2015). Effects of Strategic Management
Drivers on the performance of the hotel industry in Kenyan Coast.
Retrieved from: [email protected].
Valipour, H. Birjandi, H. & Honarbakhsh, S. (2012) The Effects of Cost Leadership
Strategy and Product Differentiation Strategy on the Performance of
Firms. [Electronic version]. Journal of Asian Business Strategy, 2(1), 4-
23.
145
Van, D., (2005). Strategic management. Ontario: Custom Publishing.
Vanroose, A. (2010). What Macro Factors Make Microfinance Institutions Reach
Out?. (2010). Retrieved from: http://difusion.ulb.ac.be
Wei, J., & Liu, Y. (2015). Government Support and Firm Innovation Performance:
Empirical Analysis of 343 Innovative Enterprises in China. Chinese
Management Studies, 9(1), 38-55.
Wheelen, T. & Hunger, D. (2012). Strategic management and business policy:
Towards Global Sustainability. Boston: Pearson Education.
Wooldridge, J. (2008). Introductory econometrics: A modern approach. Mason, OH:
Thomson South-Western.
Zhou, H. & De Wit G. 2009. Determinants and Dimensions of Firm Growth. (2009).
Retrieved from:http://ssrn.com/.

146
APPENDICES
Appendix I: Mombasa County Commissioner Introduction Letter

147
Appendix II: NACOSTI Research Permit

148
Appendix III: NACOSTI Introduction Letter

149
Appendix IV: University Introduction Letter
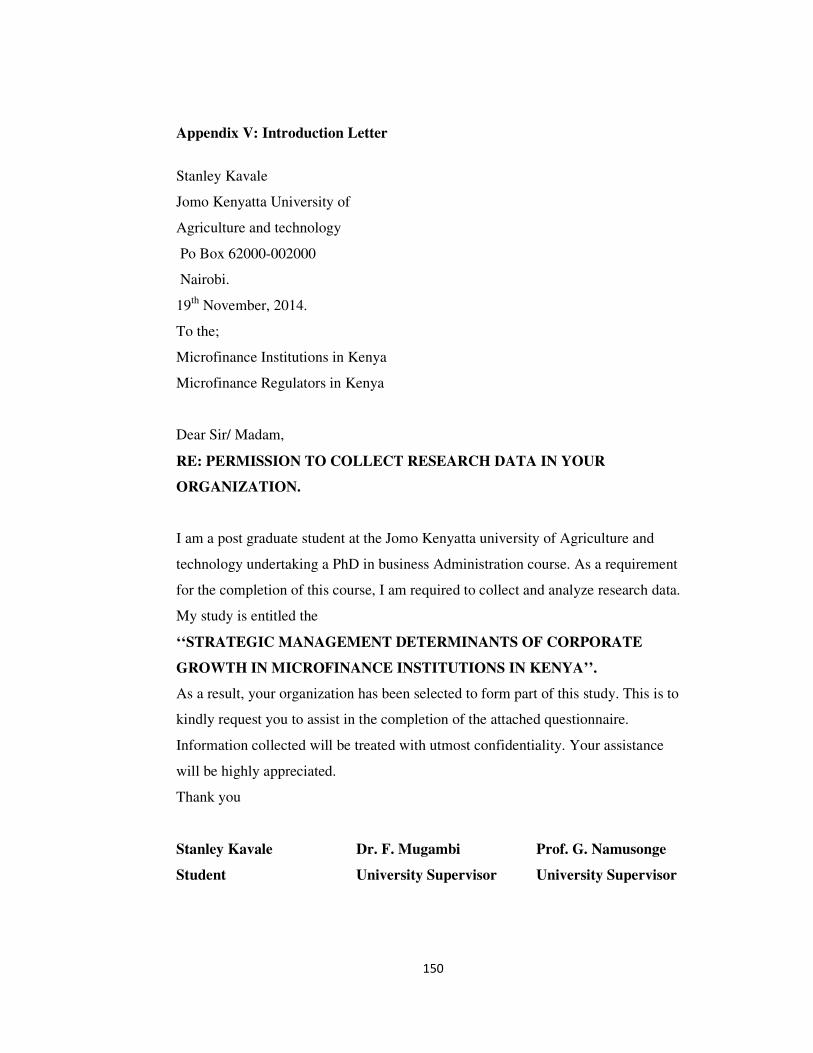
150
Appendix V: Introduction Letter
Stanley Kavale
Jomo Kenyatta University of
Agriculture and technology
Po Box 62000-002000
Nairobi.
19th
November, 2014.
To the;
Microfinance Institutions in Kenya
Microfinance Regulators in Kenya
Dear Sir/ Madam,
RE: PERMISSION TO COLLECT RESEARCH DATA IN YOUR
ORGANIZATION.
I am a post graduate student at the Jomo Kenyatta university of Agriculture and
technology undertaking a PhD in business Administration course. As a requirement
for the completion of this course, I am required to collect and analyze research data.
My study is entitled the
‘‘STRATEGIC MANAGEMENT DETERMINANTS OF CORPORATE
GROWTH IN MICROFINANCE INSTITUTIONS IN KENYA’’.
As a result, your organization has been selected to form part of this study. This is to
kindly request you to assist in the completion of the attached questionnaire.
Information collected will be treated with utmost confidentiality. Your assistance
will be highly appreciated.
Thank you
Stanley Kavale Dr. F. Mugambi Prof. G. Namusonge
Student University Supervisor University Supervisor

151
Appendix VI: Questionnaire to MFIS, CBK & AMFI
This questionnaire aims at collecting information on the Strategic Management
Determinants of Corporate Growth in Micro Finance Institutions in Kenya. Your
firm has been selected to form part of this study. Please answer the following
questions. Information collected will be treated with due confidentiality and will be
used for academic purposes only.
PART ONE: INTRODUCTION
1. a) Name of respondent (optional) ……………………………………………….
b) Name of organization ……………………………………………………………
c) Identify the category of your firm
MFI Regulator (AMFI or CBK)
d) What is your highest level of education?
Diploma 1st Degree Masters Phd PhD
e) What is your current designation?
Manager Ass. Manager Director CEO Other
f) For how long have you worked in your current position?
0-5years 5-10years Over 10years
g) For how long have you worked in this organization?
0-5years 5-10years Over 10years
h) Identify the age of your organization
5-10years 10-15years Over 15years
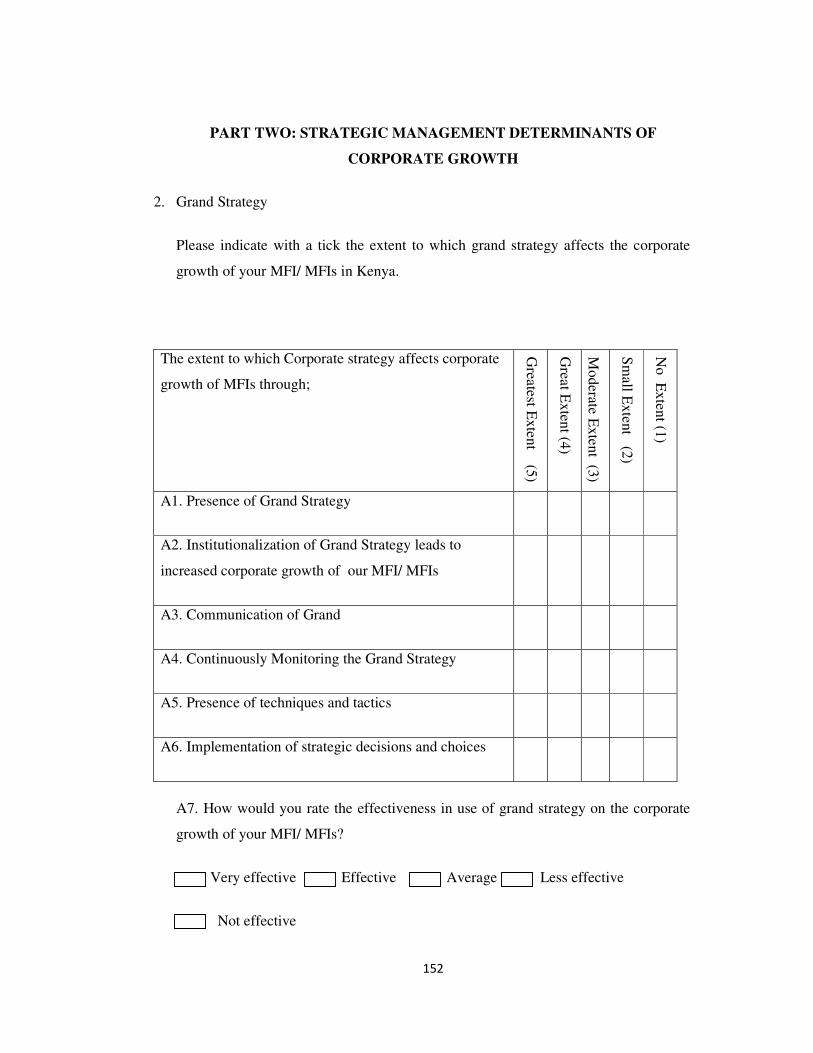
152
PART TWO: STRATEGIC MANAGEMENT DETERMINANTS OF
CORPORATE GROWTH
2. Grand Strategy
Please indicate with a tick the extent to which grand strategy affects the corporate
growth of your MFI/ MFIs in Kenya.
The extent to which Corporate strategy affects corporate
growth of MFIs through;
Grea
test Ex
ten
t (5)
Grea
t Ex
tent (4
)
Mo
derate E
xte
nt (3
)
Sm
all E
xte
nt (2
)
No
Ex
tent (1
)
A1. Presence of Grand Strategy
A2. Institutionalization of Grand Strategy leads to
increased corporate growth of our MFI/ MFIs
A3. Communication of Grand
A4. Continuously Monitoring the Grand Strategy
A5. Presence of techniques and tactics
A6. Implementation of strategic decisions and choices
A7. How would you rate the effectiveness in use of grand strategy on the corporate
growth of your MFI/ MFIs?
Very effective Effective Average Less effective
Not effective

153
3. Corporate Vision
Please indicate with a tick the extent to which Corporate Vision affects the corporate
growth of your MFI/ MFIs in Kenya.
The extent to which Corporate Vision affects corporate
growth of MFIs through;
Greatest E
xten
t (5)
Great E
xten
t (4)
Mo
derate E
xten
t (3)
Sm
all Ex
tent (2
)
No
Ex
ten
t (1)
B1. Presence and Clarity of Corporate Vision
B2. Institutionalization of Corporate Vision
B3. Communication of Corporate Vision
B4. Continuously Monitoring the Corporate Vision
B5. Continuously Reviewing the Corporate Vision
B6. A unifying corporate culture leads
B7. How would you rate the level of Vision alignment with the organizational
mission and objectives of your MFI/ MFIs?
Very good Good Average Poor Very poor

154
4. Cost leadership strategy
Please indicate with a tick the extent to which Cost leadership strategy affects the
corporate growth of your MFI/ MFIs in Kenya.
The extent to which Cost leadership strategy affects
corporate growth of MFIs through;
Grea
test Ex
ten
t (5)
Grea
t Ex
tent (4
)
Mo
dera
teEx
tent (3
)
Sm
all E
xte
nt (2
)
No
Ex
tent (1
)
C1. Lowest Cost in industry
C2. Cost Control and Management
C3. Company efficiency
C4. Scale of operations
C5. Company scope
C6. Cumulative experience
C7. How would you rate the pricing strategy in your MFI/ MFIs?
Very Competitive Competititve Average
Less competitive Not competitive
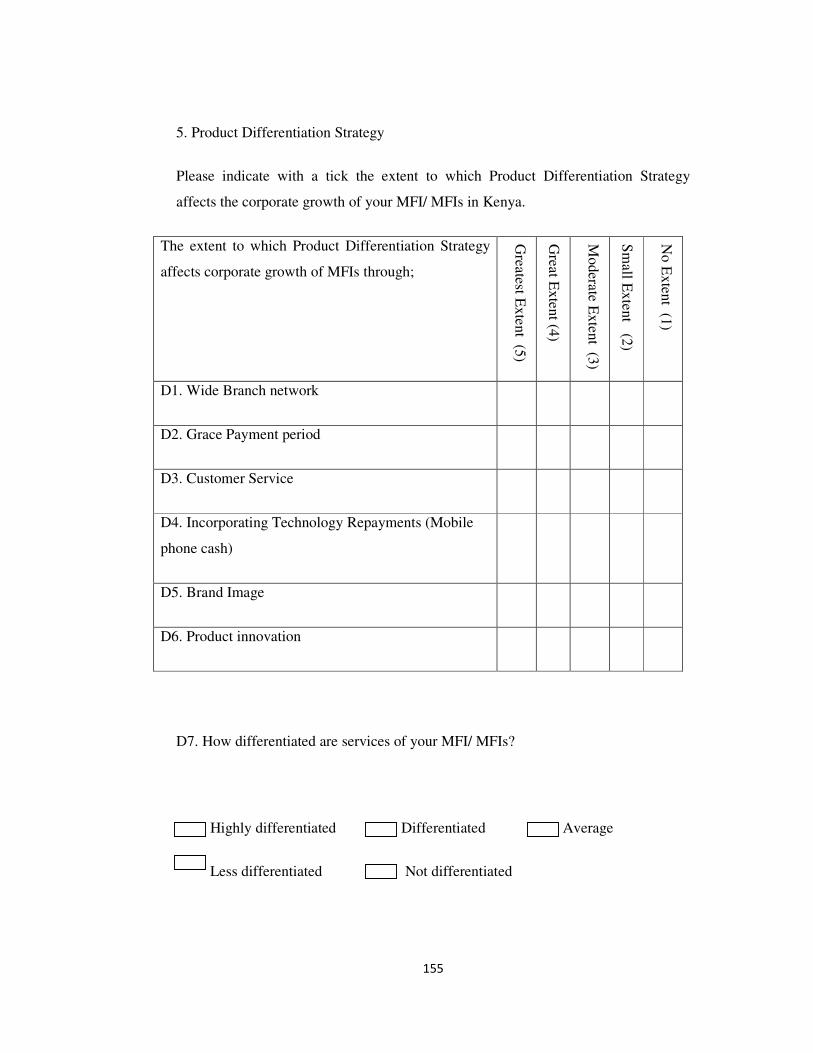
155
5. Product Differentiation Strategy
Please indicate with a tick the extent to which Product Differentiation Strategy
affects the corporate growth of your MFI/ MFIs in Kenya.
The extent to which Product Differentiation Strategy
affects corporate growth of MFIs through;
Grea
test Ex
ten
t (5)
Grea
t Ex
tent (4
)
Mo
dera
te Ex
tent (3
)
Sm
all E
xte
nt (2
)
No
Ex
tent (1
)
D1. Wide Branch network
D2. Grace Payment period
D3. Customer Service
D4. Incorporating Technology Repayments (Mobile
phone cash)
D5. Brand Image
D6. Product innovation
D7. How differentiated are services of your MFI/ MFIs?
Highly differentiated Differentiated Average
Less differentiated Not differentiated
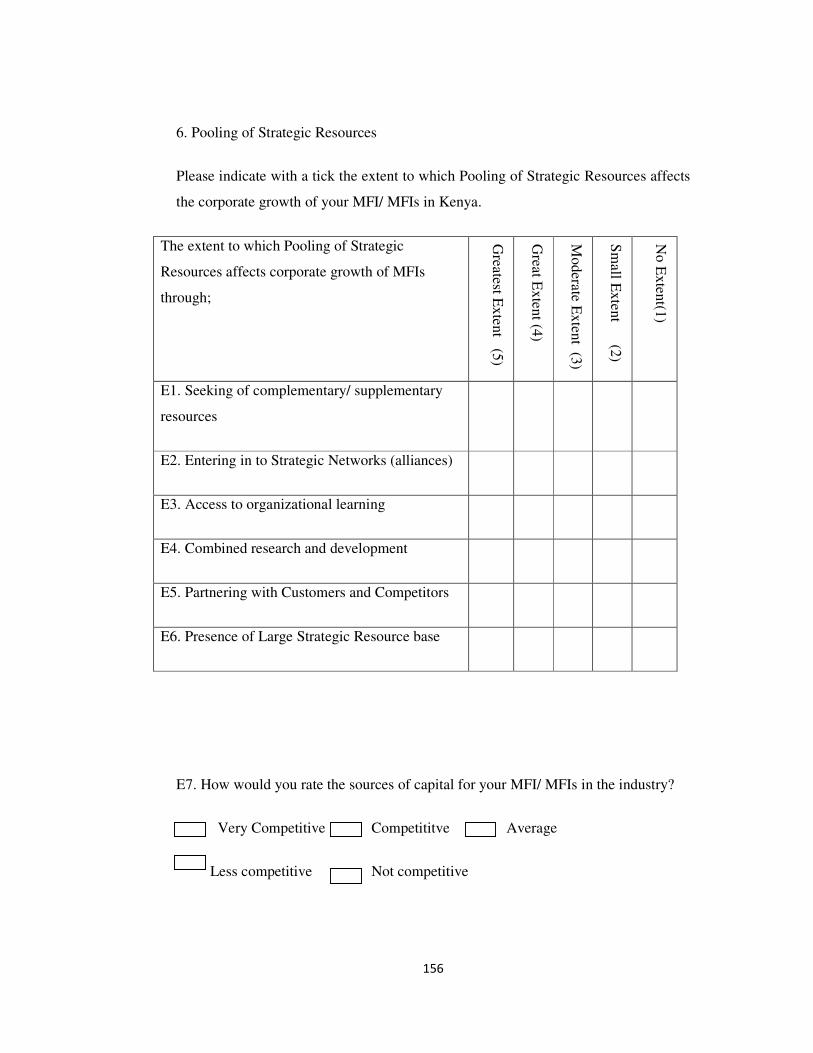
156
6. Pooling of Strategic Resources
Please indicate with a tick the extent to which Pooling of Strategic Resources affects
the corporate growth of your MFI/ MFIs in Kenya.
The extent to which Pooling of Strategic
Resources affects corporate growth of MFIs
through;
Grea
test Ex
ten
t (5)
Grea
t Ex
tent (4
)
Mo
dera
te Ex
tent (3
)
Sm
all E
xte
nt (2
)
No
Ex
tent(1
)
E1. Seeking of complementary/ supplementary
resources
E2. Entering in to Strategic Networks (alliances)
E3. Access to organizational learning
E4. Combined research and development
E5. Partnering with Customers and Competitors
E6. Presence of Large Strategic Resource base
E7. How would you rate the sources of capital for your MFI/ MFIs in the industry?
Very Competitive Competititve Average
Less competitive Not competitive

157
7. trategic Synergy
Please indicate with a tick the extent to which Strategic Synergy affects the corporate
growth of your MFI/ MFIs in Kenya.
The extent to which Strategic Synergy affects
corporate growth of MFIs through;
Grea
test Ex
ten
t (5)
Grea
t Ex
tent (4
)
Mo
dera
te Ex
ten
t (3)
Sm
all E
xte
nt (2
)
No
Ex
tent(1
)
F1. Sharing of Risks and Expenses
F2. Corporation and innovation
F3. Sharing of Successful Strategies
F4. Combined Core capabilities
F5. Enhancing value creation
F6. Competitive Positioning
F7. How would you rate the effectiveness of strategic partnerships in the corporate
growth of your MFI/ MFIs?
Very effective Effective Average Less effective
Not effective

158
8. Corporate Growth of MFIs
Rate the following measures of corporate growth over the last five years, ten years,
fifteen years and indicate to what extent each has affected the corporate growth of
your MFI/ MFIs in Kenya. (Tick only once where appropriate).
Measures of MFI Growth Greatest E
xten
t (5)
Great E
xten
t (4)
Mo
derate E
xten
t (3)
Sm
all Ex
tent (2
)
No
Ex
tent (1
)
G1. Corporate Profits
G2. Capital Base
G3. Market Share
G4. New Customers
G5. Branch Network
G6. Asset Base
G8. Which of the following best reflects profitability in your MFI/ MFIs as a result
of the use of strategic management determinants of corporate growth?
<0% 0-25% 25-50% 50-75% 70- 75%>
Thank you very much for your contribution in this study. We are highly grateful.
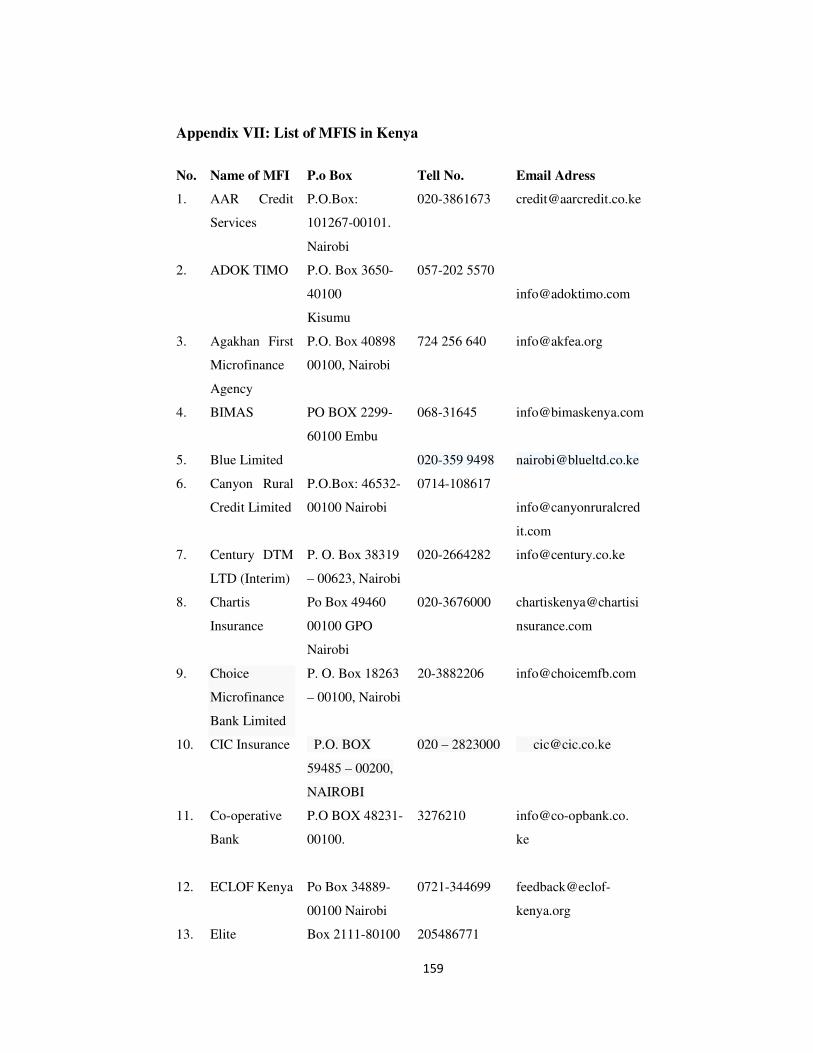
159
Appendix VII: List of MFIS in Kenya
No. Name of MFI P.o Box Tell No. Email Adress
1. AAR Credit
Services
P.O.Box:
101267-00101.
Nairobi
020-3861673 [email protected]
2. ADOK TIMO P.O. Box 3650-
40100
Kisumu
057-202 5570
3. Agakhan First
Microfinance
Agency
P.O. Box 40898
00100, Nairobi
724 256 640 [email protected]
4. BIMAS PO BOX 2299-
60100 Embu
068-31645 [email protected]
5. Blue Limited 020-359 9498 [email protected]
6. Canyon Rural
Credit Limited
P.O.Box: 46532-
00100 Nairobi
0714-108617
info@canyonruralcred
it.com
7. Century DTM
LTD (Interim)
P. O. Box 38319
– 00623, Nairobi
020-2664282 [email protected]
8. Chartis
Insurance
Po Box 49460
00100 GPO
Nairobi
020-3676000 chartiskenya@chartisi
nsurance.com
9. Choice
Microfinance
Bank Limited
P. O. Box 18263
– 00100, Nairobi
20-3882206 [email protected]
10. CIC Insurance P.O. BOX
59485 – 00200,
NAIROBI
020 – 2823000 [email protected]
11. Co-operative
Bank
P.O BOX 48231-
00100.
3276210 [email protected].
ke
12. ECLOF Kenya Po Box 34889-
00100 Nairobi
0721-344699 feedback@eclof-
kenya.org
13. Elite Box 2111-80100 205486771

160
Microfinance
14. Equity Bank P.O BOX 75104-
00200 NAIROBI
020-
27366620/17
enquiry@equitybank
.co.ke
15. Faulu Kenya
DTM Limited
P. O. Box 60240
– 00200, Nairobi
020- 3877290 [email protected]
16. Fusion Capital
Ltd
Po Box 47538
00100 Nairobi
GPO
020-2217680
17. Greenland
Fedha Limited
P.O. Box 30213
Nairobi
00100
020-3227228
agathuku@ktdateas
.com
18. IndoAfrica
Finance
P.O. Box 39435-
00623 Nairob
020-2692965/6 [email protected]
.ke
19. Jamii Bora P.O. Box 22741-
00400
Nairobi, Kenya.
020 2224238-9 @jamiiborabank.co.ke
20. Jitegemea
Credit Scheme
BuruBuru
Shopping Center,
Nairobi.
020-2224238-9 [email protected]
21. Jitegemee
Trust Limited
P.O Box 21768,
00505, Nairobi.
020-2654453 jtrust@jitegemeetrust.
co.ke
22. Juhudi Kilimo
Company
Limited
P. O. Box 10528-
00100, Nairobi
020-3906000 nat@juhudikilimo.
com
23. Kenya
Entrepreneur
Empowerment
Foundation
(KEEF
General Kago
Kimathi
Nyeri
Kenya
020-3535-617
info@keefkenya.
org
24. Kenya Post
Office Savings
P.O BOX 30311-
00100
020-229551-6 [email protected]

161
Bank NAIROBI.
25. Kenya Women
Finance Trust
P. O. Box 4179-
00506, Nairobi
020- 2470272-
5
26. Kilimo Faida
27. K-rep Bank
Ltd
P.O BOX 25363-
00603 NAIROBI
020-3871511 registry@k-repbank.
com
28. K-rep
Development
Agency
P.O.BOX 10528-
00100 NAIROBI
020 3906000 [email protected]
29. Micro Africa
Limited
Po Box
Box: 3689 01000
Thika
30. Micro
Enterprises
Support
Fund(MESPT)
P.O. Box 187 -
00606 Nairobi
020-3746354 [email protected]
31. Microensure
Advisory
Services
Po Box: 13383
00100 Nairobi
020-2221074 info@microensure.
com
32. Milango
Micro Credit
P.O. Box 99637-
80107, Kilindini,
Mbsa
041 2009222
info@milangokenya.
co.ke
33. Molyn Credit
Limited
P.O. Box 10144
- 00100
Nairobi, Kenya.
020-310726 [email protected]
o.ke
34. Muramati
SACCO
Society Ltd
(UNAITAS)
P.O Box 38721-
00100 Nairobi
020-2015544 [email protected]
35. Musoni P.O. Box 25351
– 00100
Nairobi
020-2609355 [email protected]
36. Ngao Credit P.O. Box 60776- 020-2720196 [email protected]
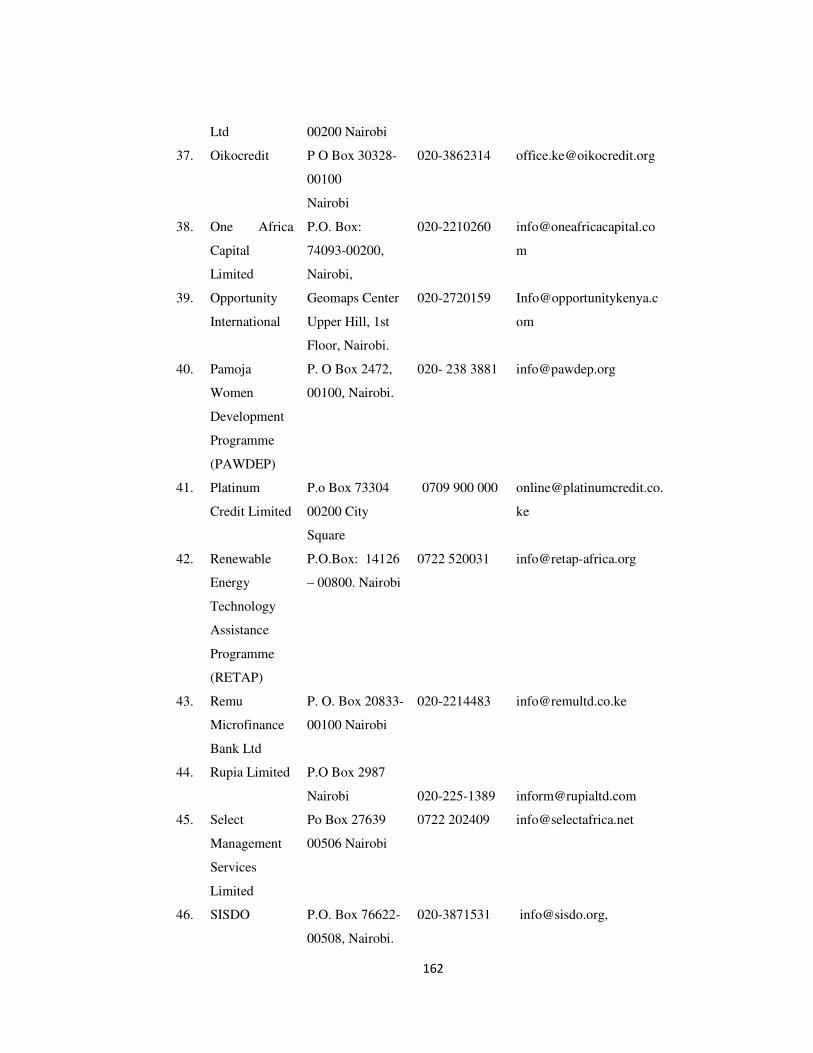
162
Ltd 00200 Nairobi
37. Oikocredit P O Box 30328-
00100
Nairobi
020-3862314 [email protected]
38. One Africa
Capital
Limited
P.O. Box:
74093-00200,
Nairobi,
020-2210260 [email protected]
m
39. Opportunity
International
Geomaps Center
Upper Hill, 1st
Floor, Nairobi.
020-2720159 [email protected]
om
40. Pamoja
Women
Development
Programme
(PAWDEP)
P. O Box 2472,
00100, Nairobi.
020- 238 3881 [email protected]
41. Platinum
Credit Limited
P.o Box 73304
00200 City
Square
0709 900 000
ke
42. Renewable
Energy
Technology
Assistance
Programme
(RETAP)
P.O.Box: 14126
– 00800. Nairobi
0722 520031 [email protected]
43. Remu
Microfinance
Bank Ltd
P. O. Box 20833-
00100 Nairobi
020-2214483 [email protected]
44. Rupia Limited P.O Box 2987
Nairobi
020-225-1389
45. Select
Management
Services
Limited
Po Box 27639
00506 Nairobi
0722 202409 [email protected]
46. SISDO P.O. Box 76622-
00508, Nairobi.
020-3871531 [email protected],

163
47. SMEP DTM
Limited
P. O. Box 64063-
00620 Nairobi
020-3572799 [email protected]
48. Sumac Credit
Ltd
P. O. Box 11687-
00100, Nairobi
020-2212587 [email protected]
49. Swiss Contact Victoria Plaza,
Westlands
020-374 3927 [email protected]
50. Taifa Option
Microfinance
P O BOX 727-
00232. Ruiru
067-5855169 [email protected]
51. U & I MFI P.O. Box 15825
– 00100, Nairobi
020 2367288 info@uni-
microfinance.co.ke
52. Visionfund
Kenya
P.O Box 1676-
00200, Nairobi
0722 200 402 [email protected].
ke
53. Uwezo DTM
Ltd
Po Box 1654-
00100 Nairobi
020-2212919 [email protected]
54. Women
Enterprise
Fund
P.O Box 17126-
00100, Nairobi,
714 606 845-6 [email protected]
55. Yehu
Microfinance
Trust
PO Box 82120
Mombasa
041 222 8632
ke
56. AMFI
(Regulator)
P.O. Box 10701-
00100, Nairobi
020-2106090 [email protected]
57. CBK
(Regulator)
P.O. Box 60000-
0200, Nairobi
20-2861000 [email protected]
e