effects of spiked metals on the msw anaerobic digestion
TRANSCRIPT
http://wmr.sagepub.com/Waste Management & Research
http://wmr.sagepub.com/content/30/1/32The online version of this article can be found at:
DOI: 10.1177/0734242X10383079
2012 30: 32 originally published online 29 September 2010Waste Manag ResBanks, CY Lin, WF Liu, PH Chen, CK Chen, HY Chiu, HY Wu, TW Chao, YR Chen, DW Liou and FC Lo
HM Lo, CF Chiang, HC Tsao, TY Pai, MH Liu, TA Kurniawan, KP Chao, CT Liou, KC Lin, CY Chang, SC Wang, CJEffects of spiked metals on the MSW anaerobic digestion
Published by:
http://www.sagepublications.com
On behalf of:
International Solid Waste Association
can be found at:Waste Management & ResearchAdditional services and information for
http://wmr.sagepub.com/cgi/alertsEmail Alerts:
http://wmr.sagepub.com/subscriptionsSubscriptions:
http://www.sagepub.com/journalsReprints.navReprints:
http://www.sagepub.com/journalsPermissions.navPermissions:
http://wmr.sagepub.com/content/30/1/32.refs.htmlCitations:
What is This?
- Sep 29, 2010 OnlineFirst Version of Record
- Jan 6, 2012Version of Record >>
at UNIV OF SOUTHERN CALIFORNIA on April 9, 2014wmr.sagepub.comDownloaded from at UNIV OF SOUTHERN CALIFORNIA on April 9, 2014wmr.sagepub.comDownloaded from

Research Article
Effects of spiked metals on the MSWanaerobic digestion
HM Lo1, CF Chiang2, HC Tsao3, TY Pai1, MH Liu1, TA Kurniawan4,KP Chao5, CT Liou6, KC Lin7, CY Chang8, SC Wang1, CJ Banks9,CY Lin10, WF Liu11, PH Chen1, CK Chen1, HY Chiu1, HY Wu1,TW Chao1, YR Chen1, DW Liou1, and FC Lo5
AbstractThis study aimed to investigate the effects of eight metals on the anaerobic digestion of the organic fraction of munici-
pal solid waste (OFMSW) in bioreactors. Anaerobic bioreactors containing 200mL MSW mixed completely with 200mL
sludge seeding. Ca and K (0, 1000, 2000 and 6000mgL�1) and Cr, Ni, Zn, Co, Mo and W (0, 5, 50 and 100mgL�1)
of various dose were added to anaerobic bioreactors to examine their anaerobic digestion performance. Results showed that
except K and Zn, Ca (;728 to ;1461mgL�1), Cr (;0.0022 to ;0.0212mgL�1), Ni (;0.801 to ;5.362mgL�1), Co
(;0.148 to ;0.580mgL�1), Mo (;0.044 to ;52.94mgL�1) and W (;0.658 to ;40.39mgL�1) had the potential to
enhance the biogas production. On the other hand, except Mo and W, inhibitory concentrations IC50 of Ca, K, Cr, Ni,
Zn and Co were found to be ;3252, ;2097, ;0.124, ;7.239, ;0.482, ;8.625mgL�1, respectively. Eight spiked metals
showed that they were adsorbed by MSW to a different extent resulting in different liquid metals levels and potential
stimulation and inhibition on MSW anaerobic digestion. These results were discussed and compared to results from
literature.
KeywordsMetals, municipal solid waste, anaerobic digestion, IC50, biogas
Date received: 6 February 2010; accepted: 8 August 2010
Introduction
Municipal solid waste (MSW) has been found to contain
more metals in Taiwan recently. MSW may be recycled or
be treated with incineration, composting, pyrolysis, gasifica-
tion, anaerobic digestion or landfilling. Among them, anaer-
obic digestion was reported to have the potential for energy
recovery, digestate utilization and greenhouse gas mitigation
(Møller et al., 2009; Gohlke, 2009; Young et al., 2010). As it
is treated with anaerobic digestion, various metals present in
the MSW may have the potential to affect the microbial
activity, causing effects on biological treatments to a certain
extent, thus resulting in a varying anaerobic process perfor-
mance. Several researchers have reported that organic
1Department of Environmental Engineering and Management,Chaoyang University of Technology, Wufong Township, TaichungCounty, Taiwan, ROC.2Institute of Environmental Health, China Medical University,Taichung, Taiwan, ROC.3Department of Business Administration, Asia University, Wufeng,Taichung, Taiwan, ROC.4Laboratory of Applied Environmental Chemistry (LAEC), Departmentof Environmental Sciences and Forestry, University of EasternFinland, Mikkeli, Finland.5Department of Occupational Safety and Health, China MedicalUniversity, Taichung, Taiwan, ROC.6Department of Safety, Health and Environmental Engineering,Hungkuang University, Sha Lu, Taichung, Taiwan, ROC.
7Department of Occupational Safety and Health, Chung Shan MedicalUniversity, Taichung, Taiwan, ROC.8General Education Center, National Taitung Junior College, TaitungCity, Taiwan, ROC.9Department of Civil Engineering and the Environment, SouthamptonUniversity, Southampton, UK.10Department of Soil and Water Conservation, National Chung HsingUniversity, Taichung, Taiwan, ROC.11Department of Electrical Engineering, Feng Chia University,Taichung, Taiwan, ROC.
Corresponding author: HM Lo, Department of EnvironmentalEngineering and Management, Chaoyang University of Technology,168, Gifong E. Rd., Wufong Township, Taichung County 41349,Taiwan, ROC.Email: [email protected]; [email protected]
Waste Management & Research
30(1) 32–48
� The Author(s) 2012
Reprints and permissions:
sagepub.co.uk/journalsPermissions.nav
DOI: 10.1177/0734242X10383079
wmr.sagepub.com
at UNIV OF SOUTHERN CALIFORNIA on April 9, 2014wmr.sagepub.comDownloaded from
matters and metals could affect the anaerobic process (Kuo
and Genthner, 1996; Kida et al., 2001; Ren and Frymer,
2003; Gikas, 2007; Li and Fang, 2007; Yue et al., 2007;
Chen et al., 2008; Lin and Shei, 2008; Altas, 2009; Fermoso
et al., 2009; Tan et al., 2009; Ma et al., 2009; Worm et al.,
2009; Yuan et al., 2010). These substances included ammo-
nia, sulfide, chlorophenols, halogenated aliphatics, N-substi-
tuted aromatics, long chain fatty acids, lignins and lignins
related compounds, light metal ions and heavy metals.
These mentioned literatures indicated that different sub-
strate, various metals levels and recalcitrant organic com-
pounds might affect the microbial diversity and bioreactor
performance. Furthermore, the anaerobic biodegradation
rate would be affected by metals uptake (Gurgel et al.,
2008), substrate compositions, microbial community and
operational conditions. Other investigations focusing on the
synergistic/antagonistic effects or mechanisms of heavy
metals on anaerobic digestion or fermentation process has
also been reported by several researchers (Takashima and
Speece, 1990; Peiffer et al., 1994; Espinosa et al., 1995;
Wang 1995; Artola et al., 1997; Becker and Peiffer, 1997;
Lin et al., 1998; Zhang et al., 2003; Malik, 2004). However,
adverse or beneficial effects of metals on MSW anaerobic
digestion are not many and are not systematically investi-
gated (Banks and Lo, 2003; Lo, 2005; Lo and Liao, 2007;
Yue et al., 2007; Chen et al., 2008; Lo et al., 2009a, b). Due to
the potential existence of metals in MSW and as it is treated
with anaerobic digestion, it is therefore necessary to assess
their potential effects on MSW anaerobic digestion.
This study aims to investigate the effects of selected metals
on the MSW anaerobic digestion. Selected metals include
alkali metals of Ca and K, heavy metals of Cr, Ni and Zn,
and trace metals of Co, Mo and W. The results of the present
studies are evaluated and compared with those of other
investigations. The findings reported in this study are
expected to provide the baseline data and useful information
for the anaerobic digestion of MSW and/or anaerobic
co-digestion of MSW/sludge containing metals.
Materials and methods
Municipal solid waste substrate
To minimize possible interferences with selected metals on
MSW digestion, MSW that contained ;6% total solids
(TS) and ;5% volatile solids (VS) was prepared according
to previous studies (Banks and Lo, 2003; Lo, 2005; Lo and
Liao, 2007; Lo et al., 2009a, b). Based on the weight propor-
tion, the MSW was comprised of office paper (30%), news-
paper (30%), yard waste (35%) and food waste (5%). This
composition proportionally represents typical organic frac-
tions of MSW. In addition, the chemical constituents of C,
H, O, N and others of MSW were determined to be around
46, 6, 41, 1.4 and 5.6%, respectively. The carbon/nitrogen
(C/N) ratio of this synthetic MSW (32.86) was also similar
to that of typical MSW in Taiwan (39.86). A C/N ratio
ranging from 25 to 50 has been reported to be suitable
for the composting and anaerobic digestion of MSW
(Lo et al., 2009a, b). The food/micro-organisms (F/M)
ratio is important for the biological treatment process.
Generally, 0.5–1 kgBOD (m3 day)�1 of volume loading and
0.2–0.4 kgBOD (kgMLSS (Mixed liquor suspended solids)
day)�1 of sludge loading were thought suitable for wastewa-
ter biological treatment. In this study, F/M ratio was thought
to be the initial MSW/initial sludge seeding (200mL
(;5%VS MSW)/200mL (;2.5% VS sludge seeding)) equal
to 10 gVS MSW/5 gVS sludge. The experiment was done in
batch mode. In the MSW anaerobic digestion, a C/N ratio of
25 was suitable for anaerobic digestion and composting. This
C/N ratio of 25 was close to that of 32.6 in this study. The C/
N ratio and F/M ratio and anaerobic bacterial community
were important factors that will affect the anaerobic diges-
tion process. The MSW samples were stored in a refrigerated
storage chamber at 4 8C to minimize any further changes that
might occur in their physico-chemical properties prior to the
experiments.
Anaerobic sludge seeding
To initiate the MSW anaerobic digestion, 200mL of anaer-
obic sludge (;TS 3%, ;VS ;2.5%) was added into tested
batch bioreactors containing 200mL MSW substrate
(TS;6%¼;12 g, VS;5%¼;10 g). The sludge was
obtained from Fu-Tien municipal wastewater treatment
plant located at Taichung City in central Taiwan. The
plant collects ;50 000–55 000m3 day�1 sewage and adopts
aerobic activated sludge process (hydraulic retention time
(HRT), 6 h). The sludge from the first (HRT, 1.5 hrs) and
the second sedimentation tank (HRT, 4 hrs) is processed to
a gravity thickener (solid retention time (SRT), > 12 h) and
then sent to the anaerobic digesters (SRT, > 30 days) for
anaerobic digestion. The anaerobic sludge was taken from
anaerobic digester and their metal contents and basic param-
eters such as pH, TS and VS, etc. have been reported in
previous studies (Lo and Liao, 2007, Lo et al., 2009b). The
metals content of the sludge used for seeding and the MSW
are presented in Table 1.
Experimental
About 200mL MSW substrate and 200mL sludge seeding
and the designate spiked metal amounts were mixed comple-
tely in 500mL anaerobic bioreactors (plastic bottles). The
bioreactors with working volume of 400mL were operated
to test the toxicity and response of eight selected metals on
MSW anaerobic digestion. Bioreactors were maintained at
35 8C oven which was suitable for anaerobic digestion. The
anaerobic bioreactors had an exit for biogas collection using
the water replacement method. Initial pHs were ;6–6.5 and
Lo et al. 33
at UNIV OF SOUTHERN CALIFORNIA on April 9, 2014wmr.sagepub.comDownloaded from

the initial VS of the MSW and sludge used for seeding were
;5% and ;2.5%, respectively. Tested metal compounds
were CaCl2, K2SO4, CrCl6�6H2O, NiSO4�6H2O,
ZnSO4�7H2O, CoSO4�7H2O, Na2MoO4�2H2O, and
Na2WO4�2H2O which were purchased from Merck Co. The
CaCl2 and K2SO4 were weighted and spiked directly into the
batch bioreactors according to the Ca and K of the desig-
nated added amounts of 1000, 2000 and 6000mgL�1, respec-
tively. For example, Ca 1000mgL�1 was prepared by adding
1107.59mgCaCl2 into the batch bioreactors. 1107.59mg (X)
was calculated by X3 (Ca/CaCl2)/0.4 L¼ 1000mgL�1, that
is, X3 (40.08/110.98)/0.4 L¼ 1000mgL�1. Similarly, the
CrCl6�6H2O, NiSO4�6H2O, ZnSO4�7H2O, CoSO4�7H2O,
Na2MoO4�2H2O and Na2WO4�2H2O were spiked according
to the Cr, Ni, Zn, Co, Mo and W of the designated added
amounts of 5, 50 and 100mgL�1, respectively. Control
bioreactors without metals addition (0mgL�1) were
employed for comparison.
Forty-four bioreactors for each metal of three various
spiked amounts and control were used. They were used for
biogas measurement and 100mL mixture (MSW and sludge
seeding) were taken one by one (on day 1, 5, 8, 15, 19, 29, 33,
36, 43, 47 and 50) for each individual metal and parameter
analysis over the whole digestion period. The required total
bioreactors for each metal including control and three differ-
ent added amounts (0, 1000, 2000 and 6000mgL�1 or 0, 5, 50
and 100mgL�1) were 113 4¼ 44 and the total bioreactors
for the eight metals were 443 8¼ 352. The bioreactors were
maintained within a homeostatic oven with a constant tem-
perature around 358C. Anaerobic digestion of 200mL MSW
(VS ;5%¼;10 g VS) nearly reached the biochemical meth-
ane potential (BMP) after 50 days. The biogas production
was around 455mL (;455mL/10 gVS¼;45.5mLg�1 VS).
During the digestion period, biogas production in each
bioreactor was recorded daily by biogas collectors using the
water replacement method. A sample of 100mL of MSW
substrate and sludge seeding mixture was collected in each
sacrificed bioreactor and was filtered through a 0.45mm mem-
brane for metal and parameter analysis on day 1, 5, 8, 15, 19,
29, 33, 36, 43, 47 and 50, respectively. The metal concentration
in each bioreactor was measured by ICP-OES (Inductively
Coupled Plasma Optical Emission Spectrometry, IRIS
Intrepid II, Thermal Electron Corporation). The analytical
method followed the manual of the manufacturer. Briefly
speaking, the ICP-OES equipment was set at the required oper-
ational conditions. Incident energy was 1100W and reflective
energy was <5W. The observational mode of the plasma was
side on and the plasma height was ;14mm. Argon was used to
produce the desired high temperature withRFpower (1150W).
The nebulizer flow (25PSI) and auxiliary flow were set at 0.75
and 0.5Lmin�1, respectively. Data acquisition was obtained
with TEVA software (Thermo Elemental).
Inhibition of biogas productionby spiked metals
Total biogas production inhibition in the bioreactors to which
metal was added was calculated by the following equation:
GR %ð Þ ¼ Gc � Gmð Þ3100=Gc ð1Þ
where GR (%) is the total biogas production inhibition on
day 50 (at end point); Gc represents the total biogas produc-
tion (L) in the control bioreactors without metals addition on
day 50; Gm represents the total biogas production (L) in the
metal-dosed bioreactors on day 50. The IC50 (Inhibitory
concentration which biogas is 50% produced compared to
control one) of various metals in anaerobic digestion was
obtained by linear regression of the total biogas production
inhibition (%) against various metal-dose soluble concentra-
tions (mgL�1) at the end points.
Table 1. Elemental concentration (mg kg�1) in seeded sludgeand MSW substrate in this study
Element Seeded sludge(mg kg�1)
Substrate MSW(mg kg�1)
Ca 12860 10838.33
K 2259.67 5993.33
Mg 2388.67 856
Na 685 776.33
Ag 275.73 0.02
Al 2.357 7.22
B 63.2 13.38
Ba 42.1 10.91
Cd 1.447 0.03
Co 10.85 0.17
Cr 108.87 4.03
Cu 203.9 30.03
Fe 19680 736.83
Mn 2569 150.47
Mo 4.11 0.51
Ni 63.07 ND
P 5023.33 178.82
Pb 66.83 1.10
S 8460 740.33
Sb 4.33 0.09
Si 185.67 175.42
Sn 16.03 0.85
Ta 24.81 0.62
Ti 103 5.08
Tl 0.10 2.62
W ND ND
Zn 1347 31.11
Zr 0.87 0.20
ND, not detected.
34 Waste Management & Research 30(1)
at UNIV OF SOUTHERN CALIFORNIA on April 9, 2014wmr.sagepub.comDownloaded from

Results and discussion
Biogas production and anaerobic parameters
Theotal biogas production measured using the water replace-
ment method is presented in Figure 1. The composition
of biogas production was normally comprised of CH4
(;50–70%), CO2 (;30–50%), H2S (<1%) and trace
amount of VOCs (volatile organic compounds, minor). The
effects of soluble metals levels of Ca, K, Cr, Ni, Zn, Co, Mo
and W on total biogas inhibition in the MSW anaerobic
digestion are presented in Figure 2(A-a), 2(B-a) and
Figure 3(A-a), 3(B-a), 3(C-a), 3(D-a), 3(E-a) and 3(F-a).
The results also showed that the metals were adsorbed by
MSW and showed the variations of different liquid levels
as depicted in Figure 2(A-b), 2(B-b) and Figure 3(A-b),
3(B-b), 3(C-b), 3(D-b), 3(E-b) and 3(F-b) over the digestion
period. The amounts of metals in the gas phase were minor in
comparison with the liquid and solid phase. Neglecting the
trace amount in the gas phase, the solid phase metals was
obtained by summing the metals of MSW, sludge seeding
0
100
200
300
400
500
600
700
0
Day
Gas
acc
umul
atio
n (m
L)
0
100
200
300
400
500
600
700
Day
Gas
acc
umul
atio
n (m
L)
0
100
200
300
400
500
600
700
Day
Gas
acc
umul
atio
n (m
L)
0
100
200
300
400
500
600
700
Day
Gas
acc
umul
atio
n (m
L)
0
100
200
300
400
500
600
700
Day
Gas
acc
umul
atio
n (m
L)
0
100
200
300
400
500
600
700
Day
Gas
acc
umul
atio
n (m
L)
0
100
200
300
400
500
600
700
Day
Gas
acc
umul
atio
n (m
L)
0
100
200
300
400
500
600
700
Day
Gas
acc
umul
atio
n (m
L)
(a) (b)
(c) (d)
(e) (f)
(g) (h)
Ca 0: ; Ca 1000: ; Ca 2000: ; Ca 6000; K 0: ; K 1000: ; K 2000: ; K 6000;
Cr 0: Cr 5: ; Cr 50: ; Ca 100; Ni 0: ; Ni 5: ; Ni 50: ; Ni 100;
Zn 0: ; Zn 5: ; Zn 50: ; Zn 100; Co 0: ; Co 5: ; Co 50: ; Co 100;
Mo 0: ; Mo 5: ; Mo 50: ; Mo 100; W 0: ; W 5: ; W 50: ; W 100;
10 20 30 40 50
0 10 20 30 40 50
0 10 20 30 40 50
0 10 20 30 40 50
0 10 20 30 40 50
0 10 20 30 40 50
0 10 20 30 40 50
010 20 30 40 50
;
Figure 1. Biogas production of Ca, K, Cr, Ni, Zn, Co, Mo and W in the control and various metals dosed bioreactors during theanaerobic digestion process.
Lo et al. 35
at UNIV OF SOUTHERN CALIFORNIA on April 9, 2014wmr.sagepub.comDownloaded from

and dosed metals minus the metals concentration in the
liquid phase. The mass balance of the metals in the liquid
and solid phase can be found in Table 2.
From Figures 2 and 3 and Table 3, it was shown that
Ca (;728 to ;1461mgL�1, average ;1035mgL�1),
Cr (;0.0022 to ;0.0212mgL�1, average ;0.0148mgL�1),
Ni (;0.801 to ;5.362mgL�1, average ;1.842mgL�1), Co
(;0.148 to ;0.580mgL�1, average ;0.307mgL�1),
Mo (;0.044 to ;52.94mgL�1) and W (;0.658 to
;40.39mgL�1) had the potential to enhance the biogas
production. By dividing the highest levels to the lowest
ones, Mo and W showed wider stimulation ranges whereas
Ca, Cr, Ni and Co showed narrower stimulation ranges in
comparison to those of Mo and W. The IC50 concentrations
showed the order of Ca>K>Co>Ni>Zn>Cr. Typical
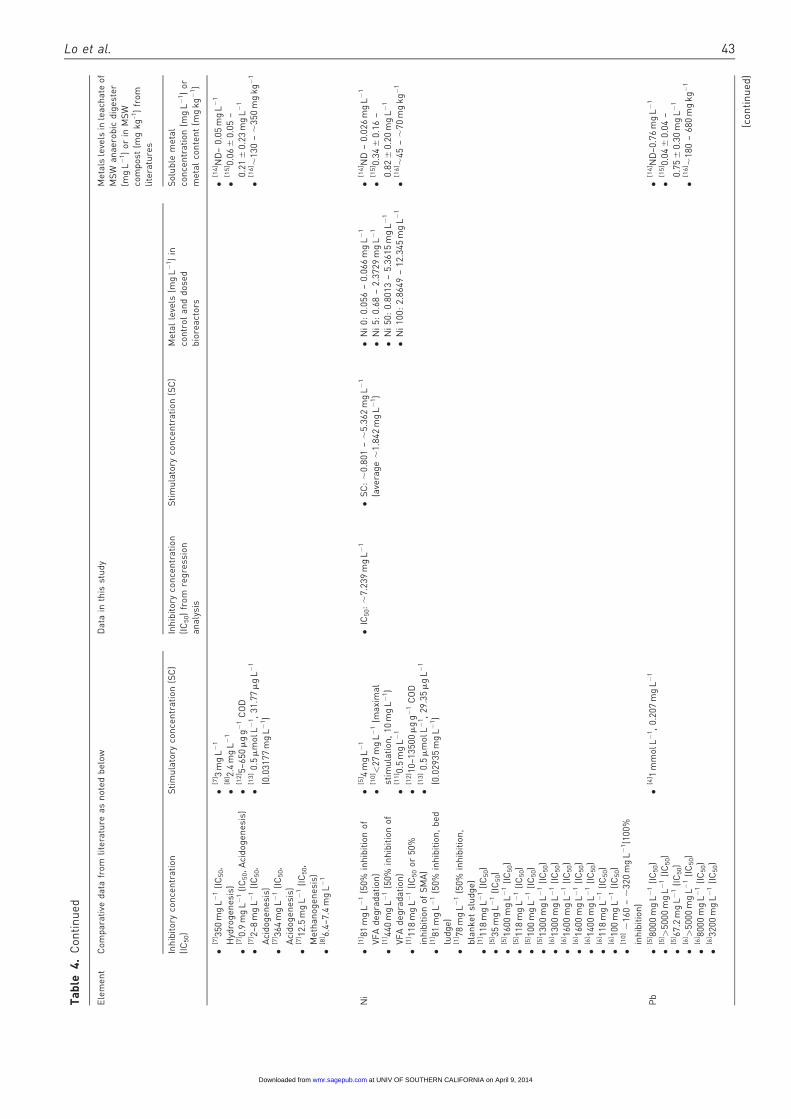
metal levels in the biogas plant will vary with the different
digested substrate, metals adsorption and operating condi-
tions. Typical metal levels in the organic fraction of MSW
(OFMSW) anaerobic digestion or waste compost can be
found in Lo et al. (2010), Iglesias et al. (2000) or Farrell
and Jones (2009) (Table 4). On the other hand, inhibitory
concentrations (IC50) of Ca, K, Cr, Ni, Zn and Co were
found to be ;3252, ;2097, ;0.124, ;7.239, ;0.482,
;8.625mgL�1, respectively. The Mo and W that was
dosed under 100mgL�1 showed stimulatory results rather
than inhibitory effects (Figure. 3 (E-a) and (F-a)). The
alkali metals Ca and K showed higher IC50 values than
those of the heavy metals Cr, Ni and Zn and trace metal Co.
The initial VS and TS of MSW were ;5% and ;6%,
respectively. TOC in leachate and VS and TS of MSW at
the end of the digestion were thought to decrease as the
MSW anaerobic digestion was progressed. Bioreactors that
have higher biogas production will lead to lower VS at the
end of digestion process. The total organic carbon (TOC)
[chemical oxygen demand (COD)] has been found to
decrease as the anaerobic digestion process progressed (Lo
et al., 2009b, 2010). The pH was thought to have the poten-
tial effects on organic refuse degradation (Kong, 2010). The
pH values in all bioreactors were found to range between ;5
and ;8.5, which was suitable for anaerobic digestion as can
be seen in Figure 4.
Inhibitory or stimulatory effects of metals
With the exception of K and Zn, suitable soluble levels of Ca,
Cr, Ni, Co, Mo and W were found to improve the MSW
digestion performance and enhance the biogas production
(Table 3). Metals levels higher than threshold values would
result in adverse effects, leading to the inhibition of biogas
production. The findings in that study were similar to those
of Fermoso et al. (2009) that the anaerobic digestion might
be limited or inhibited if metals such as Cu, Co, Fe, Mn, Mo,
Ni, Se, W, Zn and V were not optimally added or overdosed.
In addition, the reported inhibitory concentrations of Co, Ni
and Zn (Gikas, 2007; Li and Fang, 2007; Lin and Shei, 2008;
Altas, 2009; Fermoso et al., 2009) exceeded the IC50 levels
investigated in this study (Table 3).
The Ca concentration of 100–400mgL-1 reported by
Chen et al. (2008) and Yuan et al. (2010) was optimum,
which could improve the operational stability of the diges-
tion. However, at a concentration higher than 400mgL�1,
Ca was reported to be detrimental to the anaerobic process
Ca initial dose of 0, 1000, 2000 and 6000 (mg L–1)
0
Ca
solu
ble
conc
entr
atio
n (m
g L–1
)
0
1000
2000
3000
4000
y=–16.48+0.02044x; R2=0.680
IC50=~3252 mg L–1
SC=~1035 mg L–1 average
(~728 – ~1461 mg L–1)
Ca ave. soluble concentration (mg L–1)
0500
10001500
20002500
3000
Tot
al b
ioga
s in
hibi
tion
(%)
–40
–20
0
20
40
60
80
100
K initial dose of 0, 1000, 2000 and 6000 (mg L–1)
K s
olub
le c
once
ntra
tion
(mg
L–1)
0
500
1000
1500
2000
2500
3000
3500
4000
IC50=~2097 mg L–1
K ave.soluble concentration (mg L–1)0
Tot
al b
ioga
s in
hibi
tion
(%)
0
20
40
60
80
100(a)
(a)
(a)
(b)(b)
(b)
1000 2000 6000 0 1000 2000 6000
500 1000 1500 2000 2500 3000 3500
y=10.9+0.01865x; R2=0.800
Figure 2. (a) Total biogas inhibition VS average Ca soluble concentration (A-a) and Ca soluble concentrations variation (A-b) inthe three various Ca dosed and control bioreactors (�: Ca 0; *: Ca 1000; H: Ca 2000; �: Ca 6000); (b): Total biogas inhibition VSaverage K soluble concentration (B-a) and K soluble concentrations variation (B-b) in the three various K dosed and controlbioreactors (�: K 0; *: K 1000; H: K 2000; �: K 6000).
36 Waste Management & Research 30(1)
at UNIV OF SOUTHERN CALIFORNIA on April 9, 2014wmr.sagepub.comDownloaded from

Cr initial dose of 0, 5, 50 and 100 (mg L–1)
0
Cr
solu
ble
conc
entr
atio
n (m
g L–1
)
0.00
0.05
0.10
0.15
0.20
0.25
0.30
Cr ave. soluble concentration (mg L–1)
0.000.02
0.040.06
0.080.10
0.120.14
Tot
al b
ioga
s in
hibi
tion
(%)
–40
–20
0
20
40
60
80
100
Ni initial dose of 0, 5, 50 and 100 (mg L–1)
Ni s
olub
le c
once
ntra
tion
(mg
L–1)
0
2
4
6
8
10
12
14
Ni ave. soluble concentration (mg L–1)–1
0
Tot
al b
ioga
s in
hibi
tion
(%)
–60
–40
–20
0
20
40
60
80
100
Zn initial dose of 0, 5, 50 and 100 (mg L–1)
Zn
solu
ble
conc
entr
atio
n (m
g L–1
)
0.00
0.01
0.02
0.03
0.20
0.40
0.60
0.80
1.00
1.20
Zn ave. soluble concentration (mg L–1)
Tot
al b
ioga
s in
hibi
tion
(%)
–20
0
20
40
60
80
100
Co initial dose of 0, 5, 50 and 100 (mg L–1)
Co
solu
ble
conc
entr
atio
n (m
g L–1
)
0
1
2
5
10
15
20
Co ave. soluble concentration (mg L–1)
0
Tot
al b
ioga
s in
hibi
tion
(%)
–40
–20
0
20
40
60
80
100
Mo initial dose of 0, 5, 50 and 100 (mg L–1)
Mo
solu
ble
conc
entr
atio
n (m
g L–1
)
0.0
0.1
0.2
20.0
40.0
60.0
80.0
100.0
Mo ave. soluble concentration (mg L–1)
0
Tot
al b
ioga
s in
hibi
tion
(%)
–50
–40
–30
–20
–10
0
W initial dose of 0, 5, 50 and 100 (mg L–1)
W s
olub
le c
once
ntra
tion
(mg
L–1)
0.0
0.5
1.0
1.5
10.0
20.0
30.0
40.0
Wave. soluble concentration (mg L–1)
0
Tot
al b
ioga
s in
hibi
tion
(%)
–18
–16
–14
–12
–10
–8
–6
–4
–2
0
(a) (b)
(a)
(b)
(a)
(b)
(c)(d)
(e)(f)
(a)
(b)
(a)
(b)
(a)
(a)
(b) (b)
5 50 100
0 5 50 100
0 5 50 100
0 5 50 100
0 5 50 100
0 5 50 100
1 2 3 4 5 6 7
0.000.05
0.100.15
0.200.25
0.30
10 20 30 40 50
2 4 6 8
5 10 15 20 25 30
Figure 3. (a) Total biogas inhibition VS average Cr soluble concentration (A-a) and Cr soluble concentrations variation (A-b) inthe three various Cr dosed and control bioreactors (�: Cr 0; *: Cr 5; H: Cr 50; �: Cr 100); (b): Total biogas inhibition VS averageNi soluble concentration (B-a) and Ni soluble concentrations variation (B-b) in the three various Ni dosed and control biore-actors (�: Ni 0; *: Ni 5; H: Ni 50; �: Ni 100); (c): Total biogas inhibition VS average Zn soluble concentration (C-a) and Zn solubleconcentrations variation (C-b) in the three various Zn dosed and control bioreactors (�: Zn 0; *: Zn 5; H: Zn 50; �: Zn 100); (d):Total biogas inhibition VS average Co soluble concentration (D-a) and Co soluble concentrations variation (D-b) in the threevarious Co dosed and control bioreactors (�: Co 0; *: Co 5; H: Co 50; �: Co 100); (e): Total biogas inhibition VS average Mosoluble concentration (E-a) and Mo soluble concentrations variation (E-b) in the three various Mo dosed and control bioreactors(�: Mo 0; *: Mo 5; H: Mo 50; �: Mo 100); (f): Total biogas inhibition VS average W soluble concentration (F-a) and W solubleconcentrations variation (F-b) in the three various W dosed and control bioreactors (�: W 0; *: W 5; H: W 50; �: W 100).
Lo et al. 37
at UNIV OF SOUTHERN CALIFORNIA on April 9, 2014wmr.sagepub.comDownloaded from

(Chen et al., 2008; Tan et al., 2009). The optimal result was
different from the stimulatory concentrations of ;728 to
;1461mgL�1 found in the present investigation (Table 3).
It is further noted that moderately inhibitory levels (Chen
et al., 2008) of Ca (2500–4000mgL�1) was close to the find-
ings of IC50 (;3252mgL�1) in that study as can be seen in
Table 3.
Potassium concentration of less than 400mgL�1 has been
reported to enhance the anaerobic performance, whereas at a
higher concentration it had inhibitory effects (Chen et al.,
2008). The two reported values of IC50 (0.15mol L�1,
;5865mgL�1 and 0.74molL�1, ;28934mgL�1) of K con-
centrations (Chen et al., 2008) were found to be substantially
higher than the IC50 of K levels (;2352mgL�1) in this study.
With respect to heavy metals, toxicity was reported to
have the order of Cr>Ni>Cu>Zn (Chen et al., 2008)
which was similar to the present study in which Cr had the
highest toxicity. However, some investigations have reported
Table 2. Metals balance in liquid and solid phase of the bioreactors at the end of anaerobic digestion process (assuming thegaseous metals were trace amount compared to liquid and solid phase)
Category,variousmetalsdosed andcontrolbioreactors
Final(experimental)liquid phaseconcentration(mg L-1) atthe end point
Final(experimental)liquid phasecontent (mg)at theend point
Initial solidphase content(sum of initialMSW metalsand initialsludge seedingmetals, mg)
Dosedmetalsconcentration(mg L-1)
Dosedmetals(mg)
Initial solidphase content(sum of initialdosed metals,initial MSWmetals andinitial sludgeseedingmetals, mg)
Finalsolid phasecontent inthe mixtureof MSWand sludgeseeding (mg)
Ca 0 261.318 104.527 207.22 0.00 0.00 207.22 102.69
Ca 1000 490.751 196.301 207.22 1000.00 400.00 607.22 410.92
Ca 2000 728.073 291.229 207.22 2000.00 800.00 1007.22 715.99
Ca 6000 1559.246 623.698 207.22 6000.00 2400.00 2607.22 1983.52
K 0 188.164 75.265 85.48 0.00 0.00 85.48 10.21
K 1000 490.482 196.193 85.48 1000.00 400.00 485.48 289.29
K 2000 1181.082 472.433 85.48 2000.00 800.00 885.48 413.05
K 6000 2313.446 925.378 85.48 6000.00 2400.00 2485.48 1560.10
Cr 0 0.000 0.000 0.70 0.00 0.00 0.70 0.70
Cr 5 0.014 0.006 0.70 5.00 2.00 2.70 2.70
Cr 50 0.053 0.021 0.70 50.00 20.00 20.70 20.68
Cr 100 0.074 0.029 0.70 100.00 40.00 40.70 40.67
Ni 0 0.058 0.023 0.38 0.00 0.00 0.38 0.36
Ni 5 0.680 0.272 0.38 5.00 2.00 2.38 2.11
Ni 50 0.801 0.321 0.38 50.00 20.00 20.38 20.06
Ni 100 2.847 1.139 0.38 100.00 40.00 40.38 39.24
Zn 0 0.019 0.008 8.46 0.00 0.00 8.46 8.45
Zn 5 0.015 0.006 8.46 5.00 2.00 10.46 10.45
Zn 50 0.067 0.027 8.46 50.00 20.00 28.46 28.43
Zn 100 0.113 0.045 8.46 100.00 40.00 48.46 48.41
Co 0 0.020 0.008 0.07 0.00 0.00 0.07 0.06
Co 5 0.148 0.059 0.07 5.00 2.00 2.07 2.01
Co 50 0.569 0.228 0.07 50.00 20.00 20.07 19.84
Co 100 2.757 1.103 0.07 100.00 40.00 40.07 38.96
Mo 0 0.002 0.001 0.03 0.00 0.00 0.03 0.03
Mo 5 0.105 0.042 0.03 5.00 2.00 2.03 1.99
Mo 50 5.153 2.061 0.03 50.00 20.00 20.03 17.97
Mo 100 17.845 7.138 0.03 100.00 40.00 40.03 32.89
W 0 1.104 0.441 ND 0.00 0.00 0.00 0.00
W 5 0.782 0.313 ND 5.00 2.00 44.44 44.13
W 50 13.148 5.259 ND 50.00 20.00 444.44 439.19
W 100 30.689 12.275 ND 100.00 40.00 888.89 876.61
38 Waste Management & Research 30(1)
at UNIV OF SOUTHERN CALIFORNIA on April 9, 2014wmr.sagepub.comDownloaded from
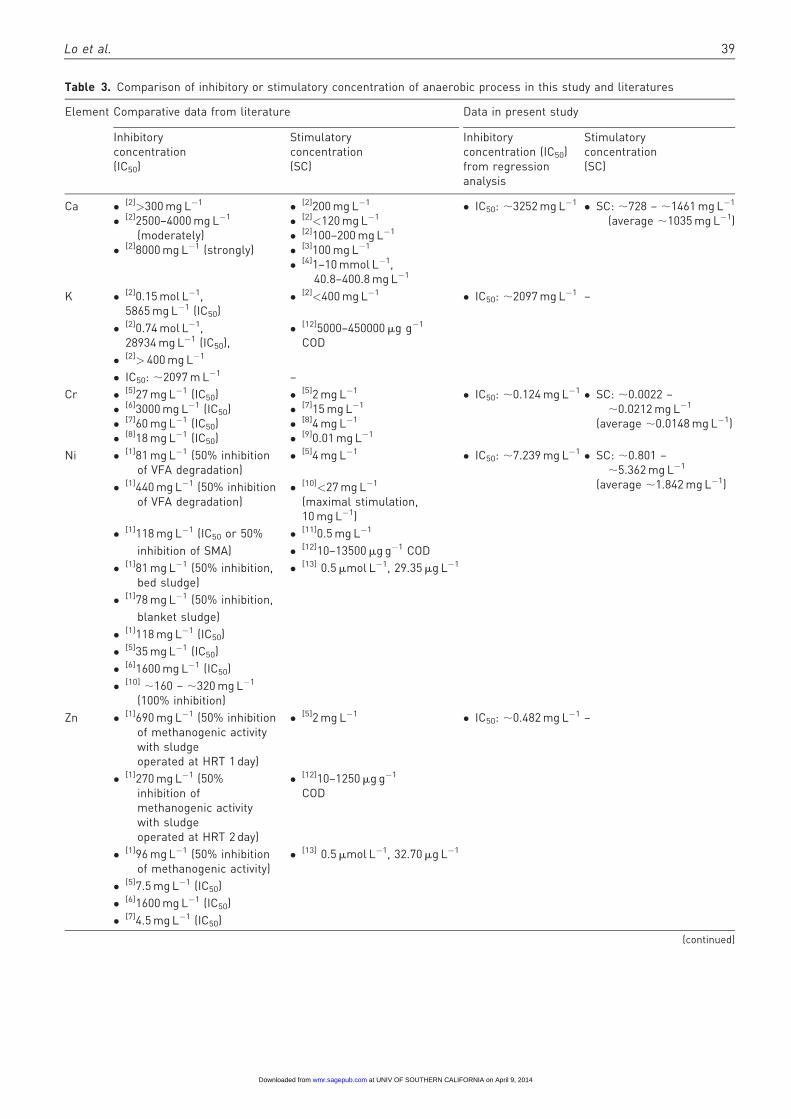
Table 3. Comparison of inhibitory or stimulatory concentration of anaerobic process in this study and literatures
Element Comparative data from literature Data in present study
Inhibitoryconcentration(IC50)
Stimulatoryconcentration(SC)
Inhibitoryconcentration (IC50)from regressionanalysis
Stimulatoryconcentration(SC)
Ca � [2]>300 mg L�1
� [2]2500–4000 mg L�1
(moderately)� [2]8000 mg L�1 (strongly)
� [2]200 mg L�1
� [2]<120 mg L�1
� [2]100–200 mg L�1
� [3]100 mg L�1
� [4]1–10 mmol L�1,40.8–400.8 mg L�1
� IC50: ;3252 mg L�1 � SC: ;728 – ;1461 mg L�1
(average ;1035 mg L�1)
K � [2]0.15 mol L�1,5865 mg L�1 (IC50)
� [2]<400 mg L�1 � IC50: ;2097 mg L�1 –
� [2]0.74 mol L�1,28934 mg L�1 (IC50),
� [12]5000–450000 mg g�1
COD
� [2]> 400 mg L�1
� IC50: ;2097 m L�1 –
Cr � [5]27 mg L�1 (IC50)� [6]3000 mg L�1 (IC50)� [7]60 mg L�1 (IC50)� [8]18 mg L�1 (IC50)
� [5]2 mg L�1
� [7]15 mg L�1
� [8]4 mg L�1
� [9]0.01 mg L�1
� IC50: ;0.124 mg L�1 � SC: ;0.0022 –;0.0212 mg L�1
(average ;0.0148 mg L�1)
Ni � [1]81 mg L�1 (50% inhibitionof VFA degradation)
� [5]4 mg L�1 � IC50: ;7.239 mg L�1 � SC: ;0.801 –;5.362 mg L�1
(average ;1.842 mg L�1)� [1]440 mg L�1 (50% inhibitionof VFA degradation)
� [10]<27 mg L�1
(maximal stimulation,10 mg L�1)
� [1]118 mg L�1 (IC50 or 50% � [11]0.5 mg L�1
inhibition of SMA) � [12]10–13500 mg g�1 COD
� [1]81 mg L�1 (50% inhibition,bed sludge)
� [13] 0.5 mmol L�1, 29.35 mg L�1
� [1]78 mg L�1 (50% inhibition,
blanket sludge)
� [1]118 mg L�1 (IC50)
� [5]35 mg L�1 (IC50)
� [6]1600 mg L�1 (IC50)
� [10] ;160 – ;320 mg L�1
(100% inhibition)
Zn � [1]690 mg L�1 (50% inhibitionof methanogenic activitywith sludgeoperated at HRT 1 day)
� [5]2 mg L�1 � IC50: ;0.482 mg L�1 –
� [1]270 mg L�1 (50%inhibition ofmethanogenic activitywith sludgeoperated at HRT 2 day)
� [12]10–1250 mg g�1
COD
� [1]96 mg L�1 (50% inhibitionof methanogenic activity)
� [13] 0.5 mmol L�1, 32.70 mg L�1
� [5]7.5 mg L�1 (IC50)
� [6]1600 mg L�1 (IC50)
� [7]4.5 mg L�1 (IC50)
(continued)
Lo et al. 39
at UNIV OF SOUTHERN CALIFORNIA on April 9, 2014wmr.sagepub.comDownloaded from

different toxicity results. Altas (2009) demonstrated the
IC50 order of Zn (7.5mgL�1)>Cr (27mgL�1)>Ni
(35mgL�1);Cd (36mgL�1) on methane producing anaer-
obic granular sludge. Li and Fang’s (2007) findings of the
IC50 of individual heavy metals were Cu (30mgL�1)>
Ni;Zn (1600mgL�1)>Cr (3000mgL�1)>Cd
(3500mgL�1)>Pb (5000mgL�1). Lin and Shei (2008) indi-
cated that the IC50 of Zn, Cu and Cr was in the order of Zn
(4.5mgL�1)>Cu (6.5mgL�1)>Cr (60mgL�1). However,
Cu 3mgL�1 and Cr 15mgL�1 in the sucrose fermentation
process were found to lead to the 10–20% hydrogen produc-
tion stimulation. Yue et al. (2007) reported the IC50 of Cd
(4.4mgL�1)>Cu (6.4mgL�1)>Cr (18mgL�1). In addition,
stimulatory concentrations were also reported to be Cd
(1.6mgL�1), Cu (2.4mgL�1), and Cr (4.0mgL�1), respec-
tively. Kuo and Genthner (1996) found that the addition of
Cr(VI) at 0.01mgL�1 could increase the biodegradation
rates of phenol (177%) and benzoate (169%), while Cd(II)
and Cu(II) at 0.01mgL�1 enhanced the biodegradation rates
of benzoate (185%) and 2-chlorophenol (168%), respec-
tively. The findings reported in the above-stated studies
showed a different toxicity order in comparison with that
produced by the present study; however, it supported the
fact that suitable concentrations of Cr and other heavy
metals could enhance the biogas production, which has
been confirmed by this study.
Gikas (2007) reported that a Ni concentration less than
27mgL�1 (maximal stimulation, 10mgL�1) and a Co
concentration less than 19mgL�1 (maximal stimulation,
5mgL�1) could enhance the degradation stimulation of
sludge. These stimulatory levels were higher than the result
of this study [Ni, stimulatory concentration (SC): ;0.801 to
;5.362mgL�1, Co, SC: ;0.148 to ;0.580mgL�1) (Table 3).
The findings in this study were in agreement with the result
concluded by Kida et al. (2001) who reported that the
Ni concentration of 0.5mgL�1and Co concentration
of 0.2mgL�1 were required to facilitate the methane
biotransformation through increases of coenzymes F430 and
corrinoids. Ma et al. (2009) summarized that the stimulatory
micronutrients of Co, Cu, Fe, Mo, Ni, Se and Zn for carbon
monoxide dehydrogenase (CODH), superoxide dismutase
(SODM), formate dehydrogenase (FDH) and sulfate-
reducing bacteria (SRB) were 100–1000, 5–650, 500–8500,
65–300, 10–13 500, 20–600 and 10–1250mg g�1 COD,
respectively. The above-stated varying stimulatory
or inhibitory levels were thought to be due to the varying treat-
ment substrate, microbial community and different operating
conditions. In this study, the toxicity order of metals in
terms of the average IC50 was found to be Cr
(;0.124mgL�1)>Zn (;0.482mgL�1)>Ni (;7.239mgL�1)
>Co (;8.625mgL�1)>K (;2097mgL�1>Ca
(;3252mgL�1).
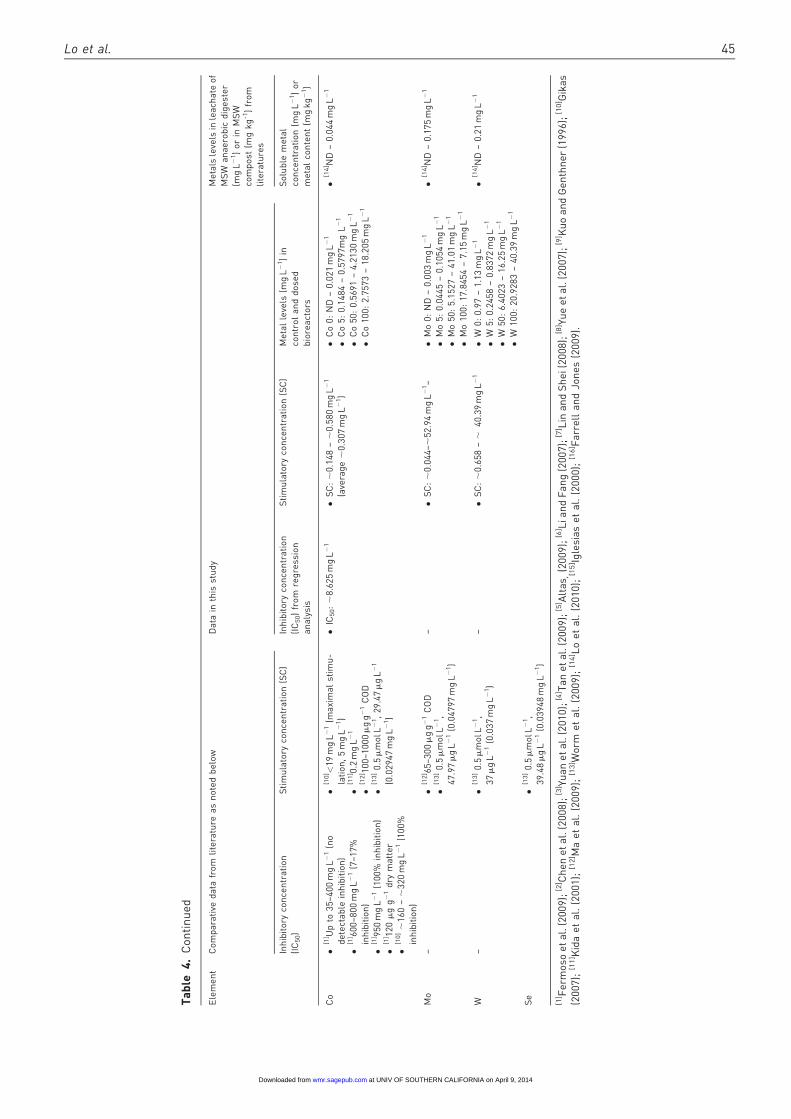
Mo and W could increase the degrading activity of
microbes in a UASB reactor (Worm et al., 2009) by adding
Mo (0.5mmolL�1, 21mgL�1) and W (0.5mmolL�1,
37mgL�1). This same phenomenon was observed in the
Table 3. Continued
Element Comparative data from literature Data in present study
Inhibitoryconcentration(IC50)
Stimulatoryconcentration(SC)
Inhibitoryconcentration (IC50)from regressionanalysis
Stimulatoryconcentration(SC)
Co � [1]Up to 35–400 mg L�1
(no detectableinhibition)
� 10]<19 mg L�1 (maximalstimulation, 5 mg L�1)
� IC50: ;8.625 mg L�1 � SC: ;0.148 –;0.580 mg L�1
(average ;0.307 mg L�1)
� [1]600–800 mg L�1
(7–17% inhibition)� [11]0.2 mg L�1
� [1]950 mg L�1 (100% inhibition) � [12]100–1000 mg g�1 COD
� [1]120 mg g dry matter�1 � [13] 0.5 mmol L�1, 29.47 mg L�1
� [10] ;160 – ;320 mg L�1
(100% inhibition)
Mo – � [12]65–300 mg g�1 COD� [13] 0.5 mM, 21 mg L�1
– � SC: ;0.044 –;52.94 mg L�1
W – � [13] 0.5 mM, 37 mg L�1 – � SC: ;0.658 –;40.39 mg L�1
[1]Fermoso et al. (2009); [2]Chen et al. (2008); [3]Yuan et al. (2010); [4]Tan et al. (2009); [5]Altas (2009); [6]Li and Fang (2007); [7]Lin and Shei (2008);[8]Yue et al. (2007); [9]Kuo and Genthner (1996); [10]Gikas (2007); [11]Kida et al. (2001); [12]Ma et al. (2009); [13]Worm et al. (2009).
40 Waste Management & Research 30(1)
at UNIV OF SOUTHERN CALIFORNIA on April 9, 2014wmr.sagepub.comDownloaded from

Ta
ble
4.
Me
tals
leve
lsin
MS
Wa
na
ero
bic
dig
est
er’
sle
ach
ate
an
dw
ast
eco
mp
ost
inth
isst
ud
ya
nd
com
pa
rati
ved
ata
ina
na
ero
bic
dig
est
ion
or
ferm
en
tati
on
pro
cess
fro
mli
tera
ture
s
Ele
me
nt
Co
mp
ara
tive
da
tafr
om
lite
ratu
rea
sn
ote
db
elo
wD
ata
inth
isst
ud
yM
eta
lsle
vels
inle
ach
ate
of
MS
Wa
na
ero
bic
dig
est
er
(mg
L�
1)
or
inM
SW
com
po
st(m
gk
g-1
)fr
om
lite
ratu
res
Inh
ibit
ory
con
cen
tra
tio
n
(IC
50)
Sti
mu
lato
ryco
nce
ntr
ati
on
(SC
)In
hib
ito
ryco
nce
ntr
ati
on
(IC
50)
fro
mre
gre
ssio
n
an
aly
sis
Sti
mu
lato
ryco
nce
ntr
ati
on
(SC
)M
eta
lle
vels
(mg
L�
1)
in
con
tro
la
nd
do
sed
bio
rea
cto
rs
So
lub
lem
eta
l
con
cen
tra
tio
n(m
gL�
1)
or
me
tal
con
ten
t(m
gk
g�
1)
Al
�[2
] 10
00
mg
L�
1A
l(O
H) 3
(IC
50
for
me
tha
no
ge
ns;
IC7
2fo
r
ace
tog
en
s)
�[2
] 25
00
mg
L�
1A
l+3
tole
ran
ce
aft
er
acc
lim
ati
on
�[1
4] N
D–
1.0
5m
gL�
1
Ca
�[2
] >3
00
mg
L�
1
�[2
] 25
00
-40
00
mg
L�
1
(mo
de
rate
ly)
�[2
] 80
00
mg
L�
1(s
tro
ng
ly)
�[2
] 20
0m
gL�
1
�[2
] <1
20
mg
L�
1
�[2
] 10
0–
20
0m
gL�
1
�[3
] 10
0m
gL�
1
�[4
] 1–
10
mm
olL�
1,
(40
.8–
40
0.8
mg
L�
1)
�IC
50:
;3
25
2m
gL�
1�
SC
:;
72
8–
;1
46
1m
gL�
1
(ave
rag
e;
10
35
mg
L�
1)
�C
a0
:2
61
.32
–3
44
.8m
gL�
1
�C
a1
00
0:
33
8.4
–7
56
.7m
gL�
1
�C
a2
00
0:
72
8.0
7–
14
61
.04
mg
L�
1
�C
a6
00
0:
15
59
.25
–3
83
6m
gL�
1
�[1
4] 2
9.7
1–
55
9.6
mg
L�
1
K�
[2] 0
.15
M,
(58
65
mg
L�
1)
(IC
50)
�[2
] 0.7
4M
,2
89
34
mg
L�
1(I
C5
0),
�[2
] <4
00
mg
L�
1
�[2
] 1M
�[2
] >4
00
mg
L�
1
�[1
2] 5
00
0–
45
00
00
mg
g�
1C
OD
�IC
50:
;2
09
7m
gL�
1–
�K
0:
17
9.8
–2
76
.6m
gL�
1
�K
10
00
:4
89
.93
–6
73
mg
L�
1
�K
20
00
:1
18
1.0
8–
13
95
mg
L�
1
�K
60
00
:2
31
3.4
5–
37
33
mg
L�
1
�[1
4] 2
45
.8–
54
2.6
mg
L�
1
Mg
�[2
] 40
0m
gL�
1,
gro
wth
cea
sed
�[2
] 72
0m
gL�
1fo
r
Me
tha
no
sarc
ina
�[1
4] 2
2.7
8–
82
.94
mg
L�
1
Na
�[2
] 35
00
–5
50
0m
gL�
1(m
od
er-
ate
ly)
�[2
]8
00
0m
gL�
1(s
tro
ng
ly)
�[2
] 5.6
–5
3g
L�
1(I
C5
0)
�[2
] 0.3
5M
Na
+1
wh
en
Mg
+2¼
0.0
5m
M
�[2
] 10
0–
20
0m
gL�
1fo
rm
eso
ph
ilic
an
ae
rob
es
�[2
] 23
0m
gL�
1fo
rm
eso
ph
ilic
ace
tacl
ast
icm
eth
an
og
en
s
�[2
] 35
0m
gL�
1fo
rm
eso
ph
ilic
hyd
rog
en
otr
op
hic
me
tha
no
ge
ns
�[4
] 15
0g
L�
1N
aC
l
�[1
4] 3
6.6
–1
51
.08
mg
L�
1
Mn
�[1
3]
0.5
mm
olL�
1,
27
.47
mg
L�
1
(0.0
27
47
mg
L�
1)
�[1
4] N
D–
1.1
1m
gL�
1
Cd
[5] 3
6m
gL�
1(I
C5
0)
[5] 3
30
mg
L�
1(I
C5
0)
[5] >
55
0m
gL�
1(I
C5
0)
[5] 1
50
mg
L�
1(I
C5
0)
[5] 3
30
0m
gL�
1(I
C5
0)
[5] 1
70
mg
L�
1(I
C5
0)
[5] 7
.7m
gL�
1(I
C5
0)
�[6
] 33
00
mg
L�
1(I
C5
0)
�[6
] 17
0m
gL�
1(I
C5
0)
�[6
] 33
0m
gL�
1(I
C5
0)
�[6
] 34
00
mg
L�
1(I
C5
0)
�[6
] 11
0m
gL�
1(I
C5
0)
�[6
] 18
0m
gL�
1(I
C5
0)
�[1
4] N
D–
1.3
1m
gL�
1
�[1
5] N
D–
0.3
06
0.0
8m
gL�
1
(co
nti
nu
ed
)
Lo et al. 41
at UNIV OF SOUTHERN CALIFORNIA on April 9, 2014wmr.sagepub.comDownloaded from

Ta
ble
4.
Co
nti
nu
ed
Ele
me
nt
Co
mp
ara
tive
da
tafr
om
lite
ratu
rea
sn
ote
db
elo
wD
ata
inth
isst
ud
yM
eta
lsle
vels
inle
ach
ate
of
MS
Wa
na
ero
bic
dig
est
er
(mg
L�
1)
or
inM
SW
com
po
st(m
gk
g-1
)fr
om
lite
ratu
res
Inh
ibit
ory
con
cen
tra
tio
n
(IC
50)
Sti
mu
lato
ryco
nce
ntr
ati
on
(SC
)In
hib
ito
ryco
nce
ntr
ati
on
(IC
50)
fro
mre
gre
ssio
n
an
aly
sis
Sti
mu
lato
ryco
nce
ntr
ati
on
(SC
)M
eta
lle
vels
(mg
L�
1)
in
con
tro
la
nd
do
sed
bio
rea
cto
rs
So
lub
lem
eta
l
con
cen
tra
tio
n(m
gL�
1)
or
me
tal
con
ten
t(m
gk
g�
1)
�[6
] 28
00
mg
L�
1(I
C5
0)
�[6
] >5
50
mg
L�
1(I
C5
0)
�[6
] 15
0m
gL�
1(I
C5
0)
�[8
] 4.4
–7
.1m
gL�
1
�[8
] 1.6
mg
L�
1�
[14
] ND
–1
.31
mg
L�
1
�[1
5] N
D–
0.3
06
0.0
8m
gL�
1
Cr
�[5
] 27
mg
L�
1(I
C5
0)
�[5
] 25
0m
gL�
1(I
C5
0)
��[
5] 6
30
mg
L�
1(I
C5
0)
�[5
] 21
0m
gL�
1(I
C5
0)
�[5
] 30
00
mg
L�
1(I
C5
0)
�[5
] 72
mg
L�
1(I
C5
0)
�[6
] 30
00
mg
L�
1L
(IC
50)
�[6
] 72
mg
L�
1(I
C5
0)
�[6
] 25
0m
gL�
1(I
C5
0)
�[6
] 25
00
mg
L�
1(I
C5
0)
�[6
] 42
mg
L�
1(I
C5
0)
�[6
] 14
0m
gL�
1(I
C5
0)
�[6
] 22
00
mg
L�
1(I
C5
0)
�[6
] 63
0m
gL�
1(I
C5
0)
�[6
] 21
0m
gL�
1(I
C5
0)
�[7
] 60
mg
L�
1(I
C5
0,
Hyd
rog
en
esi
s)
�[7
] 17
mg
L�
1(I
C5
0,
Aci
do
ge
ne
sis)
�[7
] 14
.7m
gL�
1(I
C5
0,
Me
tha
no
ge
ne
sis)
�[8
] 18
–2
7.5
mg
L�
1(I
C5
0)
�[5
] 2m
gL�
1
�[7
] 15
mg
L�
1
�[8
] 4m
gL�
1
�[9
] 0.0
1m
gL�
1
�IC
50:
;0
.12
4m
gL�
1�
SC
:;
0.0
02
2–
;0
.02
12
mg
L�
1
(ave
rag
e;
0.0
14
8m
gL�
1)
�C
r0
:N
D–
0.0
08
mg
L�
1
�C
r5
:0
.00
2–
0.0
21
2m
gL�
1
�C
r5
0:
0.0
41
2–
0.1
03
1m
gL�
1
�C
r1
00
:0
.07
35
–0
.25
02
mg
L�
1
�[1
4] N
D–
0.0
1m
gL�
1
Cu
�[5
] 13
0m
gL�
1(I
C5
0)
�[5
] 15
8m
gL�
1(I
C5
0)
�[5
] 17
5m
gL�
1(I
C5
0)
�[5
] 30
mg
L�
1(I
C5
0)
�[5
] 35
0m
gL�
1(I
C5
0)
�[5
] 65
mg
L�
1(I
C5
0)
�[5
] 12
.5m
gL�
1(I
C5
0)
�[6
] 30
mg
L�
1(I
C5
0)
�[6
] 35
0m
gL�
1(I
C5
0)
�[6
] 65
mg
L�
1(I
C5
0)
�[6
] 13
0m
gL�
1(I
C5
0)
�[6
] 30
mg
L�
1(I
C5
0)
�[6
] 37
mg
L�
1(I
C5
0)
�[6
] 13
0m
gL�
1(I
C5
0)
�[6
] 10
mg
L�
1(I
C5
0)
�[6
] 15
8m
gL�
1(I
C5
0)
�[6
] 17
5m
gL�
1(I
C5
0)
�[7
] 6.5
mg
L�
1(I
C5
0,
Hyd
rog
en
esi
s)
�[7
] 3m
gL�
1
�[8
] 2.4
mg
L�
1
�[1
2] 5
–6
50
mg
g�
1C
OD
�[1
3]
0.5
mm
olL�
1,
31
.77
mg
L�
1
(0.0
31
77
mg
L�
1)
�[1
4] N
D–
0.0
5m
gL�
1
�[1
5] 0
.06
60
.05
–
0.2
16
0.2
3m
gL�
1
�[1
6] ;
13
0–
;3
50
mg
kg�
1
(co
nti
nu
ed
)
42 Waste Management & Research 30(1)
at UNIV OF SOUTHERN CALIFORNIA on April 9, 2014wmr.sagepub.comDownloaded from
Ta
ble
4.
Co
nti
nu
ed
Ele
me
nt
Co
mp
ara
tive
da
tafr
om
lite
ratu
rea
sn
ote
db
elo
wD
ata
inth
isst
ud
yM
eta
lsle
vels
inle
ach
ate
of
MS
Wa
na
ero
bic
dig
est
er
(mg
L�
1)
or
inM
SW
com
po
st(m
gk
g-1
)fr
om
lite
ratu
res
Inh
ibit
ory
con
cen
tra
tio
n
(IC
50)
Sti
mu
lato
ryco
nce
ntr
ati
on
(SC
)In
hib
ito
ryco
nce
ntr
ati
on
(IC
50)
fro
mre
gre
ssio
n
an
aly
sis
Sti
mu
lato
ryco
nce
ntr
ati
on
(SC
)M
eta
lle
vels
(mg
L�
1)
in
con
tro
la
nd
do
sed
bio
rea
cto
rs
So
lub
lem
eta
l
con
cen
tra
tio
n(m
gL�
1)
or
me
tal
con
ten
t(m
gk
g�
1)
�[7
] 35
0m
gL�
1(I
C5
0,
Hyd
rog
en
esi
s)
�[7
] 0.9
mg
L�
1(I
C5
0,
Aci
do
ge
ne
sis)
�[7
] 2–
8m
gL�
1(I
C5
0,
Aci
do
ge
ne
sis)
�[7
] 36
4m
gL�
1(I
C5
0,
Aci
do
ge
ne
sis)
�[7
] 12
.5m
gL�
1(I
C5
0,
Me
tha
no
ge
ne
sis)
�[8
] 6.4
–7
.4m
gL�
1
�[7
] 3m
gL�
1
�[8
] 2.4
mg
L�
1
�[1
2] 5
–6
50
mg
g�
1C
OD
�[1
3]
0.5
mm
olL�
1,
31
.77
mg
L�
1
(0.0
31
77
mg
L�
1)
�[1
4] N
D–
0.0
5m
gL�
1
�[1
5] 0
.06
60
.05
–
0.2
16
0.2
3m
gL�
1
�[1
6] ;
13
0–
;3
50
mg
kg�
1
Ni
�[1
] 81
mg
L�
1(5
0%
inh
ibit
ion
of
VF
Ad
eg
rad
ati
on
)
�[1
] 44
0m
gL�
1(5
0%
inh
ibit
ion
of
VF
Ad
eg
rad
ati
on
)
�[1
] 11
8m
gL�
1(I
C5
0o
r5
0%
inh
ibit
ion
of
SM
A)
�[1
] 81
mg
L�
1(5
0%
inh
ibit
ion
,b
ed
lud
ge
)
�[1
] 78
mg
L�
1(5
0%
inh
ibit
ion
,
bla
nk
et
slu
dg
e)
�[1
] 11
8m
gL�
1(I
C5
0)
�[5
] 35
mg
L�
1(I
C5
0)
�[5
] 16
00
mg
L�
1(I
C5
0)
�[5
] 11
8m
gL�
1(I
C5
0)
�[5
] 10
0m
gL�
1(I
C5
0)
�[5
] 13
00
mg
L�
1(I
C5
0)
�[6
] 13
00
mg
L�
1(I
C5
0)
�[6
] 16
00
mg
L�
1(I
C5
0)
�[6
] 16
00
mg
L�
1(I
C5
0)
�[6
] 14
00
mg
L�
1(I
C5
0)
�[6
] 11
8m
gL�
1(I
C5
0)
�[6
] 10
0m
gL�
1(I
C5
0)
�[1
0]
;1
60
–;
32
0m
gL�
1(1
00
%
inh
ibit
ion
)
�[5
] 4m
gL�
1
�[1
0] <
27
mg
L�
1(m
axi
ma
l
stim
ula
tio
n,
10
mg
L�
1)
�[1
1] 0
.5m
gL�
1
�[1
2] 1
0–
13
50
0m
gg�
1C
OD
�[1
3]
0.5
mm
olL�
1,
29
.35
mg
L�
1
(0.0
29
35
mg
L�
1)
�IC
50:
;7
.23
9m
gL�
1�
SC
:;
0.8
01
–;
5.3
62
mg
L�
1
(ave
rag
e;
1.8
42
mg
L�
1)
�N
i0
:0
.05
6–
0.0
66
mg
L�
1
�N
i5
:0
.68
–2
.37
29
mg
L�
1
�N
i5
0:
0.8
01
3–
5.3
61
5m
gL�
1
�N
i1
00
:2
.86
49
–1
2.3
45
mg
L�
1
�[1
4] N
D–
0.0
26
mg
L�
1
�[1
5] 0
.34
60
.16
–
0.8
26
0.2
0m
gL�
1
�[1
6] ;
45
–;
70
mg
kg�
1
Pb
�[5
] 80
00
mg
L�
1(I
C5
0)
�[5
] >5
00
0m
gL�
1(I
C5
0)
�[5
] 67
.2m
gL�
1(I
C5
0)
�[6
] >5
00
0m
gL�
1(I
C5
0)
�[6
] 80
00
mg
L�
1(I
C5
0)
�[6
] 32
00
mg
L�
1(I
C5
0)
�[4
] 1m
mo
lL�
1,
0.2
07
mg
L�
1�
[14
] ND
–0
.76
mg
L�
1
�[1
5] 0
.04
60
.04
–
0.7
56
0.3
0m
gL�
1
�[1
6] ;
18
0–
68
0m
gk
g�
1
(co
nti
nu
ed
)
Lo et al. 43
at UNIV OF SOUTHERN CALIFORNIA on April 9, 2014wmr.sagepub.comDownloaded from

Ta
ble
4.
Co
nti
nu
ed
Ele
me
nt
Co
mp
ara
tive
da
tafr
om
lite
ratu
rea
sn
ote
db
elo
wD
ata
inth
isst
ud
yM
eta
lsle
vels
inle
ach
ate
of
MS
Wa
na
ero
bic
dig
est
er
(mg
L�
1)
or
inM
SW
com
po
st(m
gk
g-1
)fr
om
lite
ratu
res
Inh
ibit
ory
con
cen
tra
tio
n
(IC
50)
Sti
mu
lato
ryco
nce
ntr
ati
on
(SC
)In
hib
ito
ryco
nce
ntr
ati
on
(IC
50)
fro
mre
gre
ssio
n
an
aly
sis
Sti
mu
lato
ryco
nce
ntr
ati
on
(SC
)M
eta
lle
vels
(mg
L�
1)
in
con
tro
la
nd
do
sed
bio
rea
cto
rs
So
lub
lem
eta
l
con
cen
tra
tio
n(m
gL�
1)
or
me
tal
con
ten
t(m
gk
g�
1)
Zn
�[1
] 69
0m
gL�
1(5
0%
inh
ibit
ion
of
me
tha
no
ge
nic
act
ivit
yw
ith
slu
dg
eo
pe
rate
da
tH
RT
1d
ay)
�[1
] 27
0m
gL�
1(5
0%
inh
ibit
ion
of
me
tha
no
ge
nic
act
ivit
yw
ith
slu
dg
eo
pe
rate
da
tH
RT
2d
ay)
�[1
] 96
mg
L�
1(5
0%
inh
ibit
ion
of
me
tha
no
ge
nic
act
ivit
y)
�[5
] 7.5
mg
L�
1(I
C5
0)
�[5
] 27
0m
gL�
1(I
C5
0)
�[5
] 97
mg
L�
1(I
C5
0)
�[5
] 11
0m
gL�
1(I
C5
0)
�[5
] 15
00
mg
L�
1(I
C5
0)
�[5
] >5
00
mg
L�
1(I
C5
0)
�[5
] 12
0m
gL�
1(I
C5
0)
�[5
] 16
mg
L�
1(I
C5
0)
�[6
] 15
00
mg
L�
1(I
C5
0)
�[6
] >5
00
mg
L�
1(I
C5
0)
�[6
] 12
0m
gL�
1(I
C5
0)
�[6
] 27
0m
gL�
1(I
C5
0)
�[6
] 13
5m
gL�
1(I
C5
0)
�[6
] 20
0m
gL�
1(I
C5
0)
�[6
] 12
00
mg
L�
1(I
C5
0)
�[6
] 97
mg
L�
1(I
C5
0)
�[6
] 11
0m
gL�
1(I
C5
0)
�[7
] 4.5
mg
L�
1(I
C5
0,
Hyd
rog
en
esi
s)
�[7
] >3
50
mg
L�
1(I
C5
0,
Hyd
rog
en
esi
s)
�[7
] 3.5
mg
L�
1(I
C5
0,
Aci
do
ge
ne
sis)
�[7
] 7–
18
mg
L�
1(I
C5
0,
Aci
do
ge
ne
sis)
�[7
] >3
64
mg
L�
1(I
C5
0,
Aci
do
ge
ne
sis)
�[7
] 16
mg
L�
1(I
C5
0,
Me
tha
no
ge
ne
sis)
�[5
] 2m
gL�
1
�[1
2] 1
0–
12
50
mg
g�
1C
OD
�[1
3]
0.5
mm
olL�
1,
32
.70
mg
L�
1
(0.0
32
7m
gL�
1)
�IC
50:
;0
.48
2m
gL�
1–
�Z
n0
:0
.01
–0
.02
46
mg
L�
1
�Z
n5
:0
.01
01
–0
.01
51
mg
L�
1
�Z
n5
0:
0.0
67
2–
0.6
29
5m
gL�
1
�Z
n1
00
:0
.11
27
–1
.11
32
mg
L�
1
�[1
5] 0
.07
86
0.0
74
–
1.2
86
1.3
1m
gL�
1
�[1
6] ;
15
0–
;3
00
mg
kg�
1
Fe
�[1
2] 5
00
–8
50
0m
gg�
1C
OD
�[1
4] 0
.01
7–
0.3
46
mg
L�
1
�[1
3]
5m
mo
lL�
1,
27
9.2
5m
gL�
1
(0.2
79
25
mg
L�
1)
�[1
5] 3
.54
60
.33
–
19
2.2
65
6.0
mg
L�
1
(co
nti
nu
ed
)
44 Waste Management & Research 30(1)
at UNIV OF SOUTHERN CALIFORNIA on April 9, 2014wmr.sagepub.comDownloaded from
Ta
ble
4.
Co
nti
nu
ed
Ele
me
nt
Co
mp
ara
tive
da
tafr
om
lite
ratu
rea
sn
ote
db
elo
wD
ata
inth
isst
ud
yM
eta
lsle
vels
inle
ach
ate
of
MS
Wa
na
ero
bic
dig
est
er
(mg
L�
1)
or
inM
SW
com
po
st(m
gk
g-1
)fr
om
lite
ratu
res
Inh
ibit
ory
con
cen
tra
tio
n
(IC
50)
Sti
mu
lato
ryco
nce
ntr
ati
on
(SC
)In
hib
ito
ryco
nce
ntr
ati
on
(IC
50)
fro
mre
gre
ssio
n
an
aly
sis
Sti
mu
lato
ryco
nce
ntr
ati
on
(SC
)M
eta
lle
vels
(mg
L�
1)
in
con
tro
la
nd
do
sed
bio
rea
cto
rs
So
lub
lem
eta
l
con
cen
tra
tio
n(m
gL�
1)
or
me
tal
con
ten
t(m
gk
g�
1)
Co
�[1
] Up
to3
5–
40
0m
gL�
1(n
o
de
tect
ab
lein
hib
itio
n)
�[1
] 60
0–
80
0m
gL�
1(7
–1
7%
inh
ibit
ion
)
�[1
] 95
0m
gL�
1(1
00
%in
hib
itio
n)
�[1
] 12
0m
gg�
1d
rym
att
er
�[1
0]
;1
60
–;
32
0m
gL�
1(1
00
%
inh
ibit
ion
)
�[1
0] <
19
mg
L�
1(m
axi
ma
lst
imu
-
lati
on
,5
mg
L�
1)
�[1
1] 0
.2m
gL�
1
�[1
2] 1
00
–1
00
0m
gg�
1C
OD
�[1
3]
0.5
mm
olL�
1,
29
.47
mg
L�
1
(0.0
29
47
mg
L�
1)
�IC
50:
;8
.62
5m
gL�
1�
SC
:;
0.1
48
–;
0.5
80
mg
L�
1
(ave
rag
e;
0.3
07
mg
L�
1)
�C
o0
:N
D–
0.0
21
mg
L�
1
�C
o5
:0
.14
84
–0
.57
97
mg
L�
1
�C
o5
0:
0.5
69
1–
4.2
13
0m
gL�
1
�C
o1
00
:2
.75
73
–1
8.2
05
mg
L�
1
�[1
4] N
D–
0.0
44
mg
L�
1
Mo
–�
[12
] 65
–3
00
mg
g�
1C
OD
�[1
3]
0.5
mm
olL�
1,
47
.97
mg
L�
1(0
.04
79
7m
gL�
1)
–�
SC
:;
0.0
44
–;
52
.94
mg
L�
1–
�M
o0
:N
D–
0.0
03
mg
L�
1
�M
o5
:0
.04
45
–0
.10
54
mg
L�
1
�M
o5
0:
5.1
52
7–
41
.01
mg
L�
1
�M
o1
00
:1
7.8
45
4–
7.1
5m
gL�
1
�[1
4] N
D–
0.1
75
mg
L�
1
W–
�[1
3]
0.5
mm
olL�
1,
37
mg
L�
1(0
.03
7m
gL�
1)
–�
SC
:;
0.6
58
–;
40
.39
mg
L�
1�
W0
:0
.97
–1
.13
mg
L�
1
�W
5:
0.2
45
8–
0.8
37
2m
gL�
1
�W
50
:6
.40
23
–1
6.2
5m
gL�
1
�W
10
0:
20
.92
83
–4
0.3
9m
gL�
1
�[1
4] N
D–
0.2
1m
gL�
1
Se
�[1
3]
0.5
mm
olL�
1,
39
.48
mg
L�
1(0
.03
94
8m
gL�
1)
[1] F
erm
oso
et
al.
(20
09
);[2
] Ch
en
et
al.
(20
08
);[3
] Yua
ne
ta
l.(2
01
0);
[4] T
an
et
al.
(20
09
);[5
] Alt
as
(20
09
);[6
] Lia
nd
Fa
ng
(20
07
);[7
] Lin
an
dS
he
i(2
00
8);
[8] Y
ue
et
al.
(20
07
);[9
] Ku
oa
nd
Ge
nth
ne
r(1
99
6);
[10
] Gik
as
(20
07
);[1
1] K
ida
et
al.
(20
01
);[1
2] M
ae
ta
l.(2
00
9);
[13
] Wo
rme
ta
l.(2
00
9);
[14
] Lo
et
al.
(20
10
);[1
5] Ig
lesi
as
et
al.
(20
00
);[1
6] F
arr
ell
an
dJo
ne
s(2
00
9).
Lo et al. 45
at UNIV OF SOUTHERN CALIFORNIA on April 9, 2014wmr.sagepub.comDownloaded from

present study, where Mo and W addition enhanced the
anaerobic biotransformation and reaction process. In the
present study, the enhancement concentrations of MSW
digestion performance varied greatly from ;0.044 to
;52.94mgL�1 for Mo and from ;0.658 to ;40.39mgL�1
for W (both dosed under 100mgL�1 equivalent to
;2.67mg g�1 VS), respectively. This result was thought to
imply that Mo and W has a lesser adsorption by MSW
and sludge mixture and has a higher acclimatization of
anaerobic bacteria in comparison with other metals.
Various synergistic and antagonistic effects of metals on
the anaerobic process might take place in the anaerobic pro-
cess. Chen et al. (2008) reported the synergistic and
antagonistic effects of heavy metals, alkali metals and other
compounds on the anaerobic process. Other investigations
also showed that a suitable combination of trace metals
Mn/Ni/Zn/Fe/Cu (Lin et al., 1998), Fe/Ni/Co/W (Espinosa
et al., 1995), and Fe/Zn/Cu/Ni/Co (Zhang et al., 2003) could
enhance the anaerobic digestion and the methanogens’ activ-
ity. However, the mixed metals of Cu, Zn, Ni, and Cr at
varying concentrations from 20 to 30mgL�1 (Wang, 1995)
demonstrated antagonistic effects on the anaerobic process.
Stimulations on the anaerobic process were reported mainly
to be due to the presence of suitable amounts of the metals
nutrients that are necessary for the growth factor or
co-factor, F430 and corrinoids (Takashima and Speece,
4
5
6
7
8
9
0
Day
pH
Control Ca 1000 Ca 2000 Ca 6000
4
5
6
7
8
9
Day
pH
Control K 1000 K 2000 K 6000
4
5
6
7
8
9
0
Day
pH
Control Cr 5 Cr 50 Cr 100
4
5
6
7
8
9
Day
pH
Control Ni 5 Ni 50 Ni 100
4
5
6
7
8
9
Day
pH
Control Zn 5 Zn 50 Zn 100
4
5
6
7
8
9
Day
pHControl Co 5 Co 50 Co 100
4
5
6
7
8
9
Day
pH
Control Mo 5 Mo 50 Mo 100
4
5
6
7
8
9
Day
pH
Control W 5 W 50 W 100
(a) (b)
(c) (d)
(e) (f)
(g)(h)
10 20 30 40 50
10 20 30 40 50
0 10 20 30 40 50
0 10 20 30 40 50
0 10 20 30 40 50
0 10 20 30 40 50
0 10 20 30 40 50
0 10 20 30 40 50
Figure 4. pH values in the control and dosed bioreactors during the anaerobic digestion process.
46 Waste Management & Research 30(1)
at UNIV OF SOUTHERN CALIFORNIA on April 9, 2014wmr.sagepub.comDownloaded from
1990, Lin et al., 1998, Ren and Frymer, 2003). It was further
interpreted that metals such as Ni, Cd, Pb, Cu, Ag, Co, Mn,
Al might be bioaccumulated onto the cell walls and inside the
cell, cell membrane, cell surface, intracellular, extracellular,
vacuole, lipopolysaccharide bodies and polyphosphate
bodies (Malik, 2004). This phenomenon would cause poten-
tial inhibition that could be represented by a non-competitive
model rather than the competitive and uncompetitive model
(Ren and Frymer, 2003, Yue et al., 2007). In particular, the
toxicity might be attributed to the metals binding to sulfhy-
dryl groups, amino, carboxylate, imidazole and hydroxyl
radicals of enzymes and other proteins (Ren and Frymer,
2003).
Several researchers also reported similar results when
metals were bound to the amines, sulfate groups and carbox-
ylic groups (Peiffer et al., 1994) and other functional groups
such as mercapto groups, carboxylic groups, phosphate and
the like (Becker and Peiffer, 1997) and acidic groups inside
bacterial cell walls (Artola et al., 1997). Although individual
metals have provided preliminary information of inhibitory
or stimulatory effects on the anaerobic digestion in the pre-
sent study, it is expected that the mixed metals in different
combination might need to be further investigated to under-
stand their synergistic or antagonistic effects on the anaero-
bic digestion of MSW thoroughly, particularly if MSW
might be co-digested or co-disposed with MSW incinerator
ashes or sludge or other organic matters that might have
been contaminated with metals.
Implication and application
For the operation of anaerobic digesters the OFMSW should
be prepared to be TS (;6 to 12%) and VS (;5 to 10%)
Anaerobic digesters may be commonly operated at pH
;6.5 to 7.5, proper inoculum and 35 8C suitable for anaero-
bic digestion. Stimulatory concentrations observed in this
study could be dosed to enhance the anaerobic digestion.
Additionally, metals having potential toxic effects on anaer-
obic digestion might be avoided or diluted to suitable levels
which might exert no adverse or beneficial effects on MSW
digestion.
Conclusions
It was evident from this study that metals had potential det-
rimental or beneficial effects on the anaerobic treatment of
MSW depending on their different levels. Results showed
that inhibitory concentrations IC50 of Ca, K, Cr, Ni, Zn
and Co were ;3252, ;2097, ;0.124, ;7.239, ;0.482,
;8.625mgL�1, respectively. However, inhibitory effects
were not found in Mo and W dosed less than 100mgL�1.
On the other hand, Ca (;728 to ;1461mgL�1), Cr (;0.0022
to ;0.0212mgL�1), Ni (;0.801 to ;5.362mgL�1), Co
(;0.148 to ;0.580mgL�1), Mo (;0.044 to ;52.94mgL�1)
and W (;0.658 to ;40.39mgL�1) had the potential to
enhance the biogas production. Metals ranges for stimula-
tion and IC50 for inhibition might be affected by the adsorp-
tion of MSW with potential functional groups or bacterial
biomass and dynamic and kinetic process by microbial diges-
tion. Metals ranges for stimulation found and IC50 by linear
regression via control and dosed bioreactors could give base-
line information for the OFMSW (TS ;6% to ;10%) anaer-
obic digestion.
Acknowledgement
This research is funded by National Science Council, Taiwan,
ROC, with contract No. of NSC 94-2211-E-324-003. The finan-cial support is gratefully acknowledged.
References
Altas L (2009) Inhibitory effect of heavy metals on methane-producing
anaerobic granular sludge. Journal of Hazardous Materials 162:
1551–1556.
Artola A, Balaguer MD and Rigola M (1997) Heavy metal binding to
anaerobic sludge. Water Research 31: 997–1004.
Banks CJ and Lo HM (2003) Assessing the effects of municipal solid
waste incinerator bottom ash on the decomposition of biodegradable
waste using a completely mixed anaerobic reactor. Waste
Management & Research 21: 225–234.
Becker U and Peiffer S (1997) Heavy-metal ion complexation by partic-
ulate matter in the leachate of solid waste: a multi-method approach.
Journal of Contaminant Hydrology 24: 313–344.
Chen Y, Cheng JJ and Creamer KS (2008) Inhibition of anaerobic diges-
tion process: A review. Bioresource Technology 99: 4044–4064.
Espinosa A, Rosas L, Ilangovan K and Noyola A (1995) Effect of trace
metals on the anaerobic degradation of volatile fatty acids in molas-
ses stillage. Water Research 32: 121–129.
Farrell M and Jones DL (2009) Heavy metal contamination of a mixed
waste compost: metal speciation and fate. Bioresource Technology
100: 4423–4432.
Fermoso FG, Bartacek J, Jansen S and Lens PNL (2009) Metal supple-
mentation to UASB bioreactors: from cell-metal interactions to full-
scale application. Science of the Total Environment 407: 3652–3667.
Gikas P (2007) Kinetic responses of activated sludge to individual and
joint nickel (Ni(II)) and cobalt (Co(II)): An isobolographic
approach. Journal of Hazardous Materials 143: 246–256.
Gohlke O (2009) Efficiency of energy recovery from municipal solid
waste and the resultant effect on the greenhouse gas balance.
Waste Management & Research 27: 894–906.
Gurgel LVA, Junior OK, de Freitas Gil RP and Gil LF (2008)
Adsorption of Cu(II), Cd(II), and Pb(II) from aqueous single metal
solutions by cellulose and mercerized cellulose chemically modified
with succinic anhydride. Bioresource Technology 99: 3077–3083.
Iglesias JR, Pelaez LC, Maison EM and Andres HS (2000)
Biomethanization of municipal solid waste in a pilot plant. Water
Research 34: 447–454.
Kida K, Shigematsu T, Kijima J, Numaguchi M, Mochinaga Y, Abe N
and Morimura S (2001) Influence of Ni2+ and Co2+ on methano-
genic activity and the amounts of coenzymes involved methanogen-
esis. Journal of Bioscience and Bioengineering 91: 590–595.
Kong IC (2010) Bioassessments of anaerobically decomposing organic
refuse in laboratory lysimeters with and without leachate recycling
and pH adjustment. Waste Management & Research 28: 141–148.
Kuo CW and Genthner BRS (1996) Effect of added heavy metals on
biotransformation and biodegradation of 2-chlorophenol and
3-chlorobenzoate in anaerobic bacterial consortia. Applied
Environmental Microbiology 62: 2317–2323.
Lo et al. 47
at UNIV OF SOUTHERN CALIFORNIA on April 9, 2014wmr.sagepub.comDownloaded from

Li C and Fang HHP (2007) Inhibition of heavy metals on fermentative
hydrogen production by granular sludge. Chemosphere 67: 668–673.
Lin C-Y and Shei S-H (2008) Heavy metal effects on fermentative hydro-
gen production using natural mixed microflora. International Journal
of Hydrogen Energy 33: 587–593.
Lin CY, Chou J and Lee YS (1998) Heavy metal-affected degradation of
butyric acid in anaerobic digestion. Bioresource Technology 65:
159–161.
Lo HM and Liao YL (2007) The metals-leaching and acids-neutralizing
capacity of MSW incinerator ash co-disposed with MSW in landfill
sites. Journal of Hazardous Materials 142: 512–519.
Lo HM (2005) Metals behaviors of MSWI bottom ash co-digested
anaerobically with MSW. Resource, Conservation & Recycling 43:
263–280.
Lo HM, Kurniawan TA, Sillanpaa MET, Pai TY, Chiang CF, Chao KP,
Liu MH, Chuang SH, Banks CJ, Wang SC, Lin KC, Lin CY, Liu
WF, Cheng PH, Chen CK, Chiu HY and Wu HY (2010) Modeling
biogas production from organic fraction of MSW co-digested with
MSWI ashes in anaerobic bioreactors. Bioresource Technology 101:
6329–6335.
Lo HM, Lin KC, Liu MH, Pai TY, Lin CY, Liu WF, Fang GC, Lu C,
Chiang CF, Wang SC, Chen PH, Chen JK, Chiu HY and Wu KC
(2009a) Solubility of heavy metals added to MSW. Journal of
Hazardous Materials 162: 294–299.
Lo HM, Liu MH, Pai TY, Liu WF, Lin CY, Wang SC, Banks CJ, Hung
CH, Chiang CF, Lin KC, Chen PH, Chen JK, Chiu HY, Su MH,
Kurniawan TA, Wu KC, Hsieh CY and Hsu HH (2009b)
Biostabilization assessment of MSW co-disposed with MSWI fly
ash in anaerobic bioreactors. Journal of Hazardous Materials 162:
1233–1242.
Ma J, Mungoni LJ, Verstraete W and Carballa M (2009) Maximum
removal rate of propionic acid as a sole carbon source in UASB
reactors and the importance of the macro- and micro-nutrients stim-
ulation. Bioresource Technology 100: 3477–3482.
Malik A (2004) Metal bioremediation through growing cells.
Environmental International 30: 261–78.
Møller J, Boldrin A and Christensen TH (2009) Anaerobic digestion and
digestate use: accounting of greenhouse gases and global warming
contribution. Waste Management & Research 27: 813–824.
Peiffer S, Becker U and Herrmann R (1994) The role of particulate
matter in the mobilisation of trace metals during anaerobic digestion
of solid waste material. Acta hydrochimica hydrobiolgica 22: 130–137.
Ren S and Frymer PD (2003) Kinetics of the toxicity of metals to lumi-
nescent bacteria. Advances in Environmental Research 7: 537–547.
Takashima M and Speece RE (1990) Mineral requirements for methane
fermentation. Critical Review in Environmental Control 19: 465–479.
Tan L, Qu Y, Zhou J, Ma F and Li A (2009) Dynamics of microbial
community for X-3B wastewater decolorization coping with high-salt
and metal ions conditions. Bioresource Technology 100: 3003–3009.
Wang J (1995) The inhibition of mixed heavy metals to anaerobic diges-
tion. Chinese Science Abstract Series B 14: 73.
Worm P, Fermoso FG, Lens PNL and Plugge CM (2009) Decreased
activity of a propionate degrading community in a UASB reactor fed
with synthetic medium without molybdenum, tungsten and selenium.
Enzyme and Microbial Technology, doi: 10.1016/
j.enzmictec.2009.02.001.
Young CY, Ni SP and Fan KS (2010) Working towards a zero waste
environment in Taiwan. Waste Management & Research 28: 236–244.
Yuan Z, Yang H, Zhi X and Shen J (2010) Increased performance of
continuous stirred tank reactor with calcium supplementation.
International Journal of Hydrogen Energy 35: 2622–2626.
Yue Z-B, Yu H-Q and Wang Z-L (2007) Anaerobic digestion of cattail
with rumen culture in the presence of heavy metals. Bioresource
Technology 98: 781–786.
Zhang Y, Zhang Z, Suzuki K and Maekawa T (2003) Uptake and mass
balance of trace metals for methane producing bacteria. Biomass &
Bioenergy 25: 427–433.
48 Waste Management & Research 30(1)
at UNIV OF SOUTHERN CALIFORNIA on April 9, 2014wmr.sagepub.comDownloaded from