anaerobic digestion of source separated organics … digestion of source separated organics in...
TRANSCRIPT

1
Anaerobic Digestion of Source Separated Organics in America
Nora Goldstein, EditorBioCycle
www.biocycle.netwww.BioCycleREFOR.com
2
Presentation Overview
• MSW and SSO Management Trends in U.S.
• Overview of AD Facility Infrastructure for SSO
• Preprocessing of food waste streams
• Case studies
• Regulations
• Questions?
3
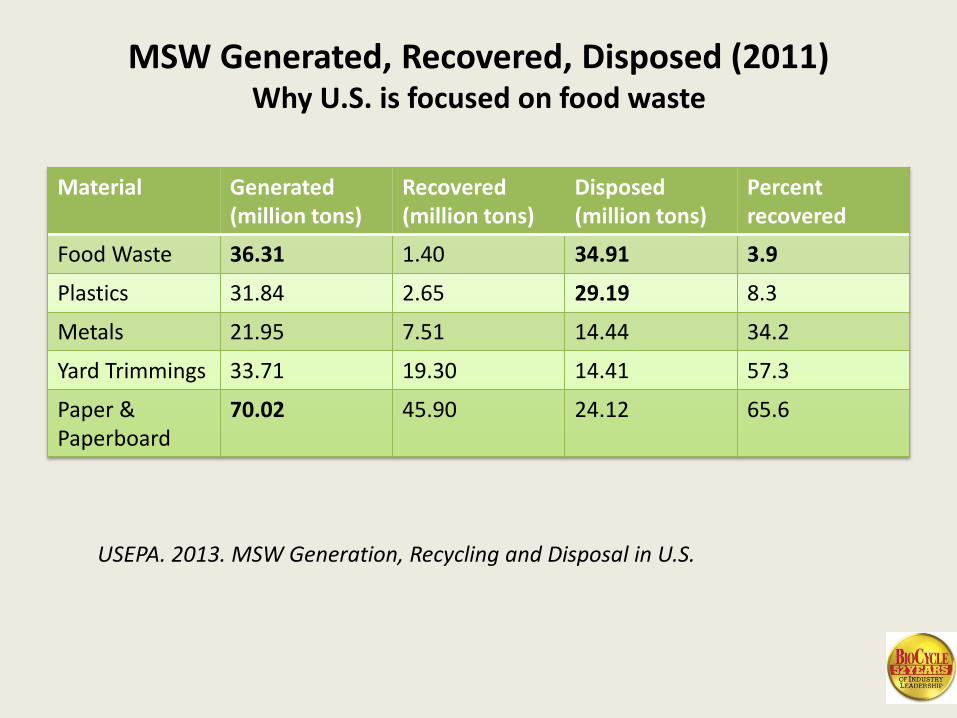
MSW Generated, Recovered, Disposed (2011)Why U.S. is focused on food waste
Material Generated (million tons)
Recovered (million tons)
Disposed (million tons)
Percent recovered
Food Waste 36.31 1.40 34.91 3.9
Plastics 31.84 2.65 29.19 8.3
Metals 21.95 7.51 14.44 34.2
Yard Trimmings 33.71 19.30 14.41 57.3
Paper & Paperboard
70.02 45.90 24.12 65.6
USEPA. 2013. MSW Generation, Recycling and Disposal in U.S.
4
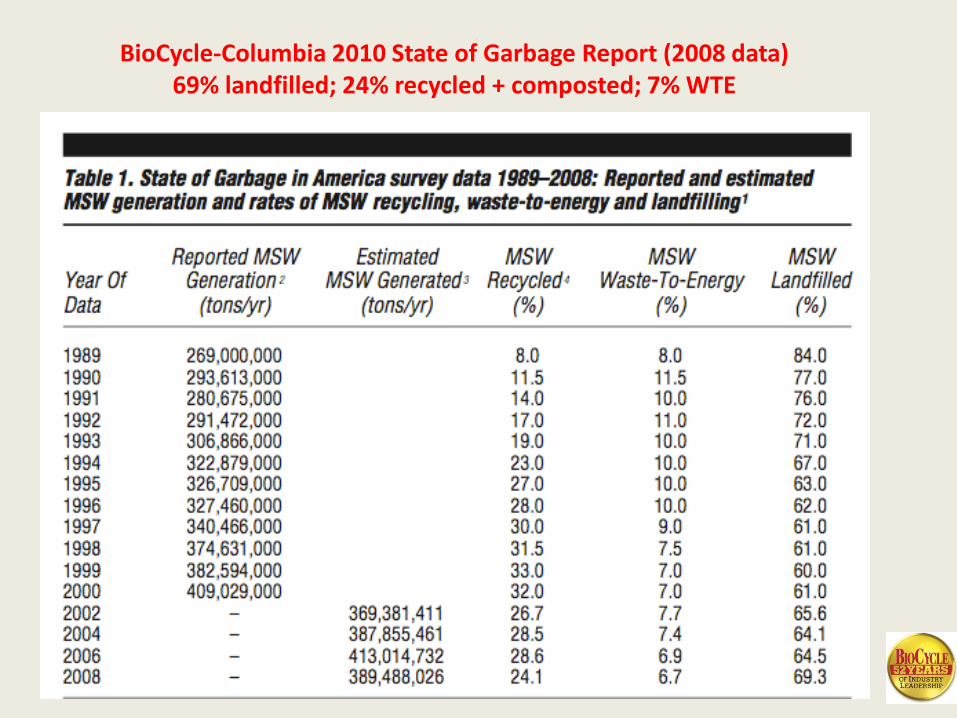
BioCycle-Columbia 2010 State of Garbage Report (2008 data)69% landfilled; 24% recycled + composted; 7% WTE

5
Example ComparisonProduction• Biogas: > 90 Sm3/ton of Organic Waste• Electric Energy: > 8,000,000 kWh/year• Compost: 12,000 tons/year
Gate Fees and Product Sales• Organic Waste: 90 $ / ton• No Gate Fee for Structural Material
• Electricity to Grid: $ 0.36 /kWh• Internal Use of Heat• Free Compost to Local Community
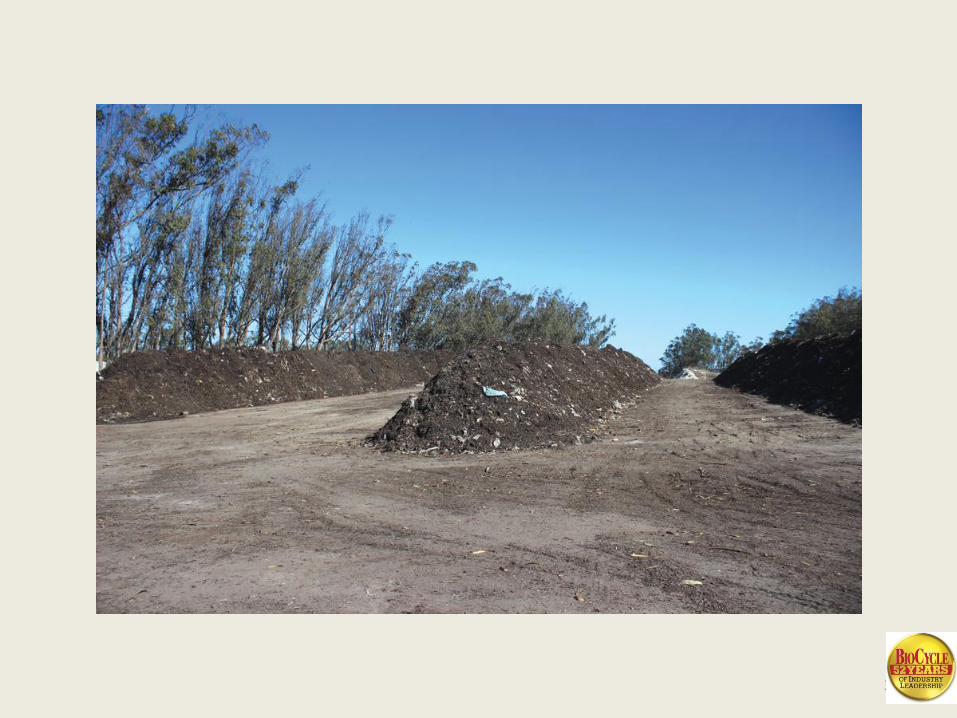
5Data courtesy of BioMRF, Inc.
U.S. Energy “Policy”?Still Fossil-Fuel Focused
6
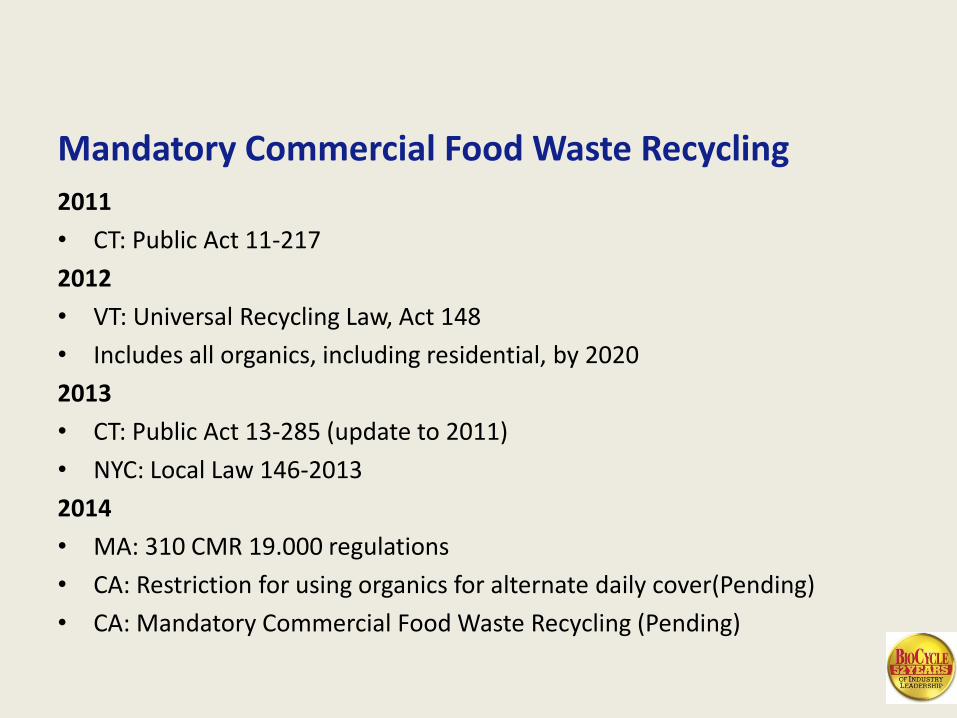
Mandatory Commercial Food Waste Recycling
2011
• CT: Public Act 11-217
2012
• VT: Universal Recycling Law, Act 148
• Includes all organics, including residential, by 2020
2013
• CT: Public Act 13-285 (update to 2011)
• NYC: Local Law 146-2013
2014
• MA: 310 CMR 19.000 regulations
• CA: Restriction for using organics for alternate daily cover(Pending)
• CA: Mandatory Commercial Food Waste Recycling (Pending)

7
Integrated Solutions
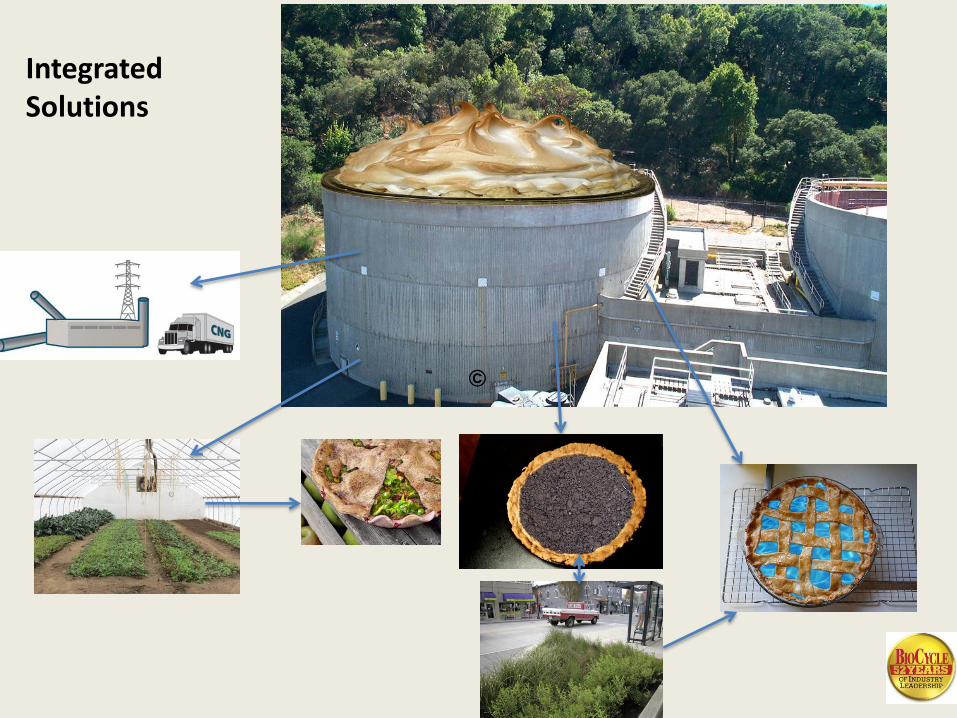
8
IntegratedSolutions
©

9
Calculation by City of San DiegoEnvironmental Services Dept
Food Rescue and Access
10
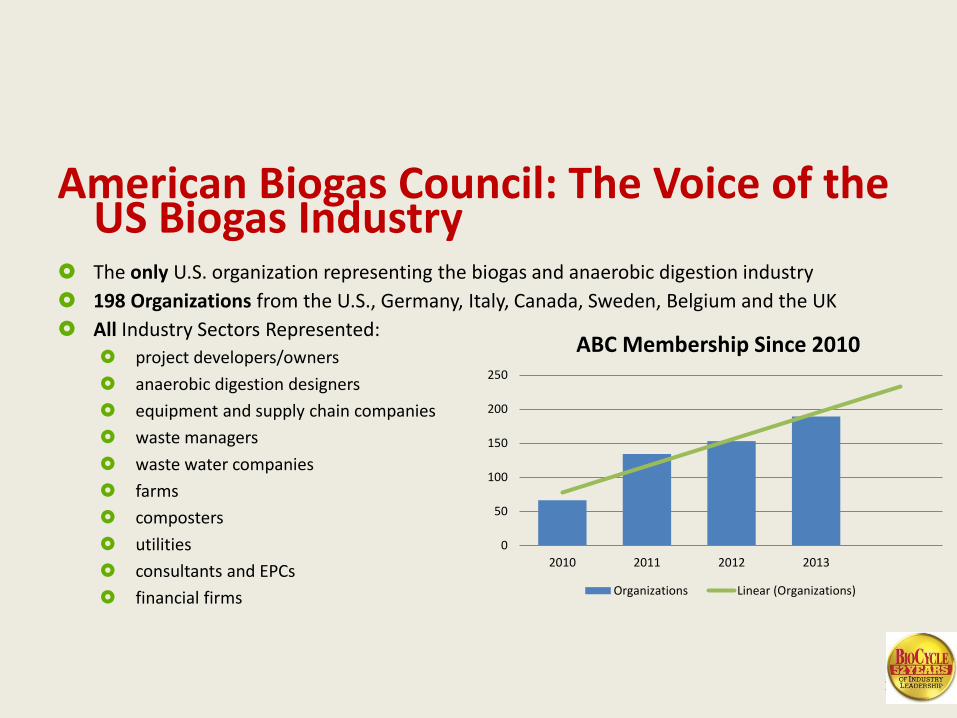
American Biogas Council: The Voice of the US Biogas Industry
The only U.S. organization representing the biogas and anaerobic digestion industry
198 Organizations from the U.S., Germany, Italy, Canada, Sweden, Belgium and the UK
All Industry Sectors Represented:
project developers/owners
anaerobic digestion designers
equipment and supply chain companies
waste managers
waste water companies
farms
composters
utilities
consultants and EPCs
financial firms
0
50
100
150
200
250
2010 2011 2012 2013
ABC Membership Since 2010
Organizations Linear (Organizations)
11
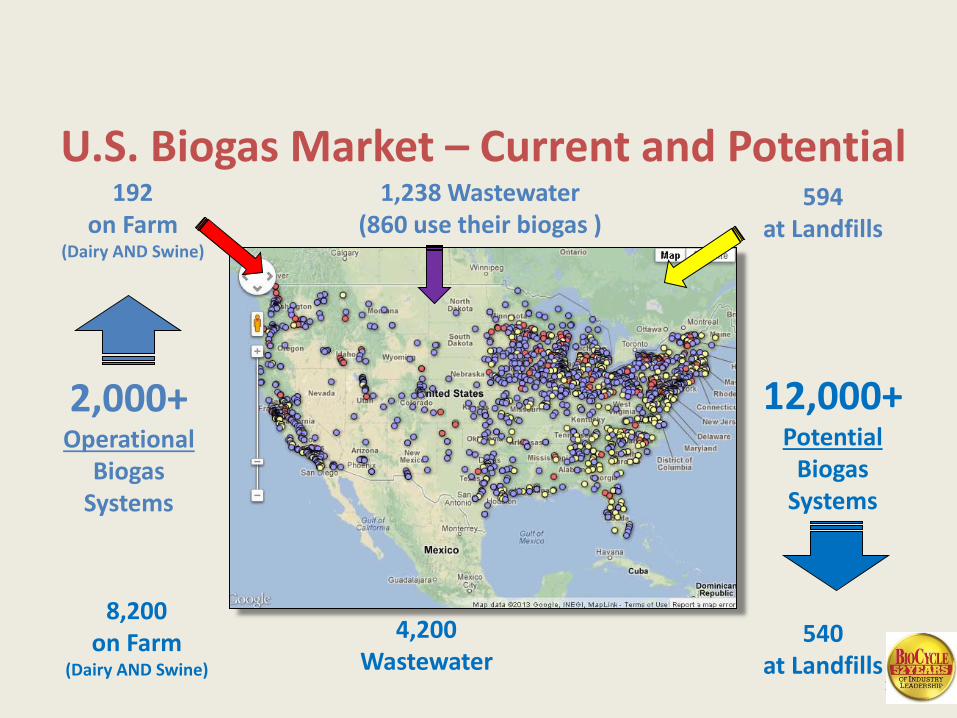
192on Farm
(Dairy AND Swine)
1,238 Wastewater(860 use their biogas )
594at Landfills
2,000+Operational
Biogas Systems
12,000+Potential
Biogas Systems
8,200on Farm
(Dairy AND Swine)
4,200Wastewater
540at Landfills
U.S. Biogas Market – Current and Potential
12
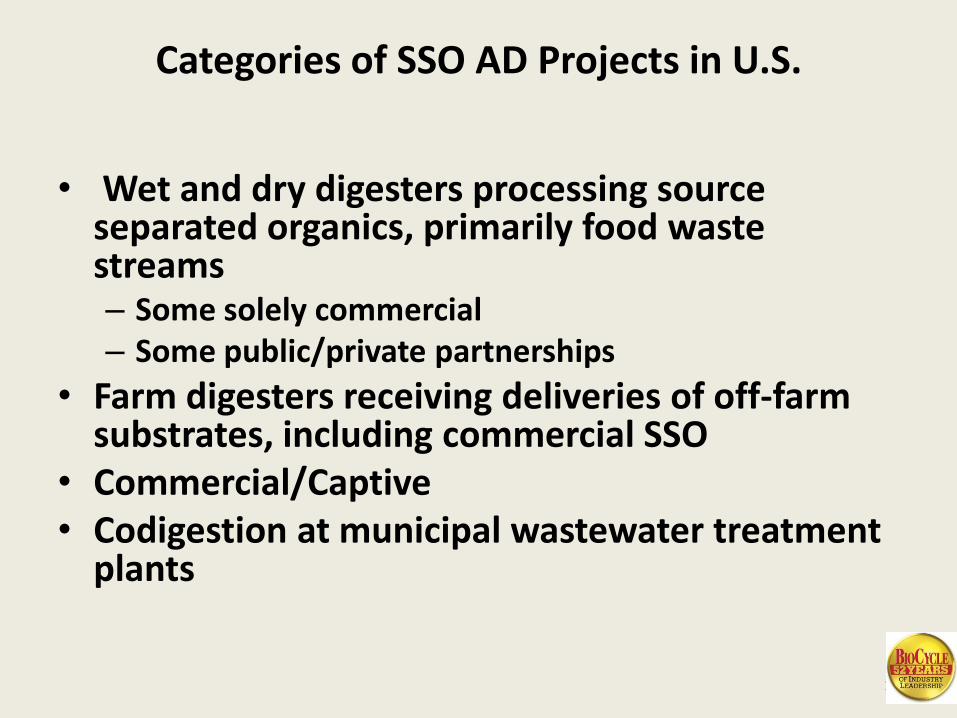
Categories of SSO AD Projects in U.S.
• Wet and dry digesters processing source separated organics, primarily food waste streams– Some solely commercial– Some public/private partnerships
• Farm digesters receiving deliveries of off-farm substrates, including commercial SSO
• Commercial/Captive• Codigestion at municipal wastewater treatment
plants
13
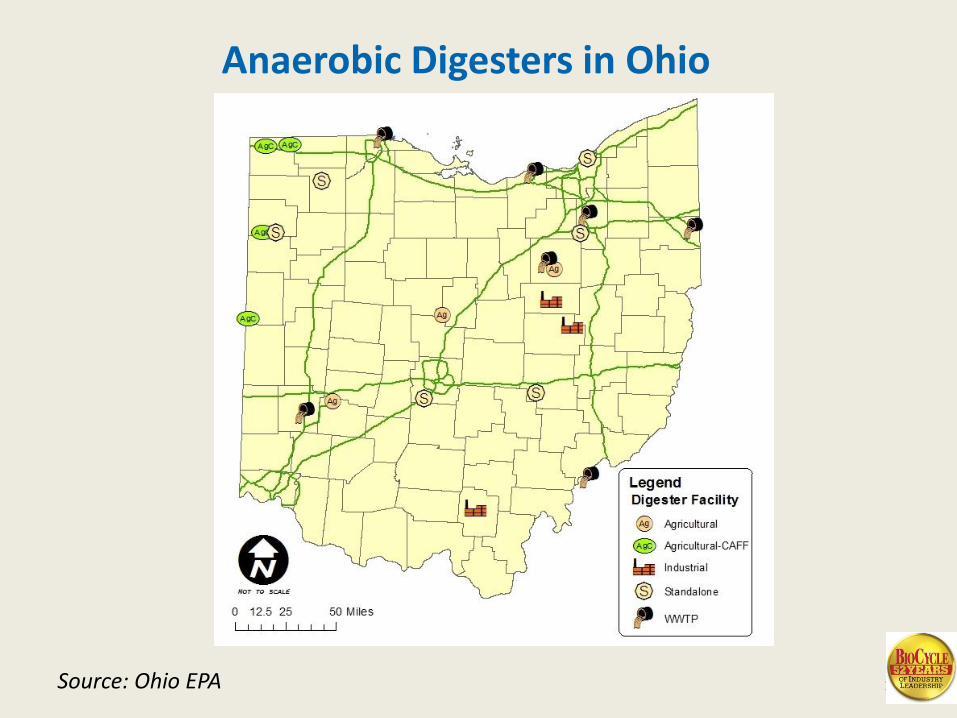
Anaerobic Digesters in Ohio
Source: Ohio EPA
14
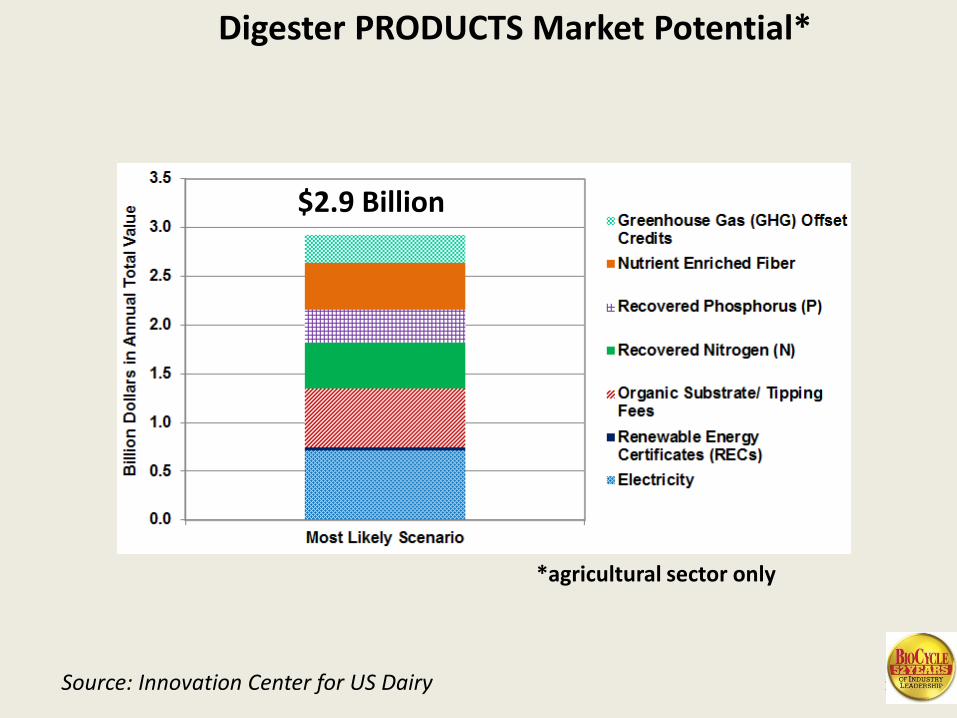
Digester PRODUCTS Market Potential*
$2.9 Billion
*agricultural sector only
Source: Innovation Center for US Dairy
15
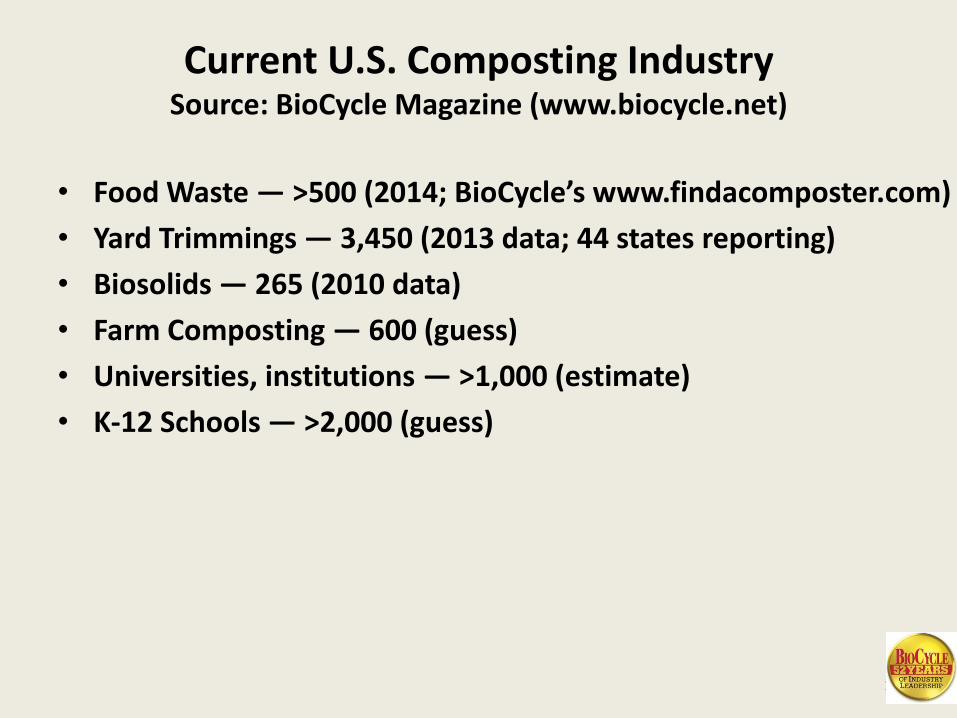
Current U.S. Composting IndustrySource: BioCycle Magazine (www.biocycle.net)
• Food Waste — >500 (2014; BioCycle’s www.findacomposter.com)
• Yard Trimmings — 3,450 (2013 data; 44 states reporting)
• Biosolids — 265 (2010 data)
• Farm Composting — 600 (guess)
• Universities, institutions — >1,000 (estimate)
• K-12 Schools — >2,000 (guess)
16
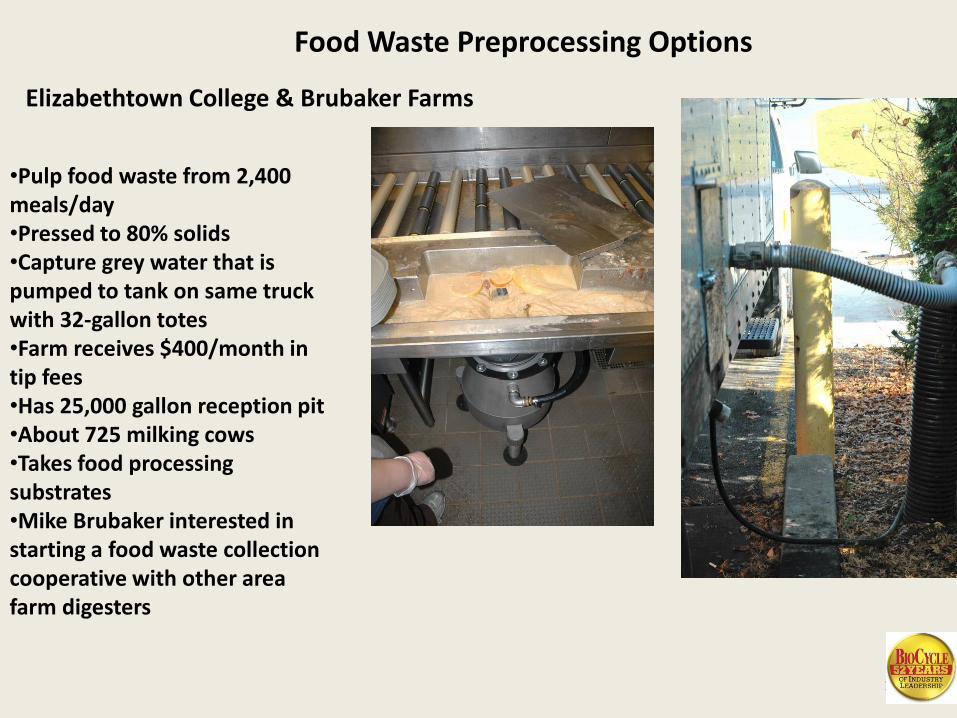
•Pulp food waste from 2,400 meals/day•Pressed to 80% solids•Capture grey water that is pumped to tank on same truck with 32-gallon totes•Farm receives $400/month in tip fees•Has 25,000 gallon reception pit•About 725 milking cows•Takes food processing substrates•Mike Brubaker interested in starting a food waste collection cooperative with other area farm digesters
Elizabethtown College & Brubaker Farms
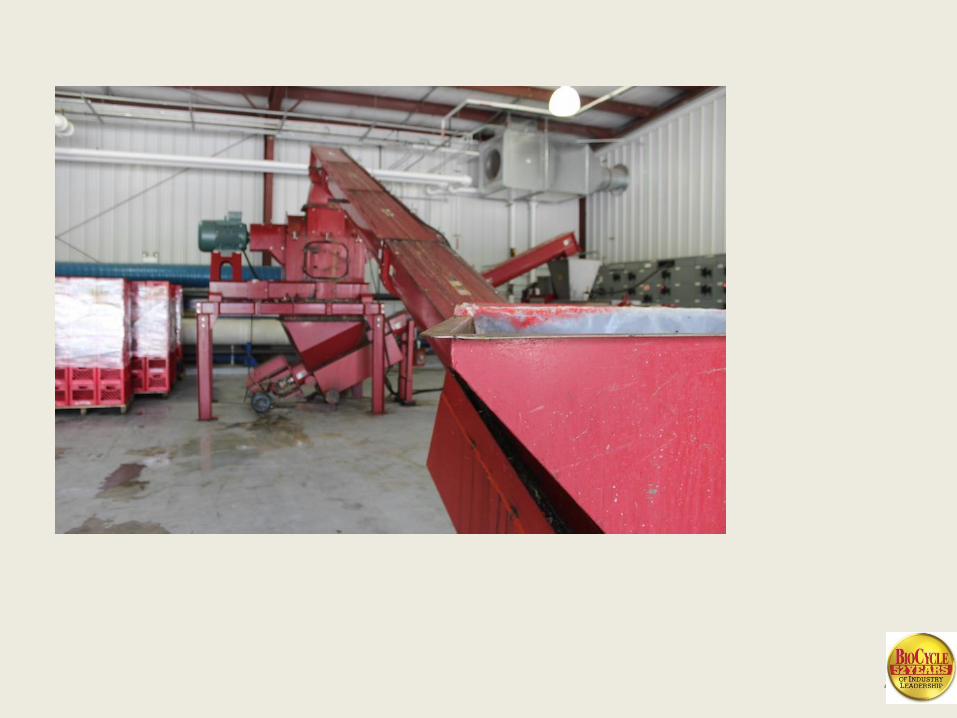
Food Waste Preprocessing Options
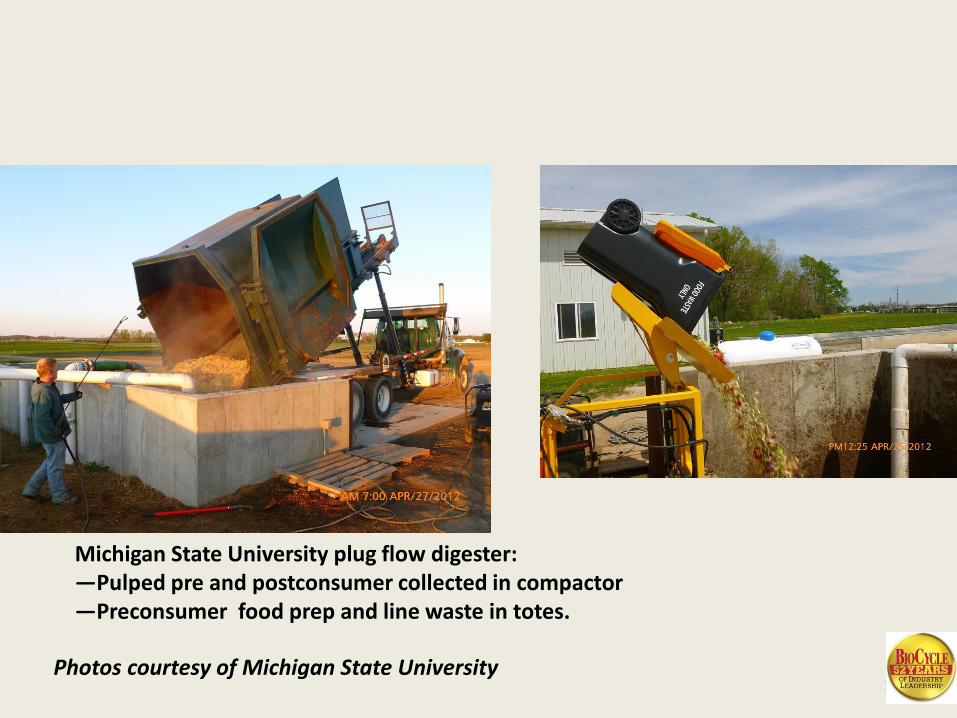
17Photos courtesy of Michigan State University
Michigan State University plug flow digester:—Pulped pre and postconsumer collected in compactor—Preconsumer food prep and line waste in totes.
18
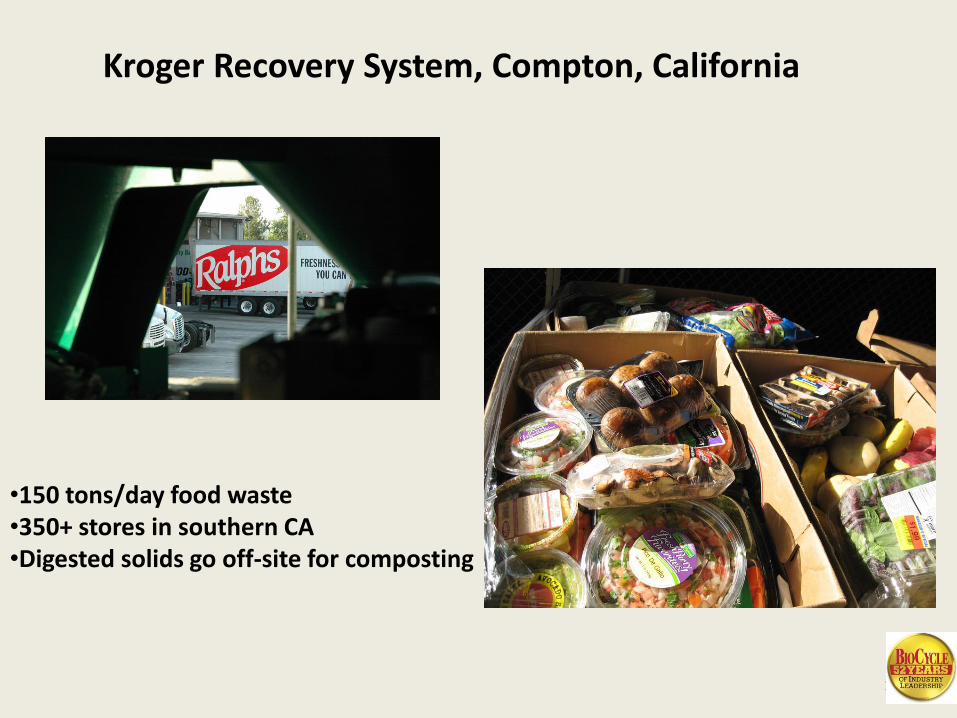
Kroger Recovery System, Compton, California
•150 tons/day food waste•350+ stores in southern CA•Digested solids go off-site for composting
19
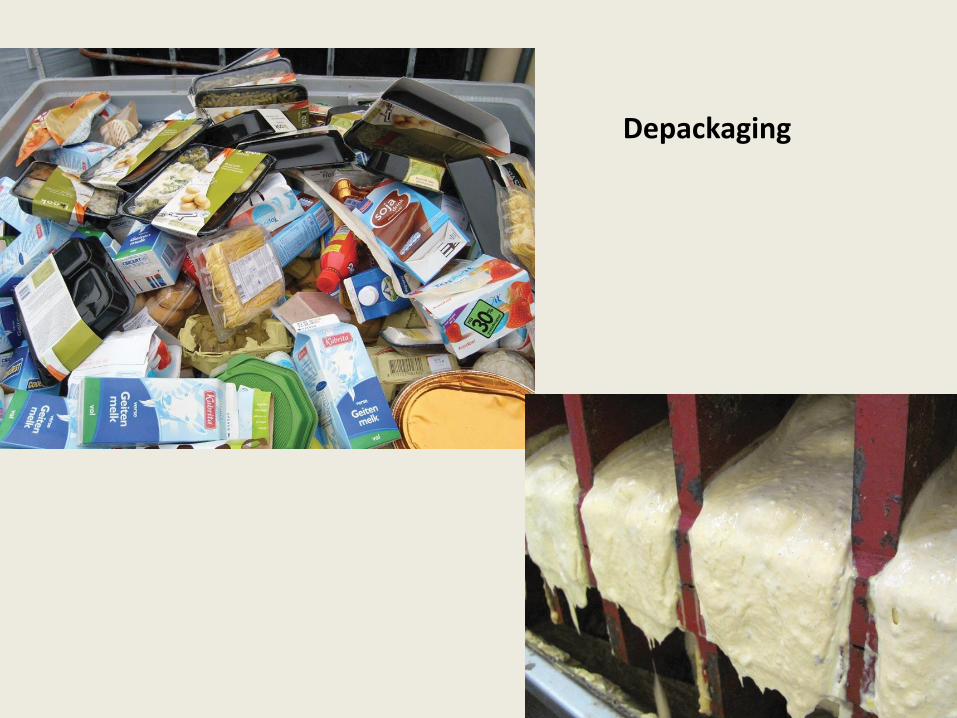
Depackaging
20
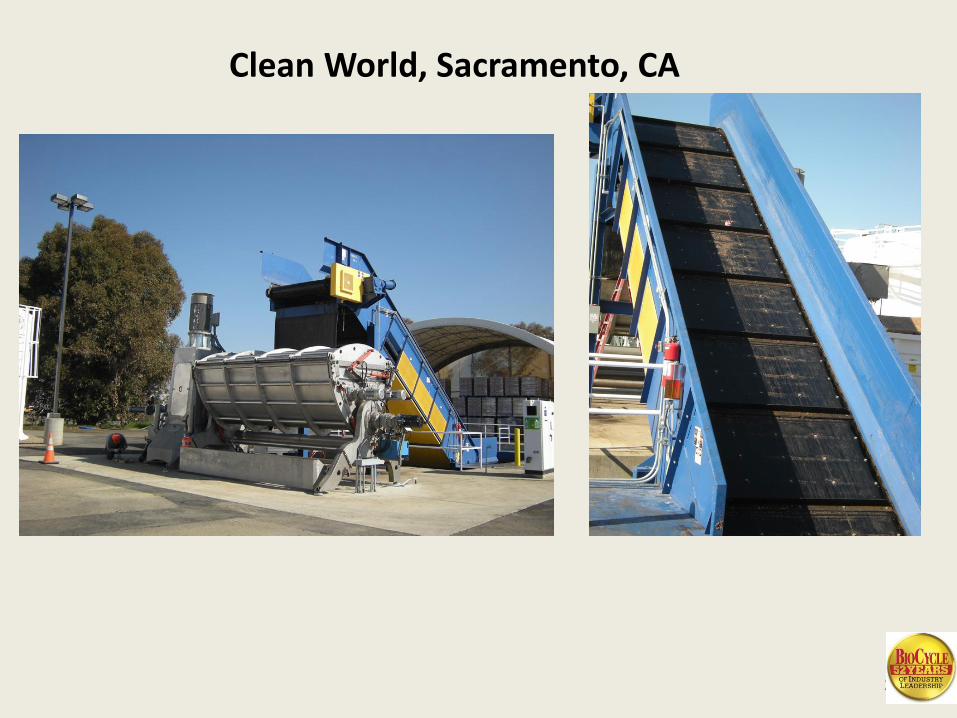
Clean World, Sacramento, CA

21
Ohio State University:Blackwell Hotel
22
23
24
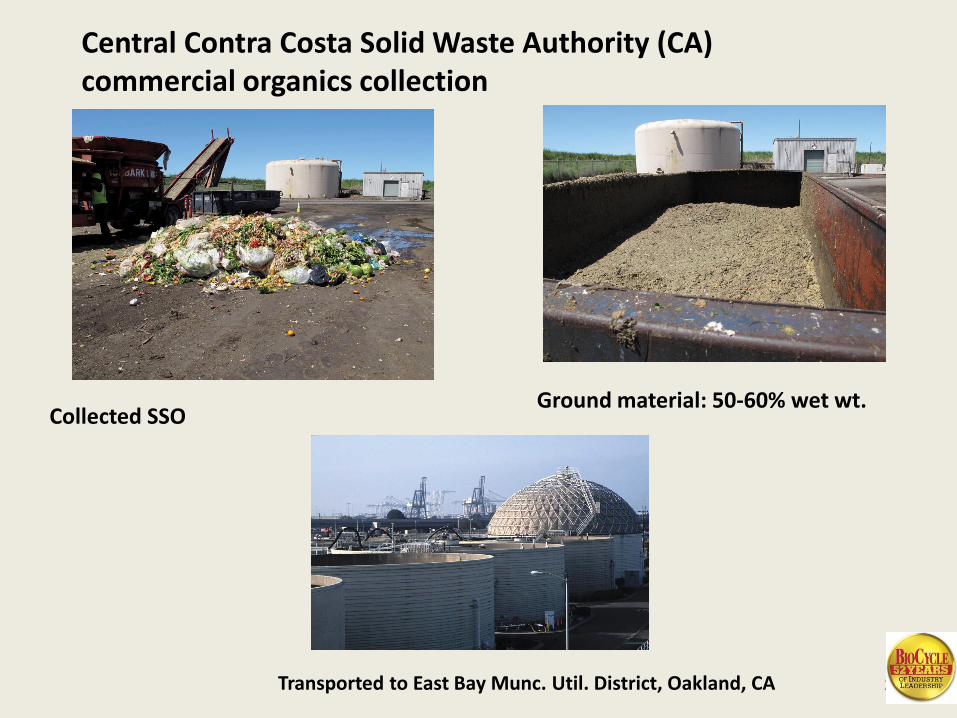
Ground material: 50-60% wet wt.
Transported to East Bay Munc. Util. District, Oakland, CA
Central Contra Costa Solid Waste Authority (CA) commercial organics collection
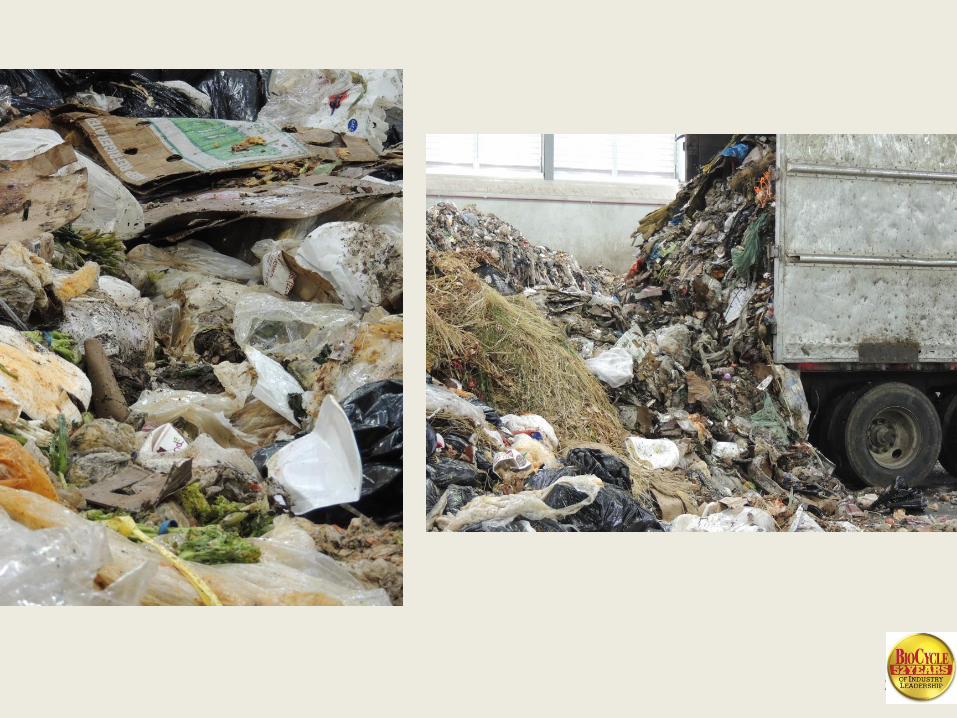
Collected SSO
25
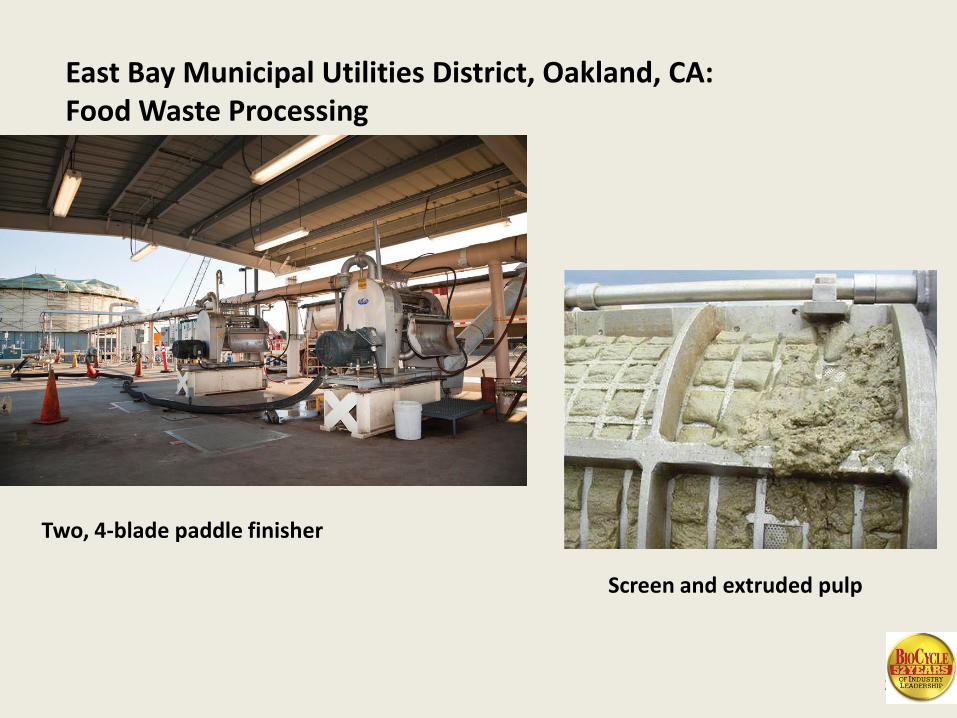
East Bay Municipal Utilities District, Oakland, CA: Food Waste Processing
Two, 4-blade paddle finisher
Screen and extruded pulp
26
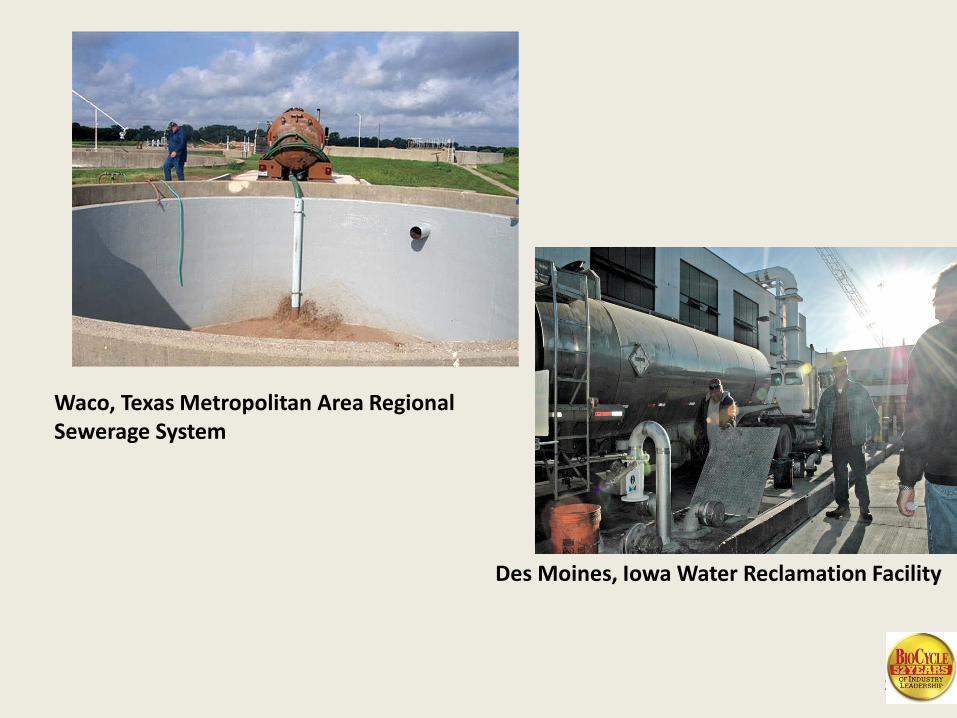
Waco, Texas Metropolitan Area Regional Sewerage System
Des Moines, Iowa Water Reclamation Facility
27
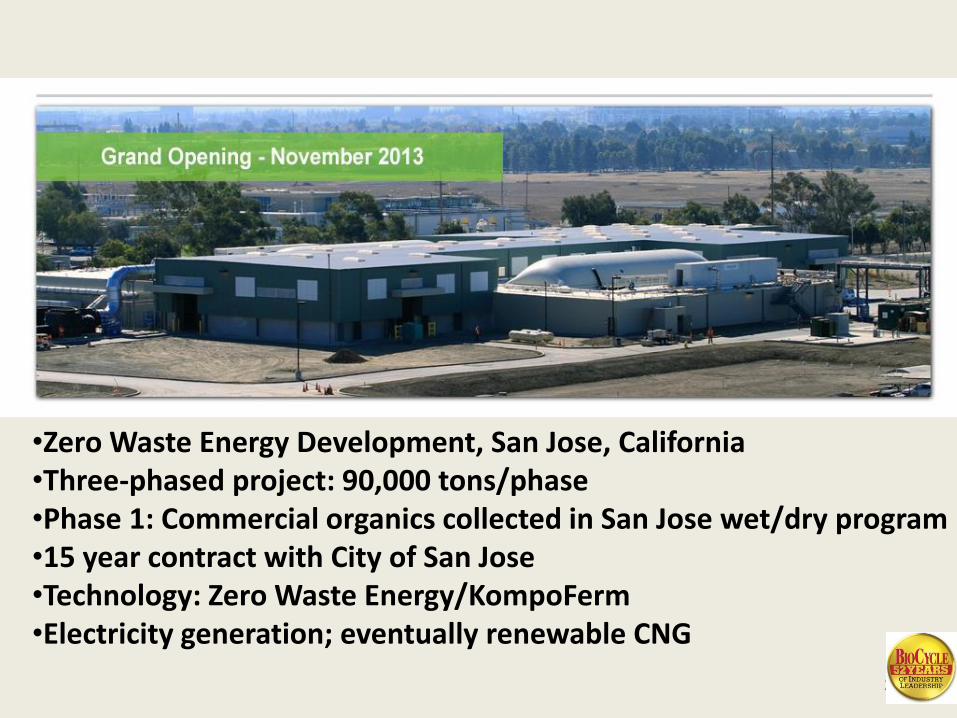
•Zero Waste Energy Development, San Jose, California•Three-phased project: 90,000 tons/phase•Phase 1: Commercial organics collected in San Jose wet/dry program•15 year contract with City of San Jose•Technology: Zero Waste Energy/KompoFerm•Electricity generation; eventually renewable CNG
28

29
30

31
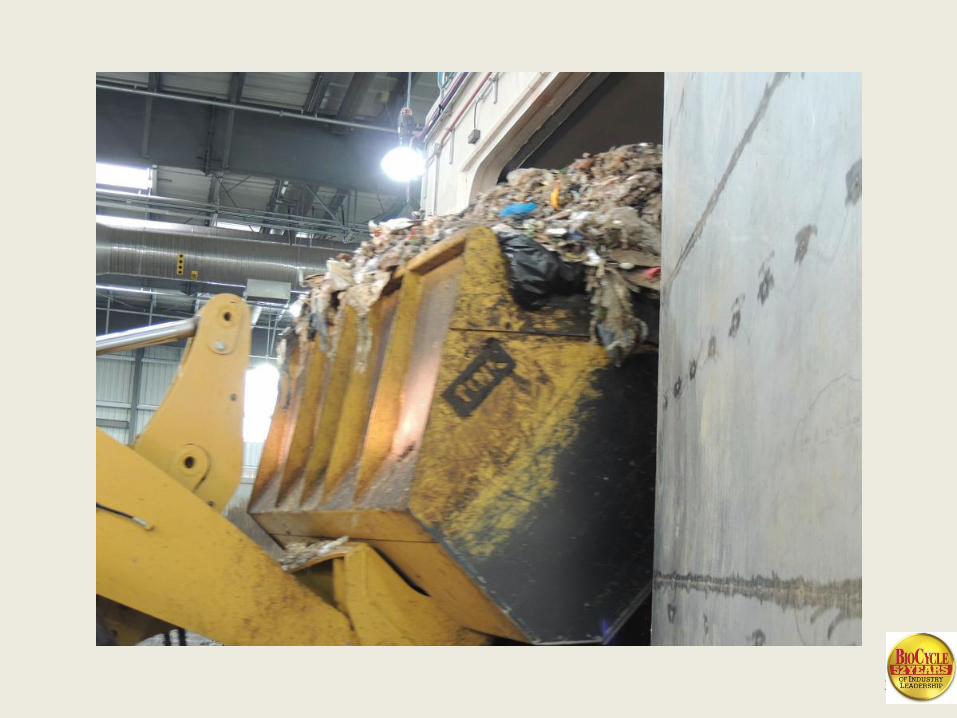
32
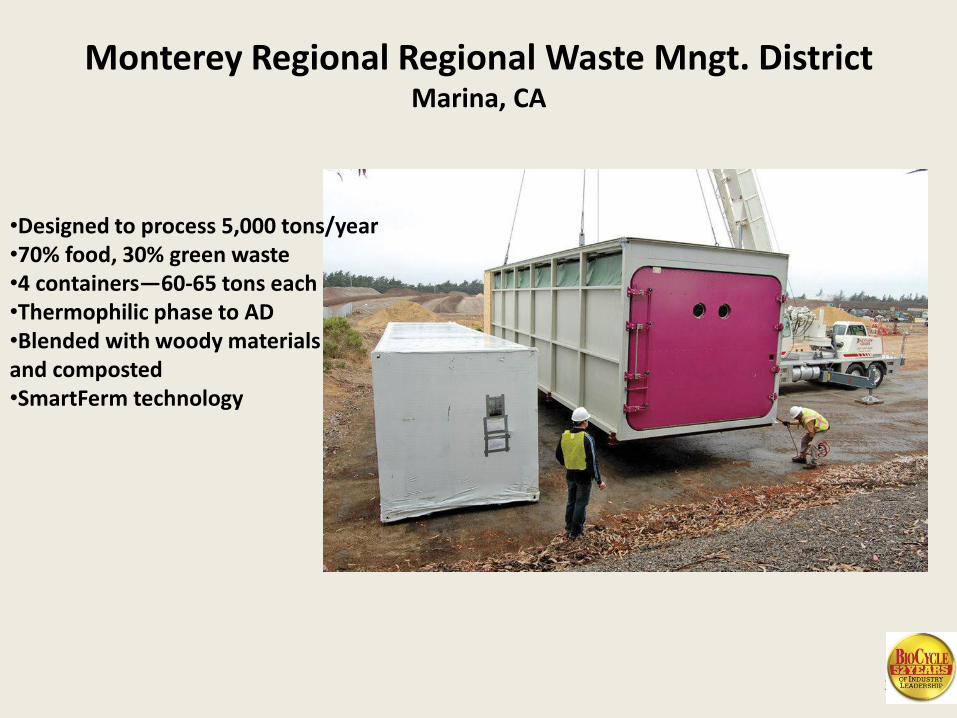
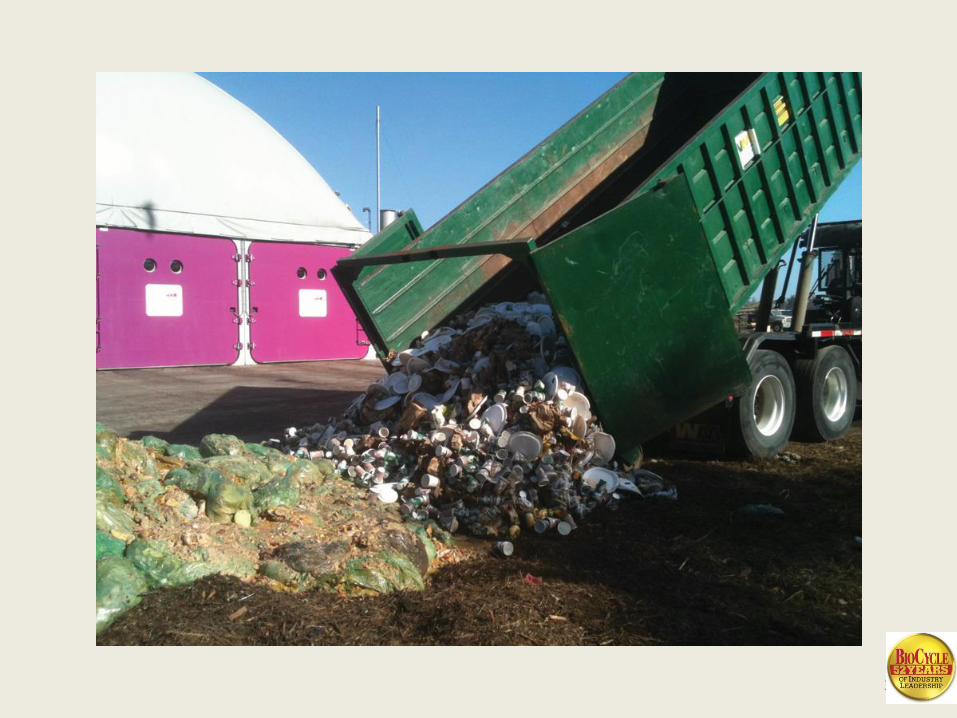
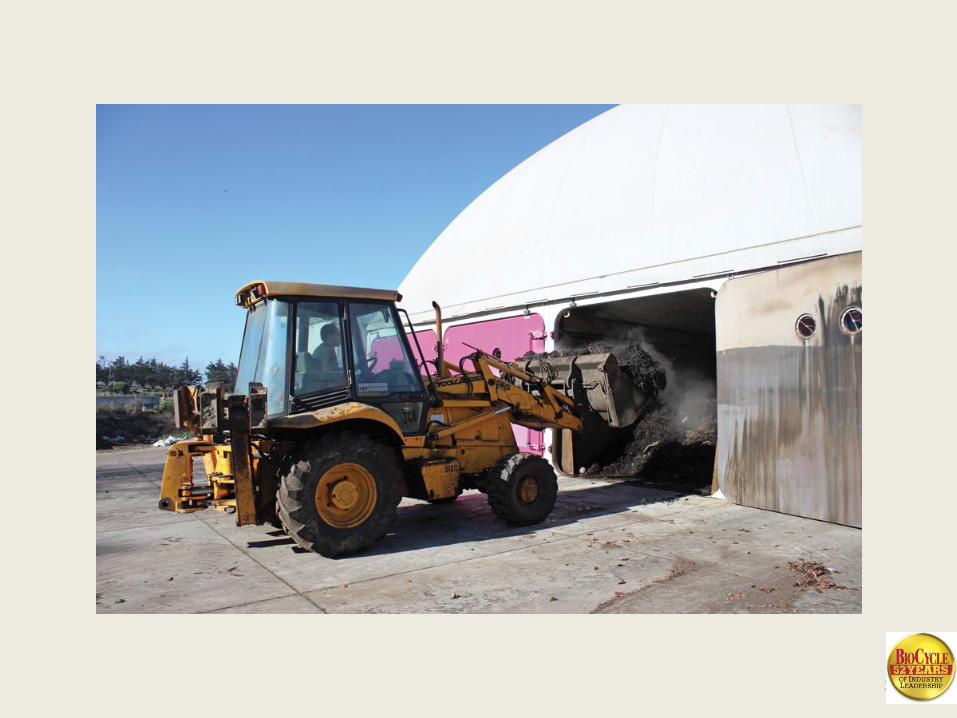
Monterey Regional Regional Waste Mngt. DistrictMarina, CA
•Designed to process 5,000 tons/year•70% food, 30% green waste•4 containers—60-65 tons each•Thermophilic phase to AD•Blended with woody materialsand composted•SmartFerm technology
33
34
35
3636
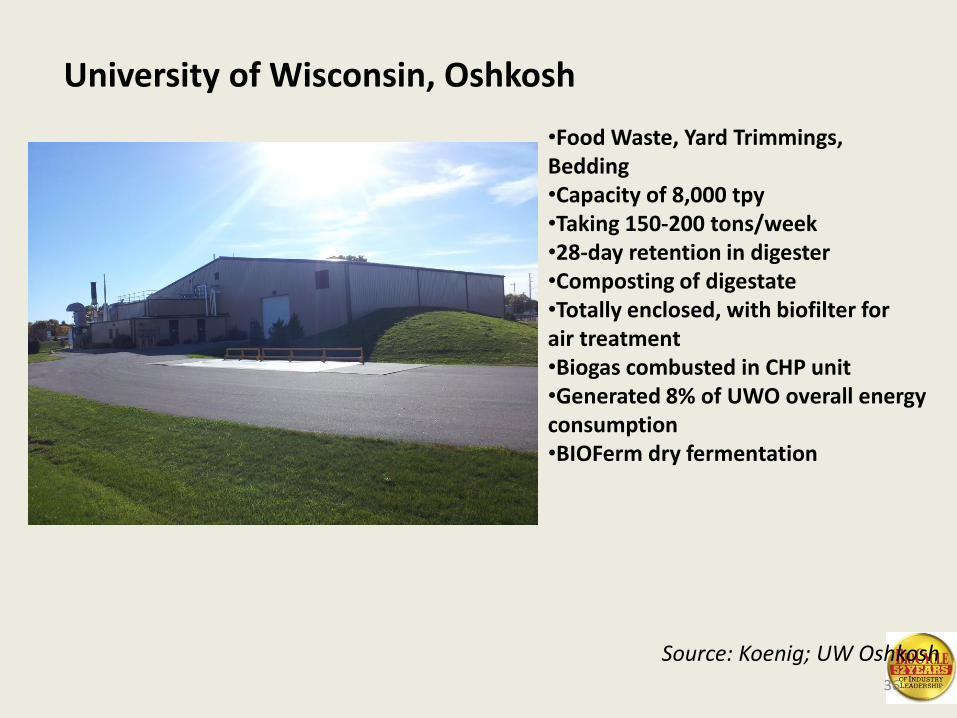
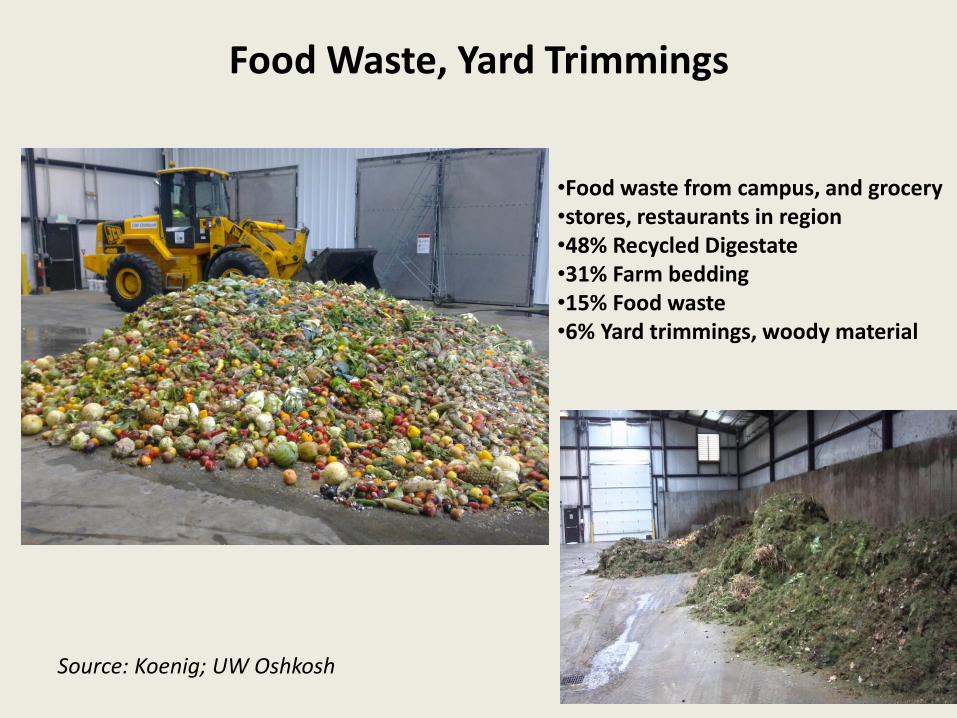
•Food Waste, Yard Trimmings, Bedding•Capacity of 8,000 tpy•Taking 150-200 tons/week•28-day retention in digester•Composting of digestate•Totally enclosed, with biofilter forair treatment•Biogas combusted in CHP unit•Generated 8% of UWO overall energy consumption•BIOFerm dry fermentation
University of Wisconsin, Oshkosh
Source: Koenig; UW Oshkosh
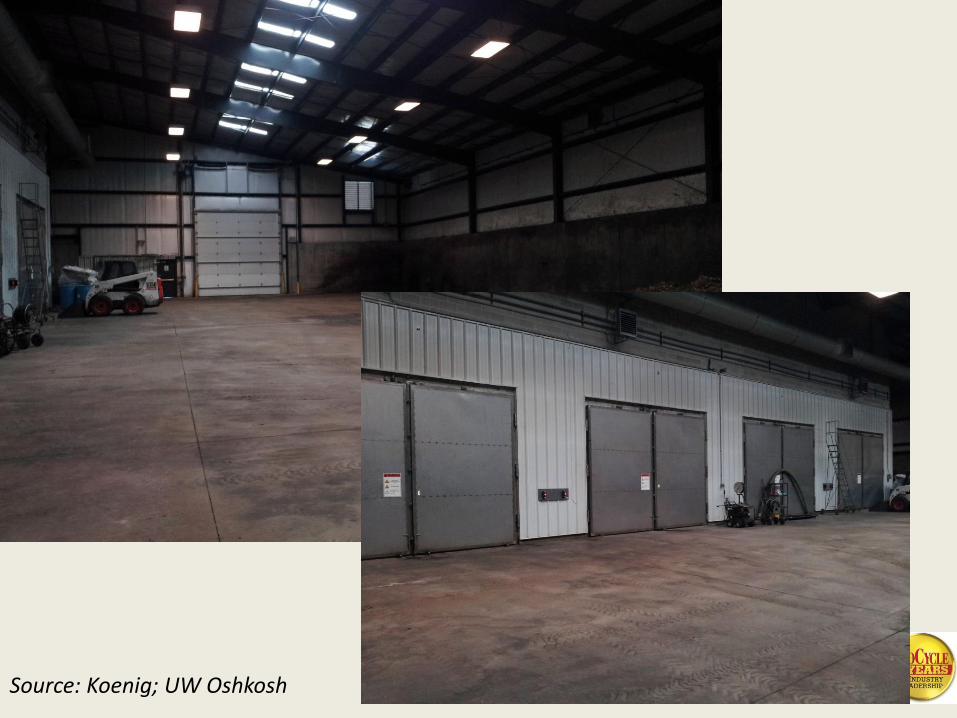
3737Source: Koenig; UW Oshkosh
3838Source: Koenig; UW Oshkosh
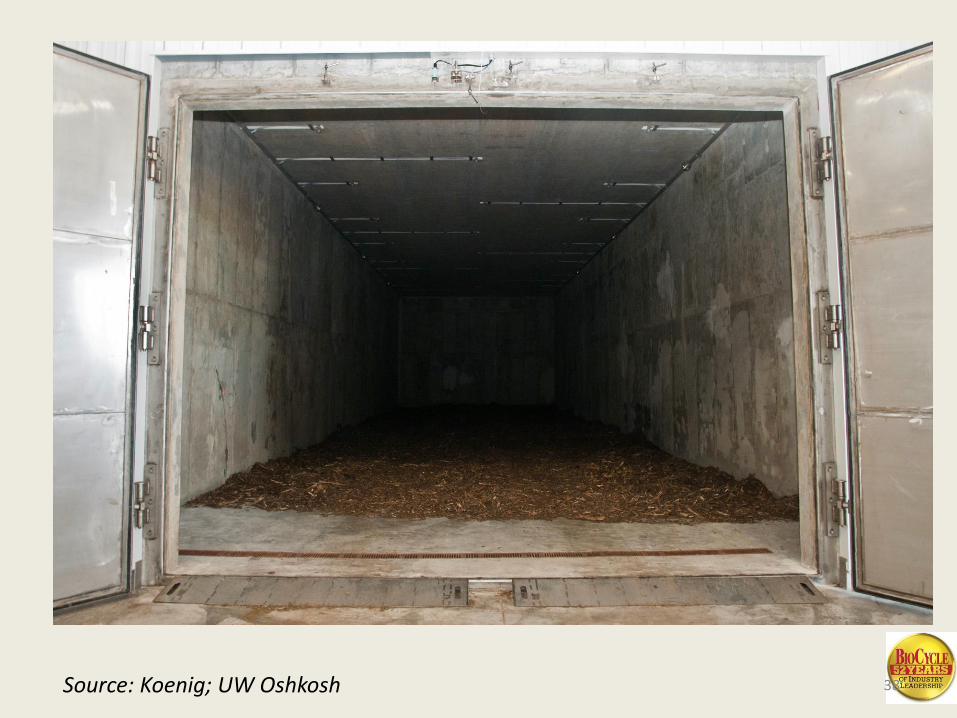
39
Food Waste, Yard Trimmings
39Source: Koenig; UW Oshkosh
•Food waste from campus, and grocery •stores, restaurants in region•48% Recycled Digestate•31% Farm bedding•15% Food waste•6% Yard trimmings, woody material
40
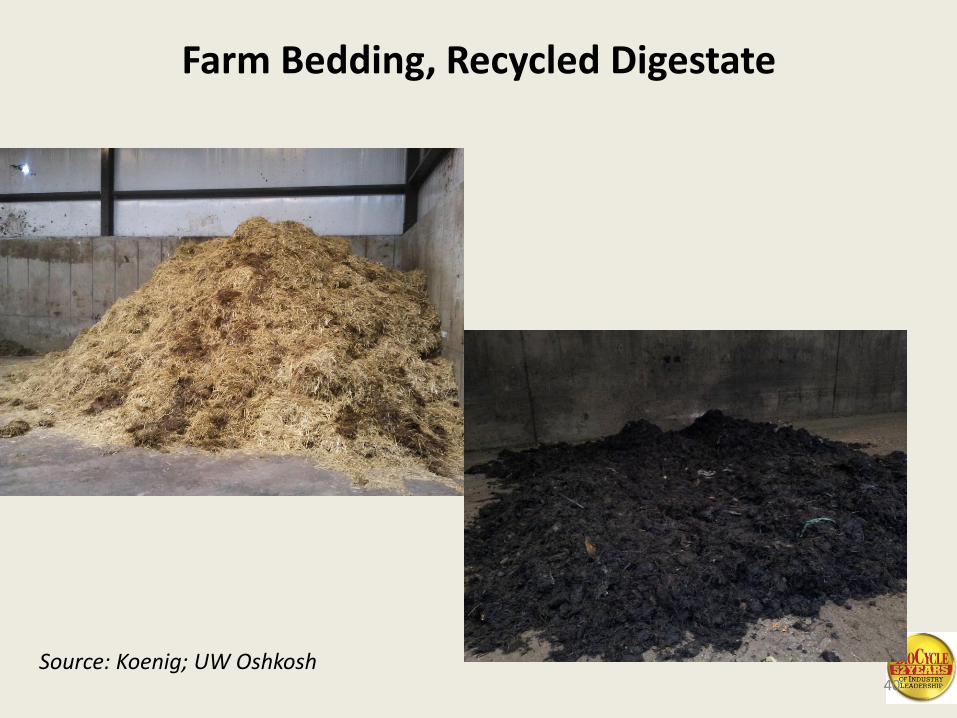
Farm Bedding, Recycled Digestate
40
Source: Koenig; UW Oshkosh
4141
42
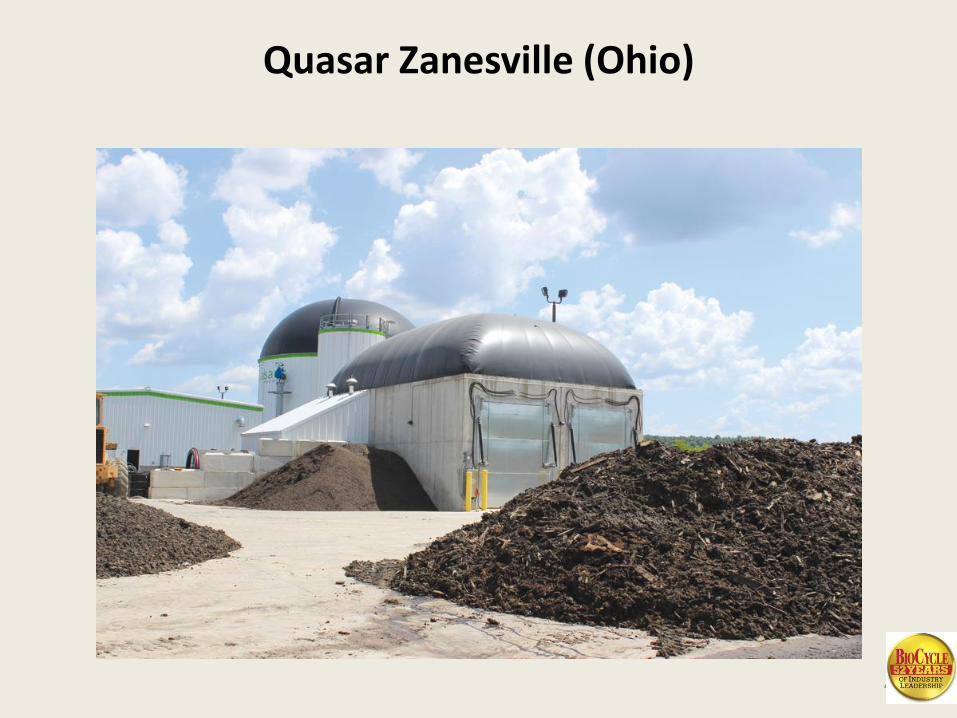
Quasar Zanesville (Ohio)
43
44
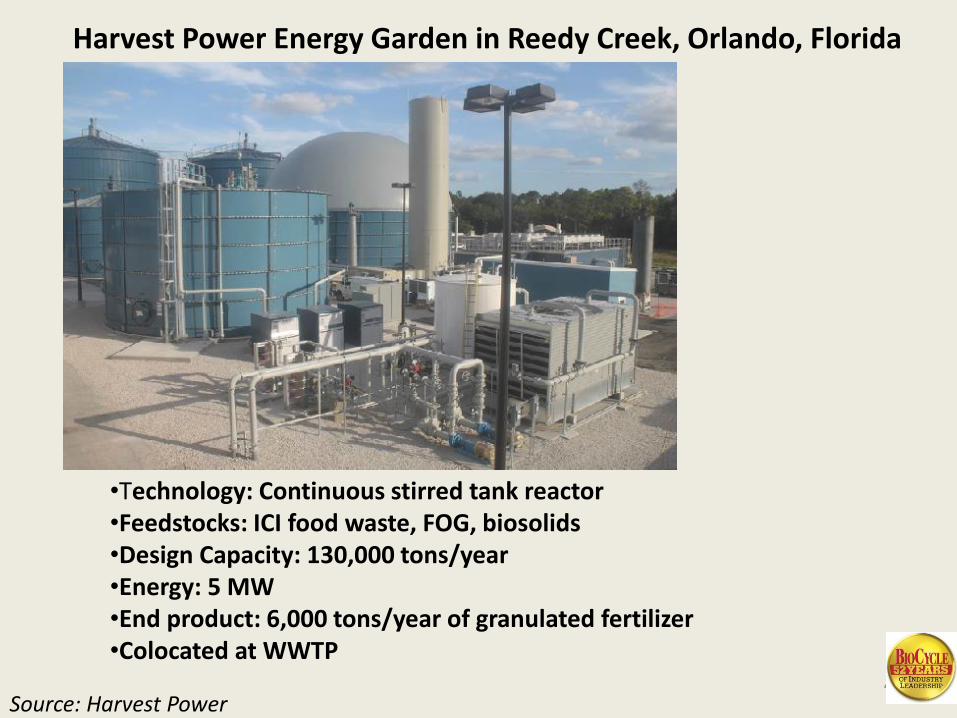
Harvest Power Energy Garden in Reedy Creek, Orlando, Florida
Source: Harvest Power
•Technology: Continuous stirred tank reactor•Feedstocks: ICI food waste, FOG, biosolids•Design Capacity: 130,000 tons/year•Energy: 5 MW •End product: 6,000 tons/year of granulated fertilizer•Colocated at WWTP
45
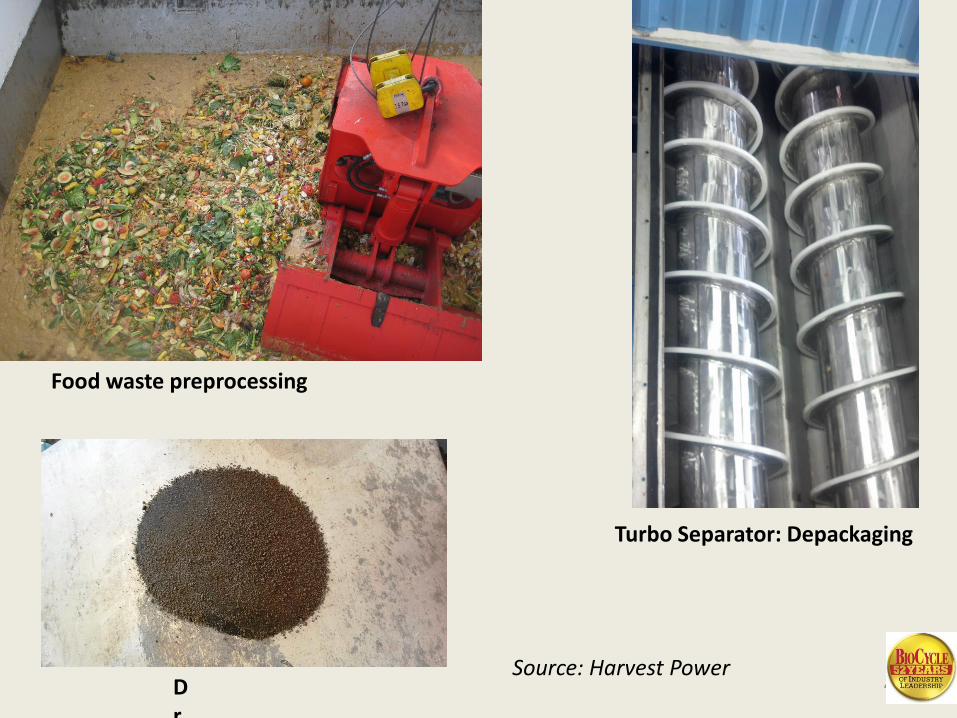
Food waste preprocessing
Turbo Separator: Depackaging
Dr
Source: Harvest Power
46
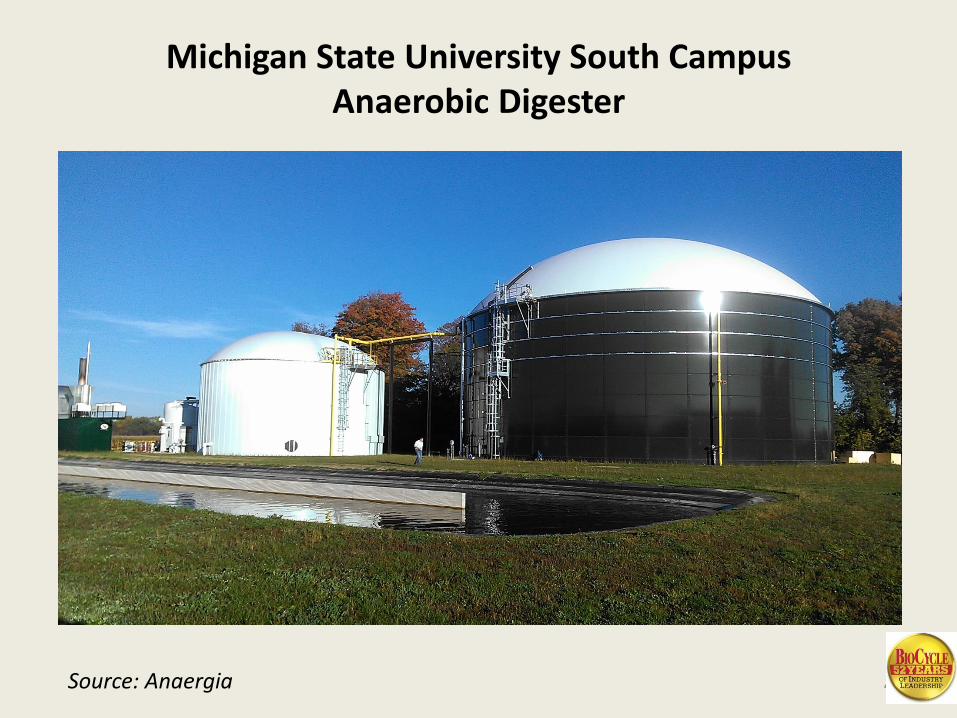
Michigan State University South Campus Anaerobic Digester
Source: Anaergia
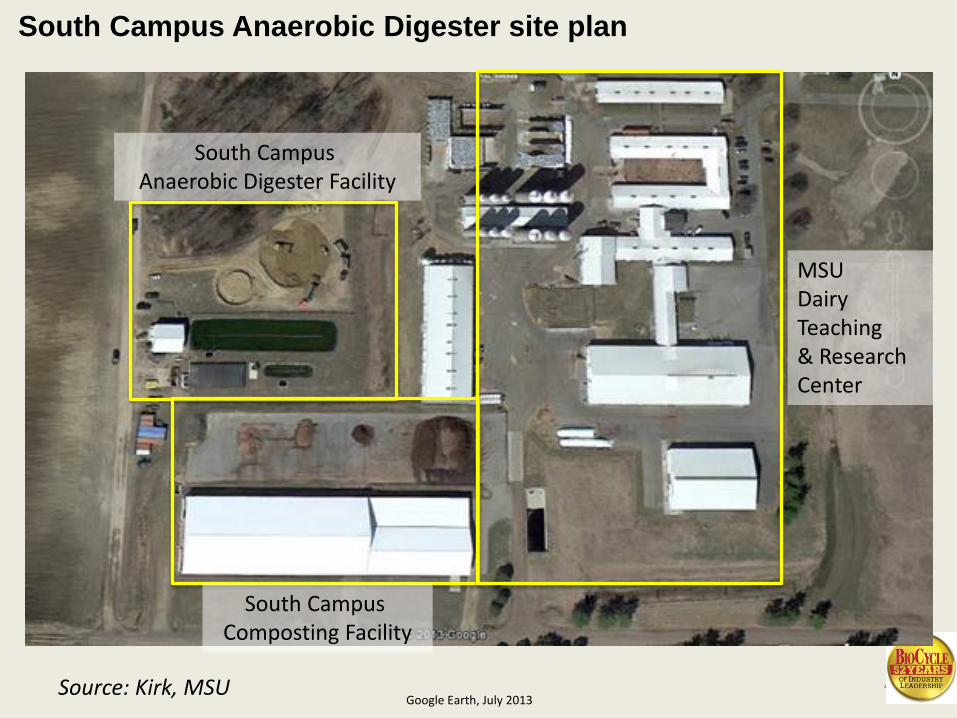
47Google Earth, July 2013
South Campus Anaerobic Digester site plan
MSUDairyTeaching& ResearchCenter
South Campus Composting Facility
South Campus Anaerobic Digester Facility
Source: Kirk, MSU

48
MSU South Campus digester feedstock blend
• Dairy Manure (43%)– Quantity: 7,000 ton/yr– Total Solids: 12%– Delivery: 7 days per week
• Fruit & Vegetable Waste (24%)– Quantity: 3,900 ton/yr– Total Solids: 11%– Delivery: 5 days per week
• Fat, Oil & Grease (FOG) (30%)– Quantity: 5,000 ton/yr– Total Solids: 20%– Delivery: 4-6 days per week
• Campus Food waste (3%)– Quantity: 500 - 1,000 ton/yr
Source: Dana Kirk, MSU

49
Regulations & Permitting
Materials and Waste Management
Surface Water
Air Pollution Control
Livestock Environmental Permitting
Source: Ohio EPA
50
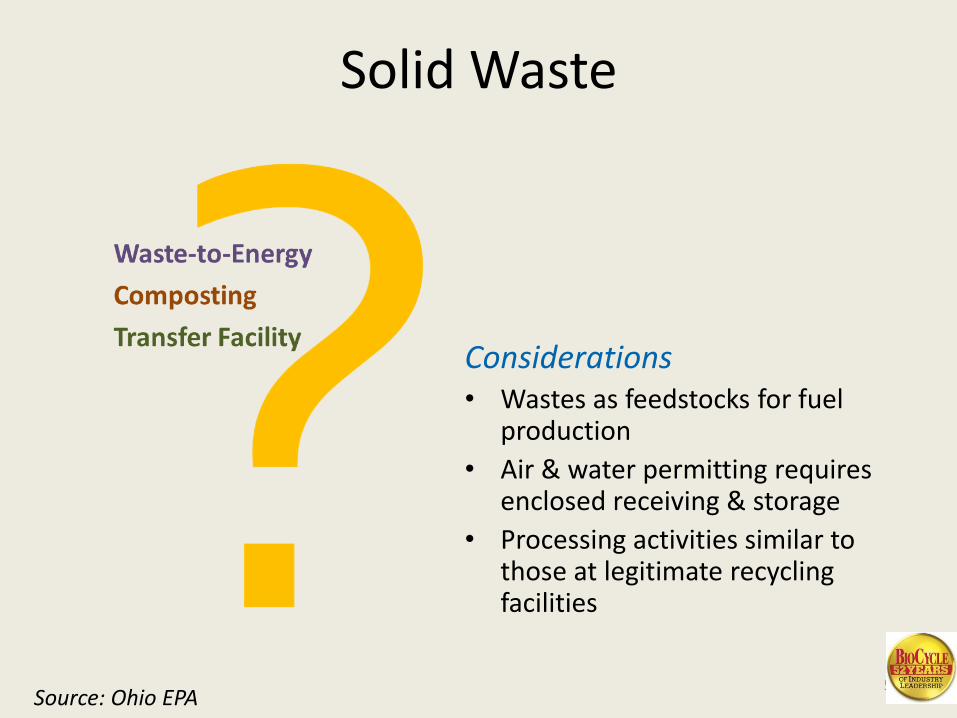
Solid Waste
Considerations• Wastes as feedstocks for fuel
production
• Air & water permitting requires enclosed receiving & storage
• Processing activities similar to those at legitimate recycling facilities
Source: Ohio EPA

51
Conversion Technologies Policy
• Thermal & biological conversion
• No solid waste disposal permitting when:
– waste used as feedstock for biogas/biofuel production
– covered by clean air/water permits
– not acting as a transfer facility
• Composting of byproducts
– Regulated as separate activity
Source: Ohio EPA