effects of pillar depth and shielding on the interaction
TRANSCRIPT

1 / 29
Effects of Pillar Depth and Shielding on 1
the Interaction of Crossing Multitunnels 2
3 Charles W. W. Ng, F. ASCE1; Thayanan Boonyarak2* and David Mašín3 4
5
*Corresponding author 6
Type of paper: Technical paper 7
Information of the authors 8
9
1 Chair Professor, Department of Civil and Environmental Engineering, The Hong 10
Kong University of Science and Technology, Clear Water Bay, Kowloon, Hong Kong. 11
E-mail: [email protected] 12
13
2 PhD Candidate. Department of Civil and Environmental Engineering, The Hong Kong 14
University of Science and Technology, Clear Water Bay, Kowloon, Hong Kong. 15
E-mail: [email protected] 16
17
3 Associate Professor, Faculty of Science, Charles University in Prague, Albertov 6, 18
128 43 Prague 2, Czech Republic. E-mail: [email protected] 19
20

2 / 29
ABSTRACT: 21
Due to associated stress changes and induced ground movements, any new tunnel excavation 22
may damage adjacent underground structures such as existing tunnels in congested cities. To 23
evaluate the impact of new tunnel construction on nearby existing tunnels, a series of three-24
dimensional centrifuge model tests in dry sand were carried out together with numerical 25
back-analyses using an advanced hypoplasticity constitutive model. The influences of the 26
pillar depth-to-diameter ratio (P/D) on two-tunnel interaction and the effects of shielding on 27
three-tunnel interaction were investigated. The maximum measured settlement of an existing 28
tunnel caused by a new tunnel excavation at P/D of 0.5 underneath was about 50% larger 29
than when P/D equals to 2.0. This is attributed to a smaller shear modulus, resulting from a 30
larger reduction in confining stress of soil acting on the invert of the existing tunnel in the 31
former than the latter. Different tunnel deformation mechanisms were observed with different 32
P/D ratios. The existing tunnel was elongated horizontally when P/D equals to 0.5. This is 33
because stress reduction in the horizontal direction was greater than that in the vertical 34
direction. The stress relief caused by the new tunnel not only led to a reduction in the vertical 35
stress at the invert but it also resulted in substantial stress reduction at the springline of the 36
existing tunnel. On the contrary, the existing tunnel was elongated vertically as the new 37
tunnel advanced at P/D of 2.0 since the reduction in stress in the vertical direction dominated. 38
When the new tunnel was excavated underneath two perpendicularly crossing tunnels, the 39
lower existing tunnel “shielded” the upper one from the influence of tunnel excavation. As a 40
result, the settlement of the upper existing tunnel was 25% smaller than in the case without 41
the shielding effects. 42
43
Author keywords: Multi-tunnel interaction; Three-dimensional centrifuge modeling; Three-44
dimensional numerical analysis; Pillar depth; Shielding effects. 45

3 / 29
INTRODUCTION 46
Existing tunnels in the ground may experience excessive deformation and their linings may 47
show signs of cracking when new tunnels are excavated close to them. It is thus important to 48
consider ground movements and stress changes when constructing new tunnels close to 49
existing ones, especially in urban areas where more and more tunnels are being built with 50
greater proximity to each other. Although the adverse effects of tunnel driving, such as 51
excessive tunnel settlement, large angular distortion and cracking of tunnel linings, on an 52
adjacent existing tunnel have been reported (Cooper et al., 2002; Mohamad et al., 2010), 53
interpreting data from the field is particularly difficult due to variations in soil properties, in-54
situ stress conditions and tunneling workmanship. 55
Addenbrooke and Potts (2001) carried out a numerical parametric study of twin parallel 56
tunnel interaction in plane strain conditions. The twin tunnels were excavated in both side-by-57
side and vertically stacked (piggyback) arrangements. In the case of the latter, the upper 58
tunnel experienced increasing settlement and elongation in the vertical direction with 59
decreasing pillar depth, which is defined as the clear vertical distance between two tunnels. 60
However, their study did not simulate stress transfer in the longitudinal direction of the new 61
tunnel. Thus the results may not carry over to the case of crossing tunnels. 62
Kim et al. (1998) investigated crossing-tunnel interaction under 1g conditions in clay. 63
Two new tunnels were driven into a soil sample with a miniature shield machine and a 64
hydraulic jack. Two different pillar depths between the existing and new tunnels were tested. 65
They reported that the existing tunnel was compressed vertically because a jacking force was 66
applied to install the liners of the new tunnels. Although different pillar depths were 67
considered, the two new tunnels were driven above and below the existing tunnel one after 68
the other. Thus, the effects of the second new tunnel excavation on the existing tunnel were 69
likely affected by the presence of the first new tunnel. 70

4 / 29
Klar et al. (2005) investigated effects of tunneling on a pipeline using an elastic-71
continuum solution and a Winkler solution. A greenfield soil displacement that followed a 72
Gaussian curve was imposed on the pipeline. Marshall et al. (2010) carried out centrifuge 73
tests to investigate tunnel excavation perpendicularly underneath a pipeline in sand. Effects 74
of volume loss caused by tunneling were simulated in plane strain conditions. They reported 75
that soil-pipe stiffness was a major factor influencing the longitudinal bending moment of the 76
pipeline. In addition, the presence of the pipeline significantly reduced the amount of shear 77
strain induced above the pipeline. Addenbrooke and Potts (2001) also reported that the size 78
and shape of the ground surface settlement trough in the case of piggyback tunnels differed 79
from that in the greenfield case. Despite all these studies, the effects of shielding provided by 80
an existing tunnel on the other adjacent existing tunnel are still not fully understood. The term 81
“shielding effects” is used to describe the presence of an existing tunnel that reduces the 82
influence of a new tunnel excavation on another adjacent existing tunnel. 83
Ng et al. (2013) investigated the three-dimensional interaction of perpendicularly 84
crossing tunnels using centrifuge tests and numerical back-analysis. Their major objective 85
was to study the individual effects of volume loss and weight loss on tunnel-tunnel 86
interaction. A novel device called a “donut” was developed to simulate the effects of volume 87
loss and mimic the removal of soil inside the tunnel in-flight. The settlements of the existing 88
tunnel were observed to be larger when the effects of volume loss alone were simulated than 89
when the effects of both volume loss and weight loss were modeled simultaneously. This is 90
because weight loss caused stress relief, which resulted in a reduction in the amount of tunnel 91
settlement induced by volume loss. However, only two-tunnel interaction and a single pillar 92
depth were investigated in their study. 93
The major objectives of the present study are to investigate the influences of pillar 94
depth on two-tunnel interaction and the effects of shielding on three-tunnel interaction. Three 95

5 / 29
centrifuge tests are described and reported. A three-dimensional tunnel advancement 96
technique considering the effects of both volume loss and weight loss was adopted (Ng et al., 97
2013). Three-dimensional numerical back-analyses of the centrifuge tests using a 98
hypoplasticity constitutive model with small strain stiffness are also discussed. 99
100
THREE-DIMENSIONAL CENTRIFUGE MODELING 101
Test program 102
Figure 1a shows a typical plan view of a centrifuge model package used to investigate the 103
interaction among multiple crossing tunnels in this study. The centrifuge tests were carried 104
out in a geotechnical centrifuge located at the Hong Kong University of Science and 105
Technology (Ng et al., 2001, 2002). By applying a centrifugal acceleration of 60 times that of 106
the earth’s gravity, a prototype stress condition can be recreated in the model. Each model 107
tunnel was made from an aluminum alloy tube. The outer diameter (D) and the lining 108
thickness were 100 mm and 3 mm, respectively, equivalent to 6 m and 180 mm in prototype 109
scale. The scaling laws for the flexural stiffness of the lining per unit width and the flexural 110
stiffness of the whole model tunnel are 1/N3 and 1/N4, respectively (Taylor, 1995). By 111
assuming that the compressive strength of concrete (f΄c) is 50 MPa, Young’s modulus (Ec) is 112
estimated to be 33 GPa (ACI, 2011). Thus, the tunnel lining thicknesses are equivalent to 230 113
mm and 420 mm in prototype scale in the transverse and longitudinal directions of the 114
existing tunnel, respectively. The existing tunnel was modeled as “wished-in-place” and each 115
end was closed to keep soil out. The two ends of the existing tunnels were not connected to 116
the model box and no additional fixity was imposed. Thus, the existing tunnel was not 117
modeled as a continuous tunnel. 118
Figure 1b shows an elevation view of Test E2N3, whose objective was to investigate 119
the effects of a new tunnel excavated perpendicularly beneath an existing tunnel. In this test, 120

6 / 29
the C/D ratios of the existing tunnel and the new tunnel were 2.0 and 3.5 respectively, 121
whereas the pillar depth-to-diameter ratio (P/D) was 0.5. These correspond respectively to the 122
cover depths of the existing tunnel and the new tunnel of 12 m and 21 m in prototype, and the 123
pillar distance of 3 m. Note that some of the measured results of this test have been reported 124
by Ng et al. (2013). 125
In Test E2N5 (see Fig. 1c) which was designed to investigate the influence of P/D on 126
how the existing tunnel might respond to the new tunnel excavation, a P/D of 2 instead of 0.5 127
was used. In Test E2,3N5 (refer to Fig. 1d) which featured two existing tunnels above the 128
new one, the shielding effects of the lower existing tunnel were studied by comparing the 129
results with those from Test E2N5. 130
According to Jacobsz et al. (2004), the influence zone of tunneling in sand was found to 131
be in parabolic shape projecting 45 from the invert of the tunnel to the ground surface. By 132
adopting this finding, the influence zone of the new tunnel excavation was estimated to be 133
located within the boundary of the existing tunnel. 134
135
In-flight tunneling simulation technique 136
Figure 2a shows the new model tunnel used in each centrifuge test. Six “donuts” (Ng et al., 137
2013) with each representing an excavation length of 0.6D were adopted to simulate the 138
effects of three-dimensional tunnel advancement in-flight. Both ends of the new tunnel were 139
closed to keep soil out. 140
Figure 2b shows a cross sectional view of a “donut” which consisted of an aluminum 141
alloy tube serving as the tunnel lining, an outer rubber membrane and an inner rubber 142
membrane. During model preparation, each rubber membrane was filled with a heavy fluid 143
(ZnCl2) having the same density as the soil in each test. Volume loss equivalent to 2% was 144
simulated by controlling the outflow of the heavy fluid from the outer membrane. Likewise, 145

7 / 29
weight loss was simulated by draining an amount of heavy fluid equivalent to the weight of 146
soil used in each test from the inner membrane. Each “donut” was connected with drainage 147
tubes to a corresponding drainage valve. Each valve was regulated in-flight one after another 148
allowing outflow of the heavy fluid to simulate the effects of tunnel advancement. The heavy 149
fluid that was drained away was collected in a reservoir (refer to Fig. 1a). 150
151
Model preparation 152
Dry silica Toyoura sand was used in each centrifuge test. In previous studies, grain size 153
effects on soil-tunnel interaction were considered insignificant when the ratio of tunnel 154
diameter to average particle size was larger than 175 (Garnier et al., 2007). In this study, the 155
ratio of model tunnel diameter (100 mm) to average particle size (0.17 mm, Ishihara, 1993) 156
was 588. 157
A dry pluviation technique was adopted to prepare the soil sample in each test. A drop 158
height of 500 mm and a pluviation rate of about 100 kg/hour were used to control the density 159
of the soil sample. The density achieved in Tests E2N3, E2N5 and E2,3N5 were 1529 kg/m3 160
(relative density, Dr = 64%), 1532 kg/m3 (Dr = 65%) and 1535 kg/m3 (Dr = 66%), 161
respectively. According to a study on the homogeneity of pluviated sand samples in 162
centrifuge tests, variations in dry density within ± 0.5% or ± 8 kg/m3 are acceptable (Garnier, 163
2001). 164
Each existing tunnel was placed after the level of pluviated sand reached the designed 165
height. By using some thin wires and a temporary structural beam above, the new tunnel was 166
“wished-in-place” in position. These wires and the beam were removed after the pluvial 167
deposition reached the bottom of the new tunnel to support it (refer to Fig. 2a). 168
169
170

8 / 29
Instrumentation 171
Figure 3a shows the types and locations of instruments installed in the existing tunnel. To 172
measure tunnel settlement, linear variable differential transformers (LVDTs) were connected 173
to the crown of the existing tunnel at various points via extension rods. Each extension rod 174
was made of an aluminum alloy housed in a hollow aluminum alloy tube in order to reduce 175
friction with the surrounding soil. In Test E2N3, the LVDTs measuring settlement of the 176
existing tunnel were all installed along one half of that tunnel and the maximum distance of 177
the extension rods from the centerline of the new tunnel was 4D (see the schematic diagram 178
in Fig. 3). In Tests E2N5 and E2,3N5, the extension rods were placed along the length of the 179
existing tunnel and were within a distance of 3D from the centerline of the new tunnel. The 180
LVDTs were arranged differently in Tests E2N5 and E2,3N5 to observe the response of the 181
existing tunnel near the centerline of the new tunnel, where maximum tunnel settlement was 182
expected to occur. 183
Figure 3b shows potentiometers installed inside the existing tunnel at the location 184
directly above the new tunnel. Four potentiometers were placed at the crown, at each 185
springline and at the invert to measure tunnel deformation. A potentiometer is a three-186
terminal resistor that measures a change in resistance with a change in the travel distance of a 187
slider (Todd, 1975). The accuracy of the potentiometers used in this study was estimated to 188
be within ±0.017 mm in model scale (equivalent to ±1 mm in prototype scale) by considering 189
the standard deviation of the data once the centrifugal acceleration had reached 60g prior to 190
tunnel excavation. 191
Eight sets of foil strain gages were attached to both inner and outer surfaces of the 192
lining of the existing tunnel at a spacing of about 45 around of the circumference. The strain 193
gages having a gage factor of 2 were connected into a full Wheatstone bridge to compensate 194
for temperature effects. In Test E2,3N5, potentiometers and strain gages in the transverse 195

9 / 29
direction were also installed in the lower existing tunnel at the location directly below the 196
upper existing tunnel. 197
Figure 3c shows a typical longitudinal section view of the existing tunnel. Four 198
potentiometers were mounted on a plate, which was connected to a frame that was fixed to 199
the lining of the existing tunnel. A total of 19 sets of semiconductor strain gages were 200
attached along the length of the existing tunnel at the crown and invert at a typical spacing of 201
50 mm. The strain gages in the longitudinal direction of the existing tunnel were connected 202
into a full Wheatstone bridge, having a gage factor of 140. Different types of strain gages 203
were used in the longitudinal and transverse directions of the existing tunnel because the 204
semiconductor ones are easily damaged during installation and so cannot be attached to the 205
inner surface of the tunnel lining. 206
207
Test procedure 208
The model package was transferred to the centrifuge platform after model preparation and 209
transducer calibration. An initial reading was taken from each transducer once the centrifuge 210
had spun up to an acceleration of 60g and the transducers had stabilized, prior to the 211
advancement of the new tunnel. Subsequently, the six stages of tunnel excavation proceeded 212
in-flight (see Fig. 2a) one after another. In each stage of tunnel advancement, the transducers 213
were allowed to stabilize before proceeding to the next stage. Once the tunnel was excavated, 214
the centrifuge was gradually spun down. 215
216
THREE-DIMENSIONAL NUMERICAL BACK-ANALYSIS 217
The objective of numerical back-analysis is to understand the stress transfer mechanism 218
and strain induced in the soil during the crossing multi-tunnel interaction. The numerical 219

10 / 29
analysis is necessary because stress changes and strain induced in the soil around the tunnel 220
could not be measured easily and accurately in the three-dimensional centrifuge model tests. 221
A commercial finite element program PLAXIS 3D 2012 (Brinkgreve et al., 2012) was 222
adopted to back-analyze centrifuge test results. Soil was represented using an open-source 223
hypoplastic model implementation (Gudehus et al., 2008). 224
225
Finite element mesh and boundary conditions 226
Figure 4a shows the three-dimensional finite element mesh for case E2N3. The dimensions of 227
the mesh and tunnel configuration in each numerical run were identical to that in each 228
centrifuge test. A plane of symmetry was defined at X/D of 0. The boundary conditions 229
adopted in the finite element analysis were roller support on the four vertical sides and pin 230
support at the base of the mesh. The soil was modeled using a 10-node tetrahedral element. 231
The closest distances from the side and the bottom boundaries to the tunnels were 3.5D 232
and 1.5D, respectively. To justify any effect of mesh size on crossing-tunnel interaction, an 233
additional sensitivity numerical analysis was carried out by doubling the width and the depth 234
of the original mesh. The differences between computed results obtained from the original 235
and the extended meshes are generally less than 6%. 236
Figure 4b shows some details of the two perpendicularly crossing tunnels in case E2N3. 237
The existing tunnel and the lining of the new tunnel were modeled as “wished-in-place” by 238
activating the tunnel lining and deactivating soil elements inside the tunnel in the initial stage. 239
An additional constraint was adopted for the tunnel lining at the plane of symmetry. Each 240
edge of the tunnel lining at the plane of symmetry was allowed neither translational 241
movement in the “X” direction nor rotation around the “Y” and “Z” axes (i.e., ux, y and z = 242
0). The tunnel lining was modeled using a 6-node elastic plate element. 243
244
11 / 29
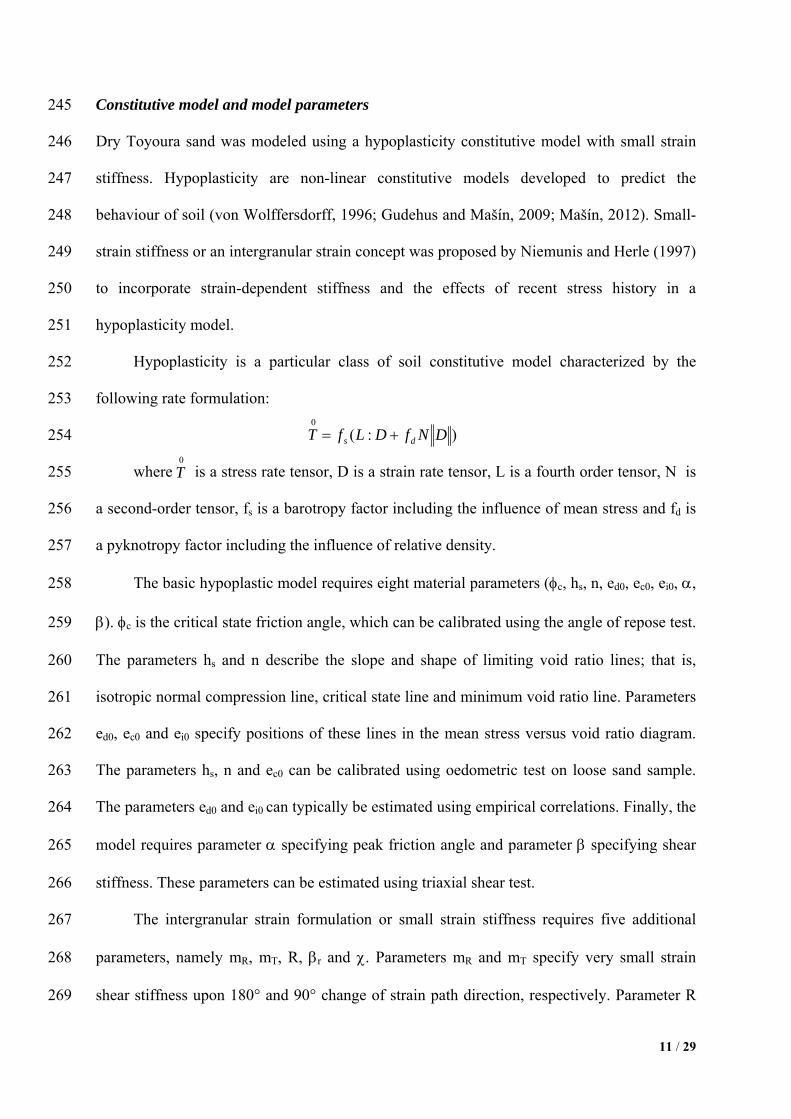
Constitutive model and model parameters 245
Dry Toyoura sand was modeled using a hypoplasticity constitutive model with small strain 246
stiffness. Hypoplasticity are non-linear constitutive models developed to predict the 247
behaviour of soil (von Wolffersdorff, 1996; Gudehus and Mašín, 2009; Mašín, 2012). Small-248
strain stiffness or an intergranular strain concept was proposed by Niemunis and Herle (1997) 249
to incorporate strain-dependent stiffness and the effects of recent stress history in a 250
hypoplasticity model. 251
Hypoplasticity is a particular class of soil constitutive model characterized by the 252
following rate formulation: 253
254
where is a stress rate tensor, D is a strain rate tensor, L is a fourth order tensor, N is 255
a second-order tensor, fs is a barotropy factor including the influence of mean stress and fd is 256
a pyknotropy factor including the influence of relative density. 257
The basic hypoplastic model requires eight material parameters (c, hs, n, ed0, ec0, ei0, , 258
). c is the critical state friction angle, which can be calibrated using the angle of repose test. 259
The parameters hs and n describe the slope and shape of limiting void ratio lines; that is, 260
isotropic normal compression line, critical state line and minimum void ratio line. Parameters 261
ed0, ec0 and ei0 specify positions of these lines in the mean stress versus void ratio diagram. 262
The parameters hs, n and ec0 can be calibrated using oedometric test on loose sand sample. 263
The parameters ed0 and ei0 can typically be estimated using empirical correlations. Finally, the 264
model requires parameter specifying peak friction angle and parameter specifying shear 265
stiffness. These parameters can be estimated using triaxial shear test. 266
The intergranular strain formulation or small strain stiffness requires five additional 267
parameters, namely mR, mT, R, r and . Parameters mR and mT specify very small strain 268
shear stiffness upon 180° and 90° change of strain path direction, respectively. Parameter R 269
):(0
DNfDLfT ds 0
T

12 / 29
specifies the size of elastic range measured in the strain space; r and specify the rate of 270
stiffness degradation with strain. 271
To determine model parameters, a critical state friction angle (c) and parameters 272
controlling void ratios (hs, n, ed0, ec0 and ei0) were adopted based on calibration results 273
reported by Herle and Gudehus (1999). Exponent , exponent and small strain stiffness 274
parameters (mR, m
T, R, r and ) were calibrated by curve fitting the triaxial test results with 275
local strain measurement and bender element reported by Yamashita et al. (2000, 2009). To 276
initialize the stress conditions, the coefficient of at-rest earth pressure (K0) was assumed to be 277
0.5. The model parameters are summarized in Table 1. 278
The tunnel lining was modeled as a linear elastic material. Its Young’s modulus, 279
density and Poisson’s ratio were assumed to be 69 GPa, 2700 kg/m3 and 0.33, respectively. 280
Mašín (2009) and Svoboda et al. (2010) adopted hypoplasticity constitutive model with 281
small strain stiffness to predict greenfield settlement trough caused by a single tunnel 282
excavation. It was found that the computed ground settlements were in a reasonable 283
agreement with those from field observations. 284
285
Numerical modeling procedure 286
The procedure of numerical modeling basically followed that in the centrifuge tests. Drained 287
effective stress analysis was adopted as every test was carried out in dry sand. The numerical 288
simulation procedure is as follows: 289
1. Create the initial conditions as follows: 290
1.1 Specify the void ratio in 1g conditions. 291
1.2 Set the intergranular strain of soil elements to zero (i.e., no deformation at the initial 292
stage). 293

13 / 29
1.3 Activate the lining of the existing and new tunnels to simulate “wished-in-place” 294
tunnel lining. 295
1.4 Deactivate the soil elements inside the existing tunnel and some parts inside the 296
new tunnel (see Fig. 4a). 297
1.5 Initialize stress under 1g conditions with K0 equaling 0.5. 298
2. Increase the unit weight of soil and tunnel lining by 60 times that under 1g conditions 299
to simulate rise in centrifugal acceleration. 300
3. Excavate new tunnel by simulating the effects of both volume loss and weight loss as 301
follows: 302
3.1 To simulate the effects of 2% volume loss, the surface contraction technique (a 303
utility available in the PLAXIS software) was used. This technique applies a 304
uniform radial contraction on the tunnel lining. It should be noted that this 305
numerical simulation technique does not represent a perfect match to that of 306
centrifuge model tests. However, the discrepancy between the numerical and 307
centrifuge simulation techniques should not affect any key conclusion obtained 308
from this study significantly since the volume loss simulated in both numerical and 309
physical modeling is identical. 310
3.2 Simulate the effects of weight loss by removing (i.e., deactivating) the soil 311
elements (with the same unit weight as the heavy fluid used in the centrifuge test) 312
inside the tunnel. 313
3.3 Restrain soil movement in the longitudinal direction of the new tunnel by applying 314
a roller support to the tunnel face. 315
4. Advance the new tunnel by a distance of 0.6D in each excavation stage by repeating 316
step 3 above for a total distance of 3.6D in six stages. 317
318

14 / 29
Numerical parametric study of tunneling in greenfield conditions 319
In addition to the numerical back-analysis of crossing-tunnel interaction, two additional 320
numerical runs were carried out to investigate the effects of tunnel excavation on ground 321
displacements in greenfield sites. In these two greenfield runs, all the geometries, boundary 322
conditions and numerical procedures of tunneling are identical to those in the numerical 323
back-analysis, except no existing tunnel is present in the two additional analyses. 324
325
INTERPRETATION OF RESULTS 326
Measured and computed results reported in this study are expressed in prototype scale unless 327
stated otherwise. 328
329
Settlement of the existing tunnel 330
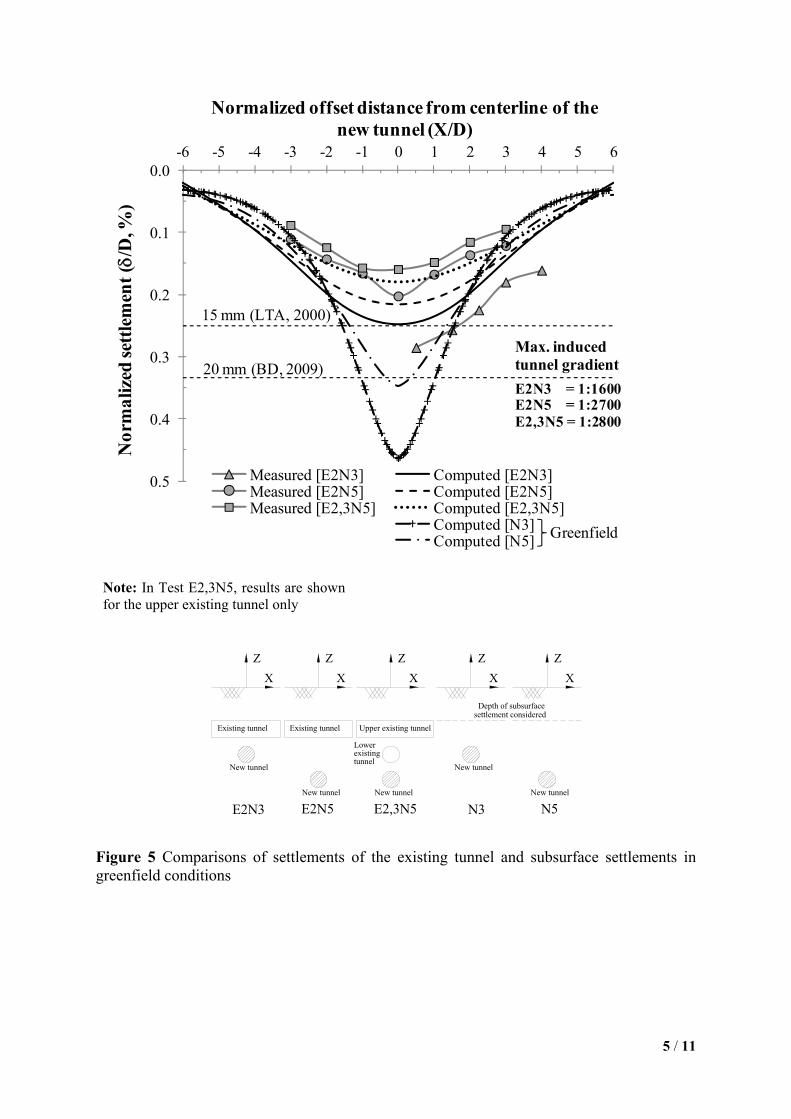
In order to compare results from this study with a case history, the tunnel settlement was 331
normalized by the diameter of the new tunnel. Figure 5 compares the measured and computed 332
normalized settlements of the existing tunnel at the end of tunnel advancement. 333
The maximum measured tunnel settlement in Test E2N3 was about 0.3%D (i.e., 18 334
mm), which exceeds the recommended serviceability limit of 15 mm (LTA, 2000). For the 335
two-tunnel interaction, the maximum measured tunnel settlement in Test E2N3 (i.e., P/D of 336
0.5) was about 50% larger than that in Test E2N5 (i.e., P/D of 2). The larger tunnel settlement 337
in Test E2N3 was mainly due to a larger reduction in vertical stress and lower normalized soil 338
stiffness along the invert of the existing tunnel. Detailed explanations are given in the section 339
incremental normal stress acting on the existing tunnel. 340
As for the three-tunnel interaction, the maximum measured settlement of the upper 341
existing tunnel in Test E2,3N5 was about 25% smaller than that in Test E2N5 (provided that 342
P/D of 2 for both tests) due to the presence of the lower existing tunnel (i.e., shielding 343

15 / 29
effects). Further away from the centerline of the new tunnel, the difference in tunnel 344
settlement between Tests E2N5 and E2,3N5 narrowed. 345
The induced tunnel gradient can be deduced from the slope of measured tunnel 346
settlements. The largest induced tunnel gradient of 1:1600 was observed in Test E2N3, where 347
the largest tunnel settlement occurred. The maximum induced tunnel gradients of the three 348
tests all fell within the recommended limit of 1:1000 (LTA, 2000; BD, 2009). 349
In Test E2N3, the computed tunnel settlements were underestimated by 16 % at the 350
location directly above the new tunnel. On the other hand, they were overestimated in Tests 351
E2N5 and E2,3N5 by 8 % and 12 %, respectively, at the same location. This discrepancy may 352
be due to the fact that some model parameters were obtained from the literature and empirical 353
relationships. Although there were discrepancies between the measured and the computed 354
results, both results show the same trend. 355
To assist in the interpretation of settlements of the existing tunnel, subsurface 356
settlements caused by tunneling in the greenfield site are included and compared. As 357
expected, the subsurface settlements due to the shallower tunnel excavation (N3) are larger 358
than those caused by the deeper tunnel (N5). This is because N3 has a smaller C/D than that 359
of N5 tunnel. It is well-understood that induced subsurface settlement is larger when 360
tunneling at a shallower depth (i.e., reducing C/D), as reported by many researchers such as 361
Mair and Taylor (1997) and Marshall et al. (2012). Similarly, it is expected that a larger 362
tunnel settlement in Test E2N3 than that in Test E2N5. This is because the new tunnel 363
excavation in the former test was shallower (i.e., smaller C/D) than that in the latter test. 364
365
Soil stiffness along the invert of the existing tunnel 366
To explain the difference in tunnel settlement among the three cases, the normalized soil 367
stiffness along the invert of the existing tunnel was calculated as shown in Figure 6. The 368

16 / 29
normalized soil stiffness was considered before tunnel excavation (once the centrifugal 369
acceleration had reached 60g) and after tunnel completion. Secant shear moduli (Gbefore and 370
Gafter) were calculated from deviatoric stress and deviatoric strain (G = q/3s) at the end of 371
each stage. The normalized soil stiffness differed among the three cases because the 372
hypoplasticity model can simulate the dependence of stiffness on the state, strain and recent 373
stress history of the soil. 374
In terms of two-tunnel interaction, the normalized shear modulus was lower in case 375
E2N3 than that in case E2N5 at the center of the existing tunnel (X/D of 0), resulting in a 376
larger tunnel settlement (see Fig. 5). This is because the reduction in confining stress due to 377
tunnel excavation was larger in the former than in the latter. Another reason for a larger 378
reduction in mobilized shear modulus in E2N3 than that in E2N5 was due to higher shear 379
strain mobilized in the former than the latter case. Similar results were also reported by 380
Marshall et al. (2012) who found that shear strains in soil induced by tunnel excavation at a 381
smaller C/D ratio was greater than that caused by a tunnel advanced at a larger C/D ratio. 382
More explanations are given in the sections under incremental normal stress acting on the 383
existing tunnel and induced deviatoric strain of soil. 384
An increase in shear modulus of soil was observed in cases E2N3 and E2N5 at an offset 385
distances between 2D and 4D from the center of the existing tunnel. This is because the 386
confining stress was increased due to stress redistribution, leading to the increase in soil 387
stiffness. It is obvious that stress redistribution was necessary to maintain equilibrium. 388
As for three-tunnel interaction, there was almost no change in normalized stiffness at 389
the centerline of the new tunnel in case E2,3N5 whereas the normalized stiffness was 390
significantly reduced in case E2N5 (given that P/D of 2 in both tests). The minimum 391
normalized stiffness in case E2,3N5 was found at an offset distance of 0.5D, which is the 392

17 / 29
offset distance of the springline of the lower existing tunnel, due to the shielding effects of 393
the lower existing tunnel. 394
395
Induced strain and shear stress in the longitudinal direction of the existing tunnel 396
Figure 7 compares the measured and computed strain induced along the invert of the existing 397
tunnel at the end of tunnel advancement. The positive and negative signs denote induced 398
tensile strain and induced compressive strain at the invert of the existing tunnel, respectively. 399
Due to differential settlement of the existing tunnel, sagging moment was induced 400
directly above the new tunnel. As a result, tensile strain was induced at the invert of the 401
existing tunnel. The measured maximum induced tensile strain of 152 was found in Test 402
E2N3, exceeding the cracking tensile strain of 150 for unreinforced concrete (ACI, 2001). 403
The measured maximum induced tensile strain in Test E2N5 (127 ) was 16% smaller than 404
that in Test E2N3, where the former test had a larger P/D than the latter test. The measured 405
maximum induced tensile strain in the upper existing tunnel in Test E2,3N5 (86 ) was 36% 406
smaller than that in Test E2N5. This is due to shielding effects provided by the lower existing 407
tunnel. 408
The induced strain in the longitudinal direction of the existing tunnel was consistent 409
with the tunnel settlement in every test (refer to Fig. 5). The possible reason for discrepancies 410
between the measured and computed results has been discussed previously under the section 411
of settlement of the existing tunnel. 412
Shear stress acting on the tunnel lining was deduced by differentiating bending 413
moment, which was converted from induced strain along the invert of the existing tunnel. At 414
a given concrete compressive strength (f΄c) of 50 MPa and a reduction factor of 0.55, the 415
allowable shear stress was estimated to be 660 kPa (ACI, 2011). The maximum deduced 416

18 / 29
shear stress in Tests E2N3 (for both measured and computed results) exceeded the allowable 417
limit, suggesting that the tunnel lining may crack. 418
There was a high possibility that cracking would occur when the tunnel was excavated 419
at P/D of 0.5 (Test E2N3) as the induced tensile strain and shear stress exceeded the cracking 420
tensile strain and the allowable shear stress, respectively. 421
422
Induced strain in the transverse direction of the existing tunnel 423
Figure 8 shows comparison between measured and computed strains induced at the outer 424
surface of the existing tunnel in the transverse direction. As the strain induced in the first 425
three excavation stages (i.e., from Y/D of -1.5 to -0.3) was smaller than that induced in the 426
last three excavation stages (i.e., from Y/D of 0.3 to 1.5) and to simplify presentation, the 427
results from the former are not shown. 428
In Test E2N3 (Fig. 8a), induced compressive strain was at shoulders, the right knee and 429
the invert. Tensile strain was induced at both springlines. The induced strain in Test E2N3 430
indicates that the existing tunnel was elongated horizontally. To verify this horizontal 431
elongation, tunnel deformation is shown and discussed in the next section. It can be seen that 432
the computed strains induced in the transverse direction are consistent with the measured 433
results. 434
Strain induced by tunneling caused tunnel deformations in different directions in Test 435
E2N3 and Test E2N5 (Fig. 8b), where the former test had a smaller P/D than the latter test. In 436
Test E2N5 tensile strain was induced at the crown and invert while compressive strain was 437
induced at both springlines. Larger compressive strain and tensile strain were induced at both 438
springlines and the invert, respectively, when Y/D was 0.9D than at the end of tunneling. The 439
induced strain in Test E2N5 suggests that the existing tunnel was elongated vertically. The 440
tunnels deformed in different directions in Tests E2N3 and E2N5 because of the varying 441

19 / 29
incremental normal stresses acting on the existing tunnel with different P/Ds. More 442
explanations are given later. 443
In Test E2,3N5 the P/D between the new tunnel and the upper existing tunnel was 2, 444
identical to that in Test E2N5. Thus, the strain induced in the upper existing tunnel in Tests 445
E2,3N5 (Figure 8c) and that induced in the existing tunnel in Test E2N5 (Figure 8b) were 446
similar in terms of both magnitude and trend. As expected, the two tunnels were both 447
elongated vertically. 448
Induced strain in the lower existing tunnel in Test E2,3N5 is shown in Figure 8d. 449
Compressive strain was induced at the crown and both springlines while induced tensile strain 450
was found at the shoulders, knees and invert. The induced strain suggests that the lower 451
existing tunnel was elongated vertically. 452
Given that the induced compressive strain equaled the induced tensile strain on 453
opposite surfaces of the tunnel lining, the tensile strain was at the maximum of 170 at the 454
right springline on the inner surface of the existing tunnel in Test E2,3N5 (refer to Fig. 8d). 455
This induced tensile strain exceeded the cracking tensile strain of 150 (ACI, 2001), 456
suggesting that the inner surface of the tunnel lining may crack. 457
458
Deformation of the existing tunnel 459
Figure 9a shows the change in the normalized diameter of the existing tunnel (D/D0), 460
where D0 is the initial diameter of the tunnel, in the vertical direction at the end of tunnel 461
construction. According to the measured results, there was a reduction in the tunnel diameter 462
in the vertical direction in Test E2N3 (P/D of 0.5), but the existing tunnel in Test E2N5 (P/D 463
of 2) was vertically elongated. This is because stress reduction on the existing tunnel in the 464
horizontal direction was larger than that in the vertical direction in the former test with a 465
smaller P/D ratio. Details of stress changes at the existing tunnel are illustrated and discussed 466

20 / 29
in the next section. It should be pointed out that stress relief caused by the new tunnel 467
excavation not only led to a reduction in vertical stress but also it resulted in substantial stress 468
reduction at each springline of the existing tunnel. On the other hand, when the new tunnel 469
was located further away from the existing tunnel (i.e., P/D of 2), stress relief was dominated 470
in the vertical direction and it mainly affected the invert of the existing tunnel, leading to the 471
elongation of it. 472
Similar to that of Test E2N5, the upper existing tunnel was elongated in the vertical 473
direction in Test E2,3N5, which has the same P/D ratio resulting in a larger reduction in the 474
vertical than the horizontal stress. On the other hand, the lower existing tunnel in Test 475
E2,3N5 was also elongated vertically even though the P/D was 0.5. This is because the invert 476
of the lower existing tunnel was closest to the new tunnel, resulting in a sharp reduction in the 477
vertical stress at the invert. The computed results are generally consistent with the measured 478
tunnel deformations. Further explanations of stress acting on each existing tunnel are given in 479
the next section. 480
By considering the computed subsurface settlements in greenfield conditions shown in 481
Figure 5, it is evident that the subsurface settlement near the new tunnel (N3) was 33% larger 482
than that caused by the deeper new tunnel (N5). This is consistent with results reported by 483
Mair and Taylor (1997). Accordingly, the settlement induced at the invert of the existing 484
tunnel was larger in Test E2N3 than that in Test E2N5. 485
Figure 9b shows the change in the normalized diameter of the existing tunnel in the 486
horizontal direction. Both measured and computed results reveal that the existing tunnel was 487
elongated horizontally in Test E2N3. This is because stress reduction on the existing tunnel in 488
the horizontal direction was greater than that in the vertical direction. On the other hand, the 489
diameter in each existing tunnel in Tests E2N5 and E2,3N5 was reduced horizontally as the 490
decrease in the vertical stress was larger than the horizontal stress. The results of tunnel 491

21 / 29
deformation in each case are consistent with the induced strains in the transverse direction of 492
the existing tunnel (see Fig. 8). 493
BTS (2000) recommended that the difference between the maximum and minimum 494
diameters of a tunnel should be within 2% [i.e., (Dmax - Dmin)/D0 2%]. For the cases 495
considered in this study, it can be seen in Figure 9 that the deformations of the existing 496
tunnels due to tunnel excavation are still within the allowable limit. 497
498
Incremental normal stress acting on the existing tunnel 499
Figure 10 shows the computed incremental normal stress acting on the existing tunnel in the 500
transverse direction at the location directly above the new tunnel (i.e., X/D of 0). The 501
incremental stress in this study is defined as the difference between the stress at the end of 502
tunnel excavation and that when centrifugal acceleration had reached 60g. Incremental 503
normal stresses acting on the existing tunnel are obtained from the numerical back-analysis 504
only. 505
In case E2N3 (see Fig. 10a), normal stress increased gradually at the crown as the new 506
tunnel advanced. This is because stress was transferred in the longitudinal direction of the 507
new tunnel to maintain stress equilibrium (Ng and Lee, 2005). At both springlines, there was 508
a reduction in normal stress. At the invert, once the new tunnel approached the existing 509
tunnel (i.e., Y/D of -0.3), a slight increase in normal stress was observed. As the new tunnel 510
advanced further (i.e., from Y/D of 0.3 to 1.5), normal stress dropped sharply. 511
In case E2N5 (see Figure 10b), there was an increase in normal stress at the crown. At 512
both springlines, the reduction in normal stress was smaller than that in case E2N3 as the P/D 513
for the latter was smaller. At the invert, normal stress reduced substantially as the new tunnel 514
advanced. 515

22 / 29
The fact that the existing tunnel deformed in different directions in cases E2N3 and 516
E2N5 (refer to Fig. 9) can be explained by considering change in stress in the horizontal and 517
vertical directions. In case E2N3, the decrease in stress in the horizontal direction was larger 518
than that in the vertical direction at the end of tunneling, resulting in elongation of the 519
existing tunnel in the horizontal direction. On the other hand, reduction in the vertical stress 520
was larger than the horizontal stress in the case E2N5 at the end of tunnel excavation, causing 521
vertical elongation of the existing tunnel. 522
One of reasons for the larger tunnel settlement in Test E2N3 than that in Test E2N5 523
(refer to Fig. 5), where the two tests had different P/Ds, was because the stress reduction at 524
the invert of the existing tunnel was larger in the former test (see Figs 10a and 10b). 525
For three-tunnel interaction, incremental normal stress acting on the upper existing 526
tunnel in case E2,3N5 (see Fig. 10c) was smaller than case E2N5. This is because the 527
presence of the lower existing tunnel in case E2,3N5 reduced the change in normal stress at 528
every part of the upper existing tunnel compared with that in case E2N5. In case E2,3N5, the 529
stress reduction on the upper existing tunnel was larger in the vertical direction than that in 530
the horizontal direction as the new tunnel advanced. This resulted in the vertical elongation of 531
the upper existing tunnel (refer to Fig. 9a). 532
Figure 10d shows the incremental normal stress acting on the lower existing tunnel in 533
case E2,3N5. Although this tunnel minimized stress redistribution in the longitudinal 534
direction of the new tunnel, stress was still transferred in the transverse direction of the new 535
tunnel causing stress to increase at the crown of this tunnel. At each springline, a decrease in 536
normal stress was observed. At the invert, a sharp reduction in normal stress occurred at the 537
completion of tunneling. As a result, the lower existing tunnel was elongated vertically (see 538
Fig. 9a). 539

23 / 29
The allowable limits of stress change for a tunnel lining suggested by BD (2009) are 540
shown in Figure 10. It can be seen that the change in normal stress exceeded the allowable 541
limit of ±20 kPa in all cases. This suggests that the structural analysis considering these 542
changes of stress acting on the tunnel linings should be taken into account. 543
544
Induced deviatoric strain of soil 545
Figure 11 shows the computed induced deviatoric strain of soil at the end of tunnel 546
advancement. The positive and negative signs denote increases and decreases in deviatoric 547
strain, respectively, compared with that prior to tunnel excavation (at 60g). 548
In case E2N3 (as shown in Fig. 11a), the maximum induced deviatoric strain was found 549
at the invert of the existing tunnel directly above the new tunnel (i.e., at X/D of 0). This 550
maximum deviatoric strain resulted in the largest reduction in soil stiffness at the centerline 551
of the new tunnel (see Fig. 6), in addition to the largest normal stress reduction (refer to Fig. 552
10a). 553
Figure 11b shows the induced deviatoric strain in case E2N5. The magnitude of the 554
maximum induced deviatoric strain at the invert of the existing tunnel in case E2N5 was 555
slightly smaller than that in case E2N3 (Fig. 11a). This suggests that the smaller soil stiffness 556
in case E2N3 than that in case E2N5 (refer to Fig. 6) was mainly due to the larger reduction 557
in normal stress at the invert of the existing tunnel in the former case (as shown in Figs. 10a 558
and 10b). 559
Induced deviatoric strain in case E2,3N5 is illustrated in Figure 11c. The induced 560
deviatoric strain at the invert of the upper existing tunnel at the centerline of the new tunnel 561
in case E2,3N5 was smaller than that in case E2N5. This is because the lower existing tunnel 562
“shielded” the upper existing tunnel from the deviatoric strain induced by the new tunnel 563

24 / 29
excavation. This smaller induced deviatoric strain in case E2,3N5 was another reason for the 564
smaller reduction in soil stiffness at the invert of the existing tunnel (see Fig. 6). 565
Marshall et al. (2012) reported shear strain induced by a single tunnel excavation in 566
centrifuge test. Their experimental results reveal that a zone of large shear strain occurred 567
above the crown and shoulder of the tunnel. In case E2,3N5, the computed deviatoric strains 568
at the crown and the shoulder of the new tunnel was smaller than that induced at the 569
springline. This is because of the stiffening effects of the lower existing tunnel, resulting in 570
smaller deviatoric strains at the crown and shoulder than that at the springline. 571
572
SUMMARY AND CONCLUSIONS 573
Three-dimensional centrifuge model tests and numerical back-analyses were conducted 574
to investigate crossing multi-tunnel interaction. In Test E2N3, a new tunnel advanced 575
perpendicularly beneath an existing tunnel with P/D of 0.5. Tests E2N5 and E2,3N5 were 576
carried out to investigate the effects of the pillar depth-to-diameter ratio (P/D) and shielding 577
on multi-tunnel interaction, respectively. Based on the interpretation of the measured and 578
computed results, the following conclusions may be drawn: 579
(a) In the case of two perpendicularly crossing tunnels (one new and one existing), the 580
measured maximum tunnel settlement at P/D of 0.5 was about 50% larger than that at 581
P/D of 2.0. This is attributed to a smaller shear stiffness of soil in the case of P/D of 0.5 582
along the invert of the existing tunnel. The mobilized soil stiffness was the smallest at the 583
location directly above the new tunnel as a result of a reduction in confining stress and an 584
increase in deviatoric strain caused by the new tunnel excavation. The other contributing 585
factor to the larger tunnel settlement at P/D of 0.5 is the stress acting on the tunnel lining 586
at the location directly above the new tunnel. In the test with P/D of 0.5, stress reduction 587
at the invert of the existing tunnel was larger than that in the test with P/D of 2. 588

25 / 29
(b) During the new tunnel excavation, induced tensile strains in the longitudinal direction of 589
the existing tunnel and deduced shear stress on the tunnel lining were larger at P/D of 0.5 590
than at P/D of 2. This is due to the larger differential settlement of the existing tunnel at 591
P/D of 0.5. These induced tensile strain and deduced shear stress at P/D of 0.5 exceeded 592
the cracking tensile strain (ACI, 2001) and allowable shear stress (ACI, 2011), 593
respectively. 594
(c) Different tunnel deformation mechanisms were observed. The existing tunnel was 595
elongated horizontally at P/D of 0.5. This is because stress reduction on the existing 596
tunnel in the horizontal direction was larger than that in the vertical direction. It should 597
be pointed out that stress relief caused by the new tunnel excavation at P/D of 0.5 not 598
only caused a reduction in vertical stress but also it resulted in substantial stress 599
reduction at each springline of the existing tunnel. On the contrary, the existing tunnel 600
was elongated vertically as the new tunnel advanced at P/D of 2, because stress relief 601
was dominated in the vertical direction and it mainly affected the invert of the existing 602
tunnel. 603
(d) In the case of three tunnels (two existing perpendicularly crossing tunnels above a new 604
tunnel), the lower existing tunnel “shielded” the upper existing tunnel from the influence 605
of the advancing new tunnel underneath, such that the measured settlement of the upper 606
existing tunnel was 25% smaller than in the case without the shielding effects (given that 607
P/D of 2 in both cases). This is because the lower existing tunnel reduced the effect of 608
stress reduction and decreased deviatoric strain induced at the invert of the upper existing 609
tunnel. These two effects resulted in a larger mobilized soil stiffness in the case of two 610
existing tunnels than in the case of just one existing tunnel. 611
(e) The lower existing tunnel in the case of three tunnels was elongated vertically due to the 612
new tunnel excavation. This is because the invert of the lower existing tunnel was closest 613

26 / 29
to each section to be excavated of the new tunnel, resulting in a substantial decrease in 614
stress in the vertical direction on the lower existing tunnel. 615
616
ACKNOWLEDGEMENTS 617
The authors would like to acknowledge financial support from the Research Grants 618
Council of the HKSAR (General Research Fund project no. 617410) and would also like to 619
thank Kelly Lim for her assistance in making the “donuts” for the centrifuge model tests. 620
621
REFERENCES 622
Addenbrooke, T. I. and Potts, D. M. (2001). Twin tunnel interaction: Surface and subsurface 623
effects. The international journal of geomechanics, 1 (2): 249-271. 624
ACI (2001). Control of cracking in concrete structures (ACI 224R-01). American Concrete 625
Institute (ACI). M.I. 626
ACI (2011). Building code requirements for structural concrete and commentary (ACI 318M-627
11). American Concrete Institute (ACI). M.I. 628
BD (2009). Practice note for authorized persons APP-24. Technical notes for guidance in 629
assessing the effects of civil engineering construction / building development on 630
railway structures and operations. Building department of the government of HKSAR 631
(BD). 632
Brinkgreve, R. B. J., Engin, E. and Swolfs, W. M. (2012). PLAXIS 3D 2012 User manual. 633
Plaxis BV, Delft. 634
BTS (2000). Specification for tunnelling. British Tunnelling Society (BTS). Thomas Telford, 635
London. 636

27 / 29
Cooper, M. L., Chapman, D. N., Rogers, C. D. F. and Chan, A. H. C. (2002). Movements in 637
the Piccadilly Line tunnels due to the Heathrow Express construction. Géotechnique, 52 638
(4): 243-257. 639
Garnier, J. (2001). Physical models in geotechnics: state of the art and recent advances. First 640
Coulomb Lecture, Paris, 3 October. CFMS (eds) 641
Garnier, J., Gaudin, C., Springman, S. M., Culligan, P. J., Goodings, D. König, D., Kutter, B., 642
Phillips, R., Randolph, M. F. and Thorel, L. (2007). Catalogue of scaling laws and 643
similitude questions in geotechnical centrifuge modelling. IJPMG-International 644
Journal of Physical Modelling in Geotechnics 3: 1-23. 645
Gudehus, G., Amorosi, A., Gens, A., Herle, I., Kolymbas, D., Mašín, D., Muir Wood, D., 646
Nova, R., Niemunis, A., Pastor, M., Tamagnini, C. and Viggiani, G. (2008). The 647
soilmodels.info project. International Journal for Numerical and Analytical Methods in 648
Geomechanics 32 (12): 1571-1572. 649
Gudehus, G. and Mašín, D. (2009). Graphical representation of constitutive equations. 650
Géotechnique 59 (2): 147–151. 651
Herle, I. and Gudehus, G. (1999). Determination of parameters of a hypoplastic constitutive 652
model from properties of grain assemblies. Mechanics of cohesive-frictional materials 653
4: 461-486. 654
Hight, D. W., Gasparre, A., Nishimura, S., Minh, N. A., Jardine, R. J. and Coop, M. R. 655
(2007). Characteristics of the London Clay from the Terminal 5 site at Heathrow 656
Airport. Géotechnique 57 (1): 3–18. 657
Ishihara, K. (1993). Liquefaction and flow failure during earthquakes. Géotechnique, 43 (3): 658
351-415. 659
Jacobsz, S.W., Standing, J.R., Mair, R.J., Hagiwara, T., and Sugiyama, T. (2004). Centrifuge 660
modelling of tunnelling near driven piles. Soils Found., 44(1): 49–56. 661

28 / 29
Kim, S. H., Burd, H. J. and Milligan, G. W. E. (1998). Model testing of closely spaced 662
tunnels in clay. Géotechnique, 48 (3): 375-388. 663
Klar, A., Vorster, T. E. B., Soga K. and Mair, R. J. (2005). Soil–pipe interaction due to 664
tunnelling: comparison between Winkler and elastic continuum solutions. 665
Géotechnique, 55(6): 461–466 666
LTA (2000). Code of practice for railway protection. Development and Building Control 667
Department, Land Transport Authority (LTA), Singapore. 668
Mair, R. J. and Taylor, R. N. (1997). Theme lecture: Bored tunnelling in the urban 669
environment. Proc. 14th International Conference in Soil Mechanics and Foundation 670
Engineering, Hamburg, Balkema, pp. 2353-2385. 671
Marshall, A. M., Klar, A. and Mair, R. J. (2010). Tunnelling beneath buried pipes: view of 672
soil strain and its effect on pipeline behaviour. J. Geotech. Geoenviron. Engng., 136 673
(12): 1664–1672. 674
Marshall, A.M., Farrell, R., Klar, A., and Mair, R. (2012). Tunnels in sands: the effect of size, 675
depth and volume loss on greenfield displacements. Géotechnique, 62(5): 385–399. 676
Mašín, D. (2009). 3D modelling of a NATM tunnel in high K0 clay using two different 677
constitutive models. J. Geotech. Geoenviron. Engng., 135( 9): 1326-1335. 678
Mašín, D. (2012). Hypoplastic Cam-clay model. Géotechnique, 62 (6): 549–553. 679
Mohamad, H., Bennett, P. J., Soga K., Mair R. J. and Bowers, K. (2010). Behaviour of an old 680
masonry tunnel due to tunnelling-induced ground settlement. Géotechnique, 60 (12): 681
927–938. 682
Ng, C. W. W. and Lee, G. K. T. (2005). Three-dimensional ground settlements and stress 683
transfer mechanisms due to open-face tunnelling. Can. Geotech. J. 42: 1015–1029. 684

29 / 29
Ng, C. W. W., Van Laak, P. Tang, W. H., Li, X. S. and Zhang, L. M. (2001). The Hong Kong 685
Geotechnical Centrifuge. Proc. 3rd Int. Conf. Soft Soil Engineering, Dec., Hong Kong. 686
pp. 225-230. 687
Ng, C. W. W., Van Laak, P. A., Zhang, L. M., Tang, W. H., Zong, G. H., Wang, Z. L., Xu, G. 688
M. and Liu, S. H. (2002). Development of a four-axis robotic manipulator for 689
centrifuge modelling at HKUST. Proc. Int. Conf. on Physical Modelling in 690
Geotechnics, St. John’s Newfoundland, Canada, pp. 71-76. 691
Ng, C. W. W., Boonyarak, T. and Mašín, D. (2013). Three-dimensional centrifuge and 692
numerical modeling of the interaction between perpendicularly crossing tunnels. Can. 693
Geotech. J., 50 (9): 935-946. 694
Niemunis, A. and Herle, I. (1997). Hypoplastic model for cohesionless soils with elastic 695
strain range. Mechanics of cohesive-frictional materials, 2: 279-299. 696
Svoboda, T., Mašín, D. and Boháč, J. (2010). Class A predictions of a NATM tunnel in stiff 697
clay. Computers and Geotechnics, 37(6): 817-825. 698
Taylor, R. N. (1995). Geotechnical Centrifuge Technology. Blackie Academic and 699
Professional, London. 700
Todd, C. D. (1975). The potentiometer handbook. McGraw-Hill, New York. 701
von Wolffersdorff, P. A. (1996). A hypoplastic relation for granular materials with a 702
predefined limit state surface. Mechanics of cohesive-frictional materials, 1: 251-271. 703
Yamashita, S., Jamiolkowski, M. and Lo Presti, D.C.F. (2000). Stiffness nonlinearity of three 704
sands. J. Geotech. Geoenviron. Engng., 126 (10): 929-938. 705
Yamashita, S., Kawaguchi, T., Nakata, Y., Mikami, T., Fujiwara, T. and Shibuya, S. (2009). 706
Interpretation of international parallel test on the measurement of Gmax using bender 707
elements. Soils Found. 49 (4): 631–650. 708

1 / 1
Table 1 Summary of material parameters adopted in finite element analyses
Note: (a) Adopted from Herle and Gudehus (1999) (b) Calibrated from triaxial test results for Toyoura sand (Yamashita et al., 2000, 2009)
Critical state friction angle(a),c
30
Granulates hardness(a), hs 2.6 GPa
Exponent n(a), n 0.27
Minimum void ratio at zero pressure(a), edo
0.61
Critical void ratio at zero pressure(a), eco
0.98
Maximum void ratio at zero pressure(a), eio
1.10
Exponent (b) 0.5
Exponent (b) 3
Parameter controlling the initial shear modulus upon a 180 strain path reversal and in the initial loading(b), m
R
8
Parameter controlling the initial shear modulus upon a 90 strain path reversal(b), m
T
4
The size of the elastic range(b), R 0.00003
Parameter controlling the rate of degradation of stiffness with strain(b)
r
0.2
Parameter controlling the rate of degradation of stiffness with strain(b)
1.0
The coefficient of at-rest earth pressure, K0 0.5

1 / 11
Figure 1 Schematic diagrams showing a centrifuge model package for simulating the interaction between perpendicularly crossing tunnels: (a) a typical plan view and (b) an elevation view of Test E2N3; (c) an elevation view of Test E2N5 and (d) an elevation view of Test E2,3N5
Note: Dimension in mm (model scale)
(a) (b)
(c) (d)
E2N3
E2N5 E2,3N5
123456
0.6D
Tunneladvancingsequence
Existing tunnel
New tunnel
New tunnel
Dia. 100 mm(6.0 m @ 60g)
Dia. 100 mm(6.0 m @ 60g)
Upper existing tunnel
1250
C = 200
P = 200(P/D = 2)
(C/D = 2)
LVDT
930
750Lower existingtunnel
New tunnel
Existing tunnel
LVDT
750
LVDT
New tunnel
Existing tunnel
C = 200
P = 50(P/D = 0.5)
(C/D = 2)
750Extension rod
X
Y
Z
X
Z
X
Z
X
ReservoirValves
Drainage tubes for heavy fluid
for LVDT
Extension rodfor LVDT
Extension rodfor LVDT

2 / 11
(b)
Figure 2 (a) Tunnel advancing sequence in a centrifuge test; (b) a “donut” for simulating the effects of volume loss and weight loss during tunnel excavation
(a)
1 2 3 4 5 6
Tunnel advancing sequence New
tunnel
See Fig. 2b
0.6D (3.6 m in prototype scale)
Outer diameter = 100 mm Thickness = 3 mm
Heavy fluid(ZnCl ) filledin rubbermembrane
Outer rubbermembrane (control ofvolume loss,V = 2%)
Aluminumalloy tube(Tunnel lining)
Inner rubbermembrane(control ofweight loss,W )
WLV L
L
L
2

3 / 11
(b)
(c)
(a)
Figure 3 (a) Instruments installed at the existing tunnel; (b) transverse section view; (c) longitudinal section view
New tunnel advancing direction Existing tunnel
LVDT
extension rod
See Fig. 3c
See Fig. 3b
New tunnel
Upper existing tunnel
LVDT
Lower existingtunnel
New tunnel
Existing tunnel
LVDT
LVDT
New tunnel
Existing tunnel
Z
X
E2N3
E2N5
E2,3N5
4D
3D3D
3D3D
Strain gages in transverse direction of the existing tunnel at 45 spacing
Potentiometer
Strain gages in longitudinal direction of the existing tunnel at 50 mm spacing
Potentiometer
Strain gages in transverse direction of the existing tunnel
Frame for potentiometer
3D 2D
Plate for potentiometer

4 / 11
(a)
(b)
Figure 4 (a) Three-dimensional finite element mesh for case E2N3; (b) some details of the perpendicularly crossing tunnels
XYZ
Existing tunnel =100
New tunnel =100
P/D = 0.5
New tunnel centerline (Plane of symmetry, X/D = 0)
Existing tunnel
New tunnel
Plane of symmetry (X/D = 0)
930 625
750
XYZ
Note: Dimension in mm (model scale)
5 / 11
Figure 5 Comparisons of settlements of the existing tunnel and subsurface settlements in greenfield conditions
Note: In Test E2,3N5, results are shown for the upper existing tunnel only
New tunnel
Existing tunnel
New tunnel
Upper existing tunnel
New tunnel
Existing tunnel
existing tunnel
E2N3 E2,3N5E2N5
X
Z
X
Z
X
Z
Lower
New tunnel
New tunnel
N3 N5
X
Z
X
Z
Depth of subsurface settlement considered
0.0
0.1
0.2
0.3
0.4
0.5
-6 -5 -4 -3 -2 -1 0 1 2 3 4 5 6
Nor
mal
ized
sett
lem
ent
(/D
, %)
Normalized offset distance from centerline of the new tunnel (X/D)
Measured [E2N3] Computed [E2N3]Measured [E2N5] Computed [E2N5]Measured [E2,3N5] Computed [E2,3N5]15mm Computed [N3]20mm Computed [N5]
15 mm (LTA, 2000)
20 mm (BD, 2009)
Max. induced tunnel gradient
E2N3 = 1:1600 E2N5 = 1:2700E2,3N5 = 1:2800
Greenfield

6 / 11
Figure 6 Computed normalized stiffnesses of soil (Gafter / Gbefore) along the invert of the existing tunnel
0.0
0.2
0.4
0.6
0.8
1.0
1.2
0 1 2 3 4 5 6
Nor
mal
ized
shea
r m
odu
lus,
G
afte
r/Gb
efor
e
Normalized longitudinal distance along invert of existing tunnel (X/D)
E2N3
E2N5
E2,3N5New tunnel
Existing tunnel
New tunnel
Upper existing tunnel
New tunnel
Existing tunnel
existing tunnel
E2N3 E2,3N5E2N5
X
Z
X
Z
X
Z
Lower
Note: In Test E2,3N5, results are shown for the upper existing tunnel only

7 / 11
Sign convention + Induced tensile strain - Induced compressive strain
Figure 7 Induced strains in the longitudinal direction of the existing tunnel
New tunnel
Existing tunnel
New tunnel
Upper existing tunnel
New tunnel
Existing tunnel
existing tunnel
E2N3 E2,3N5E2N5
X
Z
X
Z
X
Z
Lower
Note: In Test E2,3N5, results are shown for the upper existing tunnel only
-100
-50
0
50
100
150
200
-6 -5 -4 -3 -2 -1 0 1 2 3 4 5 6
Ind
uce
d st
rain
()
Normalized longitudinal distance along existing tunnel (X/D)
Measured [E2N3] Computed [E2N3]Measured [E2N5] Computed [E2N5]Measured [E2,3N5] Computed [E2,3N5]
Deduced Vmax(kPa) from measured and computed strain = 780, 690 [E2N3]= 510, 560 [E2N5]= 330, 375 [E2,3N5]
Vallow (kPa)= 660 (ACI, 2011)
t, crack of unreinforced concrete (ACI, 2001)

8 / 11
(a) (b)
(c) (d)
Sign convention + Induced tensile strain - Induced compressive strain
Figure 8 Comparisons of strains induced on the outer surface of the existing tunnel in the transverse direction in Tests (a) E2N3; (b) E2N5; (c) E2,3N5 upper tunnel; (d) E2,3N5 lower tunnel
New tunnel
tunnel
New tunnelNew tunnel
E2N3 E2,3N5E2N5
Y
Z
Y
Z
Y
Z
Upper existing
tunnelLower existing
tunnelExisting
tunnelExisting
Y/D 0.30.9
1.5
Y/D 0.30.9
1.5 Y/D 0.30.9
1.5
-200
-150
-100
-50
0
50
100Crown
R-shoulder
R-springline
R-knee
Invert
L-knee
L-springline
L-shoulder
Measured [0.3] Computed [0.3]Measured [0.9] Computed [0.9]Measured [1.5] Computed [1.5]
Induced strain ()
Initial
Location of new tunnel face [Y/D]
-200
-150
-100
-50
0
50
100Crown
R-shoulder
R-springline
R-knee
Invert
L-knee
L-springline
L-shoulder
Measured [0.3] Computed [0.3]Measured [0.9] Computed [0.9]Measured [1.5] Computed [1.5]
Induced strain ()
Initial
Location of new tunnel face [Y/D]
-200
-150
-100
-50
0
50
100Crown
R-shoulder
R-springline
R-knee
Invert
L-knee
L-springline
L-shoulder
Measured [0.3] Computed [0.3]Measured [0.9] Computed [0.9]Measured [1.5] Computed [1.5]
Induced strain ()
Initial
Location of new tunnel face (Y/D)
-200
-150
-100
-50
0
50
100Crown
R-shoulder
R-springline
R-knee
Invert
L-knee
L-springline
L-shoulder
Measured [0.3] Computed [0.3]Measured [0.9] Computed [0.9]Measured [1.5] Computed [1.5]
Induced strain ()
Initial
Location of new tunnel face (Y/D)

9 / 11
(a)
(b)
Figure 9 Deformations of the existing tunnel in (a) the vertical direction; (b) the horizontal direction
-0.2
-0.1
0.0
0.1
0.2
0.0 0.5 1.0 1.5 2.0
Ch
ange
of n
orm
aliz
ed v
erti
cal
tun
nel
dia
met
er (
DV/D
0, %
)
Pillar depth-to-diameter ratio (P/D)Measured [E2N3] Computed [E2N3]Measured [E2N5] Computed [E2N5]Measured [E2,3N5 UpperTunnel] Computed [E2,3N5 UpperTunnel]Measured [E2,3N5 LowerTunnel] Computed [E2,3N5 LowerTunnel]
-0.2
-0.1
0.0
0.1
0.2
0.0 0.5 1.0 1.5 2.0Ch
ange
of n
orm
aliz
ed h
oriz
onta
l tu
nn
el d
iam
eter
(D
H/D
0, %
)
Pillar depth-to-diameter ratio (P/D)Measured [E2N3] Computed [E2N3]Measured [E2N5] Computed [E2N5]Measured [E2,3N5 UpperTunnel] Computed [E2,3N5 UpperTunnel]Measured [E2,3N5 LowerTunnel] Computed [E2,3N5 LowerTunnel]
Sign convention + Tunnel diameter elongation - Tunnel diameter reduction
New tunnel
tunnel
New tunnelNew tunnel
E2N3 E2,3N5E2N5
Y
Z
Y
Z
Y
Z
Upper existing
tunnelLower existing
tunnelExisting
tunnelExisting
Sign convention + Tunnel diameter elongation - Tunnel diameter reduction
DV
DH

10 / 11
(a) (b)
(c) (d)
Sign convention for + Increase in normal stress - Decrease in normal stress
Figure 10 Computed incremental normal stresses of the existing tunnel in cases (a) E2N3; (b) E2N5; (c) E2,3N5 upper tunnel; (d) E2,3N5 lower tunnel
-250
-200
-150
-100
-50
0
50
100
150
-1.5 -1.0 -0.5 0.0 0.5 1.0 1.5
Normalized location of advancing tunnel face (Y/D)
Crown
L-Springline
R-Springline
Invert
Incr
emen
tal n
orm
al st
ress
,
n(k
Pa)
= ± 20 kPa (BD, 2009)
New tunnel
tunnel
New tunnelNew tunnel
E2N3 E2,3N5E2N5
Y
Z
Y
Z
Y
Z
Upper existing
tunnelLower existing
tunnelExisting
tunnelExisting
Y/D 0.3 1.5
Y/D 0.3 1.5 Y/D 0.3 1.5
1.5
1.5 1.5
-250
-200
-150
-100
-50
0
50
100
150
-1.5 -1.0 -0.5 0.0 0.5 1.0 1.5
Normalized location of advancing tunnel face (Y/D)
Crown
L-Springline
R-Springline
Invert
Incr
emen
tal n
orm
al st
ress
,
n(k
Pa)
= ± 20 kPa (BD, 2009)
-250
-200
-150
-100
-50
0
50
100
150
-1.5 -1.0 -0.5 0.0 0.5 1.0 1.5
Normalized location of advancing tunnel face (Y/D)
Crown
L & R-Springline
Invert
Incr
emen
tal n
orm
al st
ress
,
n(k
Pa)
= ± 20 kPa (BD, 2009)
-250
-200
-150
-100
-50
0
50
100
150
-1.5 -1.0 -0.5 0.0 0.5 1.0 1.5
Normalized location of advancing tunnel face (Y/D)
Crown
L-Springline
R-Springline
Invert
Incr
emen
tal n
orm
al st
ress
,
n(k
Pa)
= ± 20 kPa (BD, 2009)

11 / 11
(c)
(a) (b)
Sign convention + Increase in deviatoric strain - Decrease in deviatoric strain
Figure 11 Contours of computed deviatoric strains induced by new tunnel excavation in cases (a) E2N3; (b) E2N5; (c) E2,3N5
Existing tunnel
Upper existing tunnel
New tunnel
New tunnel
Lower existing tunnel
Existing tunnel
New tunnel