effects of mev proton and - nasa · effects of 22 mev proton and 2.4 mev electron radiation on...
TRANSCRIPT

NASA TECHNICAL NOTE
AFWL ( W LI L-2. KJRTLAND AFB, N M E X
EFFECTS OF 22 MeV PROTON A N D 2.4 MeV ELECTRON RADIATION ON
SILICON SOLAR CELLS BORON- A N D ALUMINUM-DOPED
by Gilbert A. Huynes und Wulter E. Ellis
Langley Reseurch Center Langley Stution, Humpton, Vu.
N A T I O N A L AERONAUTICS A N D SPACE A D M I N I S T R A T I O N W A S H I N G T O N , D. C. A P R I L 1968
https://ntrs.nasa.gov/search.jsp?R=19680010455 2018-11-30T05:02:21+00:00Z

TECH LIBRARY KAFB, NM
I llllll Ill11 lllll11111 Ill1 #Ill lllll Ill1 Ill
E F F E C T S O F 22 MeV P R O T O N A N D 2.4 MeV E L E C T R O N RADIATION
ON BORON- AND ALUMINUM-DOPED SILICON SOLAR C E L L S
By G i l b e r t A. Haynes and W a l t e r E. E l l i s
Langley R e s e a r c h C e n t e r
Langley Station, Hampton , Va.
NATIONAL AERONAUT ICs AND SPACE ADMIN ISTRATION . .. -
For sa le by the Clearinghouse for Federal Scientific and Technical Information Springfield, Virginia 22151 - CFSTI price $3.00

EFFECTS OF 22 MeV PROTON AND 2.4 MeV ELECTRON RADIATION
ON BORON- AND ALUMINUM-DOPED SILICON SOLAR CELLS
By Gilbert A. Haynes and Walter E. Ellis Langley Research Center
SUMMARY
A comparative analysis is presented of the effects of proton and electron irradia- tion on the electrical properties of boron-doped and aluminum-doped, N on P, silicon solar cells having base resistivities of 1 ohm-cm and 10 ohm-cm. ments were made before and after irradiation at various flux levels up to 2.1 X 10l2 protons per square centimeter at 22 MeV, and 1.0 X 10l6 electrons pe r square centi- meter at 2.4 MeV.
Electrical measure-
Measurements of short-circuit current and maximum power under illumination with a tungsten light source and a solar simulator indicate that 1 ohm-cm aluminum-doped cells are slightly more resistant to damage by 2.4 MeV electrons than 1 ohm-cm boron- doped cells; however, 10 ohm-cm boron-doped cells w e r e found to be more resistant to electron damage than 10 ohm-cm aluminum-doped cells. significant difference w a s observed in the radiation resistance of boron-doped and aluminum-doped cells with the same base resistivity.
Under proton irradiation no
Spectral response measurements made before and after irradiation indicated no significant difference due to the type of doping element employed. response curves, conversion factors were computed for use in predicting the output of solar cells in space sunlight f rom direct measurements under tungsten light o r the solar si mu1 ator.
From these spectral
Within the range f rom 32O C to 71' C, the temperature coefficients of the various parameters changed with irradiation. coefficients was noted between the boron-doped and aluminum-doped cells having the same base resistivity.
However, no significant difference in temperature
INTRODUCTION
Considerable effort has been expended during the past few yea r s to enhance the performance of silicon solar cells fo r use as energy-conversion devices in power systems for space applications. These efforts have resulted in a number of improvements over

the original P on N solar cell - f o r example, higher conversion efficiencies and extended useful lifetime in the space environment. have greatly improved resistance to damage f rom high-energy particulate radiation (refs. 1, 2, and 3). This resistance was further enhanced by increasing the resistivity of the base material. I t has been established that the optimum resistivity of the base material without appreciable sacrifice in efficiency is 10 to 20 ohm-cm (ref. 4). high-resistivity cells were found to be superior i n power output to the 1 ohm-cm cell after irradiation a t temperatures up to looo C (ref. 4).
The more recently developed N on P cells
These
In reference 5, data have been presented which suggest that a relationship exists between the doping element used as an acceptor or donor in the base region of silicon solar cells and the changes in diffusion length observed after irradiation. Aluminum- doped cells were reported to have a longer diffusion length than boron-doped cells after irradiation with 1.0 MeV electrons, and therefore would be expected to have higher power output.
A sample quantity of aluminum-doped cells with base, resistivities of 1 ohm-cm and 10 ohm-cm were obtained, and experiments were conducted to study the effects of proton and electron irradiation on the electrical parameters of pr imary interest to designers of spacecraft power systems. These parameters are short-circuit current, maximum power, open-circuit voltage, and load current at specific voltages. comparison, boron-doped cells with the same base resistivities were irradiated and tested simultaneously with the aluminum-doped cells.
To provide a reference for
The criterion of most importance to the designer of solar-cell power systems for use in space is the amount of power that can be delivered into a specific combination of loads under the radiation and temperature conditions encountered during a defined mission. It has been established (ref. 6) that the power degradation of the cells due to radiation cannot be determined with any reasonable degree of accuracy by the use of any single parameter such as diffusion length o r short-circuit current. of a power system can be achieved by operating a t the point of maximum power. Unfor- tunately, the point of maximum power changes with radiation and temperature, and when the load is changed from optimum, the cell no longer operates at maximum power. Num- erous methods of loading solar cells are actually employed, depending on the mission requirements and on the power conditioning techniques used. effects of radiation on solar cells, i t is necessary to obtain output data at a variety of cell loads and temperatures.
Ideally, the highest efficiency
Hence, in studying the
2

C
e
fsu/sim
fsu/W
IL
Is,
Pmax
P
voc
@C
SYMBOLS
temperature coefficient
number of electrons
ratio of the cell output f rom space sunlight to the cell output from the solar -simulator illumination
ratio of the cell output f rom space sunlight to the cell output from tungsten illumination
load current
short -circuit current
maximum power
number of protons
open-circuit voltage
critical flux, defined as the flux required to cause 25-percent degradation of the parameter under investigation
EXPERIMENTAL EQUIPMENT AND PROCEDURE
Description of Cells
The aluminum-doped and boron-doped cells used in these experiments were obtained from the same manufacturer and were made by the same basic fabrication techniques. The boron-doped cells were representative of the cells currently being used in space- craft power systems. Al l of the cells were N on P type, 1 cm by 2 cm, with nominal efficiencies of 10 percent fo r zero-air-mass sun illumination. evaporated, or sintered, type with five grids on the top surface. type were acquired, and no attempt was made to match cells in each group. the variation in output of the cells in each group w a s small, being l e s s than short-circuit current. ment are shown in table I. material.
The contacts were of the Only a few cells of each
percent at However,
The four types of cells and the number employed in each experi- The resistivity listed for each group is that of the base
The solar cells were cemented to 1/8-inch-thick (0.318-cm) anodized
3

aluminum s t r ips with silicone rubber adhesive to simulate the mounting techniques employed on spacecraft solar-cell a r r ays (fig. 1). These aluminum s t r ips served as heat sinks to assure good temperature stability during irradiation and illumination tests and to enable handling without danger of contamination or breakage of the solar cells.
Number of cells
22 MeV protons a l a r -cell type irradiated with Resistivity,
ohm-cm
1 ohm-cm boron 1.5 to 3.0 a 1 ohm-cm aluminum 1.5 to 3.0 8 10 ohm-cm boron 8 to 10 a 10 ohm-cm aluminum a to i o 8
TABLE I
Number of cells irradiated with
2.4 MeV electrons 4 4 4 4
TYPE AND NUMBER OF SOLAR CELLS IRRADIATED IN EACH EXPERIMENT
Solar -Cell Characteristic Measurements
The electrical output characterist ics of the cells under illumination with both a tungsten light source and a commercial solar simulator were measured before and after irradiation. A simplified sketch of the test setup is shown in figure 2. The tungsten light source w a s an unfiltered photoflood lamp, operated at a black-body temperature of 280Oo*2O0 K. voltage necessary to produce this black-body temperature. within k0.4 percent. lamp with a well-regulated input current. The light emitted by the lamp was filtered so that the resulting spectral irradiance approximated that of space sunlight over the spec- t r a l response range of silicon solar cells.
A two-color optical pyrometer w a s used periodically to ascertain the lamp This voltage was regulated
The commercial solar simulator was basically a xenon short-arc
The light intensity at the test plane under each light source w a s adjusted s o that the short-circuit current output of two calibrated unirradiated silicon solar cells would be the same as that in space sunlight at 1 AU (1 astronomical unit is defined as the mean distance from the earth to the sun, 149 599 000 km). The current output in space sun- light of one of the cells had been determined by tests on Table Mountain in California, and the other had been similarly calibrated by aircraft flight tests a t the NASA Lewis Research Center (ref. 7). A third reference cell, mounted on an anodized strip in the same manner as the cells that were irradiated, was included in all tests to monitor the intensity of each light source and to check the repeatability of the instruments used to measure electrical characteristics. The repeatability, including stability of the light intensity, was found to be better than 1 percent. 4
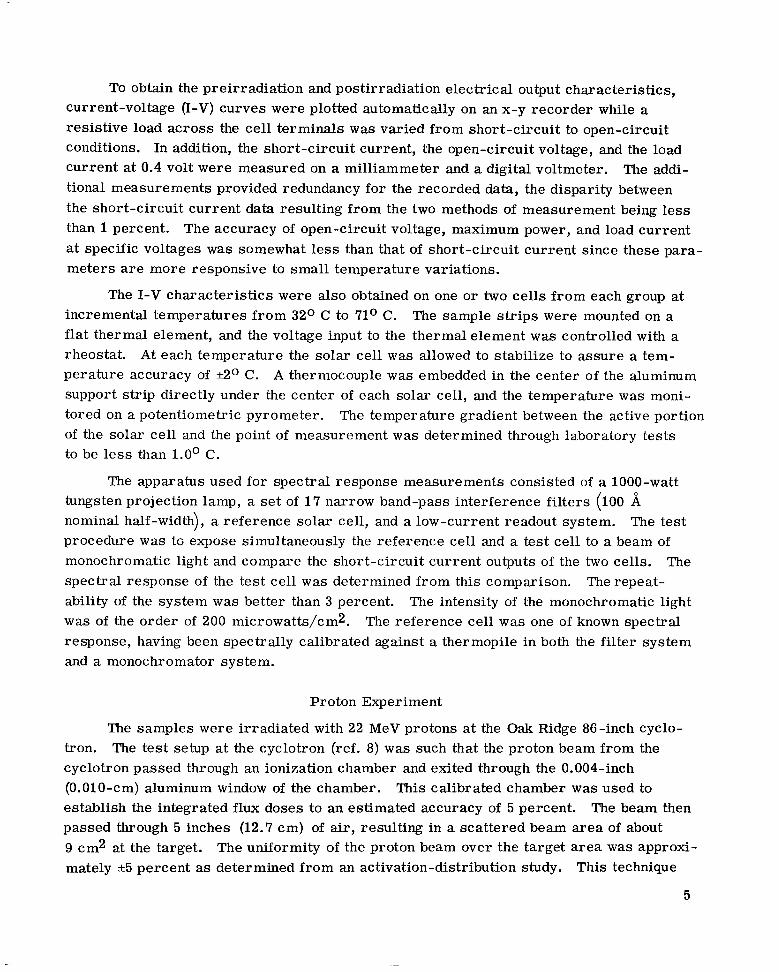
To obtain the preirradiation and postirradiation electrical output characteristics, current-voltage (I-V) curves were plotted automatically on an x-y recorder while a resistive load across the cell terminals w a s varied from short-circuit to open-circuit conditions. In addition, the short-circuit current, the open-circuit voltage, and the load current at 0.4 volt were measured on a milliammeter and a digital voltmeter. The addi- tional measurements provided redundancy for the recorded data, the disparity between the short-circuit current data resulting from the two methods of measurement being less than 1 percent. The accuracy of open-circuit voltage, maximum power, and load current at specific voltages was somewhat less than that of short-circuit current since these para meters are more responsive to small temperature variations.
The I-V characterist ics were also obtained on one or two cells f rom each group at incremental temperatures f rom 32O C to 71° C. The sample s t r ips were mounted on a flat thermal element, and the voltage input to the thermal element w a s controlled with a rheostat. At each temperature the solar cell w a s allowed to stabilize to assure a tem- perature accuracy of eo C. A thermocouple w a s embedded in the center of the aluminum support str ip directly under the center of each solar cell, and the temperature w a s moni- tored on a potentiometric pyrometer. of the solar cell and the point of measurement w a s determined through laboratory tests to be less than 1.0' C.
The temperature gradient between the active portion
The apparatus used for spectral response measurements consisted of a 1000-watt tungsten projection lamp, a set of 17 narrow band-pass interference filters (100 nominal half-width), a reference solar cell, and a low-current readout system. procedure w a s t G expose simultaneously the reference cell and a test cell to a beam of monochromatic light and compare the short-circuit current outputs of the two cells. The spectral response of the test cell w a s determined from this comparison. ability of the system was better than 3 percent. The intensity of the monochromatic light w a s of the order of 200 microwatts/cma. response, having been spectrally calibrated against a thermopile in both the filter system and a monochromator system.
The test
The repeat-
The reference cell w a s one of known spectral
Proton Experiment
The samples were irradiated with 22 MeV protons at the Oak Ridge 86-inch cyclo- The test setup at the cyclotron (ref. 8) w a s such that the proton beam from the tron.
cyclotron passed through an ionization chamber and exited through the 0.004-inch (0.010-cm) aluminum window of the chamber. establish the integrated flux doses to an estimated accuracy of 5 percent. passed through 5 inches (12.7 cm) of air, resulting in a scattered beam area of about 9 cm2 at the target. mately *5 percent as determined f rom an activation-distribution study.
This calibrated chamber was used to The beam then
The uniformity of the proton beam over the target area was approxi- This technique
5

consisted of placing a number of tantalum foil disks, 1/4 inch (0.635 cm) in diameter, on 1-cm centers i n the 00 position of the proton beam. The foil was then irradiated, and the isotope production for each disk was subsequently determined by gamma-ray spectrum analyses.
The small s ize of the test area necessitated the irradiation of one cell at a time. The cells were mounted on two remotely controlled aluminum wheels, which allowed accurate positioning of each cell i n the beam. Two of the 20 positions of the wheel con- tained pieces of polyvinyl chloride film for monitoring the position, size, and shape of the beam. Test samples were mounted on the wheel as shown in figure 3. The eight cells (table I) of each of the four groups were irradiated to the integrated fluxes listed in table II. With the beam controls provided, the values of total integrated flux could not be precisely repeated. The flux rate was approximately 5 X 10⁸ p/cma-sec. The tempera- ture of the solar cells during irradiation was maintained between 29O C and 320 C by forced-air cooling.
TABLE I1
INTEGRATED FLUX RECEIVED BY SOLAR CELLS
IRRADIATED WITH 22 MeV PROTONS
Cell no.
1-B-7 1-B-3 1-B-6 1-B-8
“1-B-1 1-B-5 1-B-4
al-B-2
~.
Integrated flux,
P/Cm2 ~ _.
1.23 X 1O1O 1.31 X 1O1O 1.75 X 10l1 1.82 X 10l1 1.51 X 10l2 1.59 X 10l2 1.65 X 10¹² 1.79 X 10l2 I
Cell no.
1 -A-4 1 -A-2 1-A-5 1-A-7 1-A-8 1-A-6
‘1-A-1 1 -A-3
Integrated flux,
P/cm2
1.23 X 1O1O 1.24 X 1O1O 1.56 X 10l1 1.69 X 10l1 1.75 X 10 l2 1.86 X 10 l2 1.87 X 10 l2 1.92 X 10 l2
Cell no.
10-B-7 10-B-5 10-B-4 10-B-1 10-B-8 10-B-3 ’10-B-2 10-B-6
~
-
Integrated flux,
1.27 x 101o
1.69 x 10l1 1.75 x 10l1
- P/Cm2 .._ -
1.29 X 101o
1.87 X 10 l2
1.93 X 10¹² 1.91 x 10¹²
2.08 x 10¹² . - . __ - -
Cell no.
_.
10-A-3 10-A-2 10-A-8 10-A-6 10-A-5 10-A-7
’10-A-1 10-A-4
Integrated flux,
1.20 x 10¹⁰ 1.21 x 10¹⁰
1.99 x 10¹¹
p/cm2 ...- . ~ . .
1.8 x 10¹¹
1.47 x 10l2 1.47 X 10l2 1.52 x 10¹² 1.54 x 10l2
aSolar cells used in temperature tests.
At the cyclotron site, I-V characteristics were measured at 320 C under tungsten illumination for all cells in each group prior to bombardment and after each of the three exposures. The t ime interval between termination of irradiation a t each integrated flux and the start of measurements under the light source varied from 15 to 30 minutes for the first exposure to a maximum of approximately 8 hours for the final exposure. Two 1
6
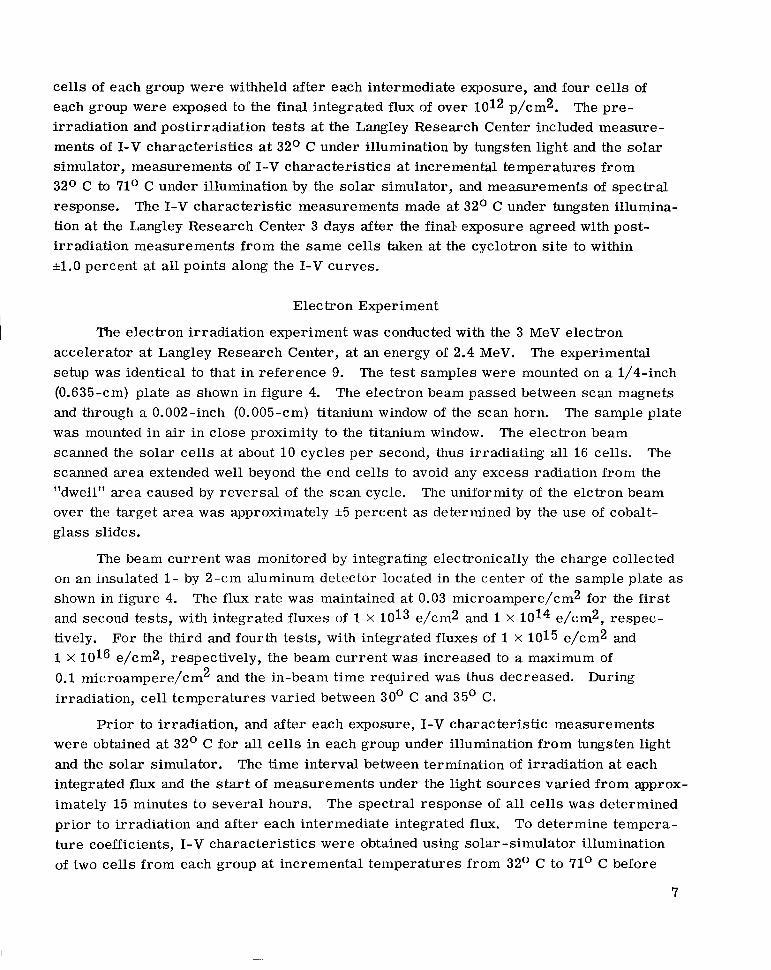
cells of each group were withheld after each intermediate exposure, and four cells of each group were exposed to the final integrated flux of over 1012 p/cm2. irradiation and postirradiation tests at the Langley Research Center included measure- ments of I-V characterist ics at 32O C under illumination by tungsten light and the solar simulator, measurements of I-V characteristics at incremental temperatures from 32O C to 71° C under illumination by the solar simulator, and measurements of spectral response. tion at the Langley Research Center 3 days after the f i n d exposure agreed with post- irradiation measurements f rom the same cells taken at the cyclotron site to within * l . O percent at all points along the I-V curves.
The pre-
The I-V characteristic measurements made at 32O C under tungsten illumina-
Electron Experiment
The electron irradiation experiment w a s conducted with the 3 MeV electron accelerator at Langley Research Center, at an energy of 2.4 MeV. setup w a s identical to that in reference 9. (0.635-cm) plate as shown in figure 4. and through a 0.002-inch (0.005-cm) titanium window of the scan horn. w a s mounted in air in close proximity to the titanium window. The electron beam scanned the solar cells at about 10 cycles pe r second, thus irradiating all 16 cells. scanned area extended wel l beyond the end cells to avoid any excess radiation from the "dwell" area caused by reversal of the scan cycle. The uniformity of the elctron beam over the target area was approximately *5 percent as determined by the use of cobalt- glass slides.
The experimental The test samples were mounted on a 1/4-inch
The electron beam passed between scan magnets The sample plate
The
The beam current was monitored by integrating electronically the charge collected
The flux rate w a s maintained at 0.03 microampere/cm2 for the first on an insulated 1- by 2-cm aluminum detector located in the center of the sample plate as shown in figure 4. and second tests, with integrated fluxes of 1 X 10¹³ e/cm2 and 1 X 10¹⁴ e/cm2, respec- tively. 1 X 10l6 e/cm2, respectively, the beam current w a s increased to a maximum of 0.1 microampere/cm2 and the in-beam time required was thus decreased. irradiation, cell temperatures varied between 30' C and 35' C.
For the third and fourth tests, with integrated fluxes of 1 X 10¹⁵ e/cm2 and
During
Prior to irradiation, and after each exposure, I-V characteristic measurements
The time interval between termination of irradiation at each were obtained at 32' C for all cells in each group under illumination from tungsten light and the solar simulator. integrated flux and the start of measurements under the light sources varied from approx- imately 15 minutes to several hours. prior to irradiation and after each intermediate integrated flux. ture coefficients, I-V characterist ics were obtained using solar -simulator illumination of two cells f rom each group at incremental temperatures from 32O C to 71° C before
The spectral response of all cells was determined To determine tempera-
7

irradiation and after each intermediate exposure. To avoid the effects of any possible annealing on the coefficients, the cells were purposely held at each temperature for no more than 15 minutes.
RESULTS AND DISCUSSION
Proton Irradiation Tests
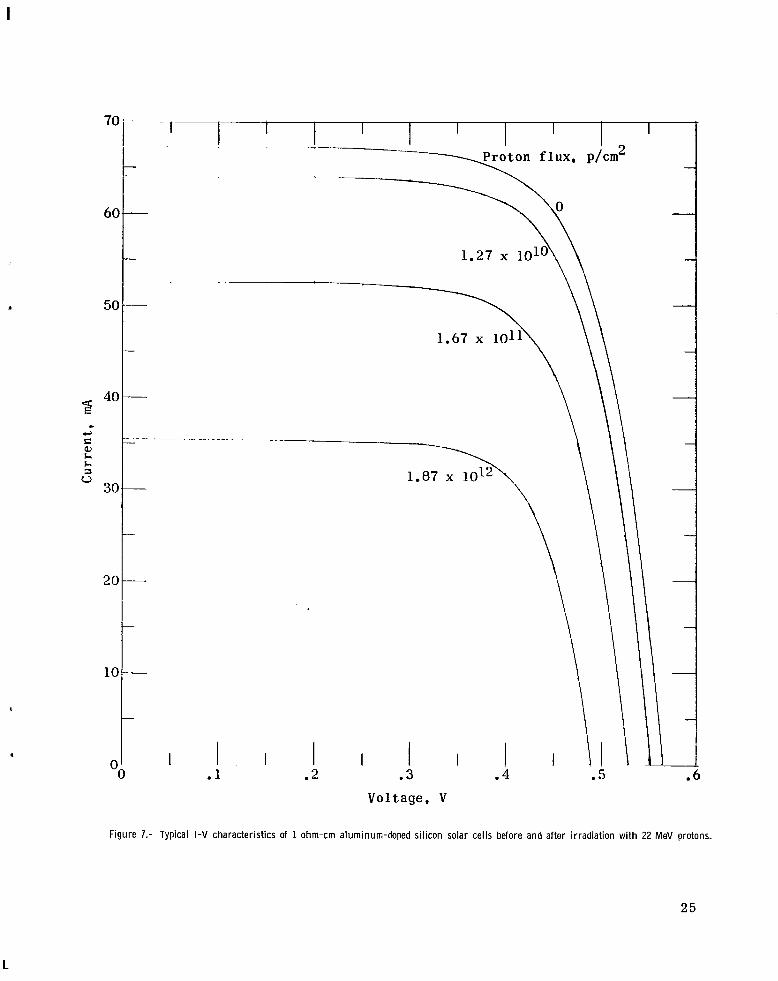
The effects of 22 MeV protons on the I-V characterist ics of a typical cell from each of the four groups of cells (table I) are presented in figures 5 to 8. These curves repre- sent data taken from the tungsten-light measurements made at the cyclotron site. Note that the I-V curves for the aluminum-doped cells were almost identical in shape to those for the boron-doped cells having the same nominal base resistivity. The relatively flat shape of the curves a t low voltages before irradiation and a fairly sharp break near the point of maximum power are characteristic of the high quality of the cells used in these tests.
In plots of various parameters as functions of integrated proton flux (figs. 9 to 14), the values presented are the average for the cells for each exposure. Specifically, the average of all eight cells in each group established the preirradiation reference points, the average of two cells w a s used at each of the two intermediate exposures, and the average of four cells at the maximum integrated flux of about 2 x 10l2 p/cm2 (table 11).
The effects of proton irradiation on the average short-circuit current for each group of cells are shown in figures 9 and 10. initial short-circuit current remaining after irradiation as a function of integrated flux. Measurements made under both the tungsten light and the solar simulator are shown. Except for the 1 ohm-cm cells under tungsten light, there is no significant difference in the radiation resistance of the aluminum- and boron-doped cells having the same nominal base resistivity. than the 1 ohm-cm aluminum-doped cells, and the 10 ohm-cm boron-doped cells are more radiation resistant than the 1 ohm-cm boron-doped cells by approximately the same factor. greater than that under the solar simulator. irradiance of the two lights, which wi l l be discussed later. required to cause 25-percent degradation of the parameter under investigation) and the degradation rate (the slope of the curve between 10l1 and 10l2 p/cm2) are given in table III.
Each curve represents the percentage of
The 10 ohm-cm aluminum-doped cells are more radiation resistant
In each instance the damage measured under the tungsten light w a s considerably This is due to the difference in the spectral
The critical flux (the flux
The effects of proton irradiation on the average maximum power P,, of each group of cells are shown in figures 11 and 12. The trends are similar to those for Isc,
I
8

except that the changes in Pm, are greater. The critical fluxes and degradation rates for Pm, are also given in table III.
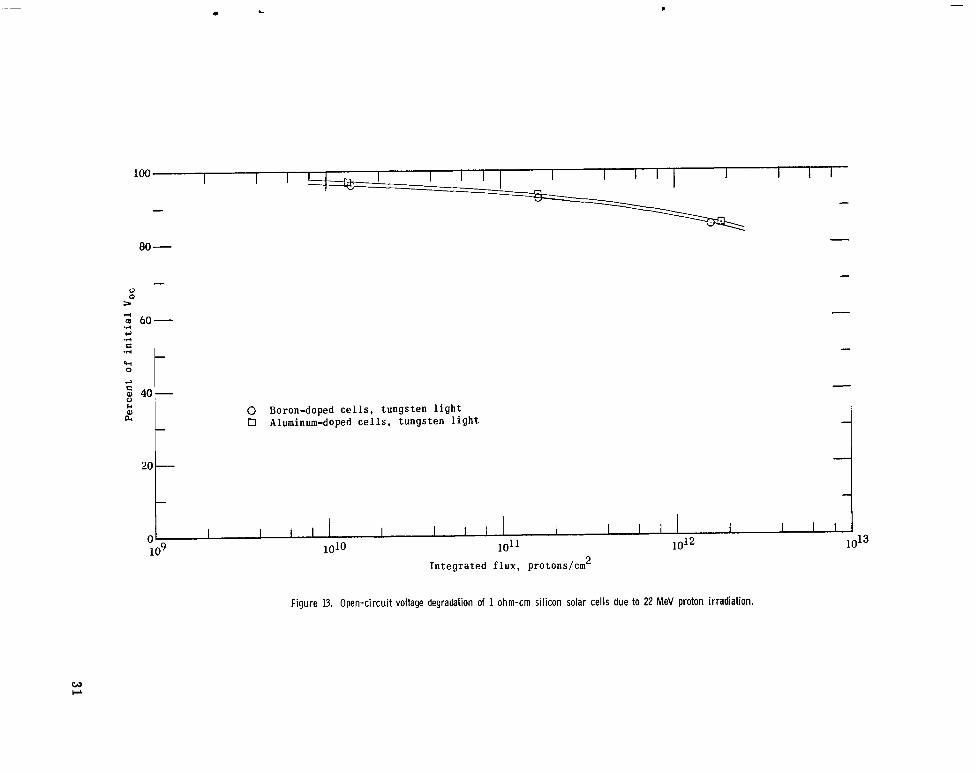
Figures 13 and 14 represent the effects of 22 MeV protons on the open-circuit voltage Voc of each group of cells, as measured under the tungsten light. The results obtained under the solar simulator were the same and are not shown. The curves indicate that for a given flux the percentage decrease in Voc is approximately one-half that in ISC.
Tungsten
1.7 X
2.6 X 1OI1 2.6 X 10¹¹ 3.1 X
TABLE JII
CRITICAL FLUX GC AND DEGRADATION RATE FOR I,, AND P,,
O F SOLAR CELLS IRRADIATED WITH 22 MeV PROTONS
Simulator
1.3 X 1OI2 1.5 X 10¹² 3.1 X 1 O I 2 2.5 X
Solar-cell type
Tungsten
1.0 X 1OI1 1.69 X
1.37 x 2.0 X 1011
1 ohm-cm boron 1 ohm-cm aluminum 10 ohm-cm boron 10 ohm-cm aluminum
Simulator
5.2 X
5.0 X 1O1I 9.0 x 7.4 X 1011
Short-circuit current, I,,
24.2 24.0 20.0 21.0
14.5 15.0 14.5 16.5
Maximum power, P,, 1 Rate, %/decade
26.0 25.5 21.5 26.5 18.0 28.5 17.5
Electron Irradiation Tests
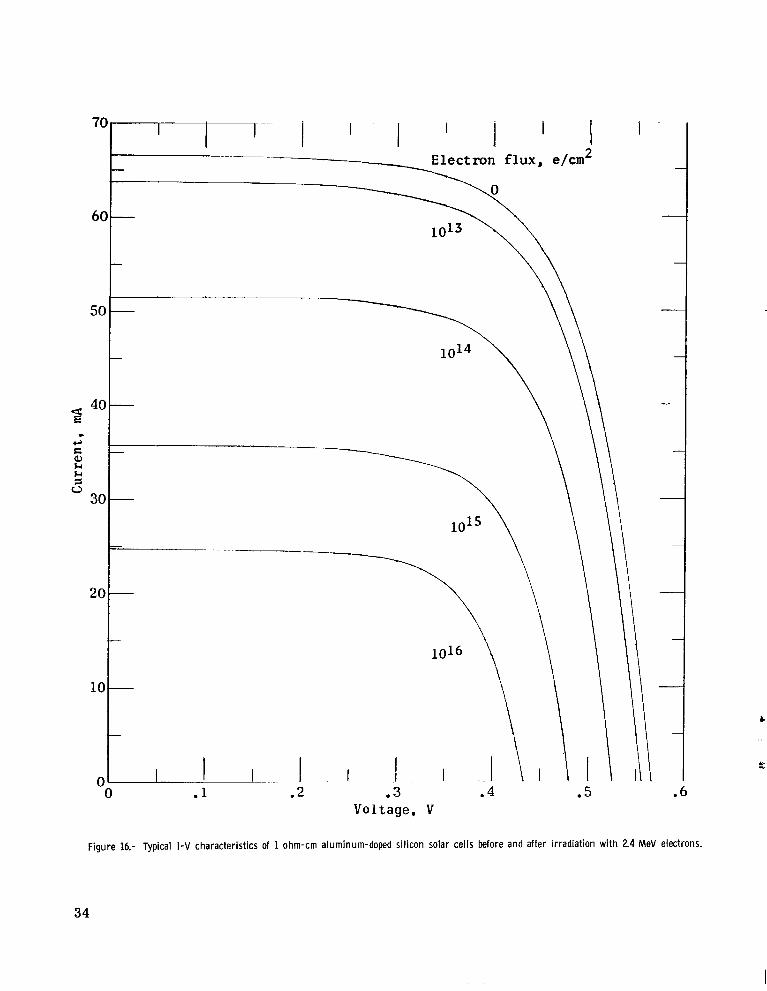
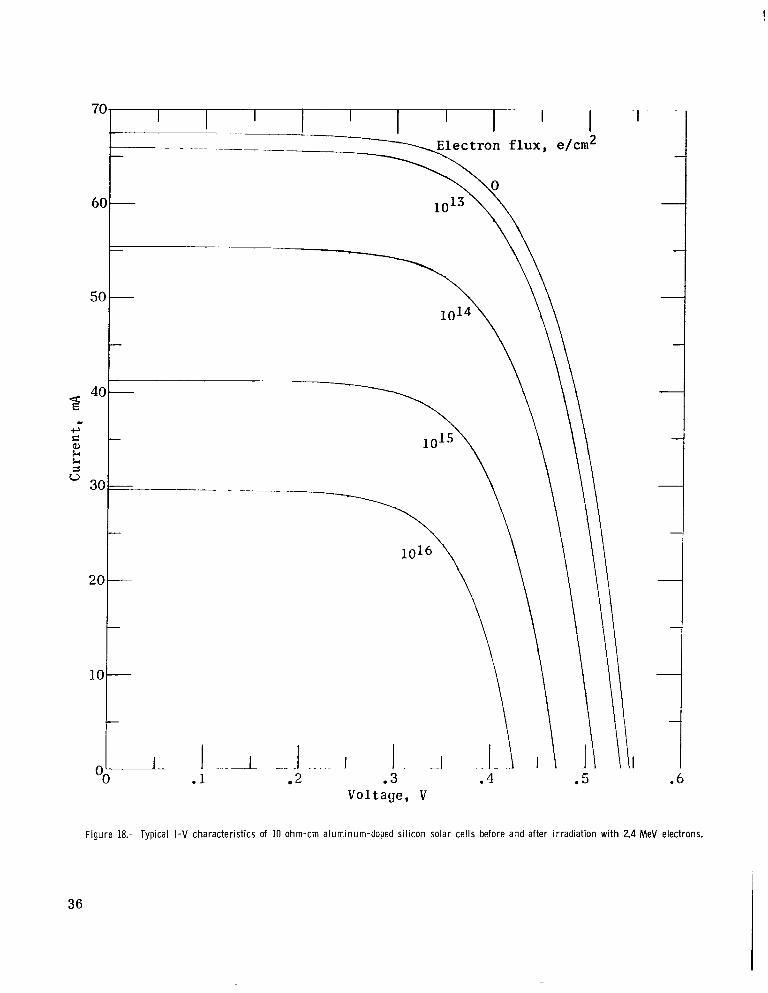
The I-V characteristics of one cell f rom each group irradiated with 2.4 MeV elec- trons a r e shown in figures 15 to 18. the cells irradiated and were obtained under illumination with a tungsten light source before irradiation and immediately after each intermediate integrated flux.
These curves a r e typical of the raw data from all
Figures 19 to 22 show the I-V characteristics of all cells tested in each group as measured under illumination by the solar simulator. limits of current variation observed in each group of cells. As previously stated, no selective matching was attempted because of the small number of cells acquired. Never- theless, the variation between the cells in each group, before and after irradiation, is small. The aluminum-doped cells exhibited slightly l e s s variation than the boron-doped cells. irradiation tests, even when close matching of one or more electrical parameters was achieved initially. As noted in reference 5, the variations observed in most tests might be attributed to slight differences in impurity concentration and the dislocation density of the parent crystal as well as variations in fabrication techniques.
The shaded areas represent the
Such small variations after irradiation have not been found in all solar-cell
Figures 23 to 26 show the normalized short-circuit current and maximum power as a function of integrated f lux f rom data taken during illumination with both tungsten light
9
L
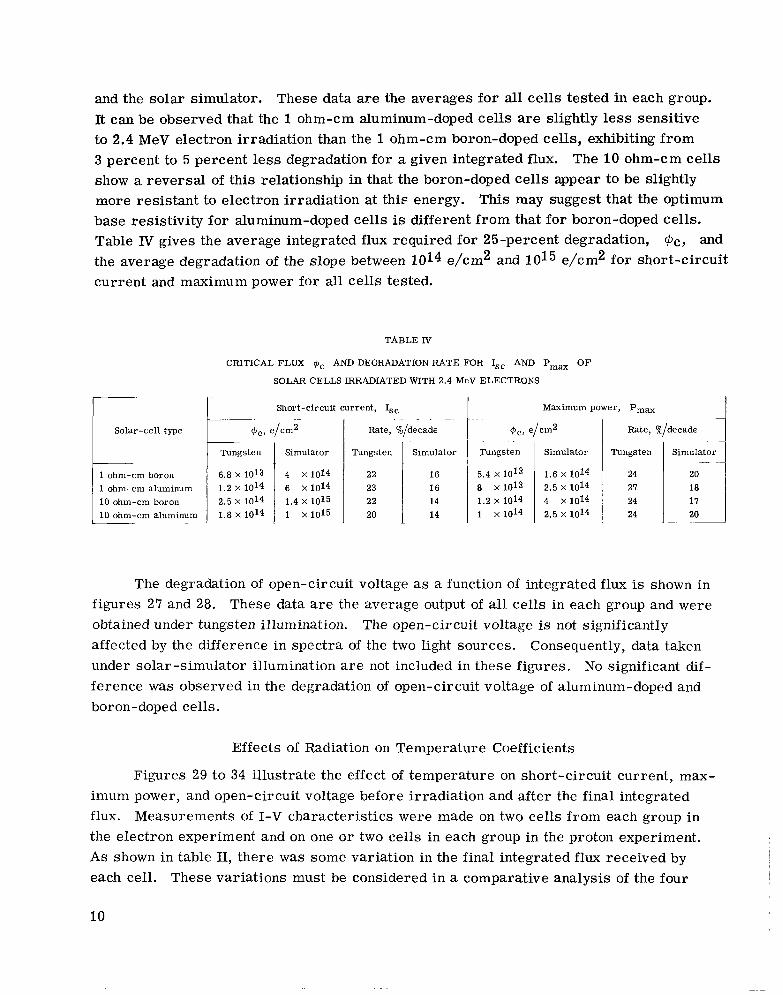
and the solar simulator. It can be observed that the 1 ohm-cm aluminum-doped cells are slightly less sensitive to 2.4 MeV electron irradiation than the 1 ohm-cm boron-doped cells, exhibiting from 3 percent to 5 percent less degradation for a given integrated flux. show a reversal of this relationship in that the boron-doped cells appear to be slightly more resistant to electron irradiation at this energy. base resistivity for aluminum-doped cells is different f rom that for boron-doped cells. Table IV gives the average integrated flux required for 25-percent degradation, the average degradation of the slope between 1014 e/cm2 and 1015 e/cm2 for short-circuit current and maximum power for all cells tested.
These data are the averages for all cells tested in each group.
The 10 ohm-cm cells
This may suggest that the optimum
$c, and
Simulator
4 x 10¹⁴
1.4 x 10¹⁵ 1 xi015
6 X 10¹⁴
TABLE N
CRITICAL FLUX pc AND DEGRADATION RATE FOR I,, AND Pm, O F
SOLAR CELLS IRRADIATED WITH 2.4 MeV ELECTRONS
Tungsten
22 23 22 20
~.
Short-circuit current, Is, .~ - . -.
Solar-cell type I Rate, %/decade
Tungsten
6.8 X 10¹³
2.5 x 10¹⁴
1 ohm-cm boron
10 ohm-cm boron
Simulator
16 16 14 14
Maximum power, Pm,,
Tungsten
5.4 x 10¹³ 8 x 10¹³ 1.2 x 10¹⁴ 1 x 10¹⁴
Simulator
1.6 x 10¹⁴ 2.5 x 10¹⁴ 4 x 10¹⁴ 2.5 x 10¹⁴
Rate, '%/decade
Tungsten
24 27 24 24
Simulato
20
18 17 20
-
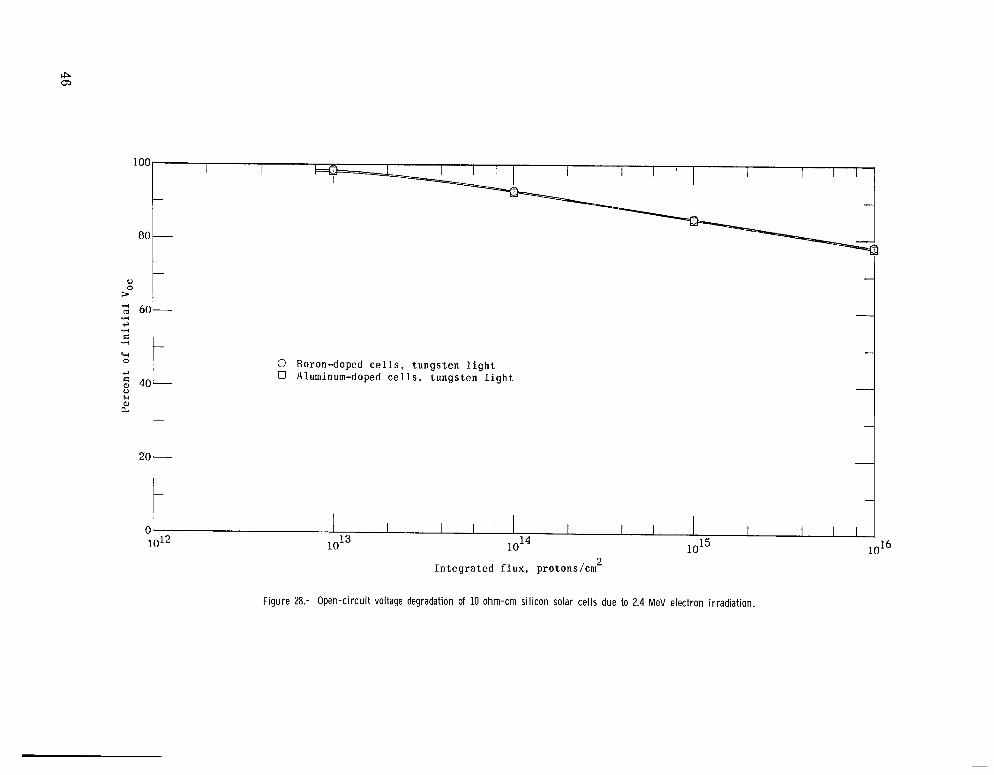
The degradation of open-circuit voltage as a function of integrated flux is shown in figures 27 and 28. These data are the average output of all cells in each group and were obtained under tungsten illumination. affected by the difference in spectra of the two light sources. Consequently, data taken under solar-simulator illumination a r e not included in these figures. No significant dif- ference was observed in the degradation of open-circuit voltage of aluminum-doped and boron-doped cells.
The open-circuit voltage is not significantly
Effects of Radiation on Temperature Coefficients
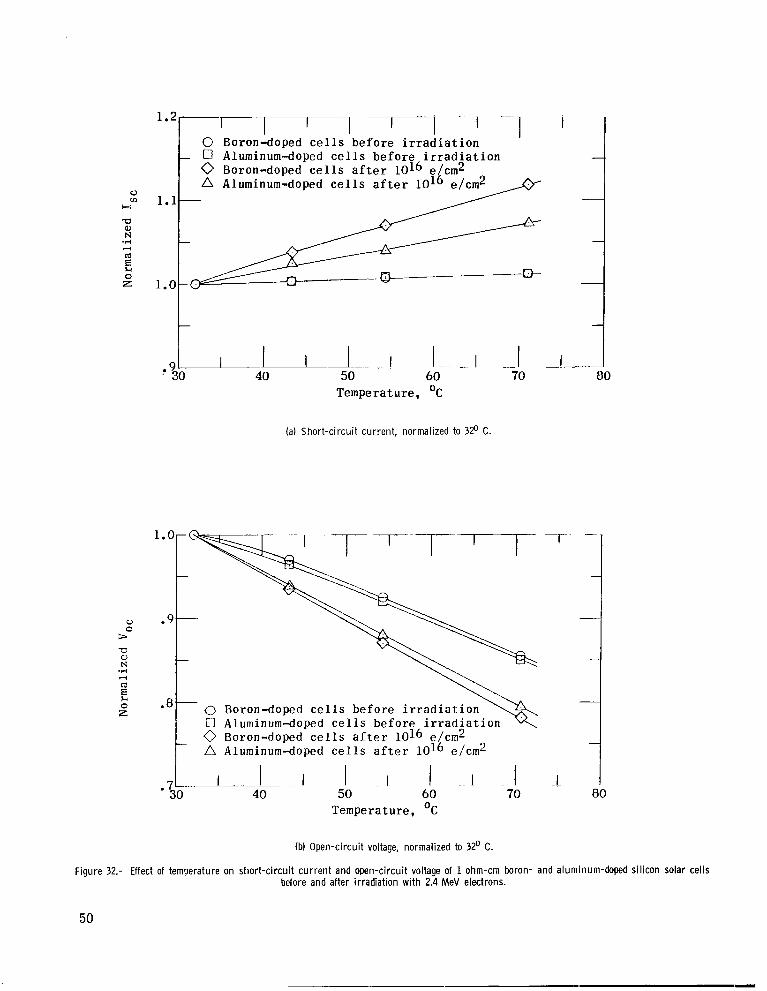
Figures 29 to 34 illustrate the effect of temperature on short-circuit current, max- imum power, and open-circuit voltage before irradiation and after the final integrated flux. Measurements of I-V characteristics were made on two cells from each group in the electron experiment and on one o r two cells in each group in the proton experiment. As shown in table 11, there was some variation in the final integrated f lux received by each cell. These variations must be considered in a comparative analysis of the four

groups in the proton experiment. The I-V characteristic measurements were made under solar-simulator illumination at incremental temperatures f rom 32O C to 71° C. The out- puts of the cells tested from each group were averaged, and the ratio of each parameter to its value at 32' C was plotted as a function of temperature.
range from 32' C to 71' C. The increase in short-circuit current of 1 ohm-cm boron- doped cells was slightly higher before and after irradiation than that of 1 ohm-cm aluminum-doped cells. The increase in short-circuit current of 10 ohm-cm boron-doped cells used in the proton tes ts was slightly l e s s before and after irradiation than that of 10 ohm-cm aluminum-doped cells. However, for the 10 ohm-cm cells used in the elec- tron tests, no significant difference was observed in the temperature effect on short- circuit current of boron- and aluminum-doped cells before and after irradiation.
Short-circuit current increased linearly with increasing temperature over the
Open-circuit voltage and maximum power decreased approximately linearly with increasing temperature for unirradiated and irradiated cells, the amount of change in open-circuit voltage being slightly l e s s than that in maximum power. induced changes in these two parameters appear to be independent of the type of radiation, solar-cell base resistivity, and doping element.
The temperature-
Temperature coefficients of the average short-circuit current, maximum power, and open-circuit voltage before and after irradiation a r e given in tables V and VI.
-0.143 -.143 -.171 -. 143
TABLE V
TEMPERATURE COEFFICIENTS FOR THE TEMPERATURE RANGE 32O C TO 710 C,
BEFORE AND AFTER IRRADIATION WITH 22 MeV PROTONS
-0.408 -2.30 -.399 -2.26 -.400 -2.15 -.419 -2.28
Solar -cell type -
1 ohm-cm boron 1 ohm-cm aluminum 10 ohm-cm boron 10 ohm-cm aluminum
~ ~~
1 ohm-cm boron 1 ohm-cm aluminum 10 ohm-cm boron 10 ohm-cm aluminum
I Before irradiation
0.061 .041 .012 .040
0.156 .144 .113 .148
41.0 28.21 7.7 28.2
-0.512 -.511 -.642 -.552
After irradiation
74.35 71.8 58.97 76.92
-0.491 -.523 -. 588 -. 600
-0.084 -.094 -.lo2 -.lo2
-0.436 -2.18 -.479 -2.38
-2.38 -.517 -2.46
11

TABLE VI
0.037 25.6 .024 16.7 .037 25.6 .016 11.5
TEMPERATURE COEFFICIENTS FOR THE TEMPERATURE RANGE 32’ C TO 71° C,
BEFORE AND AFTER IRRADIATION WITH 2.4 MeV ELECTRONS
-0.50 -.51 -. 52 -.55
Solar -cell type l*Apc
1 ohm-cm boron 1 ohm-cm aluminum 10 ohm-cm boron 10 ohm-cm aluminum
1 ohm-cm boron 1 ohm-cm aluminum 10 ohm-cm boron 10 ohm-cm aluminum
‘Pmax
0.305 .186 .194 .185
110 74 85 82
-0.55 -.60 -.63 -.64
-0.138 -.131 -.133 -.143
-0.064 -.074 -. 083 -.080
cvoc
-0.37 -.38 -.40 -.40
-0.56 -.53 -.60 -.54
- .
-2.12 -2.14 -2.19 -2.19
-2.50 -2.38 -2.25 -2.35
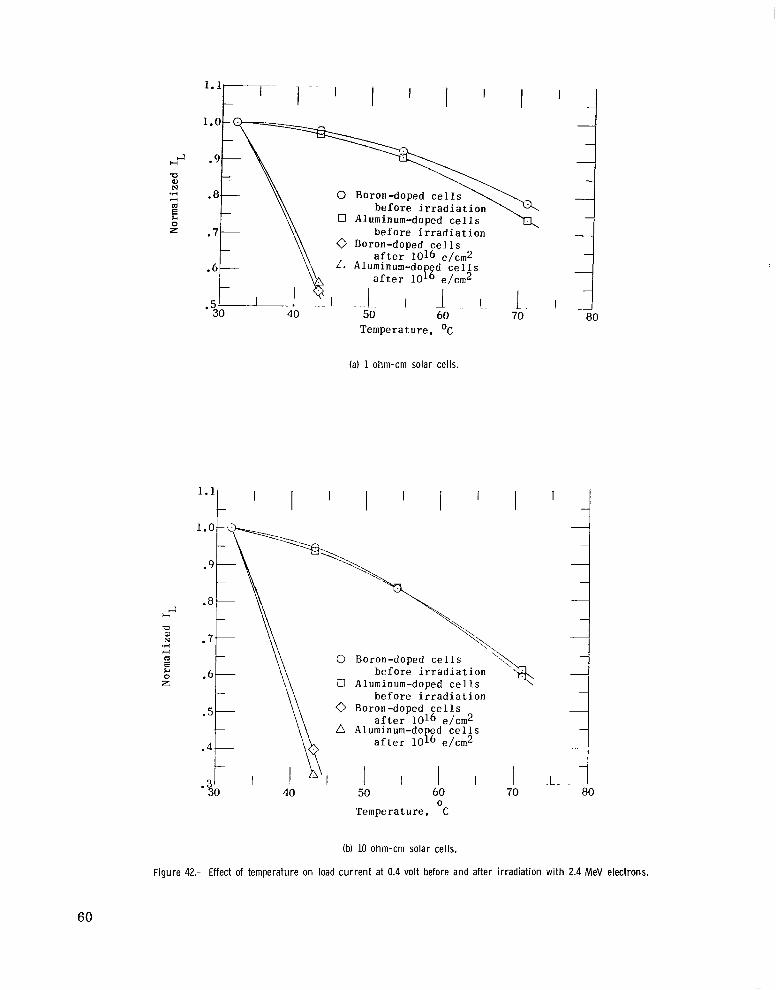
The effect of temperature on load current before and after irradiation is presented in figures 35 to 42 for operating voltages f rom 0.25 volt to 0.4 volt. These data were taken from the solar-simulator I-V characteristic curves and a r e the average of two cells in each group. The differences observed in the temperature coefficients of boron-doped and aluminum-doped cells having the same base resistivity a r e small. The load-current temperature coefficients f o r the 10 ohm-cm cells a r e slightly higher before irradiation than those for the 1 ohm-cm cells, particularly at higher voltages. After irradiation, the decrease in effective output of the 10 ohm-cm cells is more apparent as the temperature is increased.
The temperature coefficients of silicon solar cells vary f rom cell to cell, and two cells of any given type a r e not enough to establish a reasonable average. Also, the observed changes, particularly in short-circuit current before irradiation, were small, and a determination of temperature coefficients was difficult because of the limited tem- perature range of these measurements. However, the purpose of these temperature tests was to compare boron-doped and aluminum-doped solar cells, and the results should not be considered complete data for space power-system design purposes. References 10 and 11 give temperature coefficients for s imilar boron-doped cells that were derived f rom measurements over a much wider temperature range. The temperature coefficients
\
!
12

of the present investigation are in reasonably good agreement with those shown in the references except that the values for short-circuit current a r e considerably lower in the present investigation.
Effects of Type of Light on Radiation Damage
The spectral response of solar cells changes when they are subjected to particulate radiation. Therefor e, measur e ments of radiation- indu c ed degradation of short-circuit current and maximum power are strongly influenced by the spectral irradiance of the light used for the measurements. Figure 43 shows the relative spectral response of one of the 10 ohm-cm aluminum-doped cells before and after irradiation with 2.4 MeV elec- trons. The relative response, which is the output short-circuit current per unit radiant power, is plotted as a function of wavelength, for constant input radiant power at each wavelength. in the spectral response of the aluminum- and'boron-doped cells, whether 1 ohm-cm o r 10 ohm-cm. cells was very s imilar to that shown for 2.4 MeV electrons.
The curve is typical of all cells tested. No significant difference was found
Also, the observed effect of 22 MeV protons on the spectral response of the
The measured spectral irradiance of each of the two light sources used in these tes ts and the spectral distribution of space sunlight (ref. 12) a r e given in figure 44. Although the tungsten light is obviously a poor simulator of space sunlight, i t is widely used for solar-cell testing because of its convenience, stability, and reliability. The spectral irradiance of the solar simulator is considerably closer to that of space sunlight.
By multiplying the relative spectral response of the solar cell (fig. 43) by the appro- priate spectral irradiance curve (fig. 44) at each wavelength of interest, it is possible to determine the spectral response of the cell when illuminated by each type of light. results of such calculations, before and after irradiation, a r e shown in figures 45, 46, and 47. each curve, and the preirradiation spectral-response curves were normalized so that their areas were equal. the infrared portion of the spectrum where the solar cell degrades the fastest (fig. 43). For this reason, considerably more degradation is found when tungsten light is used than would be expected in space sunlight where the peak response is in the visible region (fig. 47).
The
The total short-circuit current output of the cell is proportional to the a rea under
Note that for the tungsten light (fig. 45) the peak response is in
From the spectral-response curves in each type of light, it is possible to compute factors which can be used to predict the output, o r the damage as a function of radiation flux, fo r a cell in space sunlight f rom direct measurements made under the tungsten light o r the solar simulator. These conversion factors a r e the ratios of the areas under the
13

appropriate spectral-response curves. tungsten light to space sunlight is:
For example, the factor for conversion from
Area under spectral response curve in space sunlight = Area under spectral response curve in tungsten light
f
and for conversion from the solar simulator to space sunlight:
- Area under spectral response curve in space sunlight fSU/Sim - Area under spectral response curve in solar simulator
As the radiation damage increases, these factors vary because of the gradual change in cell spectral response. Figure 48 shows curves of fsuIW and fsu/sim, plotted as a function of percentage of initial short-circuit current, obtained by direct measurements under the light source of interest. The factors computed for all 16 cells included in the 2.4 MeV electron tests are plotted. Similar factors were obtained for the several cells irradiated with 22 MeV protons. Note that the maximum value of the factor for converting solar-simulator to space-sunlight data is only 1.10 at 50-percent degradation.
To check the accuracy of this method, factors were computed for conversion of tungsten-light data to solar-simulator data by taking the ratio of the data obtained with these two light sources. The calculated factors and the factors computed f rom experi- mental data agreed to within 4 percent.
The short-circuit current degradation shown in figures 9, 10, 23, and 24 as pe r - centage of initial short-circuit current can be corrected to degradation in space sunlight by using the appropriate factor from figure 48. degradation of maximum power, figures 11, 12, 25, and 26, can be similarly corrected with small e r ro r s . ture characteristics have been found to be reasonably insensitive to changes in cell spectral response, and hence the correction factors are not applicable to these data.
Limited testing has shown that the
The degradation of open-circuit voltage and the changes in tempera-
Effect of Room-Temperature Storage
Subsequent tests were made to determine the effect of room-temperature storage on the radiation-induced damage experienced by the cells used in these two experiments. After the final postirradiation measurements, the cells were stored in a cabinet at room temperature. Three months after each experiment, I-V Characteristics under both light sources were measured on all cells in each group. As mentioned earlier, a calibrated, unirradiated solar cell was employed to insure the same intensity of the light sources and repeatability of the instruments. At all points along the I-V curve, data taken after 3 months were within *1 percent of the data f rom the same cells taken shortly after the final exposure. 1 This close agreement was observed in those cells subjected to 71' C
14

during the short-term elevated-temperature tes t s as well as those cells withheld from the tests. and short-term exposures to moderately elevated temperatures, the annealing rate of the aluminum-doped cells is low and comparable to that of the boron-doped cells.
These limited tests show that during long-term storage at room temperature
CONCLUSIONS
The following conclusions regarding the effects of 22 MeV proton and 2.4 MeV electron irradiation on the electrical properties of boron- and aluminum-doped silicon solar cells are derived from this investigation:
1. An increase in base resistivity from approximately 1 ohm-cm to approximately 10 ohm-cm reduces the sensitivity to particulate radiation of both boron- and aluminum- doped cells.
2. Silicon solar cells having the same base resistivity differ little in sensitivity to 22 MeV proton irradiation, indicating that the effect of the doping element on the cell's sensitivity to protons at this energy is insignificant.
3. The critical fluxes for short-circuit current and maximum power of 1 ohm-cm aluminum-doped cells were from 1.2 to 1.5 t imes higher than the critical fluxes of 1 ohm- cm boron-doped cells after irradiation with 2.4 MeV electrons. However, for the 10 ohm- c m cells, the critical fluxes of the boron-doped cells were higher than those of the aluminum-doped cells by about the same factor.
4. When evaluated under the solar simulator, the percentage degradation of open- circuit voltage with irradiation is approximately 1/2 the percentage degradation of short- circuit current for both boron- and aluminum-doped cells.
5. In the temperature range from 32' C to 71° C, short-circuit current of both boron- and aluminum-doped cells increases linearly and maximum power and open- circuit voltage decrease linearly with icr,reasing temperature before and after irradiation with 2.4 MeV electrons and 22 MeV protons.
6. The temperature coefficients of the various parameters under investigation changed with irradiation. coefficients between the aluminum-doped and boron-doped cells having the same resistivity.
However, there w a s no significant difference in temperature
7. The effect of irradiation on the spectral response of aluminum-doped and boron- doped cells is nearly identical.
8. No recovery of the electrical properties was observed after 3 months' storage at room temperature following these radiation tests.
15

9. In most respects, the commercially produced aluminum-doped solar cells tested in this investigation and the boron-doped counterparts were found to be equally resistant to high-energy particulate radiation.
Langley Research Center, National Aeronautics and Space Administration,
Langley Station, Hampton, Va., May 22, 1967, 120-33-01-01-23.
16 E

REFERENCES
1. Mandelkorn, Joseph; Kesperis, James; et al.: Comparison of p-n and n-p Silicon Solar Cells. Proceedings 14th Annual Power Sources Conference, U.S. Army Signal Res. Develop. Lab., May 1960, pp. 42-45.
2. Mandelkorn, J . ; McAfee, C.; et al.: A New Radiation-Resistant High-Efficiency Solar Cell. Tech. Rept. 2162, U.S. Army Signal Res. Develop. Lab., Oct. 1960.
3. Rosenzweig, W.; Gummel, H. K.; and Smits, F. M.: Solar Cell Degradation Under 1 MeV Electron Bombardment. Nuclear Electronic Effects Program, Tenth Triannual Technical Note, ASD-TDR-62-808, U.S. Air Force, July 15, 1962, pp. 85-97.
4. Mandelkorn, Joseph; Schwartz, Lawrence; et al.: Effects of Impurities on Radiation Damage of Silicon Solar Cells. NASA TN D-2711, 1965.
5. Mandelkorn, Joseph; Schwartz, Lawrence; et al.: Effects of Impurities on Radiation Damage of Silicon Solar Cells. J. Appl. Phys. (Commun.), vol. 35, no. 7, July 1964, pp. 2258-2260.
6. Statler, R. L.: Electron-Bombardment Damage in Silicon Solar Cells. NRL Rept. 6091, U.S. Naval Res. Lab., Oct. 7, 1964.
7. Brandhorst, Henry W., Jr.: Airplane Testing of Solar Cells. Fourth Photovoltaic Specialists Conference. Solar Cell Testing, PIC-SOL 209/5.1, Interagency Advanced Power Group, Aug. 1964,
Proceedings of the Volume I1 - Thin Film Solar Cells and
pp. C-2-1 - C-2-17.
8. Hulten, W. C.; Honaker, W. C.; and Patterson, John L.: Irradiation Effects of 22 and 240 MeV Protons on Several Transistors and Solar Cells. NASA TN D-718, 1961.
9. Haynes, Gilbert A.; and Miller, William E.: Effects of 1.2 and 0.30 MeV Electrons on the Optical Transmission Properties of Several Transparent Materials. NASA T N D-2620, 1965.
10. Cunningham, Brian T.; Sharp, Robert L.; and Slifer, Luther W.: The Electrical Characteristics of Irradiated Silicon Solar Cells as a Function of Temperature. Proceedings of the Fourth Photovoltaic Specialists Conference. Volume I - Radia- tion Effects on Solar Cells and Photovoltaic Devices, PIC-SOL 209/5, Interagency Advanced Power Group, Aug. 1964, pp. A-7-1 - A-7-43.
11. Martin, J. H.; Teener, J. W.; and Ralph, E. L.: Some Effects of Electron Irradiation and Temperature on Solar Cell Performance. Proceedings 17th Annual Power Sources Conference, U.S. Army Electron. Res. Develop. Lab., May 1963, pp. 15-19.
17

I I I 1111 Ill 1 1 1 1 1 ~ ~ 1 1 1 1 1 1 1 1 1 1 1 1 1 1 II
12. Johnson, F. S.: The Solar Constant. J. Meteorol., vol. 11, no. 6, Dec. 1954, pp. 431-439.
i
18
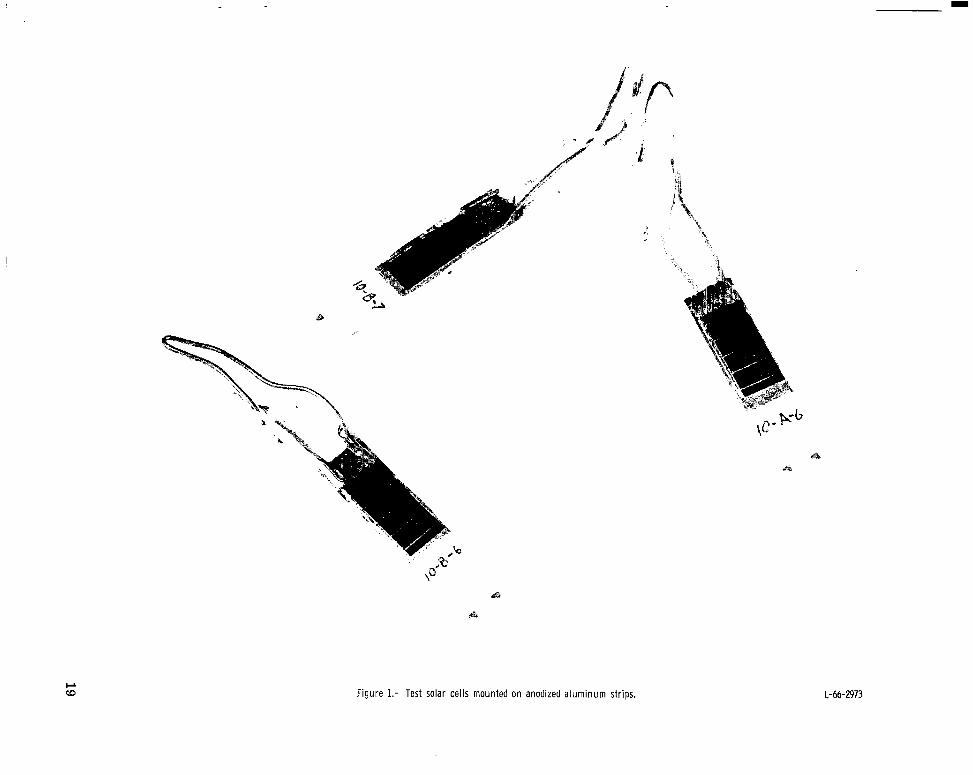
Figure 1.- Test solar cel ls mounted on anodized aluminum strips. L-66-2973

ac voltmeter
7--- -
-Y Light source I- I
J’i
110 V ac
Autotransformer
I
Standard solar cell
I
milliammeter
Water in
1000 .t Thermocouple Thermocouple --+ ohms
I \ .
Temperature indicator mount indicator
Figure 2.- Test setup for measurement of I -V characteristics of solar cells.
I
20

I
.!Q; w e
Figure 3.- Cells mounted on wheel for irradiat ion in the Oak Ridge cyclotron. L-66-2971
21

c t J
Figure 4.- Cells mounted on plate for irradiation i n the electron accelerator at Langley Research Center. L-66-25'72

70
60
50
2 40 - + E. 6, h h =I u
30
20
10
C
I I I I I Proton flux, p/cmL
1.22 x lolo\ \ -
Voltage, V
Figure 5.- Typical I -V characteristics of 1 ohm-cm boron-doped si l icon solar cells before and after i r radiat ion w i th 22 MeV protons.
23

70
60
50
40 2
Q, F.l k I u 30
20
10
i P h *
1.93 x lo1* \ .6
Figure 6.- Typical I-V characteristics of 10 ohm-cm boron-doped sil icon solar cel ls before and after irradiation w i t h 22 MeV protons.
24
I
70
60
. 50
20
10
I .2
I
Voltage, V
Figure 7.- Typical I-V characterist ics of 1 ohm-cm aluminum-doped si l icon solar cells before and after irradiat ion wi th 22 MeV protons.
25
L

7c
6C
5c
40 -2 . c, E a k &I
u a 30
20
10
- -
-
\\ -
1.77 x \ 10l1 \\
0' I ~- d 0 .1 . 2 . 3 . 4 .5
Voltage, V
Figure 8.- Typical I -V characteristics of 10 ohm-cm aluminum-doped si l icon solar cells before and after irradiat ion w i th 22 MeV protons.
26

r
al a E 0 Boron-doped cells, tungsten light 0 Aluminum-doped cells, tungsten light 0 Boron-doped cells, solar simulator A Aluminum-doped cells, solar simulator
c
t-
Integrated flux, protons/cm'
Figure 9.- Short-circuit current degradation of 1 ohm-cm silicon solar cells due to 22 MeV proton irradiation.

I 100
0 I I I I t I I I t I
I.'
40- 0 $ 4 Q, a
I I 1 1
C Boron-doped cells, tungsten light 0 Aluminum-doped cells, tungsten light 0 Boron-doped cells, solar simulator L Aluminum-doped cells, solar simulator
\\ i \
20 - I
Figure 10.- Short-circuit cur ren t degradation of 10 ohm-cm si l icon solar cel ls due to 22 MeV Droton irradiation.
"

C
I I I I I I I I I I I I I I
80 - \\
I I I I
0 B o r o n - d o p e d c e l l s , t u n g s t e n l i g h t 0 Aluminum-doped c e l l s , t u n g s t e n l i g h t 0 b o r o n - d o p e d c e l l s , s o l a r s i m u l a t o r
Aluminum-doped c e l l s , s o l a r s i m u l a t o r
20 1 L
-
I
I 1
Integrated flux, protons/cm*
Figure 11.- Maximum-power degradation of 1 ohm-cm silicon solar cells due to 22 MeV proton irradiation.

w 0
0
I 20
I I I I I
0 B o r o n - d o p e d c e l l s , t u n g s t e n l i g h t 0 Aluminum-doped c e l l s , t u n g s t e n l i g h t 0 B o r o n - d o p e d c e l l s , s o l a r s i m u l a t o r
A l u m i n u m - d o p e d c e l l s , s o l a r s i m u l a t o r
Figure 12.- Maximum-power degradation of 10 ohm-cm si l icon solar cel ls due to 22 MeV proton irradiation.
e <, c
L
I I I I t I I I I I I I I 1 I I I I
C
I I I I t I I I I I I I I 1 I I I I
- 80 -
4
.A m 60- .Fl
.: I
a a E 40r t
0 Boron-doped cells, tungsten light 17 Aluminum-doped cells, tungsten light
20 c -I c Integrated flux, protons/cm 2
Figure 13. Open-circuit voltage degradation of 1 ohm-cm silicon solar cells due to 22 MeV proton irradiation.

100-
80
0 0 >
H
.M e
.M
E .- ‘3 0
e
20 - -1
I I I I ! r I 1 I 1 1 I I I v
- -
- -
- -
60- -
- -
E 0 h Q
o, 40- -
CL 0 Boron-doped cells, tungsten light 0 Aluminum-doped cells, tungsten light - -
Figure 14.- Open-circuit voltage degradation of 10 ohm-cm si l icon solar cells due to 22 MeV proton irradiation.
0 I I I I I I I I I I I I I I I I I
e

I
I ..
I
Voltage, V
Figure 15.- Typical I-V characterist ics of 1 ohm-cm boron-doped si l icon solar cells before and after irradiat ion wi th 2.4 MeV electrons.
33
70
60
50
2 - c, c al k &I S u
30
20
10
0 0
b
I I ~-
' I ' I - -
- -
- -
- -
- -
40- -
-
-
- __- - -
-
-
.6
-
-
. 2 . 3 . 4 . 5 1 1
. 1
Figure 16.- Typical I-V characteristics of 1 ohm-cm aluminum-doped silicon solar cells before and after irradiation with 2.4 MeV electrons.
34

701 ' - 1 ' 1 ' I I ' 1 - ---I- I
. --
501 . .... ~
""E - a2 Ll Ll S u 30 - .. - ._
20 -
-
10 -
-
I 0.. . I
Voltage, V
Figure 17.- Typical I-V characteristics of 10 ohm-cm boron-doped silicon solar cells before and after irradiation with 2.4 MeV electrons.
35
I
.6
Figure 18.- Typical I - V characteristics of 10 ohm-cm aluminum-doped si l icon solar cel ls before and after irradiation with 2.4 MeV electrons.
36

I
I- Electron flux, e/cm2
I I
70 L O
60
50
2 - c-’
h h a u
40
30
20
10
0 .1 .2 .4 .5 . 3 Voltage, V
I I I I I I 0 , 6
Figure 19.- I-V characteristics of 1 ohm-cm boron-doped silicon solar cells before and after irradiation with 2.4 MeV electrons.
37
I

I I 111111~111111111111111111111
t Electron f lux, e/cm2
I '
.6 Voltage, V
Figure 20.- I-V characteristics of 1 ohm-cm aluminum-doped si l icon solar cells before and after irradiat ion wi th 2.4 MeV electrons.
38

I- Electron f lux, e/cm2
. 1 . 2 . 3 .4 . 5 .6 Voltage, V
Figure 21.- I-V characteristics of 10-ohm-cm boron-doped si l icon solar cells before and after irradiation w i th 2.4 MeV electrons.
39

I I i i 1 1 1 . . . . 80
I 2 Electron flux, e/cm t 0
. 2 . 3 . 4 . 5 Voltage, V
.6
Figure 22.- I-V characteristics of 10 ohm-cm aluminum-doped si l icon solar cel ls before and after irradiat ion wi th 2.4 MeV electrons.
40

0 Boron-doped cells, tungsten light 0 Aluminum-doped cells, tungsten light 0 Boron-doped cells, solar simulator A Aluminum-doped cells, solar simulator
I I I I I I I I I I I I I I I t
Figure 23.- Short-circuit current degradation of 1 ohm-cm silicon solar cells due to 2.4 MeV electron irradiation.

I 100
80 -
- 0 v) U
2 60-
c * G Boron-doped cells, tungsten light .- - w 'J Aluminum-doped cells, tungsten light
+ A Aluminum-doped cells, solar simulator
.e ' c, .e
- 0 Boron-doped cells, solar simulator 0
5 40-
0 I 1 I I I I I I
20 -
L
Integrated flux, protons/cd
Figure 24.- Short-circuit cur ren t degradation of 10 ohm-cm si l icon solar cel ls due to 2.4 MeV electron irradiation.

100 I I
- X m , E a
4 60- .d
cl .?I E .3 - W 0
+ 0 k
a
E: 40,-
0 Boron-doped cells, tungsten light 0 Aluminum-doped cells, tungsten light 0 Boron-doped cells, solar simulator A Aluminum-doped cells, solar simulator
\\ \\
2ok 1 c Integrated flux, electrons/cm2
Figure 25.- Maximum-power degradation of 1 ohm-cm silicon solar cells due to 2.4 MeV electron irradiation.

- X z a
m 4 60-
:: C
+I 0
c,
al
.3
E 40-
: ) a 'L
20 - I -
0 Boron-doped c e l l s , t ungs t en l i g h t 0 Aluminum-doped c e l l s , t ungs t en l i g h t 0 Boron-doped c e l l s , s o l a r s imula to r A Aluminum-doped c e l l s , s o l a r s i m u l a t o r
1
Figure 26.- Maximum-power degradation of 10 ohm-cm si l icon solar cells due to 2.4 MeV electron irradiation.

, I
-
- -
I I I I I I I I I I I I I I I I I I
80 -
l-
Y l
0 Boron-doped cells, tungsten light El Aluminum-doped cells, tungsten light
I
2o I-
Integrated flux, protons/cm 2
Figure 27.- Open-circuit voltage degradation of 1 ohm-cm silicon solar cells due to 2.4 MeV electron irradiation.
I-
+: , 0 Boron-doped cells, tungsten light 0 Aluminum-doped cells, tungsten light
a
20 -
2 Integrated flux, protons/cm
Figure 28.- Open-circuit voltage degradation of 10 ohm-cm si l icon solar cells due to 2.4 MeV electron irradiation.

'7 ' I ! I ! I ! I I
0 Boron-doped c e l l s b e f o r e i r r a d i a t i o n - 0 Aluminum-doped c e l l s b e f o r e i r r a d i a t i o n 0 Boron-doped ce l l s a f t e r i r r a d i a t i o n
Aluminum-doped c e l l s a f t e r i r r a d i a t i o n - 0 1.1
t
1.0
0 0
> . 9 W e, N
.A 4 m
0 z z
.e
.-j
0 Tempera ture , C
(a) Short-circuit current, normalized to 320 C.
- 0 Boron-doped ce l l s b e f o r e i r r a d i a t i o n 0 Aluminum-doped c e l l s b e f o r e i r r a d i a t i o n 0 Boron-doped c e l l s a f t e r i r r a d i a t i o n
- Aluminum-doped c e l l s a f t e r i r r a d i a t i o n
I ~
60 70 80 I I I I L - ~
1 40 50 Tempera ture , OC
(bl Open-circuit voltage, normalized to 32' C.
Figure 29.- Effect of temperature on short-circuit current and open-circuit voltage of 1 ohm-cm boron- and aluminum-doped silicon solar cells before a n d after irradiation with 22 MeV protons.
47
I -

-
1.2
- . 0 Boron-doped cells before irradiation 0 Aluminum-doped cells before irradiation 0 Boron-doped cells after irradiation 0
H- 1.1- Aluminum-doped cells after irradiation P Q, N
m
0
.rl d
--
'930 40 50 60 70 80 Temperature, OC
(a) Short-c i rcui t current, normalized to 32' C.
3
\ 0 Boron-doped cells before irradiation & 0 Aluminum-doped cells before irradiation 0 Boron-doped cells after irradiation
Aluminum-doped cells after irradiation
1 1 - I . -. I 60 70
.7 I 30 40 50
Temperature, O C
(b) Open-circuit voltage, normalized to 32O C.
Figure 30.- Effect of temperature on short-c i rcui t cur ren t and open-circuit voltage o f 10 ohm-cm boron- and aluminum-doped sil icon solar cells * before and after irradiation wi th 22 MeV protons.
48

0 Boron-doped cells before irradiation 0 Aluminum-doped cells before irradiation 0 Boron-doped cells after irradiation
Aluminum-doped cells after irradiation
X m E a
-u e, N ..-I A m
0 z z
I .. 1 ... I I - I - I L I I 40 50 60 70 80
.7 30
0 Temperature, C
(a) 1 ohm-cm solar cells.
0 Boron-doped cells 0 Aluminum-doped cells 0 Boron-doped cells after irradiation
Aluminum-doped cells after irradiation
71 I I _ I - - I . 1 1 1 - 30 40 50 60 70 80
Temperature, OC
(bl 10 ohm-cm solar cells.
Figure 31.- Effect of temperature on maximum power of boron- and aluminum-doped sil icon solar cells before and after i r radiat ion w i th 22 MeV protons.
49
I
-
1.2-
0 Boron-doped c e l l s b e f o r e i r r a d i a t i o n - 0 Aluminum-doped c e l l s b e f o r e i r r a d i a t i o n
0 Boron-doped c e l l s a f t e r 10l6 e/cm2 Aluminum-doped ce l l s a f t e r 10l6 e/cm2
0 CJY 1.1- h
-0 a N
m
0
.A d
E z 1.0
t I Tempera ture , OC
(a) Short-c i rcui t cur ren t , normalized to 32" C.
0 Boron-doped c e l l s b e f o r e i r r a d i a t i o n n Aluminum-doped c e l l s b e f o r e i r r a d i a t i o n 0 Boron-doped c e l l s a f t e r 1016 e/cm2 A Aluminum-doped c e l l s a f t e r 1016 e/cm2
4 m
0 Z E
I - - I . I I 1 I 50 60 70
L l 40 3 0 80
Tempera ture , OC
(b) Open-circuit voltage, normalized to 32' C.
Figure 32.- Effect of temperature on short-c i rcui t c u r r e n t and open-circuit voltage of 1 ohm-cm boron- and aluminum-doped si l icon solar cells before and after i r radiat ion w i th 2.4 MeV electrons.
50

0 Boron-doped cells before irradiation Aluminum-doped cells before irradiation
0 Boron-doped cells after 10l6 e/cm2 ," 1.1 I- Aluminum-doped cells after 10l6 e/cm2
I L 70 80 . 9 . 30 I I I I I I 40 50 60
Temperature, OC
(a) Shor t -c i rcu i t current,normalized to 32' C.
0 0
L=.
d
m E 0 z
0 Aluminum-doped cells before irradiation 0 A
Boron-doped cells after 10l6 e/cm2 Aluminum-doped cells after 10l6 e/cm2
I I I I L 7 3 ~ 40 50 60 70 80
Temperature, OC
(b) Open-circuit voltage, normalized to 32' C.
Figure 33.- Effect of temperature on shor t -c i rcu i t cu r ren t and open-circuit voltage of 10 ohm-cm boron- and aluminum-doped si l icon solar cells before and after irradiat ion wi th 2.4 MeV electrons.
51

'"I 0 Roron-dowd cells b e f o r e i r rad ia t ion \ \ c] Aluminum-doped c e l l s b e f o r e i r r a d i a t i o n 0 Boron-doped c e l l s a f t e r 10l6 e/cm2 A Aluminum-doped c e l l s a f t e r 10l6 e/cm2
8 .7 30 40 50 60 70
0 Tempera ture , C
(a) 1 ohm-cm solar cells.
0 Boron-doped c e l l s b e f o r e i r r a d i a t i o n
40 50 60 70
Tempera tu re , C 0
7 30
(b) 10 ohm-cm solar cells
Figure 34.- Effect of temperature on maximum power of boron- and aluminum-doped si l icon solar cells before and after irradiation w i th 2.4 MeV electrons.
52

H -0 .f 0, N -I ~.
0 Boron-doped cells before irradiation 3 Aluminum-doped cells before irradiation 0 Boron-doped cells after irradiation A Aluminum-doped cells after irradiation
.rl d m E z .7 0
.5 f , 30 40 1 I 50 I I 60 1 I 70 I A 80
Temperature, OC
(a) 1 ohm-cm solar cells.
0 Boron-doped cells before irradiation Aluminum-doped cells before irradiation
0 Boron-doped cells after irradiation Aluminum-doped cells after irradiation
I I I I I I I I d 4 0 50 60 70 80
Temperature, OC
(b) 10 ohm-cm solar cells.
Figure 35.- Effect of temperature on load c u r r e n t at '0.25 volt before and after i r radiat ion w i th 22 MeV protons.
53

&J 1.0 73 al N
.9 Q Boron-doped cells before irradiation -4 4
m 0 Aluminum-doped cells before irradiation 0 E 0 Boron-doped cells after irradiation
.0 A Aluminum-doped cells after irradiation
80 .7 30 40 50 60 70
Temperature, OC
(a) 1 ohm-cm solar cells.
m E
0 B ron-d ped cells before irradiation 0 Aluminum-doped cells before irradiation 0 Boron-doped cells after irradiation A Aluminum-doped cells after irradiation
0
80 .5 30 L'll 40 50 60 70 I
0 Temperature, C
(b) 10 ohm-cm solar cells.
Figure 36.- Effect of temperature on load cu r ren t at 0.3 volt before and after irradiat ion wi th 22 MeV protons.
54

1.0
.9
.8
.7
L
bl H
P
.on-doped cells before irradiation \
- Aluminum-doped cells before irradiation -led cells after irradiation
'"I Aluminum-doped cells after irradiation
I 80
. 5 t l ! I I I ! - I 30 40 50 60 70
Temperature, OC
(a) 1 ohm-cm solar cells.
before irradiation 0 Aluminum-doped cells
before irradiation 0 Boron-doped cells
after irradiation
Temperature, OC
(b) 10 ohm-cm solar cells.
Figure 37.- Effect of temperature on load current at 0.35 volt before and after irradiation with 22 MeV protons.
55
I

.8
l : E E .7
.8
l : E E .7
. 3 .4 :E 30
0 Boron-doped cells before irradiation
0 Aluminum-doped cells before irradiation
0 Boron-doped cells after irradiation
A Aluminum-doped cells after irradiation
1 - 1 70 3 00
Temperature, OC
(a) 1 ohm-cm solar cells.
0 Boron-doped cells before irradiation
0 Aluminum-doped cells before irradiation :[ .5 , 1 0 BorLlls after irradiation 1
Aluminum-doped cells .4
I after irradiation .- 30 40 50 60 70 00
Temperature, OC
(b) 10 ohm-cm solar cells.
Figure 38.- Effect of temperature on load cur ren t at 0.4 volt before and after irradiation w i th 22 MeV protons.
56

H
-0
.: .8 m 0 Boron-doped ce l l s b e f o r e i r r a d i a t i o n
0' Boron-doped ce l l s a f t e r 10l6 e/cm2 .g .7 !Zl Aluminum-doped c e l l s b e f o r e i r r a d i a t i o n
Aluminum-doped ce l l s a f t e r 1d6 e/cm2
I I I - 30 40 50 60 70
.5
Tempera ture , OC
(a) 1 ohm-cm solar cells.
, - , . ,- . . .- , , . , 'I 1
L- -0 Q, N -* .8 4
m
0 E 0 Boron-doped c e l l s b e f o r e i r r a d i a t i o n
Aluminum-doped c e l l s b e f o r e i r r a d i a t i o n 0 Boron-doped c e l l s a f t e r e/cm2 A Aluminum-doped c e l l s a f t e r 10l6 e/cm2
.6
I - - I 1 I . I -_ - t I I I... 50 60 70 40
.5 30
~ 80
-L "i 80
0 Tempera ture , C
(b) 10 ohm-cm solar cells.
Figure 39.- Effect of temperature on load c u r r e n t at 0.25 volt before and after irradiation w i th 2.4 MeV electrons.
57
I

H
-0 a, N
m E 0
frl 4
0 Boron-doped c e l l s b e f o r e i r r a d i a t i o n Aluminum-doped c e l l s b e f o r e i r r a d i a t i o n
0 Boron-doped c e l l s a f t e r 1 O I 6 e/cm2 A Aluminum-doped c e l l s a f t e r 10l6 e/cm2
I 70
1 I--_ -. I " . I 40 50 60 .s 30
J H
72 a, N
Tempera tu re , O C
(a) 1 ohm-cm solar cells.
r -8- 0 Boron-doped c e l l s b e f o r e i r r a d i a t i o n
i i Aluminum-doped c e l l s b e f o r e i r r a d i a t i o n
a f t e r 1016 ejcm2
a f t e r lop6 e/cm-
.7& 0 Boron-doped c e l l s
A Aluminum-do ed cel4.s .6, t 1
I I I ' - [ I ! I I I . 30 40 60 70 50
Tempera ture , OC
.3
80
1 .
(b) 10 ohm-cm solar cells.
Figure 40.- Effect of temperature on load cu r ren t at 0.3 volt before and after irradiat ion w i th 2.4 MeV electrons.
58
. . .

.e 4 0 B &I 0 z before i r r a d i a t i o n
30 40 50 60 70 80 Temperature, C 0
(a) 1 ohm-cm solar cells.
Temperature, OC
(b) 10 ohm-cm solar cells.
Figure 41.- Effect of temperature on load c u r r e n t at 0.35 volt before and after irradiat ion wi th 2.4 MeV electrons.
59
d H
'E) a, N .r( 3 m
0 z E
cl h
P 0, N .i - m
0 z E
b e f o r e i r r a d i a t i o n
b e f o r e i r r a d i a t i o n 0 Aluminum-doped ce l l s
0 Boron-doped c e l l s
I ! 40 50 60 70
Tempera ture , OC
(a) 1 ohm-cm solar cells.
-7F \\ 0 Boron-doped c e l l s
b e f o r e i r r a d i a t i o n
b e f o r e i r r a d i a t i o n Aluminum-doped c e l l s
0 Boron-doped c e l l s a f t e r 1016 e/"
0 Aluminum-do ed c e l l s a f t e r l op6 .4
!L', I I I I 1 1 . . 3 t - - 1 40 50 6 0 70 30
0 Tempera ture , C
80
(b) 10 ohm-cm solar cells.
Figure 42.- Effect of temperature on load c u r r e n t at 0.4 volt before and after i r radiat ion with 2.4 MeV electrons.
60

- =
tJ E al V k al R
aJ v)
E 0 R v)
Q, k
m k tJ V Q, a
Q, > .r(
c, m 4 al m
3
v)
Wavelength, microns
Figure 43.- Relative spectral response (for constant spectral energy input) of a 10 ohm-cm aluminum-doped si l icon solar cell before and after irradiation.

0 0 S o l a r s i m u l a t o r
Tungsten (2800' K black-body t e m p e r a t u r e )
- Space s u n ( r e f . 12)
Wavelength, microns
Figure 44.- Relative spectral radiant power of several l ight sources.

e-
al bl
3
al p:
Wave l e n g t h , microns
Figure 45.- Spectral response of a 10 ohm-cm aluminum-doped silicon solar cell (under tungsten i l lumination) before and after irradiation wi th 2.4 MeV electrons.
m w

14 - Electron flux, e/cm 2
12
10
8
6
4
2
0
L
I
-
._
-
.4 . 5 .6 . 7 . 0 .9 1 . 0 1.1 1 . 2
Wavelength, microns
Figure 46.- Spectral response of a 10 ohm-cm aluminum-doped silicon solar cell (under solar-simulator i l lumination) before and after irradiation w i th 2.4 MeV electrons.

e---
e, > ..+ c, m
wavelength, microns
2 Electron flux, e/cm
Figure 47.- Spectral response of a 10 ohm-cm aluminum-doped silicon solar cell (calculated for zero-air-mass sun il lumination) before and after irradiation wi th 2.4 MeV electrons.

1.8 I I I I I I I
Tungsten t o space sunl ight ----- Simulator t o space sunl ight 0 10 ohm-cm aluminum-doped c e l l s 0 10 ohm-cm boron-doped c e l l s 0 1 ohm-cm aluminum-doped c e l l s
1 ohm-cm boron-doped c e l l s k 0
1.
&-@-Q _/-- -#--- 0 -pgim- I - I
9 0 8 0 7 0 6 0 s o 40 100
Percent of i n i t i a l Is, as measured under each l i g h t source.
Figure 48.- Conversion of short-c i rcui t cur ren t output of silicon solar cells from space-sunlight-equivalent tungsten i l luminat ion and space-sunlight-equivalent simulator i l lumination to space sunl ight i l lumination.
c

l1l11lll I I I I I1 I I I1 I I II
National Aeronautics and Space Administration WASHINGTON, D. C.
OFFICIAL BUSINESS
FIRST CLASS MAIL I POSTAGE AND FEES PAID NATIONAL AERONAUTICS AND
SPACE A D M X " T I O N
POSTMASTER: If Undeliverable (Section 158 Postal Manual) Do Not Return
"The aeronautical and space activities of the United States shall be conducted so as to contribute . . . to the expansion of human knowl- edge of phenomena in the atmosphere and space. The Administration shall provide for the widest practicable and appropriate diJsemination of information concerning its activities and the results thereof ."
-NATIONAL AERONAUTICS AND SPACE ACT OF 1958
NASA SCIENTIFIC AND TECHNICAL PUBLICATIONS
N AT
TECHNICAL REPORTS: Scientific and technical information considered important, complete, and a lasting contribution to existing .knowle&e.
TECHNICAL NOTES: Information less broad in scope but nevertheless of importance as a contribution to existing knowledge.
TECHNICAL MEMORANDUMS: Information receiving limited distribu- tion because of preliminary data, security classification, or other reasons.
CONTRACTOR REPORTS: Scientific and technical information generated under a NASA contract or grant and considered an important contribution to existing knowledge.
TECHNICAL TRANSLATIONS: Information published in a foreign language considered to merit NASA distribution in English.
SPECIAL PUBLICATIONS: activities. compilations, handbooks, sourcebooks, and special bibliographies.
TECHNOLOGY UTILIZATION PUBLICATIONS; Information on tech- nology used by NASA that may be of particular interest in commercial and other non-aerospace applications. Publications include Tech Briefs, Technology UtiIization Reports and Notes, and Technology Surveys.
Information derived from or of value to NASA Publications include conference proceedings, monographs, data
h a i l s on the availability of these publications may be obtained from:
SCIENTIFIC AND TECHNICAL INFORMATION DIVISION
ONAL AERONAUTICS AND SPACE ADM
Washington, D.C. PO546
N I STR AT IO N
I