effects of leading edge erosion on wind turbine blade...
TRANSCRIPT

WIND ENERGY
Wind Energ. 2014; 17:1531–1542
Published online 12 July 2013 in Wiley Online Library (wileyonlinelibrary.com). DOI: 10.1002/we.1649
RESEARCH ARTICLE
Effects of leading edge erosion on wind turbineblade performanceAgrim Sareen, Chinmay A. Sapre and Michael S. Selig
Department of Aerospace Engineering, University of Illinois at Urbana-Champaign, Urbana, IL 61801, USA
ABSTRACT
This paper presents results of a study to investigate the effect of leading edge erosion on the aerodynamic performanceof a wind turbine airfoil. The tests were conducted on the DU 96-W-180 wind turbine airfoil at three Reynolds numbersbetween 1 million and 1.85 million, and angles of attack spanning the nominal low drag range of the airfoil. The airfoil wastested with simulated leading edge erosion by varying both the type and severity of the erosion to investigate the loss inperformance due to an eroded leading edge. Tests were also run with simulated bugs on the airfoil to assess the impact ofinsect accretion on airfoil performance. The objective was to develop a baseline understanding of the aerodynamic effectsof varying levels of leading edge erosion and to quantify their relative impact on airfoil performance. Results show thatleading edge erosion can produce substantial airfoil performance degradation, yielding a large increase in drag coupledwith a significant loss in lift near the upper corner of the drag polar, which is key to maximizing wind turbine energyproduction. Copyright © 2013 John Wiley & Sons, Ltd.
KEYWORDS
wind turbine; leading edge erosion; performance; aerodynamics
Correspondence
Michael S. Selig, Department of Aerospace Engineering, University of Illinois at Urbana-Champaign, Urbana, IL 61801, USA.E-mail: [email protected]
Received 25 March 2012; Revised 22 May 2013; Accepted 3 June 2013
1. INTRODUCTION
Wind turbine blades are exposed to precipitation that occurs in a variety of forms and myriad abrasive airborne particles thatcan, over time, erode their surfaces, particularly at the leading edge. These airborne particles can cause significant bladeerosion damage that reduces aerodynamic performance and hence, energy capture. Moreover in some environments, insectdebris and other airborne particles can accrete on the leading edges of wind turbine blades. Leading edge blade erosionand debris accretion and contamination can dramatically reduce blade performance particularly in the high-speed rotor tipregion that is crucial to optimum blade performance and energy capture.
The erosion process on wind turbine blades typically starts with the formation of small pits near the leading edge, whichincrease in density with time and combine to form gouges. If left to the forces of nature, the gouges then grow in size anddensity, and combine to cause delamination near the leading edge. As an example, Figure 1 shows the extent of damagethat leading edge erosion can cause on wind turbine blades in service. Figure 1(a) shows a blade with pits and gouges nearthe leading edge, whereas Figure 1(b) shows a much older blade with delamination over the entire leading edge.
Although the detrimental nature of leading edge erosion is well known across the industry, few efforts have been madeto quantify the effect of erosion on wind turbine performance. Previous studies1–7 have been focused on the accretion ofice, dust, insect debris and leading edge roughness in general on wind turbine blades and not on blade erosion. Addition-ally, a majority of these studies have been qualitative in nature with not much data presented on the effect of the accretionon wind turbine performance. Nearly all previous studies8,9 dealing with erosion have used a roughness strip or a zigzagtape applied near the leading edge of the airfoil to simulate surface contamination. Although this approach is widely usedbecause of its simplicity, it does not accurately model leading edge erosion on an actual wind turbine blade, where theshape modification is actually ‘negative’, that is, eroded away.
The objective of this study was to test a wind turbine airfoil with shape modifications to simulate leading edge erosiongoing through the evolutionary stages of development. The surface erosion was modeled by observing photographic records
Copyright © 2013 John Wiley & Sons, Ltd. 1531

Effects of leading edge erosion A. Sareen, C. A. Sapre and M. S. Selig
(a) (b)
Figure 1. Photographs of wind turbine blades affected by leading edge erosion with (a) pits and gouges, and (b) leading edgedelamination (courtesy of 3M).
of wind turbine blades in operation and eroded blades undergoing repair. The goal was to develop a baseline understandingof the aerodynamic effects of various types and magnitudes of leading edge erosion and to quantify their relative impact onairfoil performance. The ultimate aim of conducting the study was to examine the potential detrimental effects of leadingedge erosion and consequently, the need for continued development of erosion mitigation strategies.
2. APPROACH AND EXPERIMENTAL METHODS
2.1. Wind tunnel facility
Testing was conducted in the University of Illinois at Urbana-Champaign low-turbulence subsonic wind tunnel shownschematically in Figure 2. The wind tunnel is an open-return type with a 7.5:1 contraction ratio. The rectangular test sec-tion is 0.853�1.219 m (2.8�4.0 ft) in cross section and 2.438 m (8 ft) long. Over the length of the test section, the widthincreases by approximately 1.27 cm (0:5 in) to account for boundary-layer growth along the wind tunnel side walls. Test-section speeds are variable up to 71.53 m/s (160 mph) via a 93.25 kW (125 hp) alternating-current electric motor driving afive-bladed fan. The tunnel settling chamber contains a 10.16 cm (4 in) thick honeycomb and four anti-turbulence screens.The maximum Reynolds number that can be reached is 4.92 million/m (1.5 million/ft).
The airspeed and dynamic pressure in the test section were determined by static pressure measurements in the windtunnel contraction. Ambient pressure was measured with an absolute pressure transducer. Ambient temperature was mea-sured with a thermocouple. The axial force, normal force and pitching moment of the airfoil were measured using athree-component external force and moment balance mounted underneath the test section. The model was mounted withthe spanwise axis in the vertical direction.
Lift and drag were calculated from the normal and axial forces, but a more accurate drag value was determined fromwake rake measurements. The rake contained 59 total pressure probes over a total width of 24.77 cm (9:75 in). Sevenprobes on each of the outer sides of the rake were spaced 6.86 mm (0:27 in) apart, and the remaining inner 45 probes were
Silencer
FanDiffuser
Test Section
Inlet
Figure 2. Schematic of the University of Illinois at Urbana-Champaign low-turbulence subsonic wind tunnel.
1532Wind Energ. 2014; 17:1531–1542 © 2013 John Wiley & Sons, Ltd.
DOI: 10.1002/we

A. Sareen, C. A. Sapre and M. S. Selig Effects of leading edge erosion
spaced 3.43 mm (0:135 in) apart. Eight spanwise wake profiles were measured for each angle of attack starting 10.16 cm(4 in) above and ending 7.62 cm (3 in) below center span, and the resulting local drag values were averaged. Only wakerake drag measurements are reported in this paper. All measurements were corrected for wind tunnel effects and validatedby comparing data taken for an S809 airfoil model with data taken at Delft and The Ohio State University.1
2.2. Erosion models and test plan
The first step in modeling erosion was to understand how erosion develops on wind turbine blades, for which photographsof eroded blades provided by 3M were used. The photographic data set collected by 3M from wind power plant operatorscovered a range of rotor blade sizes (up to and including megawatt-scale rotors) that had been in operation for 1 year to10+ years. The photographs revealed that the erosion process starts with the formation of small pits near the leading edgeof the blade. As the density of the pits increases with time, they combine to form larger and deeper gouges. This processcontinues until it ultimately results in delamination centered around the leading edge. The delamination, which starts at theleading edge and grows in its chordwise extent with time, is the final stage of the erosion process. Two important obser-vations were made from the photographs and available literature. Firstly, the density of pits and gouges is maximum nearthe leading edge and decreases in the chordwise direction. Secondly, there is greater impingement (and therefore greatererosion) on the lower surface because the local average angle of attack is positive for a wind turbine in operation.
Based on the above erosion process, the wind tunnel model was tested with three different types of erosion features:pits, gouges and leading edge delamination. Tests were first run with pits (Type A), then with pits and gouges (Type B)and finally with pits, gouges and leading edge delamination (Type C) to simulate the erosion process. The degree of eachtype of erosion was also varied in stages, with each successive stage having approximately twice the number of pits andgouges and twice the extent of delamination as the previous one. The size (depth and diameter) and chordwise extent of thepits, gouges and leading edge delamination were based on scaled-down estimates obtained from the photographs of erodedwind turbine blades provided by 3M (Table I). The depth of the pits, gouges and leading edge delamination was set to be0.51 mm (0.02 in), 2.54 mm (0.10 in) and 3.81 mm (0.15 in), respectively. The average diameter of the pits and gouges wasset to be the same as the depth. To account for the differences in the magnitude and chordwise extent of the erosion featureson the upper as compared with the lower surface, a ratio of 1:1.3 was used. The ratio was chosen based on observationsfrom the photographic data. Based on this ratio, the chordwise extent of the pits and gouges was fixed for all cases at s=c �10% on the upper surface and s=c � 13% on the lower surface, and the number of pits and gouges on the lower surfacewas set to be 1.3 times that on the upper surface. Using the same ratio, the extent of the leading edge delamination was setto s=c � 1%, 2% and 3% on the upper surface and s=c � 1.3%, 2.6% and 3.9% on the lower surface.
Table II shows the test matrix listing the number of pits and gouges (over the entire model span) and the degree ofleading edge delamination on the upper surface of the wind tunnel model for each case (type and stage) tested. As men-tioned previously, the number of pits and gouges on the lower surface was 1.3 times those for the upper surface listed inTable II. Moving left-to-right in the table progresses from one type of erosion to the next and moving down along a columnprogresses from a lower to higher stage (higher degradation). The number of pits (P ), number of gouges (G) and extentof delamination (DL) for each case is separated with a slash and listed in the aforementioned order. For example, theType C/Stage 3 (C3) erosion case had 400 pits and 200 gouges on the upper surface (520 pits and 260 gouges on the lowersurface) and light leading edge delamination. Similarly, the Type C/Stage 4 (C4) case had 800 pits and 400 gouges on theupper surface (1040 pits and 520 gouges on the lower surface) and moderate leading edge delamination. Each configuration
Table I. Specifications of the nominal erosion features.
Feature Depth/Diameter Leading edge coverage
Pits (P) 0.51 mm (0.02 in) 0–50.8 mm (0–2 in)Gouges (G) 2.54 mm (0.10 in) 0–50.8 mm (0–2 in)Delamination (DL) 3.81 mm (0.15 in) 0–4.57/9.14/18.29 mm (0–0.18/0.36/0.72 in)
Table II. Test matrix with the approximate number of pits (P), numberof gouges (G), and magnitude of leading edge delamination (DL) on the
upper surface of the erosion model for each case tested.
Type A Type B Type C
Stage 1 100P — —Stage 2 200P 200P/100G —Stage 3 400P 400P/200G 400P/200G/DLStage 4 — 800P/400G 800P/400G/DLCStage 5 — — 1600P/800G/DLCC
Wind Energ. 2014; 17:1531–1542 © 2013 John Wiley & Sons, Ltd.DOI: 10.1002/we
1533
Effects of leading edge erosion A. Sareen, C. A. Sapre and M. S. Selig
(type and stage) was tested at three Reynolds numbers: Re D 1,000,000, 1,500,000 and 1,850,000. All of the cases thatwere tested were representative of actual observations and based on erosion data and photographs from 3M.
The airfoil used for the tests was the DU 96-W-180. The DU 96-W-180 is an 18% thick airfoil designed at Delft Uni-versity, Netherlands.10 It was designed to be used at the 75% blade station. In addition to being used on wind turbines inoperation, it is actively used in wind energy research and found in literature.10–12 To fill the test matrix in Table II, twowind tunnel models were used for the tests. The models had a span of 0.851 m (33:5 in) with a 0.457 m (18 in) chord.Erosion was slowly applied to the models starting with Type A, and moving on to Type B and then Type C. After eachmodel was tested for a particular case, it was returned to the model shop, eroded to the next stage and re-tested. Using thetwo wind tunnel models, the process continued until all the cases were covered.
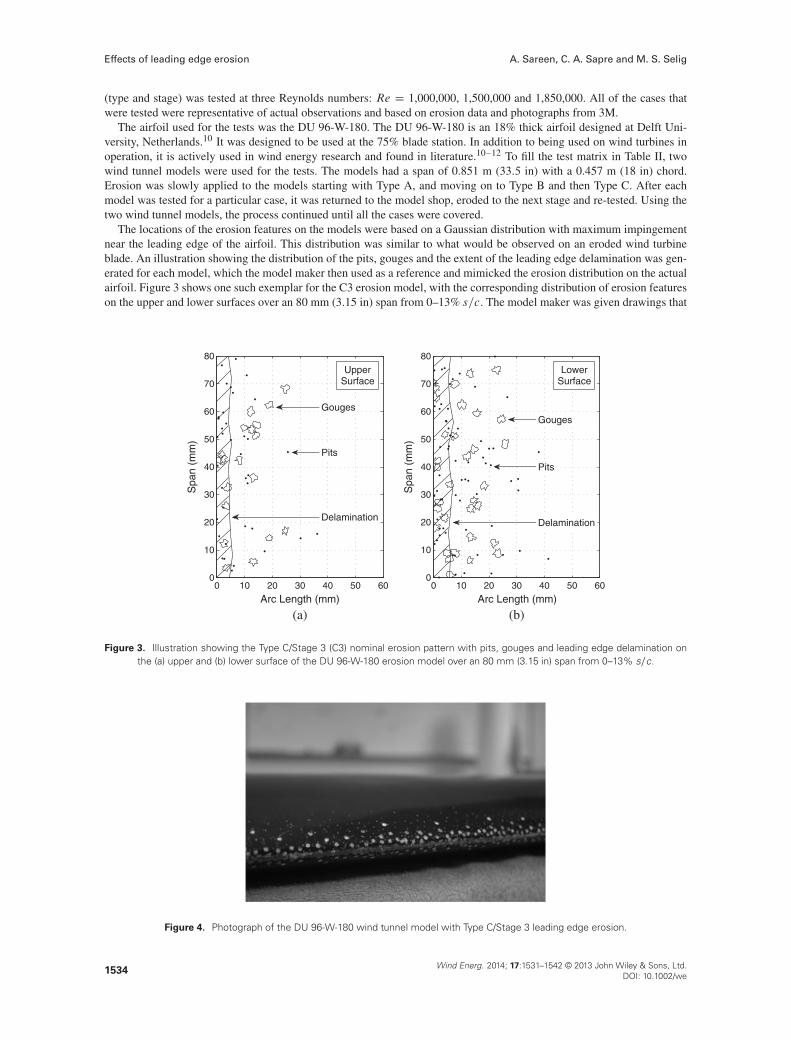
The locations of the erosion features on the models were based on a Gaussian distribution with maximum impingementnear the leading edge of the airfoil. This distribution was similar to what would be observed on an eroded wind turbineblade. An illustration showing the distribution of the pits, gouges and the extent of the leading edge delamination was gen-erated for each model, which the model maker then used as a reference and mimicked the erosion distribution on the actualairfoil. Figure 3 shows one such exemplar for the C3 erosion model, with the corresponding distribution of erosion featureson the upper and lower surfaces over an 80 mm (3.15 in) span from 0–13% s=c. The model maker was given drawings that
0 10 20 30 40 50 600
10
20
30
40
50
60
70
80
Arc Length (mm)
Spa
n (m
m)
Gouges
Pits
Delamination
UpperSurface
(a)
0 10 20 30 40 50 600
10
20
30
40
50
60
70
80
Arc Length (mm)
Spa
n (m
m)
Gouges
Pits
Delamination
LowerSurface
(b)
Figure 3. Illustration showing the Type C/Stage 3 (C3) nominal erosion pattern with pits, gouges and leading edge delamination onthe (a) upper and (b) lower surface of the DU 96-W-180 erosion model over an 80 mm (3.15 in) span from 0–13% s=c.
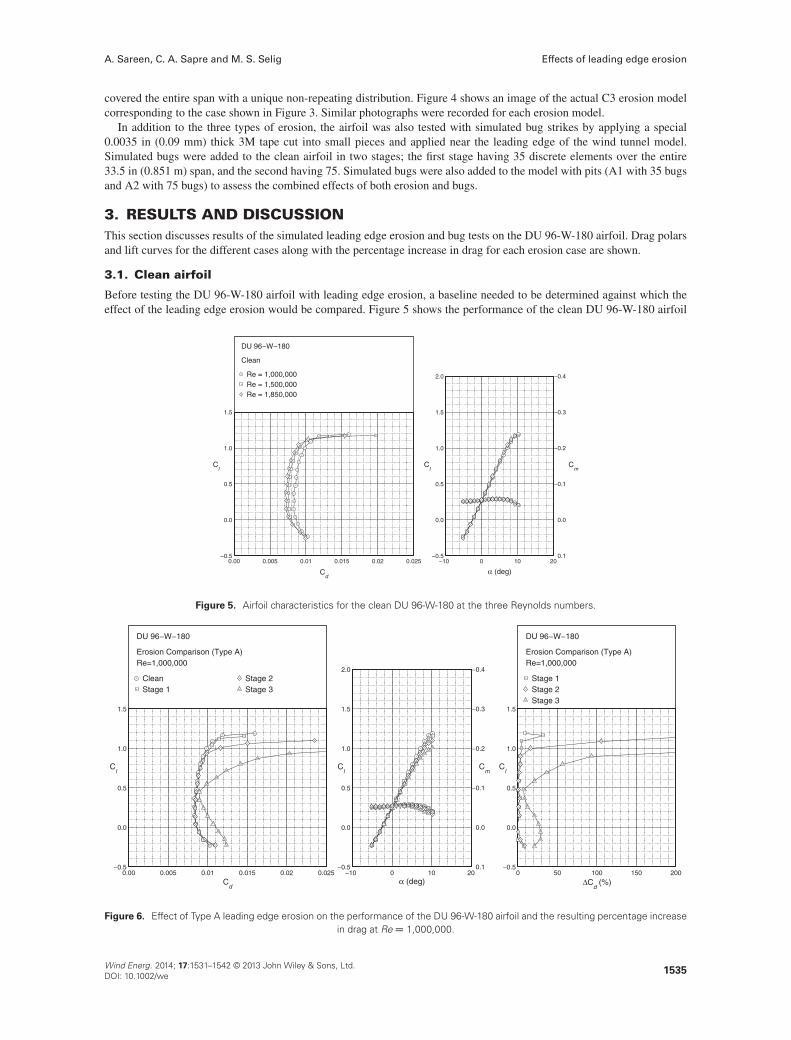
Figure 4. Photograph of the DU 96-W-180 wind tunnel model with Type C/Stage 3 leading edge erosion.
1534Wind Energ. 2014; 17:1531–1542 © 2013 John Wiley & Sons, Ltd.
DOI: 10.1002/we
A. Sareen, C. A. Sapre and M. S. Selig Effects of leading edge erosion
covered the entire span with a unique non-repeating distribution. Figure 4 shows an image of the actual C3 erosion modelcorresponding to the case shown in Figure 3. Similar photographs were recorded for each erosion model.
In addition to the three types of erosion, the airfoil was also tested with simulated bug strikes by applying a special0.0035 in (0.09 mm) thick 3M tape cut into small pieces and applied near the leading edge of the wind tunnel model.Simulated bugs were added to the clean airfoil in two stages; the first stage having 35 discrete elements over the entire33.5 in (0.851 m) span, and the second having 75. Simulated bugs were also added to the model with pits (A1 with 35 bugsand A2 with 75 bugs) to assess the combined effects of both erosion and bugs.
3. RESULTS AND DISCUSSIONThis section discusses results of the simulated leading edge erosion and bug tests on the DU 96-W-180 airfoil. Drag polarsand lift curves for the different cases along with the percentage increase in drag for each erosion case are shown.
3.1. Clean airfoil
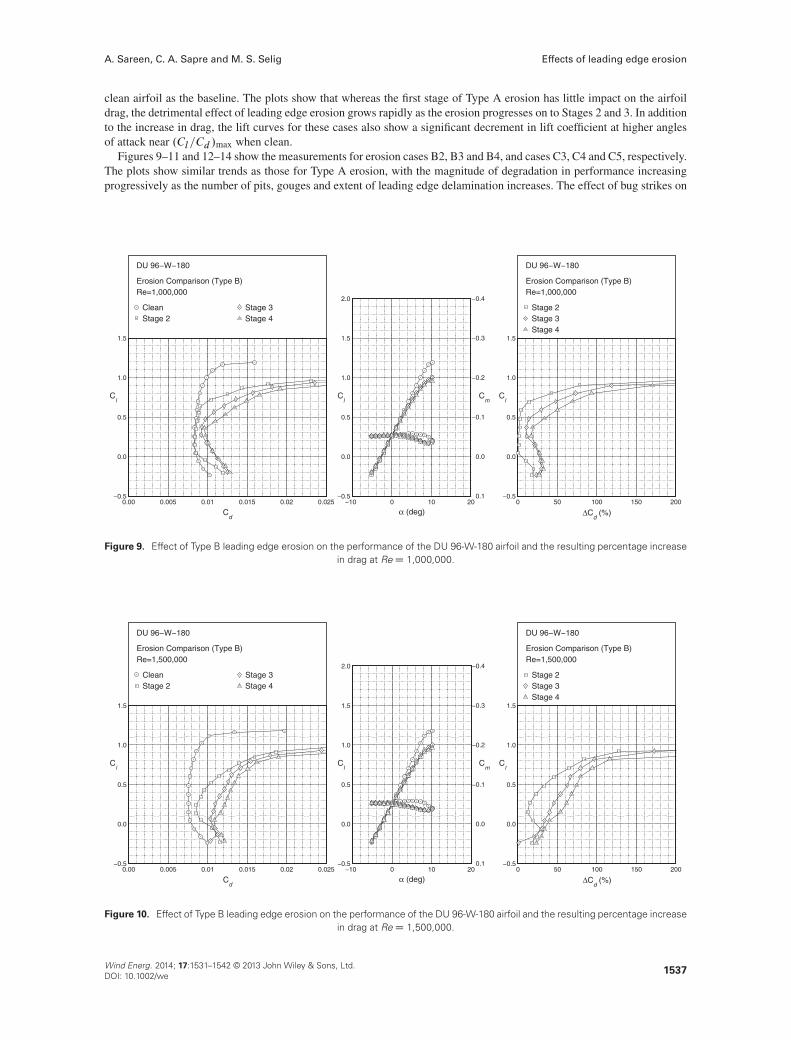
Before testing the DU 96-W-180 airfoil with leading edge erosion, a baseline needed to be determined against which theeffect of the leading edge erosion would be compared. Figure 5 shows the performance of the clean DU 96-W-180 airfoil
0.00 0.005 0.01 0.015 0.02 0.025−0.5
0.0
0.5
1.0
1.5
Cd
Cl
Re = 1,000,000Re = 1,500,000Re = 1,850,000
DU 96−W−180
Clean
−10 0 10 20−0.5
0.0
0.5
1.0
1.5
2.0
α (deg)
Cl
Cm
0.1
0.0
−0.1
−0.2
−0.3
−0.4
Figure 5. Airfoil characteristics for the clean DU 96-W-180 at the three Reynolds numbers.
0.00 0.005 0.01 0.015 0.02 0.025−0.5
0.0
0.5
1.0
1.5
Cd
Cl
CleanStage 1
Stage 2Stage 3
DU 96−W−180
Erosion Comparison (Type A)Re=1,000,000
−10 0 10 20−0.5
0.0
0.5
1.0
1.5
2.0
α (deg)
Cl
Cm
0.1
0.0
−0.1
−0.2
−0.3
−0.4
0 50 100 150 200−0.5
0.0
0.5
1.0
1.5
ΔCd (%)
Cl
Stage 1Stage 2Stage 3
DU 96−W−180
Erosion Comparison (Type A)Re=1,000,000
Figure 6. Effect of Type A leading edge erosion on the performance of the DU 96-W-180 airfoil and the resulting percentage increasein drag at ReD 1,000,000.
Wind Energ. 2014; 17:1531–1542 © 2013 John Wiley & Sons, Ltd.DOI: 10.1002/we
1535

Effects of leading edge erosion A. Sareen, C. A. Sapre and M. S. Selig
at the three Reynolds numbers. This data set provided the baseline used to measure the effect of leading edge erosion onthe airfoil performance.
3.2. Leading edge erosion
After testing the clean airfoil to obtain the baseline, the erosion models were each tested based on the previously discussedtest matrix (Table II). Figures 6–8 show the drag polar, lift curve and quarter-chord pitching moment coefficient for ero-sion models A1, A2 and A3 compared with the clean airfoil at the three Reynolds numbers. The figures also compare thepercentage increase in drag due to leading edge erosion for the three cases. The �Cd values were calculated by using the
0.00 0.005 0.01 0.015 0.02 0.025−0.5
0.0
0.5
1.0
1.5
Cd
Cl
CleanStage 1
Stage 2Stage 3
DU 96−W−180
Erosion Comparison (Type A)Re=1,500,000
−10 0 10 20−0.5
0.0
0.5
1.0
1.5
2.0
α (deg)
Cl
Cm
0.1
0.0
−0.1
−0.2
−0.3
−0.4
0 50 100 150 200−0.5
0.0
0.5
1.0
1.5
ΔCd (%)
Cl
Stage 1Stage 2Stage 3
DU 96−W−180
Erosion Comparison (Type A)Re=1,500,000
Figure 7. Effect of Type A leading edge erosion on the performance of the DU 96-W-180 airfoil and the resulting percentage increasein drag at ReD 1,500,000.
0.00 0.005 0.01 0.015 0.02 0.025−0.5
0.0
0.5
1.0
1.5
Cd
Cl
CleanStage 1
Stage 2Stage 3
DU 96−W−180
Erosion Comparison (Type A)Re=1,850,000
−10 0 10 20−0.5
0.0
0.5
1.0
1.5
2.0
α (deg)
Cl
Cm
0.1
0.0
−0.1
−0.2
−0.3
−0.4
0 50 100 150 200−0.5
0.0
0.5
1.0
1.5
ΔCd (%)
Cl
Stage 1Stage 2Stage 3
DU 96−W−180
Erosion Comparison (Type A)Re=1,850,000
Figure 8. Effect of the Type A leading edge erosion on the performance of the DU 96-W-180 airfoil and the resulting percentageincrease in drag at ReD 1,850,000.
1536Wind Energ. 2014; 17:1531–1542 © 2013 John Wiley & Sons, Ltd.
DOI: 10.1002/we
A. Sareen, C. A. Sapre and M. S. Selig Effects of leading edge erosion
clean airfoil as the baseline. The plots show that whereas the first stage of Type A erosion has little impact on the airfoildrag, the detrimental effect of leading edge erosion grows rapidly as the erosion progresses on to Stages 2 and 3. In additionto the increase in drag, the lift curves for these cases also show a significant decrement in lift coefficient at higher anglesof attack near .Cl=Cd /max when clean.
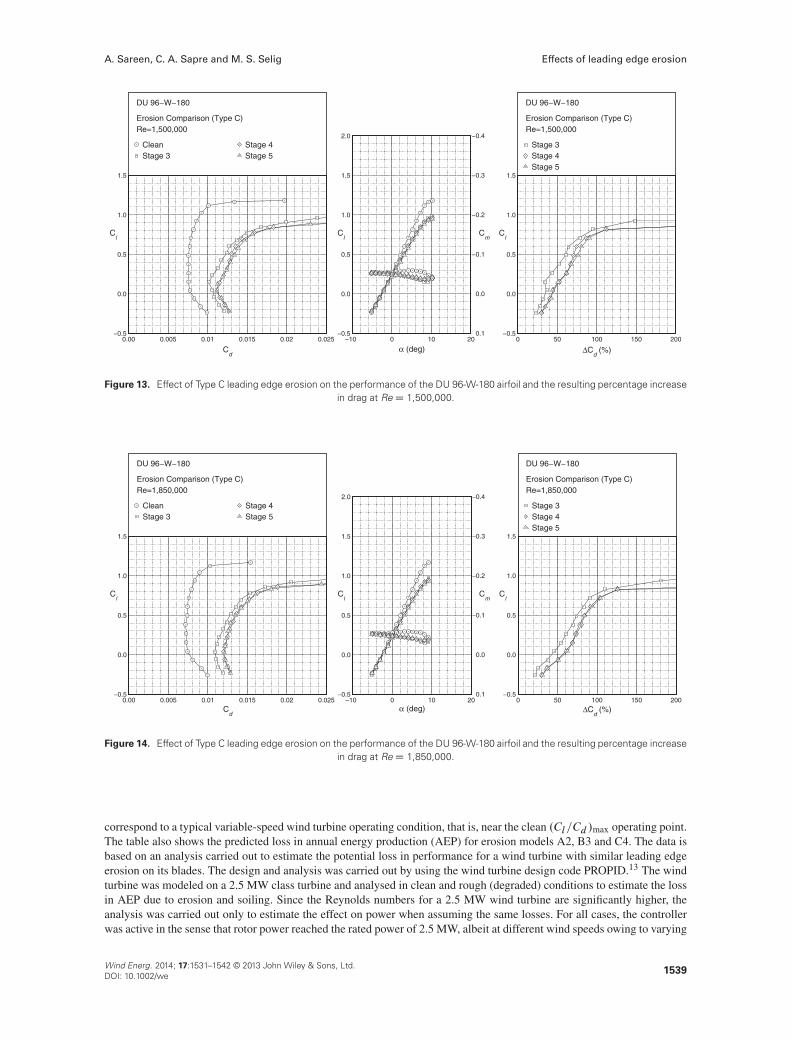
Figures 9–11 and 12–14 show the measurements for erosion cases B2, B3 and B4, and cases C3, C4 and C5, respectively.The plots show similar trends as those for Type A erosion, with the magnitude of degradation in performance increasingprogressively as the number of pits, gouges and extent of leading edge delamination increases. The effect of bug strikes on
0.00 0.005 0.01 0.015 0.02 0.025−0.5
0.0
0.5
1.0
1.5
Cd
Cl
CleanStage 2
Stage 3Stage 4
DU 96−W−180
Erosion Comparison (Type B)Re=1,000,000
−10 0 10 20−0.5
0.0
0.5
1.0
1.5
2.0
α (deg)
Cl
Cm
0.1
0.0
−0.1
−0.2
−0.3
−0.4
0 50 100 150 200−0.5
0.0
0.5
1.0
1.5
ΔCd (%)
Cl
Stage 2Stage 3Stage 4
DU 96−W−180
Erosion Comparison (Type B)Re=1,000,000
Figure 9. Effect of Type B leading edge erosion on the performance of the DU 96-W-180 airfoil and the resulting percentage increasein drag at ReD 1,000,000.
0.00 0.005 0.01 0.015 0.02 0.025−0.5
0.0
0.5
1.0
1.5
Cd
Cl
CleanStage 2
Stage 3Stage 4
DU 96−W−180
Erosion Comparison (Type B)Re=1,500,000
−10 0 10 20−0.5
0.0
0.5
1.0
1.5
2.0
α (deg)
Cl
Cm
0.1
0.0
−0.1
−0.2
−0.3
−0.4
0 50 100 150 200−0.5
0.0
0.5
1.0
1.5
ΔCd (%)
Cl
Stage 2Stage 3Stage 4
DU 96−W−180
Erosion Comparison (Type B)Re=1,500,000
Figure 10. Effect of Type B leading edge erosion on the performance of the DU 96-W-180 airfoil and the resulting percentage increasein drag at ReD 1,500,000.
Wind Energ. 2014; 17:1531–1542 © 2013 John Wiley & Sons, Ltd.DOI: 10.1002/we
1537

Effects of leading edge erosion A. Sareen, C. A. Sapre and M. S. Selig
0.00 0.005 0.01 0.015 0.02 0.025−0.5
0.0
0.5
1.0
1.5
Cd
Cl
CleanStage 2
Stage 3Stage 4
DU 96−W−180
Erosion Comparison (Type B)Re=1,850,000
−10 0 10 20−0.5
0.0
0.5
1.0
1.5
2.0
α (deg)
Cl
Cm
0.1
0.0
−0.1
−0.2
−0.3
−0.4
0 50 100 150 200−0.5
0.0
0.5
1.0
1.5
ΔCd (%)
Cl
Stage 2Stage 3Stage 4
DU 96−W−180
Erosion Comparison (Type B)Re=1,850,000
Figure 11. Effect of Type B leading edge erosion on the performance of the DU 96-W-180 airfoil and the resulting percentage increasein drag at ReD 1,850,000.
0.00 0.005 0.01 0.015 0.02 0.025−0.5
0.0
0.5
1.0
1.5
Cd
Cl
CleanStage 3
Stage 4Stage 5
DU 96−W−180
Erosion Comparison (Type C)Re=1,000,000
−10 0 10 20−0.5
0.0
0.5
1.0
1.5
2.0
α (deg)
Cl
Cm
0.1
0.0
−0.1
−0.2
−0.3
−0.4
0 50 100 150 200−0.5
0.0
0.5
1.0
1.5
ΔCd (%)
Cl
Stage 3Stage 4Stage 5
DU 96−W−180
Erosion Comparison (Type C)Re=1,000,000
Figure 12. Effect of Type C leading edge erosion on the performance of the DU 96-W-180 airfoil and the resulting percentage increasein drag at ReD 1,000,000.
the airfoil performance can be seen in Figures 15 and 16. Figure 15 shows the drag polar and lift curve for an airfoil withonly bugs. Figure 16 shows the combined effects of both bugs and leading edge erosion on the airfoil. The measurementsshow that bugs can also significantly degrade airfoil performance, both in terms of lift and drag.
3.3. Effects on wind turbine performance
Table III summarizes the detrimental effect of leading edge erosion on the performance of the DU 96-W-180 airfoil. Thetable lists the percentage increase in drag and the decrement in lift coefficient due to erosion for all cases tested. These losses
1538Wind Energ. 2014; 17:1531–1542 © 2013 John Wiley & Sons, Ltd.
DOI: 10.1002/we
A. Sareen, C. A. Sapre and M. S. Selig Effects of leading edge erosion
0.00 0.005 0.01 0.015 0.02 0.025−0.5
0.0
0.5
1.0
1.5
Cd
Cl
CleanStage 3
Stage 4Stage 5
DU 96−W−180
Erosion Comparison (Type C)Re=1,500,000
−10 0 10 20−0.5
0.0
0.5
1.0
1.5
2.0
α (deg)
Cl
Cm
0.1
0.0
−0.1
−0.2
−0.3
−0.4
0 50 100 150 200−0.5
0.0
0.5
1.0
1.5
ΔCd (%)
Cl
Stage 3Stage 4Stage 5
DU 96−W−180
Erosion Comparison (Type C)Re=1,500,000
Figure 13. Effect of Type C leading edge erosion on the performance of the DU 96-W-180 airfoil and the resulting percentage increasein drag at ReD 1,500,000.
0.00 0.005 0.01 0.015 0.02 0.025−0.5
0.0
0.5
1.0
1.5
Cd
Cl
CleanStage 3
Stage 4Stage 5
DU 96−W−180
Erosion Comparison (Type C)Re=1,850,000
−10 0 10 20−0.5
0.0
0.5
1.0
1.5
2.0
α (deg)
Cl
Cm
0.1
0.0
−0.1
−0.2
−0.3
−0.4
0 50 100 150 200−0.5
0.0
0.5
1.0
1.5
ΔCd (%)
Cl
Stage 3Stage 4Stage 5
DU 96−W−180
Erosion Comparison (Type C)Re=1,850,000
Figure 14. Effect of Type C leading edge erosion on the performance of the DU 96-W-180 airfoil and the resulting percentage increasein drag at ReD 1,850,000.
correspond to a typical variable-speed wind turbine operating condition, that is, near the clean .Cl=Cd /max operating point.The table also shows the predicted loss in annual energy production (AEP) for erosion models A2, B3 and C4. The data isbased on an analysis carried out to estimate the potential loss in performance for a wind turbine with similar leading edgeerosion on its blades. The design and analysis was carried out by using the wind turbine design code PROPID.13 The windturbine was modeled on a 2.5 MW class turbine and analysed in clean and rough (degraded) conditions to estimate the lossin AEP due to erosion and soiling. Since the Reynolds numbers for a 2.5 MW wind turbine are significantly higher, theanalysis was carried out only to estimate the effect on power when assuming the same losses. For all cases, the controllerwas active in the sense that rotor power reached the rated power of 2.5 MW, albeit at different wind speeds owing to varying
Wind Energ. 2014; 17:1531–1542 © 2013 John Wiley & Sons, Ltd.DOI: 10.1002/we
1539

Effects of leading edge erosion A. Sareen, C. A. Sapre and M. S. Selig
0.00 0.005 0.01 0.015 0.02 0.025−0.5
0.0
0.5
1.0
1.5
Cd
Cl
CleanStage 1
Stage 2
DU 96−W−180
Bugs ComparisonRe=1,500,000
−10 0 10 20−0.5
0.0
0.5
1.0
1.5
2.0
α (deg)
Cl
Cm
0.1
0.0
−0.1
−0.2
−0.3
−0.4
Figure 15. Comparison of the drag polar and lift curve of the clean DU 96-W-180 airfoil and airfoil with bugs at ReD 1,500,000.
0.00 0.005 0.01 0.015 0.02 0.025−0.5
0.0
0.5
1.0
1.5
Cd
Cl
CleanStage 1Stage 2
Stage 1 + BugsStage 2 + Bugs
DU 96−W−180
Erosion, Bugs Comparison (Type A)Re=1,500,000
−10 0 10 20−0.5
0.0
0.5
1.0
1.5
2.0
α (deg)
Cl
Cm
0.1
0.0
−0.1
−0.2
−0.3
−0.4
Figure 16. Comparison of the drag polar and lift curve of the clean DU 96-W-180 airfoil and erosion cases A1 and A2 with and withoutbugs at ReD 1,500,000.
degrees of degradation. The degradation in airfoil performance was applied along the entire blade, but the majority of theAEP loss shown in the the table primarily derives from the outer part of the blade. In the predictions, a Weibull wind speeddistribution (k D 2) was used.
The tabulated data shows that the measured loss in performance ranges from a 6-500% increase in drag going from lightto heavy erosion. The data also shows that the increase in drag is coupled with a significant loss in lift coefficient, whichwas measured to be as high as 0.17 for the worst case (C5). The AEP loss estimates reveal that even a small amount ofleading edge erosion can result in an annual energy loss of approximately 3–5%. The annual energy losses for the heavyerosion cases with pits, gouges and delamination can approach �25%, albeit somewhat less in actual application due to avariable distribution of erosion along the blade from hub to tip.
1540Wind Energ. 2014; 17:1531–1542 © 2013 John Wiley & Sons, Ltd.
DOI: 10.1002/we

A. Sareen, C. A. Sapre and M. S. Selig Effects of leading edge erosion
Table III. Effect of leading edge erosion on wind turbine blade performance as estimatedby PROPID.
Condition �Cd �ClAvg wind speed AEP loss AEP loss
m/s MWh/yr (%)
A1 C6% �0.07 — — —
A2 C80% �0.127.05 383 �4.857.93 392 �4.108.81 384 �3.49
A3 C150% �0.15 — — —B2 C150% �0.16 — — —
B3 C200% �0.147.05 902 �11.427.93 930 �9.738.81 917 �8.33
B4 C400% �0.15 — — —C3 C150% �0.16 — — –
C4 C400% �0.157.05 1,858 �23.537.93 1,948 �20.388.81 1,947 �17.68
C5 C500% �0.17 — — —
4. CONCLUSIONS
The DU 96-W-180 airfoil was tested with various types and magnitudes of leading edge erosion and simulated bug strikes.Results revealed that leading edge erosion can be significantly detrimental to airfoil performance. Data from the testsshowed a drag increase of 6–500% due to leading edge erosion (light-to-heavy erosion cases). Erosion also caused a sub-stantial reduction in lift coefficient, especially at the higher angles of attack that are experienced by wind turbines duringtheir operation. Similar to leading edge erosion, simulated bugs on the leading edge also resulted in a significant degrada-tion in airfoil performance. Based on the analysis performed using PROPID, it was estimated that an 80% increase in drag,which was caused by a relatively small degree of leading edge erosion, can result in�5% loss in annual energy production.For an increase in drag of 400–500% coupled with the loss in lift, as observed for many of the moderate-to-heavy erosioncases, this loss in annual energy production could be as high as�25%. These results shed light on the detrimental effect ofleading edge erosion and the need for erosion mitigation strategies. Methods that could reduce or eliminate leading edgeerosion would help prevent losses incurred due to the degradation in performance of wind turbine blades after just a fewyears in operation.
ACKNOWLEDGEMENTS
The authors wish to thank 3M Renewable Energy Division (St Paul, MN) for providing the funding for this research,sample test materials and data on wind turbine erosion and Jennifer L. Kamarainen and her 3M technical team for theircooperation that was instrumental in making this study possible. Also, Performance Composites, Inc. (Compton, CA) isthanked for allowing the inclusion of predictions of performance degradation due to erosion. Finally, the authors thankShreyas Narsipur for his help with the wind tunnel tests.
REFERENCES
1. Jasinski WJ, Noe SC, Selig MS, Bragg MB. Wind turbine performance under icing conditions. ASME Journal of SolarEnergy Engineering 1998; 120: 60–65.
2. Giguère P, Selig MS. Aerodynamic effects of leading-edge tape on airfoils at low Reynolds numbers. Wind Energy1999; 2: 125–136.
3. van Rooij RPJOM, Timmer WA. Roughness sensitivity considerations for thick rotor blade airfoils. AIAA Paper2003–352, Reno, NV, August 2003.
4. Fuglsang P, Bak C. Development of the Risø wind turbine airfoils. Wind Energy 2004; 7(2): 145–162.
Wind Energ. 2014; 17:1531–1542 © 2013 John Wiley & Sons, Ltd.DOI: 10.1002/we
1541

Effects of leading edge erosion A. Sareen, C. A. Sapre and M. S. Selig
5. Somers DM. The S814 and S815 airfoils, National Renewable Energy Laboratory, NREL/SR-500-36292, December2004.
6. Khalfallah MG, Koliub AM. Effect of dust on the performance of wind turbines. Desalination 2007; 209(1–3):209–220.
7. Bak C, Andersen PB, Madsen HA, Gaunaa M. Design and verification of airfoils resistant to surface contaminationand turbulence intensity. AIAA Paper 2008–7050, Honolulu, HI, August 2008.
8. Giguère P, Selig MS. New airfoils for small horizontal axis wind turbines. ASME Journal of Solar Energy Engineering1998; 120: 108–114.
9. Solanti MR, Brijandi AH. Effect of surface contamination on the performance of a section of a wind turbine blade.AIAA Paper 2007-1081, Reno, NV, January 2007.
10. Timmer WA, van Rooij RPJOM. Summary of the Delft University wind turbine dedicated airfoils. ASME Journal ofSolar Energy Engineering 2003; 125: 488–496.
11. Akay B, Ferreira CS, van Bussel GJW, Tescione G. Experimental investigation of the wind turbine blade root flow.AIAA Paper 2010–641, Orlando, FL, January 2010.
12. Sareen A, Deters RW, Henry SP, Selig MS. Drag reduction using riblet film applied to airfoils for wind turbines. AIAAPaper 2011–0558, Orlando, FL, January 2011.
13. Selig MS, Tangler JL. Development and application of a multipoint inverse design method for horizontal axis windturbines. Wind Engineering 1995; 19(2): 91–105.
1542Wind Energ. 2014; 17:1531–1542 © 2013 John Wiley & Sons, Ltd.
DOI: 10.1002/we