effects of l-carnitine on serum leptin and lipid …
TRANSCRIPT

Available Online through
www.ijpbs.com (or) www.ijpbsonline.com IJPBS |Volume 4| Issue 2|APR-JUN|2014|35-46
Research Article
Pharmaceutical Sciences
International Journal of Pharmacy and Biological Sciences (e-ISSN: 2230-7605)
Wahda Basheer Al-Youzbaki* et al Int J Pharm Bio Sci www.ijpbs.com or www.ijpbsonline.com
Pag
e35
EFFECTS OF L-CARNITINE ON SERUM LEPTIN AND LIPID PROFILE
IN ALLOXAN-INDUCED DIABETIC RABBIT
* Mohammed Daood Mahmood,** Wahda Basheer Al-Youzbaki,*** Bassam N. Aziz
*BSc Pharmacist; MSc Pharmacology, Assistant Lecturer, Department of Pharmacology,
College of Pharmacy - University of Mosul – Iraq **
MBChB ; MSc; PhD Pharmacology , Assistant Professor, Department of Pharmacology ,
College of Medicine - University of Mosul – Iraq.
*** BSc (Veterinary Medicine), MSc; PhD Physiology, Assistant Professor,
Department of Anesthesia, Mosul Technical Institute, University of Mosul – Iraq.
*Corresponding Author Email: [email protected]
ABSTRACT Objective: To evaluate the effect of L-carnitine supplementation on serum leptin, lipid profile and body weight
(BW) in alloxan- induced type 1 diabetes mellitus (T1DM) experimental animal model and to assess whether
adding L-carnitine to insulin in the treatment regimen of T1DM will have beneficial effects as adjuvant therapy.
Methodology: This is a Pharmacological Conventional Non Randomized Trial conducted on animals at the animal
room of the health departments of Technical Institute/ Mosul Fertility that belongs to Technical Institute of Mosul
/ Iraq, from the period of the 15th
of April 2011 to the 15th
of April 2013. A total of 36 apparently healthy adult
male rabbits of a local strains weighing between 980-1450 gm and 4–6 months of age were included in the study
and 24 of them were made diabetic via injection of alloxan monohydrate. Twelve healthy rabbits and 24 diabetic
rabbits were randomly allocated into 6 groups of 6 animals each, as follows: Group 1 (Healthy control + DW),
Group 2 (Healthy + L-carnitine), Group 3 (Diabetes + DW), Group 4 (Diabetes + Insulin), Group 5 (Diabetes + L-
carnitine) and Group 6 (Diabetes + L-carnitine + Insulin). The blood samples were collected from all groups three
times; Zero time (before induction of diabetes), Stage I (one month after diabetes induction) and Stage II (one
month after treatment) to measure serum leptin and lipid profile by commercial kits. Results: This study
demonstrated that administration of alloxan (SC) in a dose of (150mg/kg BW) had led to a significant increase in
serum levels of TC, TG and LDL-c whereas serum HDL-c, leptin and body weight decreased significantly.
Administration of L-carnitine (IM) in a dose of 500 mg/kg BW over a period of 30 days caused a significant
decrease in mean serum TC,TG and LDL-c level and significant increase in HDL-c but no significant variations in
mean serum leptin and BW in healthy and diabetic rabbits taking L-carnitine in comparison to healthy controls and
diabetics tacking DW, respectively. Administration of insulin SC in a dose of 10 IU to alloxan induced diabetic
rabbits, over a period of 30 days caused a significant increase in serum leptin and HDL-c serum level, but a
significant decrease in mean serum TC,TG and LDL-c level in comparison to stage I within the same diabetic animal
group. Administration of L-carnitine IM in a dose of 500mg /kg BW combined with insulin SC in a dose of 10 IU to
diabetic rabbits caused a more significant decrease in serum TC,TG and LDL-c level and a more significant increase
in HDL-c but no significant variations in serum leptin and BW in diabetic rabbits taking the two treatments in
comparison to diabetic rabbits taking insulin only.
Conclusion:
Based on current research it can be concluded that L-carnitine supplementation may have a beneficial effects in
ameliorating diabetic complications as an adjuvant therapy to insulin.
KEY WORDS: carnitine, leptin, lipid profile, body weight.
Available Online through
www.ijpbs.com (or) www.ijpbsonline.com IJPBS |Volume 4| Issue 2 |APR-JUN|2014|35-46
International Journal of Pharmacy and Biological Sciences (e-ISSN: 2230-7605)
Wahda Basheer Al-Youzbaki* et al Int J Pharm Bio Sci www.ijpbs.com or www.ijpbsonline.com
Pag
e36
INTRODUCTION
Although insulin has became one of the most
important therapeutic agents known to medicine to
treat diabetes mellitus, the search for compounds
with novel properties to deal with the disease
condition is still in progress and there is a continuing
effort to find insulin substitutes, secretagogues,
adjuvant or sensitizers from synthetic or plant sources
for the treatment of diabetes1.
Carnitine is an endogenous amino acid derivative
which plays a key role in energy metabolism,
produced in the kidneys and liver using amino acids L-
lysine and L-methionine, as substrates2
and derived
from meat and dairy products in the diet3. Carnitine
transports long-chain acyl groups from fatty acids into
the mitochondrial matrix, so they can be broken
down through β-oxidation to acetyl CoA to obtain
usable energy via the citric acid cycle4. Carnitine
supplementation has been recently approved by the
US Food and Drug Administration (FDA) not only for
the treatment, but also for the prevention of carnitine
depletion, therefore carnitine is considered as
essential micronutrient5.
Patients with diabetes (particularly those who are
insulin dependent or have disease-related
complications) seem to be at increased risk for
carnitine deficiency 6. The decrease in carnitine level
may be attributed to insulin deficiency, excess
glucagons7, increased urinary excretion of carnitine in
diabetic patients compared to controls8. Moreover,
recent evidence suggested that carnitine
requirements increase under conditions of sustained
metabolic stress such as in DM and had linked
carnitine deficiency with developing insulin resistance
due to intracellular accumulation of acyl-CoA
derivatives9.
As yet, studies investigating the effect of carnitine
supplementation on serum leptin, lipid profile, and
body weight in T1DM are very little or absent, not
only in the human but also in the experimental
animals10
.
The aim of this study was to assess the effect of L-
carnitine supplementation serum leptin, lipid profile
(TC, TG, LDL-c, HDL-c), and body weight in T1DM
experimental animals and to assess whether adding L-
carnitine to insulin in the treatment regimen of T1DM
will have beneficial effects as adjuvant therapy.
Animals and Methods
The approval of the study protocol by an ethic
committee has been obtained from the local health
committee of College of Medicine – University of
Mosul – Iraq.
This is an Pharmacological Conventional Non
Randomized Trial conducted on animals in the animal
room of the Health Departments of Technical
Institute/ Mosul, Foundation of Technical Education
from 15th
April 2011 to 15th
April 2013. A total of 36
apparently healthy adult male rabbits of a local
strains weighing between 980-1450 gm and 4–6
months of age which were obtained from local
market and housed in animal room of the health
departments of Technical Institute/ Mosul. Animals
kept in metal mesh cages (50x50x60 cm), in small (6
rabbits/cage) groups per cage at room temperature
and allowed free access to tap water and food (green
grasses and laboratory chow). Antihelmintic drug
(Ivermectin 2mg/kg) subcutaneously was given to act
against internal and external parasites. All the animals
were observed for 30 days before the beginning of
the experiment to acclimatize under the same
laboratory conditions (temperature, light, and
humidity) and to exclude any possibility of abnormal
behavior and disease12
.
Diabetes was induced in a total of 24 overnight fasted
rabbits by injection of alloxan monohydrate which
was dissolved in sterile physiological saline solution
immediately before being used at a dose of (150mg /
kg BW). Alloxan can induce fatal hypoglycemia as a
result of massive pancreatic insulin release and to
avoid the hypoglycemic shock, the animals were
provided with 5% dextrose solution after 6 h of
alloxan treatment. Induction of diabetes was tested
after 72 h and the animals were allowed one week for
the stabilization of blood glucose level. At seventh
day, animals having a blood glucose level higher than
300 mg/dl were considered diabetic and used for the
for the study. The diabetic state was monitored by
periodic tests for hyperglycemia by colorimetric assay
along the next 30 days.
Available Online through
www.ijpbs.com (or) www.ijpbsonline.com IJPBS |Volume 4| Issue 2 |APR-JUN|2014|35-46
International Journal of Pharmacy and Biological Sciences (e-ISSN: 2230-7605)
Wahda Basheer Al-Youzbaki* et al Int J Pharm Bio Sci www.ijpbs.com or www.ijpbsonline.com
Pag
e37
After a period of one month, twelve healthy rabbits
and 24 diabetic rabbits were allocated into 6 groups
of 6 animals each, as follows:
1. Six healthy rabbits were given distilled water
(IM) once daily for one month period, served
as control group.
2. Six healthy rabbits were given 500mg /kg BW
of L-carnitine (IM) once daily for one month
period.
3. Six diabetic rabbits were given distilled water
(IM) once daily for one month period, served
as control group.
4. Six diabetic rabbits were given 500mg /kg
BW of L-carnitine (IM) once daily for one
month period.
5. Six diabetic rabbits were given 10 IU/Kg BW
insulin SC once daily for one month period.
6. Six diabetic rabbits were given both 500mg
/kg BW of L-carnitine (IM) and 10 IU/Kg BW
insulin SC once daily for one month period.
Blood Sampling were performed three times for all
groups as the following:
1. When all groups are normally healthy after
one month of acclimatization under the
same laboratory conditions (temperature,
light, and humidity) and to exclude any
possibility of abnormal behavior and disease
11.
2. After one month of establishment of
diabetes mellitus taking in consideration the
normal physiological changes in the control
groups.
3. After one month of drug administration.
Blood samples (5 ml) were drawn after an overnight
fasting healthy control and diabetic rabbits. All
rabbits were lightly anesthetized with ketamine
hydrochloride 30 mg/kg and xylazine 3 mg/kg IM.
Intracardial puncture was performed and 5 ml blood
was pooled into a clean dry plain tube without
anticoagulant. Serum samples obtained were stored
at -20○C to be analyzed thereafter for measuring of:
1. Serum TC was measured, using the
enzymatic colorimetric method by UV-VIS
Spectrophotometer instrument, and TC kit
from (BIOLABO), France.
2. Serum TG was measured, using the
enzymatic colorimetric method by UV-VIS
Spectrophotometer instrument, and TG kit
from (BIOLABO), France.
3. Serum HDL-c was measured, using the
enzymatic colorimetric method by UV-VIS
Spectrophotometer instrument, and HDL-c
kit from (BIOLABO), France.
4. Serum LDL-c was measured, using the
Friedewald equation12
.
5. Serum Leptin was measured, using the ELISA
technique (enzyme linked immunosorbent
assay), by Chromate instrument, and Rabbit
Leptin ELISA kit (LOT; C0202190666) from
CUSABIO, China.
Statistical Analysis: The data obtained in the current
study was analyzed using statistical package for social
sciences (SPSS) (version 12).Standard statistical
methods were used to determine the mean and
standard error. Unpaired t-test was used to compare
between healthy and diabetic rabbits and healthy
control and healthy taking L-carnitne rabbits. One
way ANOVA and Post Hoc (Duncan) Test were used to
identify statistical difference through comparison
within and among groups.
RESULTS
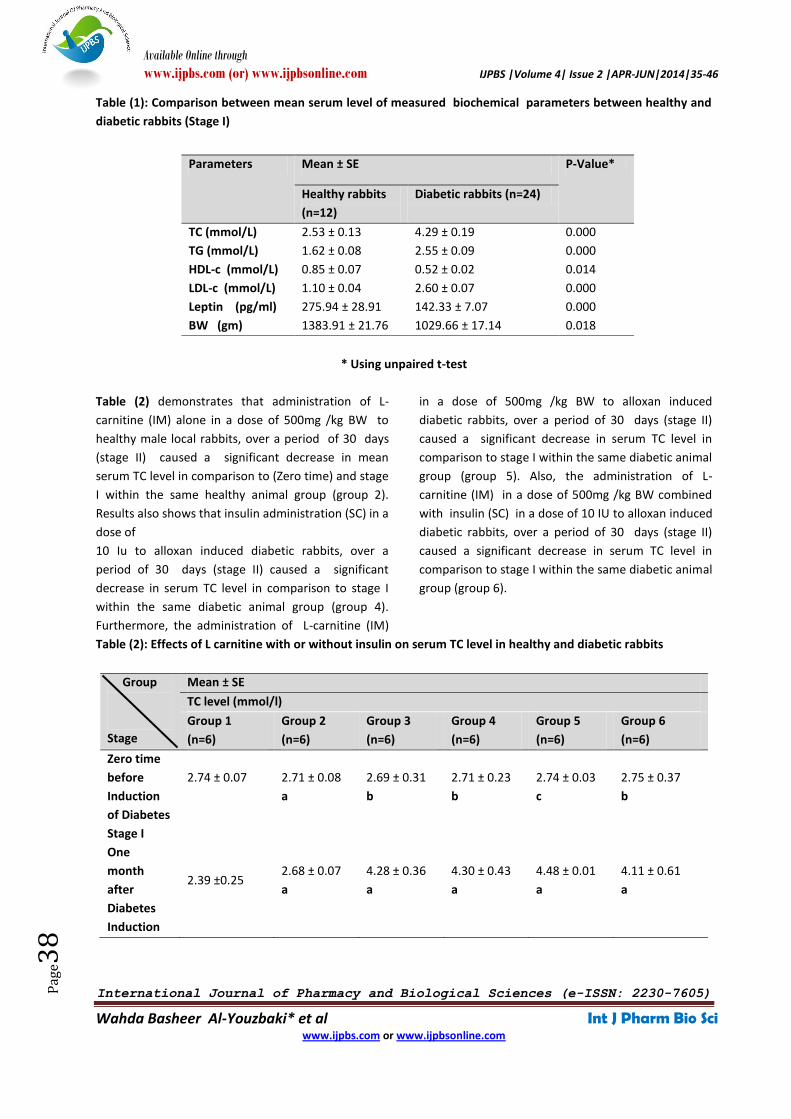
Table (1) shows that administration of alloxan (SC) in
a dose of (150mg/kg BW) had led to significant
increase in serum levels of TC, TG and LDL-c whereas
serum HDL-c, leptin and body weight decreased
significantly in the diabetic group compared to the
control group.
Available Online through
www.ijpbs.com (or) www.ijpbsonline.com IJPBS |Volume 4| Issue 2 |APR-JUN|2014|35-46
International Journal of Pharmacy and Biological Sciences (e-ISSN: 2230-7605)
Wahda Basheer Al-Youzbaki* et al Int J Pharm Bio Sci www.ijpbs.com or www.ijpbsonline.com
Pag
e38
Table (1): Comparison between mean serum level of measured biochemical parameters between healthy and
diabetic rabbits (Stage I)
* Using unpaired t-test
Table (2) demonstrates that administration of L-
carnitine (IM) alone in a dose of 500mg /kg BW to
healthy male local rabbits, over a period of 30 days
(stage II) caused a significant decrease in mean
serum TC level in comparison to (Zero time) and stage
I within the same healthy animal group (group 2).
Results also shows that insulin administration (SC) in a
dose of
10 Iu to alloxan induced diabetic rabbits, over a
period of 30 days (stage II) caused a significant
decrease in serum TC level in comparison to stage I
within the same diabetic animal group (group 4).
Furthermore, the administration of L-carnitine (IM)
in a dose of 500mg /kg BW to alloxan induced
diabetic rabbits, over a period of 30 days (stage II)
caused a significant decrease in serum TC level in
comparison to stage I within the same diabetic animal
group (group 5). Also, the administration of L-
carnitine (IM) in a dose of 500mg /kg BW combined
with insulin (SC) in a dose of 10 IU to alloxan induced
diabetic rabbits, over a period of 30 days (stage II)
caused a significant decrease in serum TC level in
comparison to stage I within the same diabetic animal
group (group 6).
Table (2): Effects of L carnitine with or without insulin on serum TC level in healthy and diabetic rabbits
Group
Stage
Mean ± SE
TC level (mmol/l)
Group 1
(n=6)
Group 2
(n=6)
Group 3
(n=6)
Group 4
(n=6)
Group 5
(n=6)
Group 6
(n=6)
Zero time
before
Induction
of Diabetes
2.74 ± 0.07
2.71 ± 0.08
a
2.69 ± 0.31
b
2.71 ± 0.23
b
2.74 ± 0.03
c
2.75 ± 0.37
b
Stage I
One
month
after
Diabetes
Induction
2.39 ±0.25 2.68 ± 0.07
a
4.28 ± 0.36
a
4.30 ± 0.43
a
4.48 ± 0.01
a
4.11 ± 0.61
a
P-Value* Mean ± SE Parameters
Diabetic rabbits (n=24) Healthy rabbits
(n=12)
0.000 4.29 ± 0.19 2.53 ± 0.13 TC (mmol/L)
0.000 2.55 ± 0.09 1.62 ± 0.08 TG (mmol/L)
0.014 0.52 ± 0.02 0.85 ± 0.07 HDL-c (mmol/L)
0.000 2.60 ± 0.07 1.10 ± 0.04 LDL-c (mmol/L)
0.000 142.33 ± 7.07 275.94 ± 28.91 Leptin (pg/ml)
0.018 1029.66 ± 17.14 1383.91 ± 21.76 BW (gm)
Available Online through
www.ijpbs.com (or) www.ijpbsonline.com IJPBS |Volume 4| Issue 2 |APR-JUN|2014|35-46
International Journal of Pharmacy and Biological Sciences (e-ISSN: 2230-7605)
Wahda Basheer Al-Youzbaki* et al Int J Pharm Bio Sci www.ijpbs.com or www.ijpbsonline.com
Pag
e39
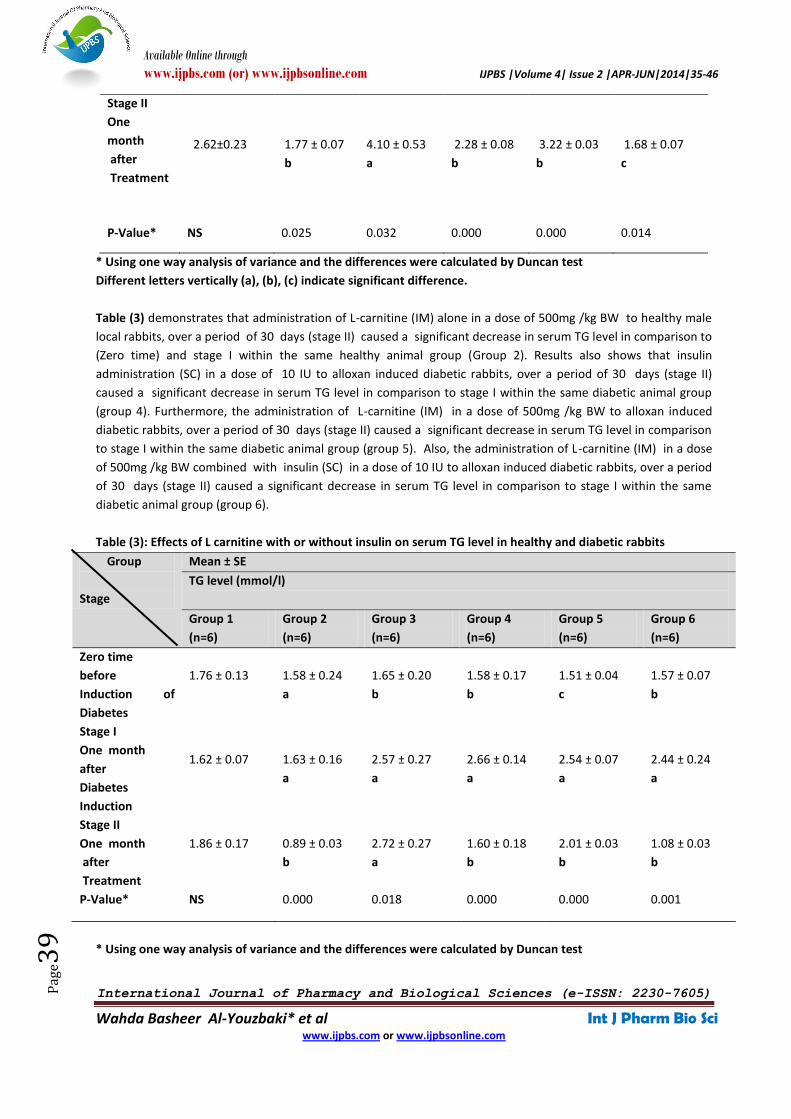
Stage II
One
month
after
Treatment
2.62±0.23
1.77 ± 0.07
b
4.10 ± 0.53
a
2.28 ± 0.08
b
3.22 ± 0.03
b
1.68 ± 0.07
c
P-Value* NS 0.025 0.032 0.000 0.000 0.014
* Using one way analysis of variance and the differences were calculated by Duncan test
Different letters vertically (a), (b), (c) indicate significant difference.
Table (3) demonstrates that administration of L-carnitine (IM) alone in a dose of 500mg /kg BW to healthy male
local rabbits, over a period of 30 days (stage II) caused a significant decrease in serum TG level in comparison to
(Zero time) and stage I within the same healthy animal group (Group 2). Results also shows that insulin
administration (SC) in a dose of 10 IU to alloxan induced diabetic rabbits, over a period of 30 days (stage II)
caused a significant decrease in serum TG level in comparison to stage I within the same diabetic animal group
(group 4). Furthermore, the administration of L-carnitine (IM) in a dose of 500mg /kg BW to alloxan induced
diabetic rabbits, over a period of 30 days (stage II) caused a significant decrease in serum TG level in comparison
to stage I within the same diabetic animal group (group 5). Also, the administration of L-carnitine (IM) in a dose
of 500mg /kg BW combined with insulin (SC) in a dose of 10 IU to alloxan induced diabetic rabbits, over a period
of 30 days (stage II) caused a significant decrease in serum TG level in comparison to stage I within the same
diabetic animal group (group 6).
Table (3): Effects of L carnitine with or without insulin on serum TG level in healthy and diabetic rabbits
Group
Stage
Mean ± SE
TG level (mmol/l)
Group 1
(n=6)
Group 2
(n=6)
Group 3
(n=6)
Group 4
(n=6)
Group 5
(n=6)
Group 6
(n=6)
Zero time
before
Induction of
Diabetes
1.76 ± 0.13
1.58 ± 0.24
a
1.65 ± 0.20
b
1.58 ± 0.17
b
1.51 ± 0.04
c
1.57 ± 0.07
b
Stage I
One month
after
Diabetes
Induction
1.62 ± 0.07
1.63 ± 0.16
a
2.57 ± 0.27
a
2.66 ± 0.14
a
2.54 ± 0.07
a
2.44 ± 0.24
a
Stage II
One month
after
Treatment
1.86 ± 0.17
0.89 ± 0.03
b
2.72 ± 0.27
a
1.60 ± 0.18
b
2.01 ± 0.03
b
1.08 ± 0.03
b
P-Value* NS 0.000 0.018 0.000 0.000 0.001
* Using one way analysis of variance and the differences were calculated by Duncan test

Available Online through
www.ijpbs.com (or) www.ijpbsonline.com IJPBS |Volume 4| Issue 2 |APR-JUN|2014|35-46
International Journal of Pharmacy and Biological Sciences (e-ISSN: 2230-7605)
Wahda Basheer Al-Youzbaki* et al Int J Pharm Bio Sci www.ijpbs.com or www.ijpbsonline.com
Pag
e40
Different letters vertically (a), (b), (c) indicate
significant difference.
Table (4) demonstrates that administration of L-
carnitine (IM) alone in a dose of 500mg /kg BW to
healthy male local rabbits, over a period of 30 days
(stage II) caused a significant increase in serum HDL-
c level in comparison to (Zero time) and stage I within
the same healthy animal group (group 2). Results also
shows that insulin administration (SC) in a dose of 10
IU to alloxan induced diabetic rabbits, over a period
of 30 days (stage II) caused a significant increase in
serum HDL-c level in comparison to stage I within the
same diabetic animal group (group 4). Furthermore,
the administration of L-carnitine (IM) in a dose of
500mg /kg BW to alloxan induced diabetic rabbits,
over a period of 30 days (stage II) caused a
significant increase in serum HDL-c level in
comparison to stage I within the same diabetic animal
group (group 5). Also, the administration of L-
carnitine (IM) in a dose of 500mg /kg BW combined
with insulin (SC) in a dose of 10 IU to alloxan induced
diabetic rabbits, over a period of 30 days (stage II)
caused a significant increase in serum HDL-c level in
comparison to stage I within the same diabetic animal
group (group 6).
Table (4): Effects of L carnitine with or without insulin on serum HDL-c level in healthy and diabetic rabbits
Group
Stage
Mean ± SE
HDL-c level (mmol/l)
Group 1
(n=6)
Group 2
(n=6)
Group 3
(n=6)
Group 4
(n=6)
Group 5
(n=6)
Group 6
(n=6)
Zero time
before
Induction
of
Diabetes
0.87 ± 0.09
0.85 ± 0.01
b
0.88 ± 0.07
a
0.88 ± 0.09
a
0.93 ± 0.01
a
0.92 ± 0.04
b
Stage I
One
month
after
Diabetes
Induction
0.86 ± 0.18
0.84 ± 0.03
b
0.61 ± 0.08
b
0.50 ± 0.02
b
0.48 ± 0.02
b
0.49 ± 0.03
c
Stage II
One
month
after
Treatment
0.83 ± 0.14
1.17 ± 0.02
a
0.50 ± 0.09
b
0.90 ± 0.10
a
0.79 ± 0.02
a
1.22 ± 0.02
a
P-Value* NS 0.002 0.019 0.000 0.024 0.000
* Using one way analysis of variance and the differences were calculated by Duncan test
Different letters vertically (a), (b), (c) indicate significant difference.
Table (5) demonstrates that administration of L-
carnitine (IM) alone in a dose of 500mg /kg BW to
healthy male local rabbits, over a period of 30 days
(stage II) caused a significant decrease in serum LDL-
c level in comparison to (Zero time) and stage I within
the same healthy animal group (group 2). Results also
shows that insulin administration (SC) in a dose of 10
IU to alloxan induced diabetic rabbits, over a period
of 30 days (stage II) caused a significant decrease in
serum LDL-c level in comparison to stage I within the

Available Online through
www.ijpbs.com (or) www.ijpbsonline.com IJPBS |Volume 4| Issue 2 |APR-JUN|2014|35-46
International Journal of Pharmacy and Biological Sciences (e-ISSN: 2230-7605)
Wahda Basheer Al-Youzbaki* et al Int J Pharm Bio Sci www.ijpbs.com or www.ijpbsonline.com
Pag
e41
same diabetic animal group (group 4). Furthermore,
the administration of L-carnitine (IM) in a dose of
500mg /kg BW to alloxan induced diabetic rabbits,
over a period of 30 days (stage II) caused a
significant decrease in serum LDL-c level in
comparison to stage I within the same diabetic animal
group (group 5). Also, the administration of L-
carnitine (IM) in a dose of 500mg /kg BW combined
with insulin (SC) in a dose of 10 IU to alloxan induced
diabetic rabbits, over a period of 30 days (stage II)
caused a significant decrease in serum LDL-c level in
comparison to stage I within the same diabetic animal
group (group 6).
Table (5): Effects of L carnitine with or without insulin on serum LDL-c level in healthy and diabetic rabbits
Group
Stage
Mean ± SE
LDL-c level (mg/dl)
Group 1
(n=6)
Group 2
(n=6)
Group 3
(n=6)
Group 4
(n=6)
Group 5
(n=6)
Group 6
(n=6)
Zero time
before Induction
of Diabetes
1.08
±0.04
1.18
±0.05
a
1.05
±0.05
b
1.17
±0.12
b
1.10
±0.04
c
1.23
±0.32
b
Stage I
One month
after
Diabetes Induction
1.05
±0.05
1.16
±0.08
a
2.49
±0.17
a
2.77
±0.10
a
2.75
±0.07
a
2.37
±0.13
a
Stage II
One month
after
Treatment
0.93
±0.02
0.49
±0.04
b
2.51
±0.10
a
1.16
±0.12
b
1.75
±0.08
b
0.42
±0.01
c
P-Value* NS 0.020 0.028 0.002 0.032 0.018
* Using one way analysis of variance and the differences were calculated by Duncan test
Different letters vertically (a), (b), (c) indicate significant difference.
Table (6) demonstrates that administration of L-
carnitine (IM) alone in a dose of 500mg /kg body
weight to healthy male local rabbits, over a period of
30 days (stage II) caused no significant variations in
serum leptin level in comparison to (Zero time) and
stage I within the same healthy animal group (group
2). Results also shows that insulin administration (SC)
in a dose of 10 IU to alloxan induced diabetic rabbits,
over a period of 30 days (stage II) caused a significant
increase in serum leptin level in comparison to stage I
within the same diabetic animal group (group 4).
Furthermore, the administration of L-carnitine (IM) in
a dose of 500mg /kg body weight to alloxan induced
diabetic rabbits, over a period of 30 days (stage II)
caused no significant variations in serum leptin level
in comparison to stage I within the same diabetic
animal group (group 5). Also, the administration of L-
carnitine (IM) in a dose of 500mg /kg BW combined
with insulin (SC) in a dose of 10 IU to alloxan induced
diabetic rabbits, over a period of 30 days (stage II)
caused a significant increase in serum leptin level in
comparison to stage I within the same diabetic animal
group (group 6).

Available Online through
www.ijpbs.com (or) www.ijpbsonline.com IJPBS |Volume 4| Issue 2 |APR-JUN|2014|35-46
International Journal of Pharmacy and Biological Sciences (e-ISSN: 2230-7605)
Wahda Basheer Al-Youzbaki* et al Int J Pharm Bio Sci www.ijpbs.com or www.ijpbsonline.com
Pag
e42
Table (6): Effects of L carnitine with or without insulin on serum leptin level in healthy and diabetic rabbits
Group
Stage
Mean ± SE
Leptin level (pg/mL)
Group 1
(n=6)
Group 2
(n=6)
Group 3
(n=6)
Group 4
(n=6)
Group 5
(n=6)
Group 6
(n=6)
Zero time
before Induction
of Diabetes
271.91
±51.43
265.46
±46.66
274.85
±28.10
a
276.96
±26.63
a
286.91
±28.12
a
266.68
±28.96
a
Stage I
One month
after
Diabetes Induction
276.25
±51.88 275.63
±31.40
145.75
±11.31
b
146.23
±41.13
b
152.50
±11.98
b
124.8
5±16.75
b
Stage II
One month
after
Treatment
270.90
±18.92
274.73
±27.65
157.66
±15.23
b
248.35
±13.03
a
154.68
±23.36
b
247.03
±23.48
a
P-Value* NS NS 0.021 0.004 0.010 0.001
* Using one way analysis of variance and the differences were calculated by Duncan test
Different letters vertically (a), (b), (c) indicate significant difference.
Table (7) demonstrate that L-carnitine (IM) in a dose
of (500mg/kg) , over a period of 30 days, caused no
significant variations in body weight in healthy
rabbits taking L-carnitine (Group 2) in comparison to
healthy taking D.W (Group 1). Table (7) shows that
insulin administration (SC) in a dose of 10 IU to
alloxan induced diabetic rabbits, over a period of 30
days caused a significant increase in body weight in
diabetic rabbits taking insulin (Group 4) in comparison
to diabetic rabbits taking D.W (Group 3). Table (7)
also demonstrate that L-carnitine (IM) in a dose of
(500mg/kg) , over a period of 30 days, caused no
significant variations in body weight in diabetic
rabbits taking L-carnitine (Group 5) in comparison to
diabetic rabbits taking D.W (Group 3). Also,
administration of L-Carnitine (I.M) in a dose of 500mg
/kg BW combined with insulin (SC) in a dose of 10 IU
to alloxan induced diabetic rabbits, over a period of
30 days caused no significant increase in body weight
in diabetic rabbits taking the two treatments (Group
6) in comparison to diabetic rabbits taking insulin only
(Group 4).
Table (7): Effects of L carnitine with or without insulin on body weights among the study groups (stage II)
Group
Parameter
Mean ± SE
P-
Value* Group 1
(n=6)
Group 2
(n=6)
Group 3
(n=6)
Group 4
(n=6)
Group 5
(n=6)
Group 6
(n=6)
Body
Weight
(gm)
1592.83
± 43.68
a
1584.5
± 29.00
a
837.50
±83.71
c
1475.83
± 39.01
b
884.50
± 43.18
c
1422.33
± 21.16
b
0.000
* Using one way analysis of variance and the differences were calculated by Duncan test
Different letters horizontally (a), (b), (c) indicate significant difference.
Available Online through
www.ijpbs.com (or) www.ijpbsonline.com IJPBS |Volume 4| Issue 2 |APR-JUN|2014|35-46
International Journal of Pharmacy and Biological Sciences (e-ISSN: 2230-7605)
Wahda Basheer Al-Youzbaki* et al Int J Pharm Bio Sci www.ijpbs.com or www.ijpbsonline.com
Pag
e43
DISCUSSION
The present study showed that administration of L-
carnitine (IM) alone in a dose of 500mg /kg BW to
healthy male local rabbits, over a period of 30 days
caused a significant reduction in serum TC,TG and
LDL-c level and significant increase in HDL-c in
comparison to healthy controls. This finding is in
agreement with other studies on rats13
and in
human14
.
In contrast, these results disagree with Van
Weyenberg et al., (2009)15
who found that L-carnitine
supplementation for 7 days caused no significant
effects on TG level and non-esterified fatty acids
concentration. These differences in the results may
be explained by different routes of L-carnitine
administration, since in this study carnitine was
administered parentally in a dose of 500mg /kg BW
whereas in Van Weyenberg et al., (2009)15
study
carnitine was supplemented in much lower doses (4
g / whole ponies body).
The present study shows that administration of L-
carnitine (IM) in a dose of 500mg /kg BW to alloxan
induced TIDM rabbits, over a period of 30 days
caused a significant reduction in serum TC, TG and
LDL-c level and significant increase in HDL-c level in
comparison to diabetic controls. This is in agreement
with other studies16,17
who found that L-carnitine
treatment for streptozotocin (STZ) induced diabetic
rats significantly lowered TC and TG levels. The results
of the present study also agree with studies on T2DM
patients who found that L-carnitine significantly
improved the lipid profile18
. This may be accounted to
that the administration of L-carnitine can increase β-
oxidation especially in carnitine deficient patients4.
The present study disagree with the study of Bazotte
and Lopes-Bertolini, (2012)10
who found that carnitine
supplementation caused no significant changes in
levels of TC, HDL-c and LDL-c but a significant
reduction in TG in alloxan induced diabetic rats. This
is because of the difference in the dose of carnitine
administered which was 200-400 mg/kg/1.day-1
while in this study the dose administered was 500
mg/kg/BW. Also in contrast with Derosa et al.,
(2003)19
study who found no significant decrease in
serum TG nor in serum HDL-c and with Rahbar et al.,
(2005) 20
study who even found significant increase in
serum TG but no increase of HDL-c in diabetic
patients after receiving L-carnitine .This may probably
linked to period of carnitine administration, dose,
routes of drug administration or the type of the
diseased metabolic conditions.
L-carnitine increases β-oxidation to an extent, that
the resultant acetyl-coA inter Krebs's cycle and result
in more production of energy by burning fats , so
increase utilization of cellular fatty acids, and removal
of abnormal fat on cellular membrane. In another
word the physiological role of carnitine rose to the
hypothesis that, this compound could act as a fat
burner by optimizing fat oxidation and a consequently
reducing its availability for storage 4
.
...
The present study showed that administration of L-
carnitine (IM) alone in a dose of 500mg /kg BW to
healthy male rabbits, over a period of 30 days
caused no significant differences in serum leptin
levels in comparison to healthy controls. This finding
is in agreement with other study21
which found that L-
carnitine supplementation to rats receiving protein or
energy restricted diets has not significantly modified
the leptin concentrations. In contrast with our results
serum leptin levels were found to be decreased
significantly in Iossa et al., (2002) study
3 which may
be due to the age related variations in body
composition since the reduction in leptin levels was
noted in only (24 months) old rats and not in young (2
months) old. While serum leptin level was found to be
increased in Hishem et al., (2006) 13
and Van
Weyenberg, (2009)15
studies after carnitine
supplementation orally, This difference from our
study could be due to different concentrations of
carnitine reaching blood according to the differences
in the route of administrations because bioavailability
of carnitine orally is about 15% 22
.
The present study shows that administration of L-
carnitine (IM) in a dose of 500mg /kg BW to alloxan
induced hyperglycemic rabbits, over a period of 30
days caused no significant variations in serum leptin
concentrations in comparison to diabetic controls.
This is in line with Ruggenenti et al., (2009)23
study
who investigated the effects of carnitine infusion on
leptin levels in T2DM patients and they found that
leptin level did not changed appreciably at different
time points compared with baseline. In contrast with

Available Online through
www.ijpbs.com (or) www.ijpbsonline.com IJPBS |Volume 4| Issue 2 |APR-JUN|2014|35-46
International Journal of Pharmacy and Biological Sciences (e-ISSN: 2230-7605)
Wahda Basheer Al-Youzbaki* et al Int J Pharm Bio Sci www.ijpbs.com or www.ijpbsonline.com
Pag
e44
our results serum leptin levels were found to be
decreased significantly in mice after carnitine
supplementation24
. This could be a result of
differences in the metabolic status in the studied
experimental animal model caused by differences in
animal diet nutrition since in the study on mice
24,
the mice were fed high-fat diet which is known to
induce metabolic disturbances and insulin
resistance...
The present study showed that administration of L-
carnitine (IM) alone in a dose of 500mg/kg BW to
healthy male rabbits, over a period of 30 days caused
no significant variations in body weight in
comparison to healthy controls. This finding is in
agreement with Kordi et al., (2012) study
25 which
was conducted on dminis roach (Rutilus rutilus
caspicus) juveniles to investigate the effect of dietary
L-carnitine supplementation on growth performance
and found that giving L-carnitine 500, 1000 and 2000
mg /kg diet, over a 70-day period showed no
significant changes in weight gain and weight gain
percentage. Also results in this study are in line with
other studies3,14
which found that L-carnitine
supplementation had no demonstrable effect on
growth and body weight in animal and human
subjects.
In contrast with our results body weight were found
to be decreased significantly in some studies3,13,26
.This difference from our study could be due to
different concentrations of carnitine reaching blood
according to the differences in the route of
administrations because bioavailability of carnitine
orally is about 15% 22
. While body weight were found
to be decreased significantly other studies21,27
after
carnitine supplementation in animal and human
subjects. This differences could be a result of
difference in the metabolic status among the study
subjects since patients shared in Crill et al., (2006)
study27
were premature infants while those shared in
Onbasilar and yalcin (2009) study
21 were on energy
restricted diet regimens.
The present study found that administration of L-
carnitine (IM) in a dose of 500mg /kg body weight to
alloxan induced hyperglycemic rabbits, over a period
of 30 days caused no significant variations in body
weight in comparison to diabetic controls. This finding
is in agreement with Bazotte and Lopes-Bertolini,
(2012) study
10 who found that the L-carnitine (200 or
400 mg.kg-1.day-1) supplementation during one or
four weeks to non-diabetic and alloxan induced –
diabetic rats did not change water and food intake
and body weight.
In contrast with our results body weight was found to
be decreased significantly in Mun et al., (2007)
study24
which found that carnitine supplementation
to high-fat diet mice significantly reduced the
elevated body weight during the treatment period.
This could be a result of differences in the metabolic
status in the studied experimental animal model
caused by differences in animal nutrition since in
Mun et al., (2007) study
24, mice were fed high-fat diet
which is known to induce metabolic disturbances and
insulin resistance. The result of this study and other
results, which agree with it may be explained by the
fact that carnitine supplementation may corrected
the carnitine deficiency state encountered in DM and
the significant decrease in total fat mass; came with
significant increase in total muscle mass with no
differences in final body weight 14
.
CONCLUSION
L-carnitine IM in a dose of (500mg/kg) , over a period
of 30 days, caused a significant decrease in serum
TC,TG and LDL-c level and significant increase in HDL-c
but no significant variations in serum leptin and body
weight in diabetic rabbits. This may have beneficial
effects in ameliorating diabetic complications as an
adjuvant therapy to insulin. These results may or may
not be applicable to humans, so further research is
recommended to determine whether similar effect
would result in humans or not.
REFERENCES
1. Zhang H, Tan C, Wang H, Xue S, Wang M. Study on
the history of Traditional Chinese Medicine to treat
diabetes. Europ J Integ Med 2010; 2: 41–46.
2. Steiber A, Kerner J, Hoppel C. "Carnitine: a nutritional,
biosynthetic, and functional perspective". Mol
Aspects Med 2004; 25 (5–6): 455–473.
3. Iossa S, Maria P, Lilla L, Raffaella C, and Giovanna L:
Acetyl-L- Carnitine supplementation differently
influences nutrient partitioning, serum leptin
concentration and skeletal muscle, mitochondrial

Available Online through
www.ijpbs.com (or) www.ijpbsonline.com IJPBS |Volume 4| Issue 2 |APR-JUN|2014|35-46
International Journal of Pharmacy and Biological Sciences (e-ISSN: 2230-7605)
Wahda Basheer Al-Youzbaki* et al Int J Pharm Bio Sci www.ijpbs.com or www.ijpbsonline.com
Pag
e45
respiration in young and old rats. J Nutr 2002; 132:
636-42.
4. Mayes PA, Botham K M, Bender D (2003). Lipid
transport and storage, Oxidation of fatty acids,
Gluconeogenesis and control of blood glucose .In: A
Lange Medical Book Harper's Illustrated Biochemistry.
Murry RK, Granner DK, Mayes PA , Rodwell V W
(editors), 26th
edition ,Torento ,London: pp153-205.
5. Seim H, Eichler K, Kleber H L (2001). Carnitine and its
precursor, gamma-butyrobetaine. In: Nutraceuticals
in Health and Disease Prevention. Kramer K, Hoppe P,
Packer L, eds. New York: Marcel Dekker, Inc. pp: 217-
256.
6. Mamoulakis D, Galanakis E, Dionyssopoulou E,
Evangeliou A, Sbyrakis S. Carnitine deficiency in
children and adolescents with type 1 diabetes. J
Diabetes Comp 2004; 18: 271-274.
7. Lee Y, Heo YR, Cha YS. The plasma and urinary
carnitine system in Korean diabetic patients. Nutrl Sci
2005; 8: 97-103.
8. El-Hattab AW, Li FY, Shen, J, Powell BR, Bawle, EV,
Adams DJ et al., Maternal systemic primary carnitine
deficiency uncovered by newborn screening: clinical,
biochemical, and molecular aspects. Genet Med 2010;
12: 19-24.
9. Noland RC, Koves TR, Seiler SE, Lum H, Lust RM,
Ilkayeva O et al., Carnitine insufficiency caused by
aging and over nutrition compromises mitochondrial
performance and metabolic control. Cell Metab 2012
May 2; 15(5): 764-777.
10. Bazotte RB, Lopes-Bertolini G. Effects of Oral L-
carnitine and DL-carnitine supplementation on
alloxan-diabetic rats. Braz Arch Biol Technol 2012; 55
(1): 81-88.
11. Koolhaas J (1999): The laboratory Rabbits. The UFAW
handbook on the care and management of laboratory
animals. 7th
, ed. Vol. 1: pp 313.
12. Friedewald WT, Levy RJ, Fredrickson DS. Estimation of
the concentration of LDL-c in plasma without use of
the preparative ultracentrifuge. Clin Chem 1972; 18:
499-502.
13. Hishem NE, El-Zawahry BH, El Nakeeb SMS, Ahmad
LA. Influences of short –term aerobic exercise and
supplementation of carnitine with or without choline
on body weight, serum leptin an carnitine as well as
lipid status in male rats. Egyp J Hosp Med 2006; 25:
597– 609.
14. Pistone G, Finocchiaro G, Dell'Arte S, Leotta C, Marino
A. Levocarnitine administration in elderly subjects
with rapid muscle fatigue: effect on body
composition, lipid profile and fatigue. Drugs Aging
2003; 20(10): 761-767.
15. Van Weyenberg S, Buyse J, Janssens GP. Increased
plasma leptin through l-carnitine supplementation is
associated with an enhanced glucose tolerance in
healthy ponies. J Anim Physiol Anim Nutr (Berl) 2009
Apr; 93(2): 203-208.
16. Heo YR, Lee Y, Cha YS. L-carnitine dministration
improves lipid metabolism in streptozotocin-induced
diabetic rat. Nutr Sci 2002; 5: 3-8.
17. Patel J, Goyal R, Bhatt P. Beneficial effects of Levo-
carnitine on lipid metabolism and cardiac function in
neonatal streptozotocin rat model of diabetes. Int J
Diabet Metabol 2008; 16: 29-34.
18. Derosa G, Maffioli P, Ferrari I, D'Angelo A, Fogari E,
Palumbo I, Randazzo S, Cicero AF. Comparison
between orlistat plus l-carnitine and orlistat alone on
inflammation parameters in obese diabetic patients.
Fundam Clin Pharmacol. 2011 Oct; 25(5): 642-651.
19. Derosa G, Cicero AF, Gaddi A. The effect of L-carnitine
on plasma LP(a) levels in hypercholesterolemic
patients with type 2 diabetes mellitus. Clin Ther 2003;
25: 1429-1439.
20. Rahbar AR, Shakerhosseini R, Saadat N, Taleban F,
Pordal A, Gollestan B. Effect of L-carnitine on plasma
glycemic and lipidemic profile in patients with type П
diabetes mellitus. Eur J Clin Nutr 2005; 59(4): 592-596.
21. Onbasilar I, Yalcin S S. Changes in serum leptin
concentrations in rats according to malnutrition
models and effects of carnitine supplementation on
catchup growth. Revue Méd Vét 2009; 160 (7): 362-
369.
22. Rebouche CJ. Kinetics, pharmacokinetics, and
regulation of L-carnitine and acetyl-L-carnitine
metabolism. Ann NY Acad Sci 2004; 1033: 30-41.
23. Ruggenenti P, Cattaneo D, Loriga G, Ledda F,
Motterlini N, Gherardi G et al., Ameliorating
hypertension and insulin resistance in subjects at
increased cardiovascular risk; Effects of Acetyl-L-
Carnitine therapy. Hyperten 2009; 54: 567-574.
24. Mun EG, Soh JR, Cha YS. L-carnitine reduces obesity
caused by high-fat diet in C57BL/6J mice. Food Sci
Biotechnol 2007; 16: 228-233.
25. Kordi H, Imanpour M R, Sedaghat S. Effect of L-
carnitine supplementation on growth performance
and carcass composition of caspian roach (Rutilus
rutilus Caspicus). World J Fish Marine Sci 2012; 4 (4):
396-399.
26. Ardekani H M, Shevazad M, Chamani M, Aminafshar
M, Arani ED. The effect of L-carnitine and low crude
protein supplemented with crystalline essential amino
acids diets on broiler chickens. Annals of Biolog
Research 2012; 3 (2): 1085-1093.
Available Online through
www.ijpbs.com (or) www.ijpbsonline.com IJPBS |Volume 4| Issue 2 |APR-JUN|2014|35-46
International Journal of Pharmacy and Biological Sciences (e-ISSN: 2230-7605)
Wahda Basheer Al-Youzbaki* et al Int J Pharm Bio Sci www.ijpbs.com or www.ijpbsonline.com
Pag
e46
27. Crill CM, Christensen ML, Storm MC, Helms RA.
Relative bioavailability of carnitine supplementation
in premature neonates. J Parenter Enteral Nutr 2006;
30: 421-425.
*Corresponding Author: Dr. Wahda Basheer Al-Youzbaki, PhD Pharmacology E-mail: [email protected]