effects of irradiance, temperature, and nutrients on ... stac/lee et al 2007 jem… · effects of...
TRANSCRIPT
y and Ecology 350 (2007) 144–175www.elsevier.com/locate/jembe
Journal of Experimental Marine Biolog
Effects of irradiance, temperature, and nutrients on growth dynamicsof seagrasses: A review
Kun-Seop Lee ⁎, Sang Rul Park, Young Kyun Kim
Department of Biology, Pusan National University, Pusan 609-735, Republic of Korea
Received 20 March 2007; received in revised form 4 June 2007; accepted 5 June 2007
Abstract
Productivity of seagrasses can be controlled by physiological processes, as well as various biotic and abiotic factors thatinfluence plant metabolism. Light, temperature, and inorganic nutrients affect biochemical processes of organisms, and areconsidered as major factors controlling seagrass growth. Minimum light requirements for seagrass growth vary among species dueto unique physiological and morphological adaptations of each species, and within species due to photo-acclimation to local lightregimes. Seagrasses can enhance light harvesting efficiencies through photo-acclimation during low light conditions, and thusplants growing near their depth limit may have higher photosynthetic efficiencies. Annual temperatures, which are highlypredictable in aquatic systems, play an important role in controlling site specific seasonal seagrass growth. Furthermore, boththermal adaptation and thermal tolerance contribute greatly to seagrass global distributions. The optimal growth temperature fortemperate species range between 11.5 °C and 26 °C, whereas the optimal growth temperature for tropical/subtropical species isbetween 23 °C and 32 °C. However, productivity in persistent seagrasses is likely controlled by nutrient availability, including bothwater column and sediment nutrients. It has been demonstrated that seagrasses can assimilate nutrients through both leaf and roottissues, often with equal uptake contributions from water column and sediment nutrients. Seagrasses use HCO3
− inefficiently as acarbon source, thus photosynthesis is not always saturated with respect to DIC at natural seawater concentrations leading to carbonlimitation for seagrass growth. Our understanding of growth dynamics in seagrasses, as it relates to main environmental factorssuch as light, temperature, and nutrient availability, is critical for effective conservation and management of seagrass habitats.© 2007 Elsevier B.V. All rights reserved.
Keywords: Growth dynamics; Nutrient availability; Production; Seagrass; Temperature; Underwater irradiance
Contents
1. Introduction . . . . . . . . . . . . . . . . . . . . . . . . . . . . . . . . . . . . . . . . . . . . . . . . . . . . . . 1452. Irradiance and seagrass production . . . . . . . . . . . . . . . . . . . . . . . . . . . . . . . . . . . . . . . . . . 145
2.1. Minimum light requirement for seagrass growth. . . . . . . . . . . . . . . . . . . . . . . . . . . . . . . . 1452.2. Photosynthesis and irradiance . . . . . . . . . . . . . . . . . . . . . . . . . . . . . . . . . . . . . . . . . 1462.3. Growth rate and irradiance. . . . . . . . . . . . . . . . . . . . . . . . . . . . . . . . . . . . . . . . . . . 1482.4. Role of daily light periods in seagrass growth. . . . . . . . . . . . . . . . . . . . . . . . . . . . . . . . . 1532.5. Effects of light reduction on seagrass growth . . . . . . . . . . . . . . . . . . . . . . . . . . . . . . . . . 154
⁎ Corresponding author. Tel.: +82 51 510 2255; fax: +82 51 581 2962.E-mail address: [email protected] (K.-S. Lee).
0022-0981/$ - see front matter © 2007 Elsevier B.V. All rights reserved.doi:10.1016/j.jembe.2007.06.016

145K.-S. Lee et al. / Journal of Experimental Marine Biology and Ecology 350 (2007) 144–175
3. Temperature and seagrass growth . . . . . . . . . . . . . . . . . . . . . . . . . . . . . . . . . . . . . . . . . . . 1573.1. Effects of temperature on growth patterns . . . . . . . . . . . . . . . . . . . . . . . . . . . . . . . . . . . 1573.2. Effects of temperature on photosynthesis . . . . . . . . . . . . . . . . . . . . . . . . . . . . . . . . . . . . 159
4. Nutrients and seagrass growth . . . . . . . . . . . . . . . . . . . . . . . . . . . . . . . . . . . . . . . . . . . . . 1614.1. Inorganic nutrients for seagrass growth . . . . . . . . . . . . . . . . . . . . . . . . . . . . . . . . . . . . . 1614.2. Nutrient limitation and plant responses to nutrient enrichments . . . . . . . . . . . . . . . . . . . . . . . . 1624.3. In situ nutrient concentrations and nutrient availability . . . . . . . . . . . . . . . . . . . . . . . . . . . . . 1634.4. Inorganic carbon limitation . . . . . . . . . . . . . . . . . . . . . . . . . . . . . . . . . . . . . . . . . . . 168
Acknowledgements . . . . . . . . . . . . . . . . . . . . . . . . . . . . . . . . . . . . . . . . . . . . . . . . . . . . . 168References . . . . . . . . . . . . . . . . . . . . . . . . . . . . . . . . . . . . . . . . . . . . . . . . . . . . . . . . . . 168
1. Introduction
Seagrass meadows are among the most productiveplant communities, providing habitat and food for avariety of marine organisms (Heck and Westone, 1977;McRoy and McMillan, 1977; Orth et al., 1984;Summerson and Peterson, 1984; Huh and Kitting,1985). Although many factors may influence seagrassgrowth, productivity is mainly regulated by underwaterirradiance, temperature, and nutrient availability (Phillipset al., 1983; Wetzel and Penhale, 1983; Dennison et al.,1993; Dunton, 1994; Lee and Dunton, 1996). Seagrassphotosynthesis, and thereby, their growth, survival, anddepth distribution are directly linked to underwaterirradiance (Dennison et al., 1993; Cabello-Pasini et al.,2003), and seagrass loss has been reported worldwidebecause of reductions in underwater light (Cambridge andMcComb, 1984; Giesen et al., 1990; Dennison et al.,1993; Onuf, 1994; Short and Wyllie-Echeverria, 1996).Reduced underwater irradiance may be caused byepiphytic and planktonic algal accumulations from excessanthropogenic nutrients, increased sediment run-off, andresuspension of bottom sediments (Orth and Moore,1983; Cambridge et al., 1986; Onuf, 1994).
Seagrass productivities usually exhibit distinct sea-sonal variations, with rates increasing during spring andsummer and decreasing during fall and winter (Vermaatet al., 1987; Dunton, 1994; Lee and Dunton, 1996; Leeet al., 2005). As temperature significantly affects thebiochemical processes involved in photosynthesis andrespiration, it is considered a major factor controllingseasonal seagrass growth (Tutin, 1942; Phillips et al.,1983; Lee and Dunton, 1996; Lee et al., 2005).However, water temperature and irradiance oftencorrelate and exhibit similar seasonal trends, and thus,it can be difficult to separate these two environmentalparameters with regard to seagrass growth and produc-tion (Kaldy and Dunton, 2000; Kaldy, 2006).
Because of their high productivity, seagrasses shouldbe able to assimilate large amounts of inorganic nutri-
ents. Thus, nutrient availability may play a significantrole in regulating seagrass production in areas wherelight is plentiful. Nutrient enrichment studies haveshown that additions of inorganic nutrients can stimulateseagrass growth, suggesting nutrient limitation for plantproduction (Orth, 1977; Harlin and Thorne-Miller,1981; Iizumi et al., 1982; Dennison et al., 1987; Shortet al., 1990; Pérez et al., 1991; Murray et al., 1992;Williams and Ruckelshaus, 1993; Lee and Dunton,2000).
While nutrients can limit seagrass growth, excessivewater column nutrient enrichment can promote in-creased light attenuation due to epiphytic growth andphytoplankton blooms, resulting in significant seagrassdecline (Orth and Moore, 1983; Silberstein et al., 1986;Giesen et al., 1990; Tomasko and Lapointe, 1991; Shortet al., 1995). In most cases, however, nutrient enrich-ment in sediments enhances seagrass growth with noobservable adverse effects (Bulthuis and Woelkerling,1981; Agawin et al., 1996; Alcoverro et al., 1997; Udyand Dennison, 1997; Lee and Dunton, 2000). Therefore,although seagrasses can access nutrient from both thewater column and sediments, effects of nutrientavailability on seagrass production may vary dependingon the nutrient sources. In this comprehensive review,we present and synthesize the current literature on light,temperature and nutrient effects on seagrass physiologyand growth.
2. Irradiance and seagrass production
2.1. Minimum light requirement for seagrass growth
Growth of seagrasses depends on the quantity andquality of light available for photosynthesis (Ziemanand Wetzel, 1980). Therefore, reductions of underwaterlight, due to anthropogenic and natural disturbances,often result in large-scale seagrass die-off (Short andWyllie-Echeverria, 1996). Underwater light intensity isattenuated exponentially with water depth according to

146 K.-S. Lee et al. / Journal of Experimental Marine Biology and Ecology 350 (2007) 144–175
the Lambert–Beer equation (Iz= I0 ·e−Kd ·Z), wherein
light attenuation with increasing water depth is asso-ciated with absorption and scattering processes due todissolved substances, phytoplankton, non-algal particu-late matter, and water itself (Weidemann and Bannister,1986; McPherson and Miller, 1987; Roesler et al., 1989;Gallegos et al., 1990).
As seagrasses often grow in distinct bands from theintertidal zone to depths at which plants receive mini-mum irradiance for survival, minimum light require-ments for these plants have usually been determined aspercent light at maximal depth limit using Kd, the lightattenuation coefficient (Duarte, 1991; Dennison et al.,1993). However, minimum light requirements ofseagrasses (2–37% surface irradiance, SI; Table 1) aremuch higher than those of macroalgae and phytoplank-ton (about 1–3% SI; Strickland, 1958; Luning andDring, 1979; Sand-Jensen, 1988; Duarte, 1991; Marka-ger and Sand-Jensen, 1992; Dennison et al., 1993). Aseach seagrass species has unique physiological andmorphological adaptations to light availability, theminimal light requirements should vary among differentseagrasses (Dennison et al., 1993). This is consistentwith a number of studies that have demonstratedvariability in minimum light requirements withinspecies (Table 1). For example, the minimum lightrequirement for Zostera marina in a Danish embaymentwas 11% SI, whereas the estimated light requirement forsame species in Netherlands was 29.4% SI (Table 1;Dennison et al., 1993; Olesen and Sand-Jensen, 1993).This variability within species is likely attributed tophoto-acclimation to local light regimes. The lightrequirements of submersed plants are tightly coupledwith plant morphology (Middelboe and Markager,1997). A minimum light requirement for rosette-typefreshwater angiosperms, which has higher root:shootratios, was much greater than caulescent angiosperms(Sheldon and Boylen, 1977; Middelboe and Markager,1997). Halophila spp. usually have the greatest depthlimit, and consequently the lowestminimum light require-ment among seagrasses (Table 1). In contrast to otherspecies, which have strap-shaped leaves, Halophila spp.have petiolate leaves along rhizomes or on distal nodes oferect stems (Kuo and den Hartog, 2006). It is likely thatpetiolate leaves, with elliptic or ovate blades, are moreefficient at harvesting light than linear or lanceolateleaves. Moreover, Halophila spp. usually have low root:shoot ratios (Halophila ovalis had lowest root:shoot ratioamong 7 South-east Asian seagrasses; Terrados et al.,1999b). Therefore, the morphological characteristicsof Halophila spp. are likely reflected in their minimumlight requirement.
The light requirements in % SI will vary with latitude(Duarte and Kalff, 1987; Middelboe and Markager,1997). For example, the required light (as % SI) forsubmerged angiosperms in freshwater lakes increaseswith increasing latitude (Duarte and Kalff, 1987;Middelboe and Markager, 1997). Since ambient surfacelight is lower in temperate regions (relative to tropics),required light in terms of % SI should be higher intemperate species. However, the minimum light require-ments for temperate and tropical species were compa-rable (means as 16 and 18% SI, respectively; Table 1).Additionally, the relationship between minimum re-quired light and latitude in seagrasses exhibits a weakpositive relationship or a negative relationship withlatitudes (Table 1). These results imply that light re-quirements in seagrasses can become acclimated to locallight conditions. Thus, seagrass productivity may notchange proportionally with local light conditions, andconsequently, underwater light availability may notalways be a good indicator of seagrass productivity.
2.2. Photosynthesis and irradiance
Light requirements for seagrass growth and survivalhave often been expressed as % surface irradiance (% SI;Duarte, 1991; Dennison et al., 1993). As the level ofsurface irradiance varies both spatially and temporally,there is a concern when using estimates of % SI to deter-mine minimum light requirements for a given species.Minimum light requirements may also be determined byestablishing the relationship between underwater irradi-ance and photosynthetic production using photosynthe-sis–irradiance (P–I) curves (Kenworthy and Haunert,1991; Morris and Tomasko, 1993; Herzka and Dunton,1997), which may provide valuable information for lightrequirements necessary to sustain optimal growth (Dun-ton and Tomasko, 1994). P–I curves can be divided intothree regions; 1) a light limited region in which photo-synthetic rates linearly increase with increasing irradi-ance, 2) a light-saturated region in which photosynthesisis independent of irradiance, and 3) a photoinhibitedregion in which photosynthesis decreases with furtherincreases in irradiance. The curve can provide estimatesfor the initial slope (α; photosynthetic quantum efficien-cy), the light-saturated photosynthetic rate (Pmax),saturating irradiance for photosynthesis (Ik) where αintersects Pmax (Pmax/α), compensation irradiance (Ic)where net photosynthesis is zero, and photoinhibitionirradiance (Ii) where photosynthesis decreases withfurther increases in irradiance. Ik and Ic can be used todetermine light requirements based on daily light satura-tion period (Hsat), and the daily light compensation period

Table 1Minimum light requirements of various seagrass species distributed worldwide
Species Location Latitude Minimum light requirement (%) Source
TemperateAmphibolis antaractica Waterloo Bay, Australia 27°S 24.7 Dennison et al. (1993)Heterozostera tasmanica Waterloo Bay, Australia 27°S 20.2 Dennison et al. (1993)
Chile 30°S 17.4 Dennison et al. (1993)Spencer Gulf, Australia 32°–35°S 4.4 Dennison et al. (1993)Victoria, Australia 38°S 5 Dennison et al. (1993)Port Phillip Bay, Australia 38°06′S 5 Bulthuis (1983a)Mean 10.4
Posidonia oceanica Malta 35°N 9.2 Dennison et al. (1993)Fraile Island, Murcia, Spain 37°N 10–16 Ruiz and Romero (2001)Port Lligat, Spain 40°–42°N 11.5 Olesen et al. (2002)Medas Island, Spain 42°N 7.8 Dennison et al. (1993)Mean 10.9
Posidonia angustifolia Waterloo Bay, Australia 27°S 24.7 Dennison et al. (1993)Posidonia ostenfeldii Waterloo Bay, Australia 27°S 24.7 Dennison et al. (1993)Posidonia sinuosa Waterloo Bay, Australia 27°S 24.7 Dennison et al. (1993)Ruppia maritima Brazil 32°S 8.2 Dennison et al. (1993)Ruppia megacarpa Wilson Inlet, Australia 34°–35°S 24 Carruthers and Walker (1999)Zostera noltii Cadiz Bay, Spain 36°30′N 2 Peralta et al. (2002)Zostera marina Japan 35°N 18.2 Dennison et al. (1993)
Denmark 54°–57°N 20.6 Dennison et al. (1993)Western Long Island Sound, USA 41°N 13 Koch and Beer (1996)Eastern Long Island Sound, USA 41°N 12 Koch and Beer (1996)Woods Hole, USA 41°N 18.6 Dennison et al. (1993)Netherlands 51°N 29.4 Dennison et al. (1993)Roskilde, Denmark 55°N 19.4 Dennison et al. (1993)Aarhus Bight, Denmark 56°N 11 Olesen and Sand-Jensen (1993)Kattegat, Denmark 57°N 20.1 Dennison et al. (1993)Mean 18
Tropical/subtropicalCymodocea nodosa Malta 35°N 7.3 Dennison et al. (1993)
Ebro Delta, Spain 40°S 10.2 Dennison et al. (1993)Alfacs Bay, Spain 40°–42°N 4.4 Olesen et al. (2002)Mean 7.3
Halodule wrightii Laguna Madre, USA 27°21′N 18 Dunton (1994)Laguna Madre, USA 27°21′N 15–20 Burd and Dunton (2001)Indian River Lagoon, USA 27°30′N 24–37 Kenworthy and Fonseca (1996)Indian River Lagoon, USA 27°30′N 20 Steward et al. (2005)Corpus Christi Bay, USA 27°49′N 18 Dunton (1994)Corpus Christi Bay, USA 27°49′N 20 Czerny and Dunton (1995)San Antonio Bay, USA 28°15′N 18 Dunton (1994)Florida, USA 25°–30°N 17.2 Dennison et al. (1993)Mean 20.7
Halophila decipiens Cuba 23°N 8.8 Dennison et al. (1993)Halophila decipiens St. Croix, USA 17°N 4.4 Dennison et al. (1993)Halophila engelmanni Cuba 23°N 23.7 Dennison et al. (1993)Syringodium filiforme Cuba 23°N 19.2 Dennison et al. (1993)
Florida, USA 25°–30°N 18.3 Dennison et al. (1993)Florida, USA 25°–30°N 17.2 Dennison et al. (1993)Indian River Lagoon, USA 27°02′N 24–37 Kenworthy and Fonseca (1996)Mean 23.1
Thalassia testudinum Puerto Rico 18°N 24.4 Dennison et al. (1993)Cuba 23°N 23.5 Dennison et al. (1993)Florida Bay, USA 25°N 13 Fourqurean and Zieman (1991)Corpus Christi Bay, USA 27°49′N 20 Czerny and Dunton (1995)Corpus Christi Bay, USA 27°49′N N14 Lee and Dunton (1997)Florida, USA 25°–30°N 15.3 Dennison et al. (1993)Mean 18.4
147K.-S. Lee et al. / Journal of Experimental Marine Biology and Ecology 350 (2007) 144–175
148 K.-S. Lee et al. / Journal of Experimental Marine Biology and Ecology 350 (2007) 144–175
(Hcomp), respectively (Dennison and Alberte, 1982, 1985;Zimmerman et al., 1994).
Photosynthetic parameters often show seasonal vari-ability (Dennison, 1987; Herzka and Dunton, 1997;Alcoverro et al., 1998). In Z. marina and Thalassiatestudinum, Pmax, dark respiration (Rd), α, Ik and Ic werelowest in winter, increased with higher water temperaturein the early spring and peaked in summer (Dennison,1987; Herzka and Dunton, 1997). Pérez and Romero(1992) also found higher Pmax and Ik values duringsummer (in comparison to winter values) for Cymodoceanodosa. Moreover, Ik and Ic of Posidonia oceanicashowed significantly higher values during warmer months(Alcoverro et al., 1998). Seasonality in photosyntheticparameters is likely controlled by changes in water tem-perature (Marsh et al., 1986; Herzka and Dunton, 1997;Masini and Manning, 1997). In Heterozostera tasmanicaand Z. marina, the initial slopes (α) were relativelyconstant with increasing temperature, whereas saturationirradiance (Ik), and compensation irradiance (Ic) increasedwith increasing temperatures (Bulthuis, 1983b; Marshet al., 1986). These increases in Ik and Ic reflect changes inPmax and dark respiration rates in response to highertemperatures. Masini and Manning (1997) also reportedincreased Ik and Ic values with increased water tempera-tures for Posidonia spp. and Amphibolis spp. Since Icoften increaseswith temperature,more light is necessary athigher temperatures to allow for positive carbon balance.
While seasonal variance is found for P–I parametersinfluenced by temperature, inter- and intra-specific dif-ferences are also found (Tables 2 and 3). These variancesmay reflect differences in photosynthetic processes ormethodologies employed (Dunton and Tomasko, 1994).Most P–I measurements have been conducted inlaboratories using leaf segments without non-photosyn-thetic tissues. Non-photosynthetic below-ground tissuescan account for more than 50% of the total seagrassbiomass, and must be supported by photosyntheticallyderived carbon and oxygen (Smith et al., 1984; Powellet al., 1989; Dunton, 1990; Caffrey and Kemp, 1991;Fourqurean and Zieman, 1991; Ralph et al., 1992;Agostini et al., 2003). Therefore, whole plant respiratoryoxygen demand is greater than the respiratory demandfor photosynthetic tissues only, and thus Ic and Ik mea-surements for intact plants will be considerably higherthan values measured using leaves alone (Table 3).Therefore, compensation irradiance estimated using leafsegments is of limited use in predicting whole plantcarbon balance (Dunton and Tomasko, 1994). Labora-tory experiments also tend to severely underestimate Icand Ik (Dunton and Tomasko, 1994; Herzka and Dunton,1997), in comparison of in situ and laboratory-derived
photosynthetic parameters, higher values of Ic, Ik, andlow relative quantum yields based on in situ shoot andwhole plant incubations have been reported for sea-grasses (Fourqurean and Zieman, 1991; Dunton andTomasko, 1994; Herzka and Dunton, 1997). Thus, theapplication of P–I models to assess seagrass lightrequirements is complicated by variability due to variousmethodologies used in P–I construction (Herzka andDunton, 1997).
A single species growing under different environ-mental conditions also have been shown to possessvarying light requirements (Table 2; Dennison, 1987;Masini and Manning, 1997; Ruiz and Romero, 2003).Plants collected near their maximum depth limits havehigher photosynthetic efficiencies (α) and lower lightrequirements for saturated photosynthesis than plantsgrowing in shallower waters (Masini and Manning,1997). Seagrasses can enhance light harvesting effi-ciencies through photo-acclimation during low lightconditions (West, 1990; Olesen and Sand-Jensen, 1993;Abal et al., 1994; Philippart, 1995; Olesen et al., 2002),thus plants growing near their depth limit may havehigher photosynthetic efficiencies. Lower Ic and Isat andgreater photosynthetic efficiencies have also beenobserved in seagrasses inhabiting inner harbors, wherelight availability is reduced through high turbidities, incomparison to less turbid outer harbor stations (Ruiz andRomero, 2003). The plants in the inner harbor werelikely subjected to light-limitation, and thus changes inphotosynthetic parameters are possibly photo-acclima-tization responses allowing seagrasses to maximizecarbon fixation under light limited conditions (Denni-son, 1987; Fourqurean and Zieman, 1991; Pérez andRomero, 1992; Herzka and Dunton, 1997; Alcoverroet al., 1998; Ruiz and Romero, 2003).
2.3. Growth rate and irradiance
Consistent with theP–I relationship, a seagrass growthresponse to light is described by a hyperbolic functionwith saturation kinetics (Olesen and Sand-Jensen, 1993;Vermaat and Verhagen, 1996; Peralta et al., 2002). Forexample, eelgrass growth rate was highest between 100and 150 μmol photons m−2 s−1, with light compensated-growth between 19 and 47μmol photonsm−2 s−1 (Olesenand Sand-Jensen, 1993). These saturation and compen-sation irradiances levels for growth resembled Ik and Icvalues determined from P–I curves for eelgrass (Tables 2and 3). Leaf growth rate of Zostera noltii, as a function ofunderwater irradiance, also revealed an asymptoticrelationship (Vermaat and Verhagen, 1996). Leaf growthrates were fairly constant above 5 mol photons m−2 d−1,
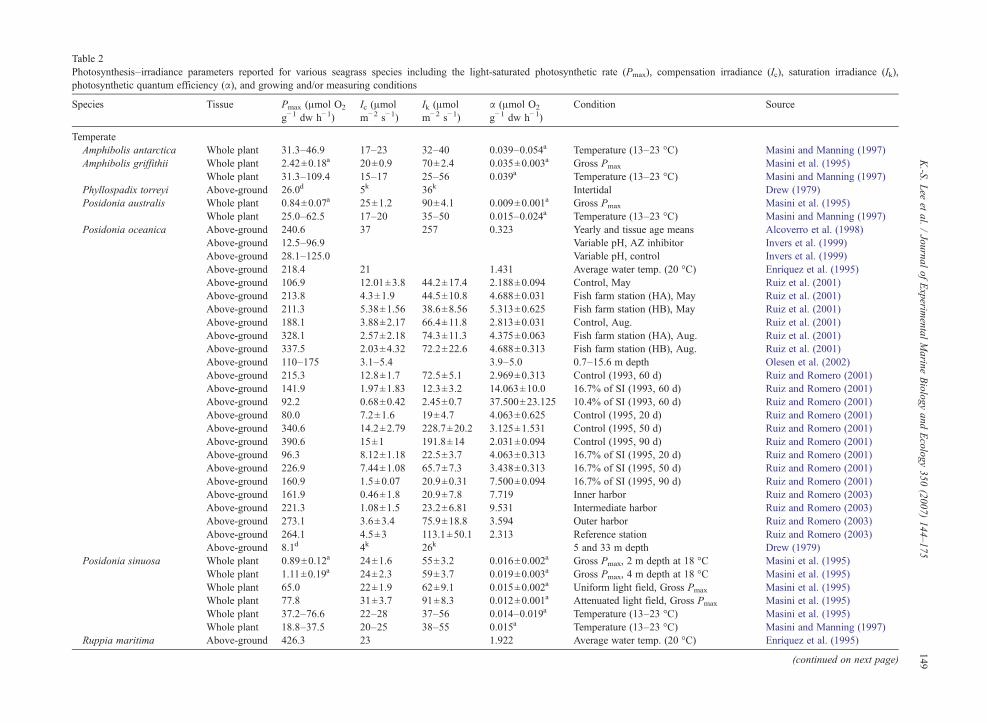
Table 2Photosynthesis–irradiance parameters reported for various seagrass species including the light-saturated photosynthetic rate (Pmax), compensation irradiance (Ic), saturation irradiance (Ik),photosynthetic quantum efficiency (α), and growing and/or measuring conditions
Species Tissue Pmax (μmol O2
g−1 dw h−1)Ic (μmolm−2 s−1)
Ik (μmolm−2 s−1)
α (μmol O2
g−1 dw h−1)Condition Source
TemperateAmphibolis antarctica Whole plant 31.3–46.9 17–23 32–40 0.039–0.054a Temperature (13–23 °C) Masini and Manning (1997)Amphibolis griffithii Whole plant 2.42±0.18a 20±0.9 70±2.4 0.035±0.003a Gross Pmax Masini et al. (1995)
Whole plant 31.3–109.4 15–17 25–56 0.039a Temperature (13–23 °C) Masini and Manning (1997)Phyllospadix torreyi Above-ground 26.0d 5k 36k Intertidal Drew (1979)Posidonia australis Whole plant 0.84±0.07a 25±1.2 90±4.1 0.009±0.001a Gross Pmax Masini et al. (1995)
Whole plant 25.0–62.5 17–20 35–50 0.015–0.024a Temperature (13–23 °C) Masini and Manning (1997)Posidonia oceanica Above-ground 240.6 37 257 0.323 Yearly and tissue age means Alcoverro et al. (1998)
Above-ground 12.5–96.9 Variable pH, AZ inhibitor Invers et al. (1999)Above-ground 28.1–125.0 Variable pH, control Invers et al. (1999)Above-ground 218.4 21 1.431 Average water temp. (20 °C) Enríquez et al. (1995)Above-ground 106.9 12.01±3.8 44.2±17.4 2.188±0.094 Control, May Ruiz et al. (2001)Above-ground 213.8 4.3±1.9 44.5±10.8 4.688±0.031 Fish farm station (HA), May Ruiz et al. (2001)Above-ground 211.3 5.38±1.56 38.6±8.56 5.313±0.625 Fish farm station (HB), May Ruiz et al. (2001)Above-ground 188.1 3.88±2.17 66.4±11.8 2.813±0.031 Control, Aug. Ruiz et al. (2001)Above-ground 328.1 2.57±2.18 74.3±11.3 4.375±0.063 Fish farm station (HA), Aug. Ruiz et al. (2001)Above-ground 337.5 2.03±4.32 72.2±22.6 4.688±0.313 Fish farm station (HB), Aug. Ruiz et al. (2001)Above-ground 110–175 3.1–5.4 3.9–5.0 0.7–15.6 m depth Olesen et al. (2002)Above-ground 215.3 12.8±1.7 72.5±5.1 2.969±0.313 Control (1993, 60 d) Ruiz and Romero (2001)Above-ground 141.9 1.97±1.83 12.3±3.2 14.063±10.0 16.7% of SI (1993, 60 d) Ruiz and Romero (2001)Above-ground 92.2 0.68±0.42 2.45±0.7 37.500±23.125 10.4% of SI (1993, 60 d) Ruiz and Romero (2001)Above-ground 80.0 7.2±1.6 19±4.7 4.063±0.625 Control (1995, 20 d) Ruiz and Romero (2001)Above-ground 340.6 14.2±2.79 228.7±20.2 3.125±1.531 Control (1995, 50 d) Ruiz and Romero (2001)Above-ground 390.6 15±1 191.8±14 2.031±0.094 Control (1995, 90 d) Ruiz and Romero (2001)Above-ground 96.3 8.12±1.18 22.5±3.7 4.063±0.313 16.7% of SI (1995, 20 d) Ruiz and Romero (2001)Above-ground 226.9 7.44±1.08 65.7±7.3 3.438±0.313 16.7% of SI (1995, 50 d) Ruiz and Romero (2001)Above-ground 160.9 1.5±0.07 20.9±0.31 7.500±0.094 16.7% of SI (1995, 90 d) Ruiz and Romero (2001)Above-ground 161.9 0.46±1.8 20.9±7.8 7.719 Inner harbor Ruiz and Romero (2003)Above-ground 221.3 1.08±1.5 23.2±6.81 9.531 Intermediate harbor Ruiz and Romero (2003)Above-ground 273.1 3.6±3.4 75.9±18.8 3.594 Outer harbor Ruiz and Romero (2003)Above-ground 264.1 4.5±3 113.1±50.1 2.313 Reference station Ruiz and Romero (2003)Above-ground 8.1d 4k 26k 5 and 33 m depth Drew (1979)
Posidonia sinuosa Whole plant 0.89±0.12a 24±1.6 55±3.2 0.016±0.002a Gross Pmax, 2 m depth at 18 °C Masini et al. (1995)Whole plant 1.11±0.19a 24±2.3 59±3.7 0.019±0.003a Gross Pmax, 4 m depth at 18 °C Masini et al. (1995)Whole plant 65.0 22±1.9 62±9.1 0.015±0.002a Uniform light field, Gross Pmax Masini et al. (1995)Whole plant 77.8 31±3.7 91±8.3 0.012±0.001a Attenuated light field, Gross Pmax Masini et al. (1995)Whole plant 37.2–76.6 22–28 37–56 0.014–0.019a Temperature (13–23 °C) Masini et al. (1995)Whole plant 18.8–37.5 20–25 38–55 0.015a Temperature (13–23 °C) Masini and Manning (1997)
Ruppia maritima Above-ground 426.3 23 1.922 Average water temp. (20 °C) Enríquez et al. (1995)
(continued on next page)
149K.-S.
Lee
etal.
/Journal
ofExperim
entalMarine
Biology
andEcology
350(2007)
144–175
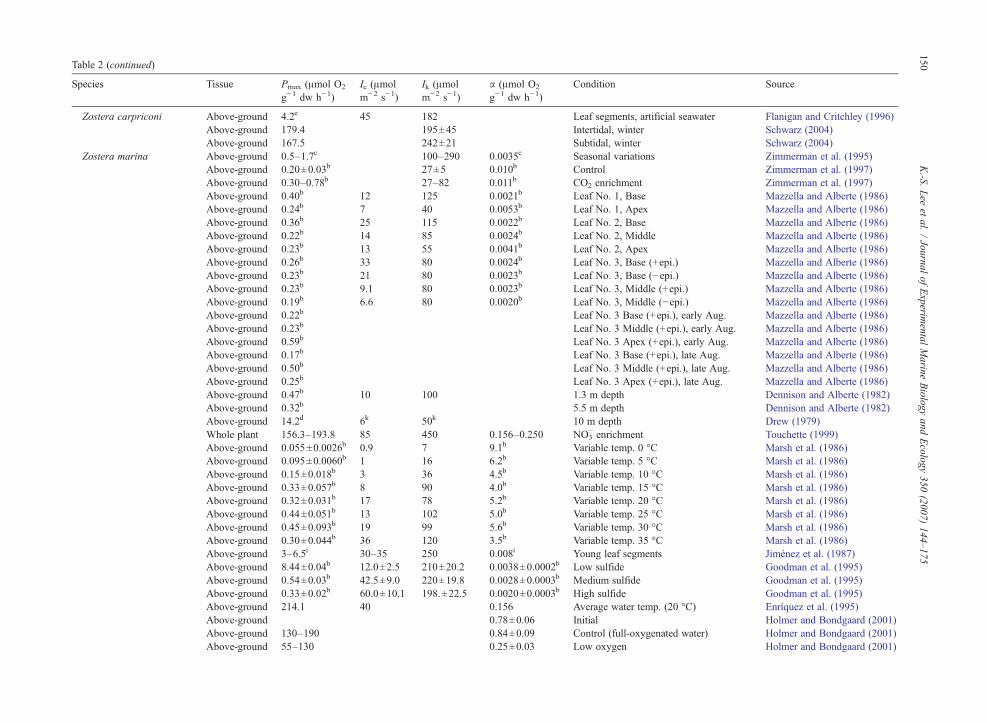
Table 2 (continued)
Species Tissue Pmax (μmol O2
g−1 dw h−1)Ic (μmolm−2 s−1)
Ik (μmolm−2 s−1)
α (μmol O2
g−1 dw h−1)Condition Source
Zostera carpriconi Above-ground 4.2e 45 182 Leaf segments, artificial seawater Flanigan and Critchley (1996)Above-ground 179.4 195±45 Intertidal, winter Schwarz (2004)Above-ground 167.5 242±21 Subtidal, winter Schwarz (2004)
Zostera marina Above-ground 0.5–1.7c 100–290 0.0035c Seasonal variations Zimmerman et al. (1995)Above-ground 0.20±0.03b 27±5 0.010b Control Zimmerman et al. (1997)Above-ground 0.30–0.78b 27–82 0.011b CO2 enrichment Zimmerman et al. (1997)Above-ground 0.40b 12 125 0.0021b Leaf No. 1, Base Mazzella and Alberte (1986)Above-ground 0.24b 7 40 0.0053b Leaf No. 1, Apex Mazzella and Alberte (1986)Above-ground 0.36b 25 115 0.0022b Leaf No. 2, Base Mazzella and Alberte (1986)Above-ground 0.22b 14 85 0.0024b Leaf No. 2, Middle Mazzella and Alberte (1986)Above-ground 0.23b 13 55 0.0041b Leaf No. 2, Apex Mazzella and Alberte (1986)Above-ground 0.26b 33 80 0.0024b Leaf No. 3, Base (+epi.) Mazzella and Alberte (1986)Above-ground 0.23b 21 80 0.0023b Leaf No. 3, Base (−epi.) Mazzella and Alberte (1986)Above-ground 0.23b 9.1 80 0.0023b Leaf No. 3, Middle (+epi.) Mazzella and Alberte (1986)Above-ground 0.19b 6.6 80 0.0020b Leaf No. 3, Middle (−epi.) Mazzella and Alberte (1986)Above-ground 0.22b Leaf No. 3 Base (+epi.), early Aug. Mazzella and Alberte (1986)Above-ground 0.23b Leaf No. 3 Middle (+epi.), early Aug. Mazzella and Alberte (1986)Above-ground 0.59b Leaf No. 3 Apex (+epi.), early Aug. Mazzella and Alberte (1986)Above-ground 0.17b Leaf No. 3 Base (+epi.), late Aug. Mazzella and Alberte (1986)Above-ground 0.50b Leaf No. 3 Middle (+epi.), late Aug. Mazzella and Alberte (1986)Above-ground 0.25b Leaf No. 3 Apex (+epi.), late Aug. Mazzella and Alberte (1986)Above-ground 0.47b 10 100 1.3 m depth Dennison and Alberte (1982)Above-ground 0.32b 5.5 m depth Dennison and Alberte (1982)Above-ground 14.2d 6k 50k 10 m depth Drew (1979)Whole plant 156.3–193.8 85 450 0.156–0.250 NO3
− enrichment Touchette (1999)Above-ground 0.055±0.0026b 0.9 7 9.1b Variable temp. 0 °C Marsh et al. (1986)Above-ground 0.095±0.0060b 1 16 6.2b Variable temp. 5 °C Marsh et al. (1986)Above-ground 0.15±0.018b 3 36 4.5b Variable temp. 10 °C Marsh et al. (1986)Above-ground 0.33±0.057b 8 90 4.0b Variable temp. 15 °C Marsh et al. (1986)Above-ground 0.32±0.031b 17 78 5.2b Variable temp. 20 °C Marsh et al. (1986)Above-ground 0.44±0.051b 13 102 5.0b Variable temp. 25 °C Marsh et al. (1986)Above-ground 0.45±0.093b 19 99 5.6b Variable temp. 30 °C Marsh et al. (1986)Above-ground 0.30±0.044b 36 120 3.5b Variable temp. 35 °C Marsh et al. (1986)Above-ground 3–6.5i 30–35 250 0.008i Young leaf segments Jiménez et al. (1987)Above-ground 8.44±0.04b 12.0±2.5 210±20.2 0.0038±0.0002b Low sulfide Goodman et al. (1995)Above-ground 0.54±0.03b 42.5±9.0 220±19.8 0.0028±0.0003b Medium sulfide Goodman et al. (1995)Above-ground 0.33±0.02b 60.0±10.1 198.±22.5 0.0020±0.0003b High sulfide Goodman et al. (1995)Above-ground 214.1 40 0.156 Average water temp. (20 °C) Enríquez et al. (1995)Above-ground 0.78±0.06 Initial Holmer and Bondgaard (2001)Above-ground 130–190 0.84±0.09 Control (full-oxygenated water) Holmer and Bondgaard (2001)Above-ground 55–130 0.25±0.03 Low oxygen Holmer and Bondgaard (2001)
150K.-S.
Lee
etal.
/Journal
ofExperim
entalMarine
Biology
andEcology
350(2007)
144–175

Above-ground 25–90 0.56±0.01 Low sulfide Holmer and Bondgaard (2001)Above-ground 20–80 High sulfide Holmer and Bondgaard (2001)Above-ground 0.7–2.4c 50–200 0.09–0.029c Lagoon, seasonal Cabello-Pasini et al. (2002)Above-ground 0.5–1.8c 10–350 0.05–0.062c Open coast, seasonal Cabello-Pasini et al. (2002)
Zostera noltii Whole plant 71–236f 98–300 222–390 0.23–0.63f Seasonal variations Vermaat and Verhagen (1996)Above-ground 3–6.5i 30–35 350 0.008i Young leaf segments Jiménez et al. (1987)Above-ground 378.8 56 1.425 Average water temp. (20 °C) Enríquez et al. (1995)Above-ground 175 0.042±0.003e Seasonal Silva and Santos (2004)
Tropical/subtropicalCymodocea nodosa Above-ground 93.8 Water flow N0.64 m s−1 Koch (1994)
Above-ground 27.2–75.0 0.07–50.6 25.9–165.9 0.281–1.219 10 °C Terrados and Ros (1995)Above-ground 60.6–237.2 18.1–32.1 77.8–231.2 0.625–1.219 20 °C Terrados and Ros (1995)Above-ground 59.1–438.1 26.0–116.4 135.1–400.9 0.156–0.159 30 °C Terrados and Ros (1995)Above-ground 62.5–228.1 Variable pH, AZ inhibitor Invers et al. (1999)Above-ground 150.0–290.6 Variable pH, control Invers et al. (1999)Above-ground 262.2 61 1.444 Average water temp. (20 °C) Enríquez et al. (1995)Above-ground 165–250 5.7–10.7 0.4–3.8 m depth Olesen et al. (2002)Above-ground 21.8d 4k 38k 0.3 and 33 m depth Drew (1979)
Cymodocea rotundata Above-ground 169.7–261.3 12.5–37.1 0.625–3.125 Seasonal Agawin et al. (2001)Cymodocea serrulata Whole plant 0.476±0.135g 0.5 m depth Hena et al. (2001)
Whole plant 0.292±0.030g 2.0 m depth Hena et al. (2001)Enhalus acoroides Above-ground 40.9–196.3 2.5–26.0 0.313–6.250 Seasonal Agawin et al. (2001)Halodule uninervis Above-ground 0.12b 20–40 50 Variable depth Beer and Waisel (1982)Halodule wrightii Whole plant 456–651 48–66 245–429 1.5–2.3 In situ, Blackjack peninsula Dunton (1996)
Whole plant 203–652 48–164 147–652 0.6–2.2 In situ, East Flats Dunton (1996)Whole plant 140–1104 37–177 189–453 0.5–2.4 In situ, seasonal Dunton and Tomasko (1994)Whole plant 441±80 111±21 349±27 1.3±0.2 Field (28–30 °C) Dunton and Tomasko (1994)Above-ground 421±21 22±2 101±4 4.2±0.3 Lab (29 °C) Dunton and Tomasko (1994)
Halophila engelmannii Above-ground 10–60 432–504 Seasonality, salinity Dawes et al. (1987)Halophila johnsonii Above-ground 10–510 2–14 14–41 5–13 Salinity (0–60 PSU) Torquemada et al. (2005)
Above-ground 125–480 2–10.5 25–52 6.2–11.8 Temp. (15–25 °C)+Salinity (30, 50 PSU) Torquemada et al. (2005)Above-ground 310–720 2–7.2 28–65 9–18 pH (5–8.2)+Salinity (30, 50 PSU) Torquemada et al. (2005)
Halophila stipulacea Above-ground 40b 20–40 100 Variable depth Beer and Waisel (1982)Whole plant 9.0d 2k 20k 0.5 m depth Drew (1979)
(continued on next page)
151K.-S.
Lee
etal.
/Journal
ofExperim
entalMarine
Biology
andEcology
350(2007)
144–175
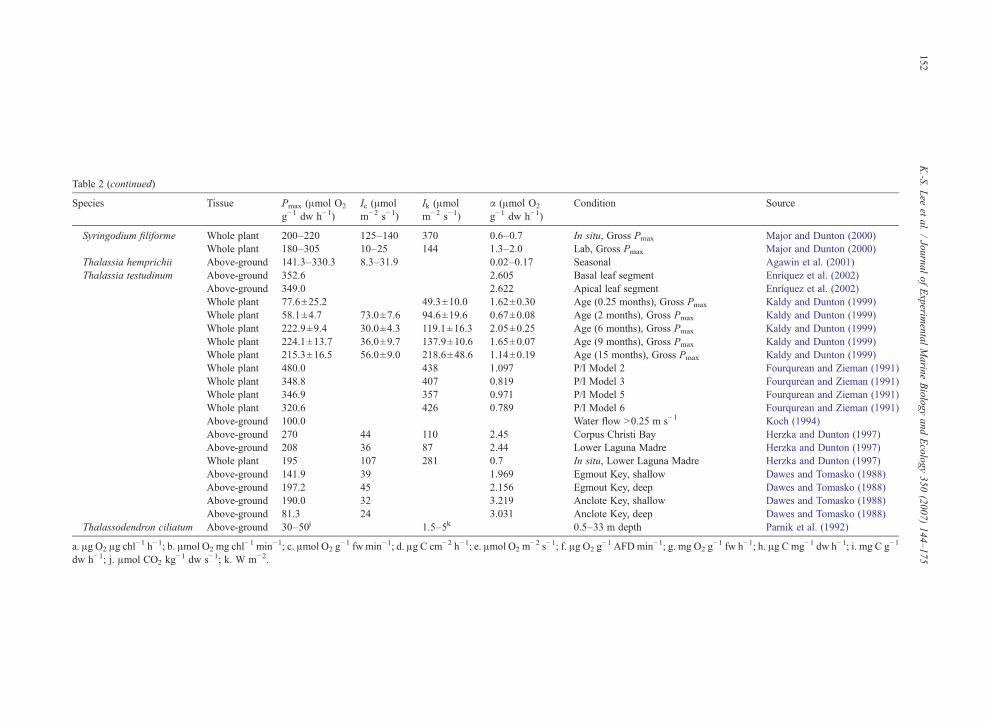
Table 2 (continued)
Species Tissue Pmax (μmol O2
g−1 dw h−1)Ic (μmolm−2 s−1)
Ik (μmolm−2 s−1)
α (μmol O2
g−1 dw h−1)Condition Source
Syringodium filiforme Whole plant 200–220 125–140 370 0.6–0.7 In situ, Gross Pmax Major and Dunton (2000)Whole plant 180–305 10–25 144 1.3–2.0 Lab, Gross Pmax Major and Dunton (2000)
Thalassia hemprichii Above-ground 141.3–330.3 8.3–31.9 0.02–0.17 Seasonal Agawin et al. (2001)Thalassia testudinum Above-ground 352.6 2.605 Basal leaf segment Enríquez et al. (2002)
Above-ground 349.0 2.622 Apical leaf segment Enríquez et al. (2002)Whole plant 77.6±25.2 49.3±10.0 1.62±0.30 Age (0.25 months), Gross Pmax Kaldy and Dunton (1999)Whole plant 58.1±4.7 73.0±7.6 94.6±19.6 0.67±0.08 Age (2 months), Gross Pmax Kaldy and Dunton (1999)Whole plant 222.9±9.4 30.0±4.3 119.1±16.3 2.05±0.25 Age (6 months), Gross Pmax Kaldy and Dunton (1999)Whole plant 224.1±13.7 36.0±9.7 137.9±10.6 1.65±0.07 Age (9 months), Gross Pmax Kaldy and Dunton (1999)Whole plant 215.3±16.5 56.0±9.0 218.6±48.6 1.14±0.19 Age (15 months), Gross Pmax Kaldy and Dunton (1999)Whole plant 480.0 438 1.097 P/I Model 2 Fourqurean and Zieman (1991)Whole plant 348.8 407 0.819 P/I Model 3 Fourqurean and Zieman (1991)Whole plant 346.9 357 0.971 P/I Model 5 Fourqurean and Zieman (1991)Whole plant 320.6 426 0.789 P/I Model 6 Fourqurean and Zieman (1991)Above-ground 100.0 Water flow N0.25 m s−1 Koch (1994)Above-ground 270 44 110 2.45 Corpus Christi Bay Herzka and Dunton (1997)Above-ground 208 36 87 2.44 Lower Laguna Madre Herzka and Dunton (1997)Whole plant 195 107 281 0.7 In situ, Lower Laguna Madre Herzka and Dunton (1997)Above-ground 141.9 39 1.969 Egmout Key, shallow Dawes and Tomasko (1988)Above-ground 197.2 45 2.156 Egmout Key, deep Dawes and Tomasko (1988)Above-ground 190.0 32 3.219 Anclote Key, shallow Dawes and Tomasko (1988)Above-ground 81.3 24 3.031 Anclote Key, deep Dawes and Tomasko (1988)
Thalassodendron ciliatum Above-ground 30–50j 1.5–5k 0.5–33 m depth Parnik et al. (1992)
a. μg O2 μg chl−1 h−1; b. μmol O2 mg chl−1 min−1; c. μmol O2 g
−1 fw min−1; d. μg C cm−2 h−1; e. μmol O2 m−2 s−1; f. μg O2 g
−1 AFDmin−1; g. mg O2 g−1 fw h−1; h. μg C mg−1 dw h−1; i. mg C g−1
dw h−1; j. μmol CO2 kg−1 dw s−1; k. W m−2.
152K.-S.
Lee
etal.
/Journal
ofExperim
entalMarine
Biology
andEcology
350(2007)
144–175
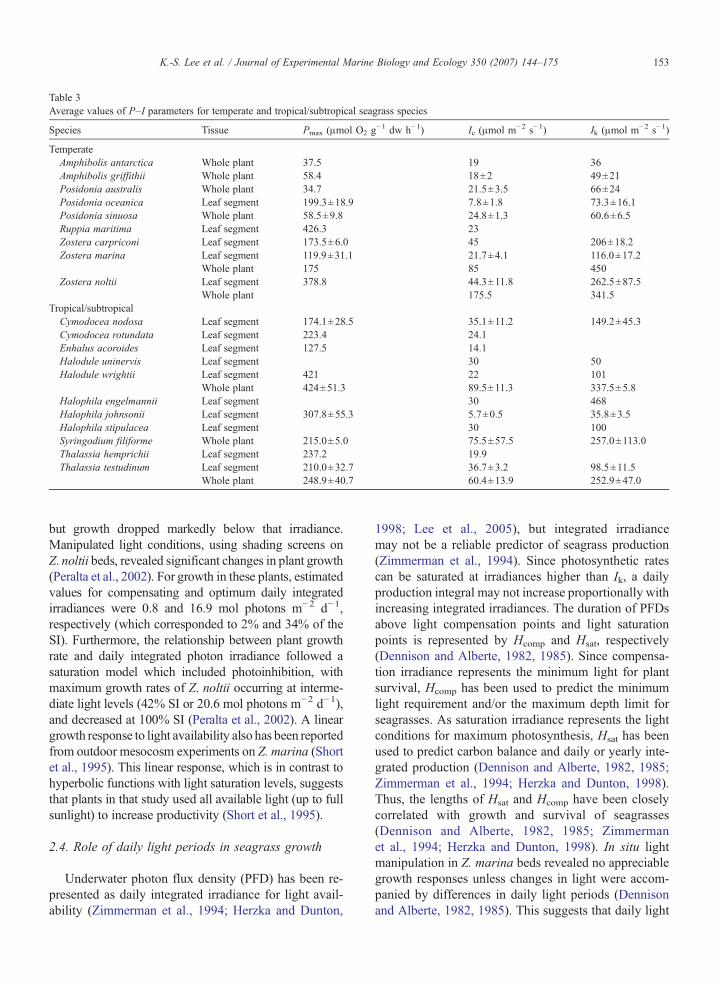
Table 3Average values of P–I parameters for temperate and tropical/subtropical seagrass species
Species Tissue Pmax (μmol O2 g−1 dw h−1) Ic (μmol m−2 s−1) Ik (μmol m−2 s−1)
TemperateAmphibolis antarctica Whole plant 37.5 19 36Amphibolis griffithii Whole plant 58.4 18±2 49±21Posidonia australis Whole plant 34.7 21.5±3.5 66±24Posidonia oceanica Leaf segment 199.3±18.9 7.8±1.8 73.3±16.1Posidonia sinuosa Whole plant 58.5±9.8 24.8±1.3 60.6±6.5Ruppia maritima Leaf segment 426.3 23Zostera carpriconi Leaf segment 173.5±6.0 45 206±18.2Zostera marina Leaf segment 119.9±31.1 21.7±4.1 116.0±17.2
Whole plant 175 85 450Zostera noltii Leaf segment 378.8 44.3±11.8 262.5±87.5
Whole plant 175.5 341.5Tropical/subtropical
Cymodocea nodosa Leaf segment 174.1±28.5 35.1±11.2 149.2±45.3Cymodocea rotundata Leaf segment 223.4 24.1Enhalus acoroides Leaf segment 127.5 14.1Halodule uninervis Leaf segment 30 50Halodule wrightii Leaf segment 421 22 101
Whole plant 424±51.3 89.5±11.3 337.5±5.8Halophila engelmannii Leaf segment 30 468Halophila johnsonii Leaf segment 307.8±55.3 5.7±0.5 35.8±3.5Halophila stipulacea Leaf segment 30 100Syringodium filiforme Whole plant 215.0±5.0 75.5±57.5 257.0±113.0Thalassia hemprichii Leaf segment 237.2 19.9Thalassia testudinum Leaf segment 210.0±32.7 36.7±3.2 98.5±11.5
Whole plant 248.9±40.7 60.4±13.9 252.9±47.0
153K.-S. Lee et al. / Journal of Experimental Marine Biology and Ecology 350 (2007) 144–175
but growth dropped markedly below that irradiance.Manipulated light conditions, using shading screens onZ. noltii beds, revealed significant changes in plant growth(Peralta et al., 2002). For growth in these plants, estimatedvalues for compensating and optimum daily integratedirradiances were 0.8 and 16.9 mol photons m−2 d−1,respectively (which corresponded to 2% and 34% of theSI). Furthermore, the relationship between plant growthrate and daily integrated photon irradiance followed asaturation model which included photoinhibition, withmaximum growth rates of Z. noltii occurring at interme-diate light levels (42% SI or 20.6 mol photons m−2 d−1),and decreased at 100% SI (Peralta et al., 2002). A lineargrowth response to light availability also has been reportedfrom outdoor mesocosm experiments on Z. marina (Shortet al., 1995). This linear response, which is in contrast tohyperbolic functions with light saturation levels, suggeststhat plants in that study used all available light (up to fullsunlight) to increase productivity (Short et al., 1995).
2.4. Role of daily light periods in seagrass growth
Underwater photon flux density (PFD) has been re-presented as daily integrated irradiance for light avail-ability (Zimmerman et al., 1994; Herzka and Dunton,
1998; Lee et al., 2005), but integrated irradiancemay not be a reliable predictor of seagrass production(Zimmerman et al., 1994). Since photosynthetic ratescan be saturated at irradiances higher than Ik, a dailyproduction integral may not increase proportionally withincreasing integrated irradiances. The duration of PFDsabove light compensation points and light saturationpoints is represented by Hcomp and Hsat, respectively(Dennison and Alberte, 1982, 1985). Since compensa-tion irradiance represents the minimum light for plantsurvival, Hcomp has been used to predict the minimumlight requirement and/or the maximum depth limit forseagrasses. As saturation irradiance represents the lightconditions for maximum photosynthesis, Hsat has beenused to predict carbon balance and daily or yearly inte-grated production (Dennison and Alberte, 1982, 1985;Zimmerman et al., 1994; Herzka and Dunton, 1998).Thus, the lengths of Hsat and Hcomp have been closelycorrelated with growth and survival of seagrasses(Dennison and Alberte, 1982, 1985; Zimmermanet al., 1994; Herzka and Dunton, 1998). In situ lightmanipulation in Z. marina beds revealed no appreciablegrowth responses unless changes in light were accom-panied by differences in daily light periods (Dennisonand Alberte, 1982, 1985). This suggests that daily light
154 K.-S. Lee et al. / Journal of Experimental Marine Biology and Ecology 350 (2007) 144–175
periods (Hsat and Hcomp), rather than absolute lightintensity, are important features controlling seagrassphotosynthesis and growth (Dennison and Alberte,1982, 1985).
Hsat ranged from 9.2 to 12.8 h (Hcomp was between11.2 and 12.4) in shallow Z. marina beds in GreatHarbor, MA, while Hsat ranged from 6.4 to 9 h in deeperbeds (Table 4; Dennison and Alberte, 1982, 1985). Wheneelgrass growth was plotted as a function of Hsat, the rateof growth showed saturation-type responses; with Hsat
values exceeding 10 h did not enhance eelgrass growth(Dennison and Alberte, 1985). However, eelgrass leafgrowth significantly decreased when Hsat values fellbelow 10 h (Dennison and Alberte, 1985). Deeper eel-grass beds had shorter Hsat (b6 h) resulting in low dailycarbon gains, and elevated plant mortalities. These resultssuggest that an Hsat value of 6 h is minimum for eelgrassgrowth and survival (Dennison and Alberte, 1985).Additionally, an Hsat of 10 h was suggested as a suitableindicator of sufficient light for eelgrass growth. Hsat forpersistent P. oceanica and Z. marina beds were approxi-mately 10 h (Table 4; Zimmerman et al., 1995; Koch andBeer, 1996). In a persistent T. testudinum bed in southernTexas, monthly average Hsat ranged between 4 and 10 h(Table 4; Herzka and Dunton, 1998), and when Hsat waslimited to 4 h in June, T. testudinum entered into a severenegative carbon balance. Nevertheless, significant pro-duction of T. testudinum in Florida Bay has been reportedat depths (3 to 5 m) where the daily Hsat period was zero(Fourqurean and Zieman, 1991). Since photosynthesiscan continue when light levels are below Ik, substantialcarbon fixation rates were observed at depths where Hsat
period was 0 h. Therefore, Hsat values provide a goodapproximation of daily production, however there may besituations where it is inappropriate (Fourqurean andZieman, 1991). Since T. testudinum has higher Ik valuescompared to P. oceanica and Z. marina, Hsat for T. tes-tudinum were usually shorter than those at the P. ocea-nica and Z. marina (Table 4).
In the Hsat model for daily production, gross photo-synthesis can be calculated by multiplying Pmax withHsat, and net photosynthesis can be determined by sub-tracting respiration from gross photosynthesis (Dennison,1987; Zimmerman et al., 1994; Herzka and Dunton,1998). The Hsat model assumes zero production duringperiods when underwater irradiance is lower than Ik;thus, it can lead to an underestimation of production(Henley, 1993; Zimmerman et al., 1994; Herzka andDunton, 1998). TheHsat model has been used to examinegrowth depth limits, light requirements, carbon balances,and productivities for several seagrass species (Dennisonand Alberte, 1982, Fourqurean and Zieman, 1991;
Dunton, 1994; Herzka and Dunton, 1998). High correla-tions between net photosynthesis and in situ growth rateshave been observed for Z. marina (Dennison, 1987).Zimmerman et al. (1994) suggested that accurate inte-grated production can be predicted using the Hsat modelwhen the daily Hsat period was calculated from con-tinuous PFD measurements. These results indicate that asimple model using P–I parameters and Hsat can be usedto predict seagrass productivity. However, the Hsat modelmay significantly underestimated production of T. testu-dinum when daily underwater PFD was less than 15 molphotons m−2 d−1 (Herzka and Dunton, 1998). The15 mol photons m−2 d−1 represents an average instan-taneous PFD of 300 μmol photons m−2 s−1, which isclose to in situ Ik of T. testudinum in southern Texas.Therefore, the Hsat model may fail to accurately predictseagrass production when plants are not light-saturatedduring a significant portion of the daily photoperiod(Herzka and Dunton, 1998).
2.5. Effects of light reduction on seagrass growth
Seagrasses may exhibit several physiological andmorphological responses to light reduction. The magni-tude and time required to initiate a response may dependon species, light intensity and duration, and interactionsbetween environmental conditions (e.g. temperature andnutrient availabilities; Bulthuis, 1983a,b; Gordon et al.,1994; VanLent et al., 1995; Abal, 1996; Grice et al., 1996;Longstaff and Dennison, 1999). In Halophila pinifolia,physiological responses to light reductions includechanges in amino acid content, chlorophyll (chl) levels,and δ13C occurred well before morphological changes areobserved (e.g. biomass, shoot density, and canopy height;Longstaff and Dennison, 1999). Photoadaptive responsesin seagrasses to reductions in irradiance have beenreflected in seagrasses through decreases in plant size,shoot density, biomass, leaf production rates and chlcomposition (including a:b ratios and chl content;Wiginton and McMillan, 1979; Dennison and Alberte,1982, 1985; Neverauskas, 1988; Tomasko and Dawes,1989; Abal et al., 1994; Lee and Dunton, 1997; Peraltaet al., 2002). Lower leaf biomass and size are early plantresponses to light reduction (Gordon et al., 1994; Lee andDunton, 1997), for example, leaf biomass inT. testudinumdeclined more rapidly than below-ground biomassfollowing light reductions (Lee and Dunton, 1997).Changes in leaf biomass from shading is a product ofetiolation and defoliation, which are common responsesin both terrestrial and submersed plants to lower lightconditions (Addicott and Lyon, 1973; Backman andBarilotti, 1976; Neverauskas, 1988; Gordon et al., 1994;
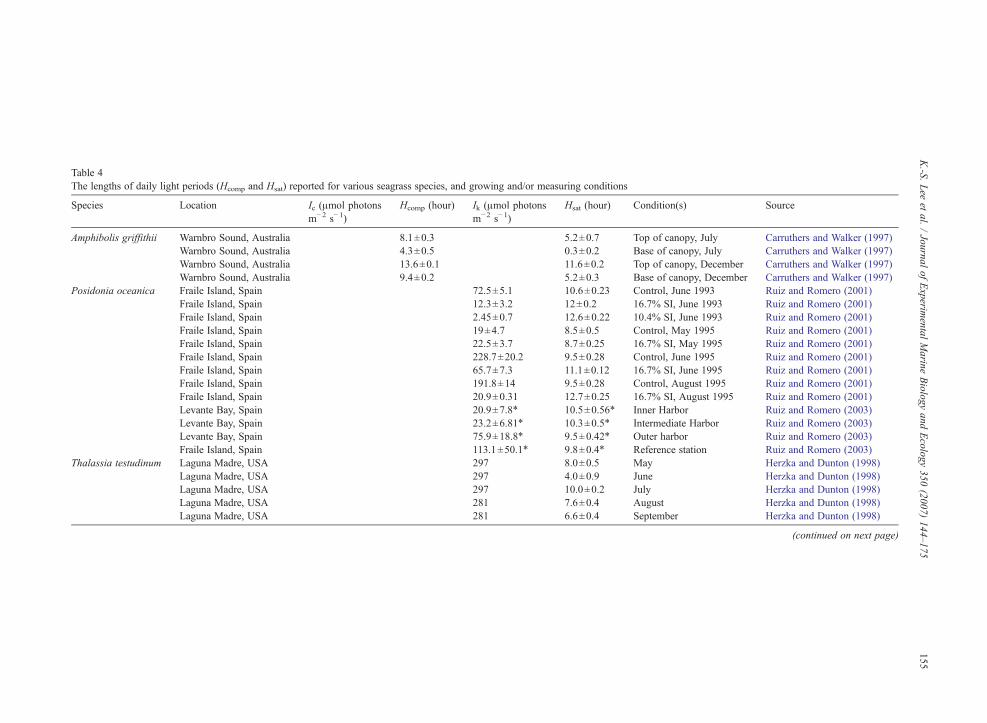
Table 4The lengths of daily light periods (Hcomp and Hsat) reported for various seagrass species, and growing and/or measuring conditions
Species Location Ic (μmol photonsm−2 s−1)
Hcomp (hour) Ik (μmol photonsm−2 s−1)
Hsat (hour) Condition(s) Source
Amphibolis griffithii Warnbro Sound, Australia 8.1±0.3 5.2±0.7 Top of canopy, July Carruthers and Walker (1997)Warnbro Sound, Australia 4.3±0.5 0.3±0.2 Base of canopy, July Carruthers and Walker (1997)Warnbro Sound, Australia 13.6±0.1 11.6±0.2 Top of canopy, December Carruthers and Walker (1997)Warnbro Sound, Australia 9.4±0.2 5.2±0.3 Base of canopy, December Carruthers and Walker (1997)
Posidonia oceanica Fraile Island, Spain 72.5±5.1 10.6±0.23 Control, June 1993 Ruiz and Romero (2001)Fraile Island, Spain 12.3±3.2 12±0.2 16.7% SI, June 1993 Ruiz and Romero (2001)Fraile Island, Spain 2.45±0.7 12.6±0.22 10.4% SI, June 1993 Ruiz and Romero (2001)Fraile Island, Spain 19±4.7 8.5±0.5 Control, May 1995 Ruiz and Romero (2001)Fraile Island, Spain 22.5±3.7 8.7±0.25 16.7% SI, May 1995 Ruiz and Romero (2001)Fraile Island, Spain 228.7±20.2 9.5±0.28 Control, June 1995 Ruiz and Romero (2001)Fraile Island, Spain 65.7±7.3 11.1±0.12 16.7% SI, June 1995 Ruiz and Romero (2001)Fraile Island, Spain 191.8±14 9.5±0.28 Control, August 1995 Ruiz and Romero (2001)Fraile Island, Spain 20.9±0.31 12.7±0.25 16.7% SI, August 1995 Ruiz and Romero (2001)Levante Bay, Spain 20.9±7.8⁎ 10.5±0.56⁎ Inner Harbor Ruiz and Romero (2003)Levante Bay, Spain 23.2±6.81⁎ 10.3±0.5⁎ Intermediate Harbor Ruiz and Romero (2003)Levante Bay, Spain 75.9±18.8⁎ 9.5±0.42⁎ Outer harbor Ruiz and Romero (2003)Fraile Island, Spain 113.1±50.1⁎ 9.8±0.4⁎ Reference station Ruiz and Romero (2003)
Thalassia testudinum Laguna Madre, USA 297 8.0±0.5 May Herzka and Dunton (1998)Laguna Madre, USA 297 4.0±0.9 June Herzka and Dunton (1998)Laguna Madre, USA 297 10.0±0.2 July Herzka and Dunton (1998)Laguna Madre, USA 281 7.6±0.4 August Herzka and Dunton (1998)Laguna Madre, USA 281 6.6±0.4 September Herzka and Dunton (1998)
(continued on next page)
155K.-S.
Lee
etal.
/Journal
ofExperim
entalMarine
Biology
andEcology
350(2007)
144–175

Table 4 (continued)
Species Location Ic (μmol photonsm−2 s−1)
Hcomp (hour) Ik (μmol photonsm−2 s−1)
Hsat (hour) Condition(s) Source
Florida Bay, USA 13.5 10.38 1 m depth Fourqurean and Zieman (1991)Florida Bay, USA 13.2 8.8 2 m depth Fourqurean and Zieman (1991)Florida Bay, USA 12.6 0 3 m depth Fourqurean and Zieman (1991)Florida Bay, USA 11.9 0 4 m depth Fourqurean and Zieman (1991)Florida Bay, USA 11.5 0 5 m depth Fourqurean and Zieman (1991)Laguna Madre, USA 80 7.55±0.50 315 2.75±0.87 Field Dunton (1994)Laguna Madre, USA 80 7.55±0.50 101 6.88±0.57 Lab Dunton (1994)Corpus Christi Bay, USA 80 7.90±0.10 315 3.6±0.46 Field Dunton (1994)Corpus Christi Bay, USA 80 7.90±0.10 101 7.6±0.47 Lab Dunton (1994)San Antonio Bay, USA 80 6.0 315 2.1 Field Dunton (1994)San Antonio Bay, USA 80 6.0 101 5.3 Lab Dunton (1994)
Zostera marina Great Harbor, USA 10 12.4 100 9.2 Shallow station Dennison and Alberte (1982)Great Harbor, USA 10 11.2 100 6.4 Deep station Dennison and Alberte (1982)Great Harbor, USA 100 12.8 Shallow station, June Dennison and Alberte (1985)Great Harbor, USA 100 12.1 Shallow station, August Dennison and Alberte (1985)Great Harbor, USA 100 9 Deep station, June Dennison and Alberte (1985)Great Harbor, USA 100 8.8 Deep station, August Dennison and Alberte (1985)Great Harbor, USA 100 13.1 Shallow, June Dennison et al. (1987)Great Harbor, USA 100 10.4 Deep, June Dennison et al. (1987)Great Harbor, USA 100 12 Shallow, August Dennison et al. (1987)Great Harbor, USA 100 8.3 Deep, August Dennison et al. (1987)Keil Cove, USA 10.8±1.9 0.5 m depth Zimmerman et al. (1995)Paradise Cove, USA 10.3±2.3 0.5 m depth Zimmerman et al. (1995)Long Island Sound, USA 150 13 Seasonal Koch and Beer (1996)
156K.-S.
Lee
etal.
/Journal
ofExperim
entalMarine
Biology
andEcology
350(2007)
144–175
157K.-S. Lee et al. / Journal of Experimental Marine Biology and Ecology 350 (2007) 144–175
Lee and Dunton, 1997). During the active growingseason, loss of leaf tissue may negatively impact photo-synthetic carbon fixation and oxygen production (includ-ing the transport of oxygen to below-ground tissues; Leeand Dunton, 1997, 2000; Connell et al., 1999).
Non-structural carbohydrates are usually high inrhizome tissues and serve as energy reserves for plantsduring low photosynthetic periods (Dawes and Lawr-ence, 1980; Durako and Moffler, 1985; Lee and Dunton,1996; Cabello-Pasini et al., 2002). Significant decreasesin tissue carbohydrates, due to underwater lightreduction, have been reported in T. testudinum (Leeand Dunton, 1997). For seagrasses, aerobic metabolismin below-ground structures directly depends on above-ground O2 production (Smith et al., 1984). Thus, below-ground tissues will occasionally undergo anaerobicconditions during low photosynthetic periods caused bylow light. When below-ground tissues respire anaero-bically, carbon demand increases to meet the changingmetabolic requirements, which in turn further decreasecarbohydrate reserves (Lee and Dunton, 1997).
At reduced light conditions, seagrass performancecan be enhanced through a number of photo-acclimativeresponses that maximize the efficiency of light harvest-ing (West, 1990; Olesen and Sand-Jensen, 1993; Abalet al., 1994; Philippart, 1995; Olesen et al., 2002). Theacclimative responses may be achieved through in-creased pigment content and greater leaf area per unitleaf biomass (increasing light absorption efficiencies;Enríquez et al., 1994; Lee and Dunton, 1997; Olesenet al., 2002). Increased chl content and decreased chl a:bratio in seagrass leaf tissues have been reported inresponse to light reductions (Wiginton and McMillan,1979; Dennison and Alberte, 1982, 1985; Abal et al.,1994; Lee and Dunton, 1997). Wavelengths absorbed bychl a decrease more rapidly than those absorbed by chlb as water depth increases (Weidemann and Bannister,1986; McPherson and Miller, 1987). Thus, rapidincreases in chl b levels relative to chl a (leading tolower chl a:b ratios), would allow for more efficient useof available wavelengths during reduced light condi-tions (Lee and Dunton, 1997). Studies of the photo-acclimatory responses of seagrass morphology to depthand shading have shown that above-ground biomass andshoot density tended to decrease with increasing depthand/or shading (Dennison and Alberte, 1986; Lee andDunton, 1997; Longstaff et al., 1999; Olesen et al.,2002). Reductions in shoot densities and above-groundbiomass during low light conditions are possibly aneffective acclimation response to reduce self-shadingwithin the canopy (Olesen et al., 2002; Enríquez andPantoja-Reyes, 2005).
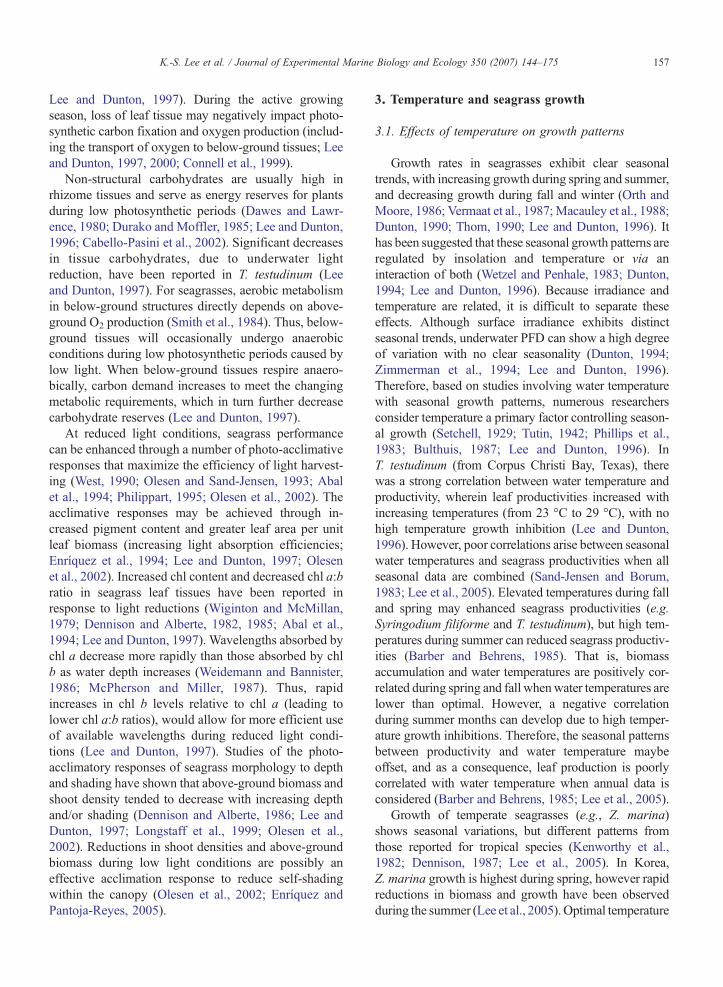
3. Temperature and seagrass growth
3.1. Effects of temperature on growth patterns
Growth rates in seagrasses exhibit clear seasonaltrends, with increasing growth during spring and summer,and decreasing growth during fall and winter (Orth andMoore, 1986; Vermaat et al., 1987; Macauley et al., 1988;Dunton, 1990; Thom, 1990; Lee and Dunton, 1996). Ithas been suggested that these seasonal growth patterns areregulated by insolation and temperature or via aninteraction of both (Wetzel and Penhale, 1983; Dunton,1994; Lee and Dunton, 1996). Because irradiance andtemperature are related, it is difficult to separate theseeffects. Although surface irradiance exhibits distinctseasonal trends, underwater PFD can show a high degreeof variation with no clear seasonality (Dunton, 1994;Zimmerman et al., 1994; Lee and Dunton, 1996).Therefore, based on studies involving water temperaturewith seasonal growth patterns, numerous researchersconsider temperature a primary factor controlling season-al growth (Setchell, 1929; Tutin, 1942; Phillips et al.,1983; Bulthuis, 1987; Lee and Dunton, 1996). InT. testudinum (from Corpus Christi Bay, Texas), therewas a strong correlation between water temperature andproductivity, wherein leaf productivities increased withincreasing temperatures (from 23 °C to 29 °C), with nohigh temperature growth inhibition (Lee and Dunton,1996). However, poor correlations arise between seasonalwater temperatures and seagrass productivities when allseasonal data are combined (Sand-Jensen and Borum,1983; Lee et al., 2005). Elevated temperatures during falland spring may enhanced seagrass productivities (e.g.Syringodium filiforme and T. testudinum), but high tem-peratures during summer can reduced seagrass productiv-ities (Barber and Behrens, 1985). That is, biomassaccumulation and water temperatures are positively cor-related during spring and fall whenwater temperatures arelower than optimal. However, a negative correlationduring summer months can develop due to high temper-ature growth inhibitions. Therefore, the seasonal patternsbetween productivity and water temperature maybeoffset, and as a consequence, leaf production is poorlycorrelated with water temperature when annual data isconsidered (Barber and Behrens, 1985; Lee et al., 2005).
Growth of temperate seagrasses (e.g., Z. marina)shows seasonal variations, but different patterns fromthose reported for tropical species (Kenworthy et al.,1982; Dennison, 1987; Lee et al., 2005). In Korea,Z. marina growth is highest during spring, however rapidreductions in biomass and growth have been observedduring the summer (Lee et al., 2005).Optimal temperature
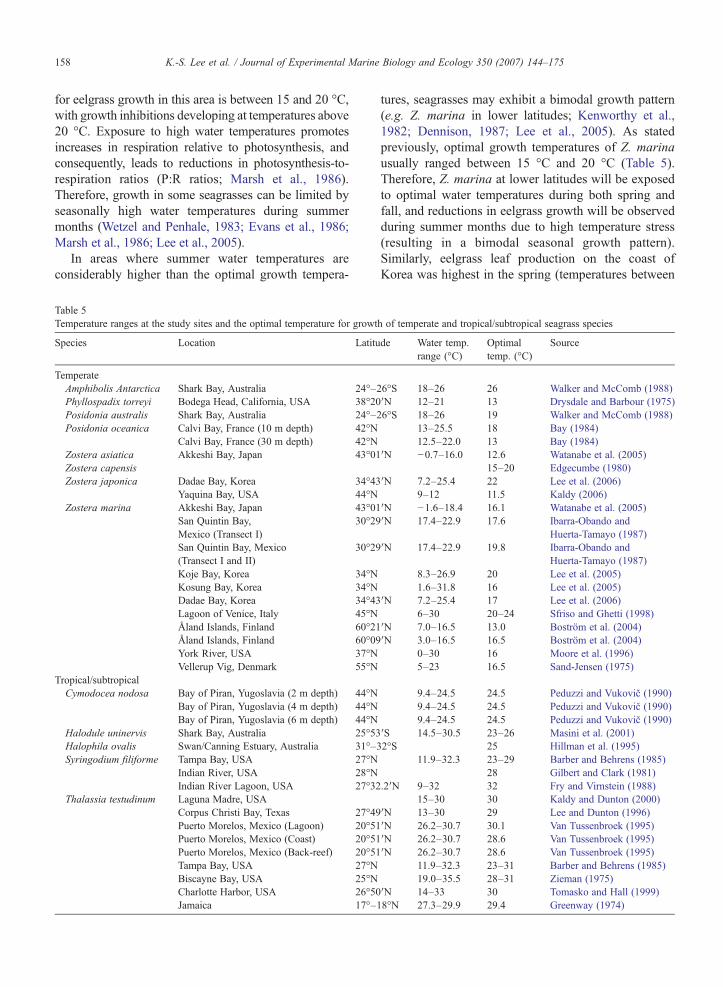
158 K.-S. Lee et al. / Journal of Experimental Marine Biology and Ecology 350 (2007) 144–175
for eelgrass growth in this area is between 15 and 20 °C,with growth inhibitions developing at temperatures above20 °C. Exposure to high water temperatures promotesincreases in respiration relative to photosynthesis, andconsequently, leads to reductions in photosynthesis-to-respiration ratios (P:R ratios; Marsh et al., 1986).Therefore, growth in some seagrasses can be limited byseasonally high water temperatures during summermonths (Wetzel and Penhale, 1983; Evans et al., 1986;Marsh et al., 1986; Lee et al., 2005).
In areas where summer water temperatures areconsiderably higher than the optimal growth tempera-
Table 5Temperature ranges at the study sites and the optimal temperature for growt
Species Location Latitu
TemperateAmphibolis Antarctica Shark Bay, Australia 24°–Phyllospadix torreyi Bodega Head, California, USA 38°20Posidonia australis Shark Bay, Australia 24°–Posidonia oceanica Calvi Bay, France (10 m depth) 42°N
Calvi Bay, France (30 m depth) 42°NZostera asiatica Akkeshi Bay, Japan 43°01Zostera capensisZostera japonica Dadae Bay, Korea 34°43
Yaquina Bay, USA 44°NZostera marina Akkeshi Bay, Japan 43°01
San Quintin Bay,Mexico (Transect I)
30°29
San Quintin Bay, Mexico(Transect I and II)
30°29
Koje Bay, Korea 34°NKosung Bay, Korea 34°NDadae Bay, Korea 34°43Lagoon of Venice, Italy 45°NÅland Islands, Finland 60°21Åland Islands, Finland 60°09York River, USA 37°NVellerup Vig, Denmark 55°N
Tropical/subtropicalCymodocea nodosa Bay of Piran, Yugoslavia (2 m depth) 44°N
Bay of Piran, Yugoslavia (4 m depth) 44°NBay of Piran, Yugoslavia (6 m depth) 44°N
Halodule uninervis Shark Bay, Australia 25°53Halophila ovalis Swan/Canning Estuary, Australia 31°–Syringodium filiforme Tampa Bay, USA 27°N
Indian River, USA 28°NIndian River Lagoon, USA 27°32
Thalassia testudinum Laguna Madre, USACorpus Christi Bay, Texas 27°49Puerto Morelos, Mexico (Lagoon) 20°51Puerto Morelos, Mexico (Coast) 20°51Puerto Morelos, Mexico (Back-reef) 20°51Tampa Bay, USA 27°NBiscayne Bay, USA 25°NCharlotte Harbor, USA 26°50Jamaica 17°–
tures, seagrasses may exhibit a bimodal growth pattern(e.g. Z. marina in lower latitudes; Kenworthy et al.,1982; Dennison, 1987; Lee et al., 2005). As statedpreviously, optimal growth temperatures of Z. marinausually ranged between 15 °C and 20 °C (Table 5).Therefore, Z. marina at lower latitudes will be exposedto optimal water temperatures during both spring andfall, and reductions in eelgrass growth will be observedduring summer months due to high temperature stress(resulting in a bimodal seasonal growth pattern).Similarly, eelgrass leaf production on the coast ofKorea was highest in the spring (temperatures between
h of temperate and tropical/subtropical seagrass species
de Water temp.range (°C)
Optimaltemp. (°C)
Source
26°S 18–26 26 Walker and McComb (1988)′N 12–21 13 Drysdale and Barbour (1975)26°S 18–26 19 Walker and McComb (1988)
13–25.5 18 Bay (1984)12.5–22.0 13 Bay (1984)
′N −0.7–16.0 12.6 Watanabe et al. (2005)15–20 Edgecumbe (1980)
′N 7.2–25.4 22 Lee et al. (2006)9–12 11.5 Kaldy (2006)
′N −1.6–18.4 16.1 Watanabe et al. (2005)′N 17.4–22.9 17.6 Ibarra-Obando and
Huerta-Tamayo (1987)′N 17.4–22.9 19.8 Ibarra-Obando and
Huerta-Tamayo (1987)8.3–26.9 20 Lee et al. (2005)1.6–31.8 16 Lee et al. (2005)
′N 7.2–25.4 17 Lee et al. (2006)6–30 20–24 Sfriso and Ghetti (1998)
′N 7.0–16.5 13.0 Boström et al. (2004)′N 3.0–16.5 16.5 Boström et al. (2004)
0–30 16 Moore et al. (1996)5–23 16.5 Sand-Jensen (1975)
9.4–24.5 24.5 Peduzzi and Vukovič (1990)9.4–24.5 24.5 Peduzzi and Vukovič (1990)9.4–24.5 24.5 Peduzzi and Vukovič (1990)
′S 14.5–30.5 23–26 Masini et al. (2001)32°S 25 Hillman et al. (1995)
11.9–32.3 23–29 Barber and Behrens (1985)28 Gilbert and Clark (1981)
.2′N 9–32 32 Fry and Virnstein (1988)15–30 30 Kaldy and Dunton (2000)
′N 13–30 29 Lee and Dunton (1996)′N 26.2–30.7 30.1 Van Tussenbroek (1995)′N 26.2–30.7 28.6 Van Tussenbroek (1995)′N 26.2–30.7 28.6 Van Tussenbroek (1995)
11.9–32.3 23–31 Barber and Behrens (1985)19.0–35.5 28–31 Zieman (1975)
′N 14–33 30 Tomasko and Hall (1999)18°N 27.3–29.9 29.4 Greenway (1974)

159K.-S. Lee et al. / Journal of Experimental Marine Biology and Ecology 350 (2007) 144–175
15 and 20 °C), and then decreased with increasingtemperatures. Leaf production showed another peak,when eelgrass plants were re-exposed to optimal watertemperature during the fall (Lee et al., 2005). However,eelgrass at higher latitudes (e.g. Akkeshi Bay, Japan)showed only unimodal growth patterns (Watanabe et al.,2005).
The thermal adaptations of seagrasses contribute totheir global distribution and seasonal growth dynamics(McRoy and McMillan, 1977; Wetzel and Penhale,1983; Marsh et al., 1986; Lee et al., 2005). Becausetemperate seagrass species are usually exposed to lowerwater temperatures (relative to tropical/subtropical
Table 6Optimal temperatures for photosynthesis of temperate and tropical/subtropic
Species Location L
TemperateAmphibolis antarctica Perth, Australia 31Amphibolis griffithii Perth, Australia 31Heterozostera tasmanica Victoria, Australia 38Phyllospadix torreyi California, USA (intertidal) 34Posidonia australis Perth, Australia 31Posidonia oceanica Malta 35
Malta 35Posidonia sinuosa Princess Royal Harbor, Australia 35
Perth, Australia 31Ruppia maritima Chesapeake Bay, USA 37
Chesapeake Bay, USA 37Zostera marina Chesapeake Bay, USA 37
Chesapeake Bay, USA 37Newport River estuary, USA 34Izembek Lagoon, USA (subtidal) 55Izembek Lagoon, USA (intertidal) 55California, USA 34Bahia Todos Santos, Mexico (lagoon) 31Bahia Todos Santos, Mexico (open coast) 31Great Harbor, USA 40Great Harbor, USA 40
Tropical/subtropicalCymodocea nodosa Malta 35
Malta 35Alfaques Bay, Spain 40Mar Menor lagoon, Spain 37
Cymodocea rotundata Santiago Islands, The Philippines 16Enhalus acoroides Santiago Islands, The Philippines 16Halophila decipiens Anclote Key, USA 28Halophila johnsonii Haulover Park, Biscayne Bay, USA 25
Indian River estuary, USA 27Halophila ovalis Taylor's Bay, Australia 33Halodule wrightii Laguna Madre, USA 27
San Antonio Bay, USA 28Corpus Christi Bay, USA 27
Thalassia hemprichii Santiago Islands, The Philippines 16Thalassia testudinum Corpus Christi Bay, USA 27
Lower Laguna Madre, USA 26Lower Laguna Madre, USA 26
species), they may be adapted to lower water tempera-tures and have limited tolerance to high temperatures.Therefore, optimal growth temperatures of temperateseagrass species are much lower than those of tropical/subtropical species (Table 5). Optimal growth tempera-tures for temperate species ranged from 11.5 °C to26 °C, whereas the temperatures for tropical/subtropicalspecies ranged from 23 °C to 32 °C (Table 5).
3.2. Effects of temperature on photosynthesis
The effects of temperature on photosynthesis haveoften been examined using P–I curves (Bulthuis, 1987;
al seagrass species
atitude Water temp.range (°C)
Optimaltemp. (°C)
Source
°59′S 13–23 23 Masini and Manning (1997)°59′S 13–23 23 Masini and Manning (1997)°S 5–40 30 Bulthuis (1983b)°16′N 10–23 23 Drew (1979)°59′S 13–23 23 Masini and Manning (1997)°51′N 11–36 32 Drew (1978)°51′N 12–32 32 Drew (1979)°03.2′S 13–24 18–23 Masini et al. (1995)°59′S 13–23 18–23 Masini and Manning (1997)°25′N 1–28 28 Wetzel and Penhale (1983)°16′N 8–30 23 Evans et al. (1986)°25′N 1–28 22 Wetzel and Penhale (1983)°16′N 8–30 19 Evans et al. (1986)°N 15–29 22 Penhale (1977)°N 0–40 30 Biebl and McRoy (1971)°N 0–40 35 Biebl and McRoy (1971)°16′N 4–21 21 Drew (1979)°45′N 16–22 17 Cabello-Pasini et al. (2002)°45′N 16–22 21 Cabello-Pasini et al. (2002)°31.5′N 0–20 16–20 Dennison (1987)°31.5′N 0–35 25–30 Marsh et al. (1986)
°51′N 11–36 32 Drew (1978)°51′N 11–36 30 Drew (1979)°N 8–32 32 Pérez and Romero (1992)°N 10–30 30 Terrados and Ros (1995)°27′03″N 24–33 27 Agawin et al. (2001)°27′03″N 24–33 27 Agawin et al. (2001)°08′44″N 10–30 30 Dawes et al. (1989)°55′N 15–35 35 Torquemada et al. (2005)°28′40″N 10–30 30 Dawes et al. (1989)°50′S 10–40 25–30 Ralph (1998)°21′N 12–30 30 Dunton and Tomasko (1994)°15′N 17–28 28 Dunton (1996)°49′N 17–29 25 Dunton (1996)°27′03″N 24–33 27 Agawin et al. (2001)°49′N 15–31 29 Herzka and Dunton (1997)°08′N 15–31 27 Herzka and Dunton (1997)°08′05″N 10–32 31 Herzka and Dunton (1998)
160 K.-S. Lee et al. / Journal of Experimental Marine Biology and Ecology 350 (2007) 144–175
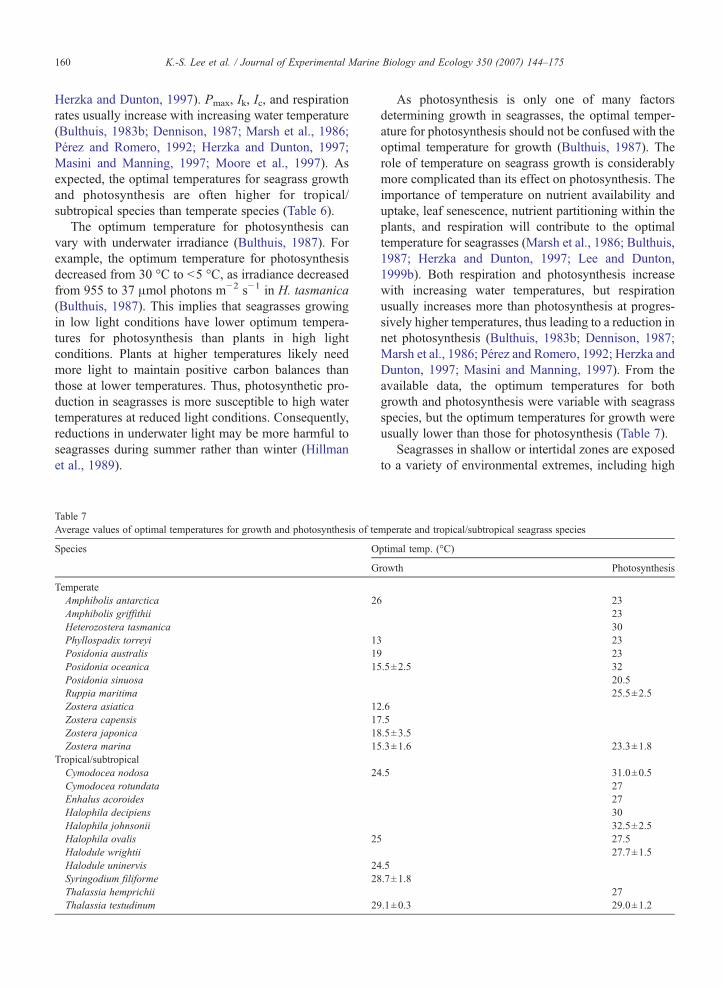
Herzka and Dunton, 1997). Pmax, Ik, Ic, and respirationrates usually increase with increasing water temperature(Bulthuis, 1983b; Dennison, 1987; Marsh et al., 1986;Pérez and Romero, 1992; Herzka and Dunton, 1997;Masini and Manning, 1997; Moore et al., 1997). Asexpected, the optimal temperatures for seagrass growthand photosynthesis are often higher for tropical/subtropical species than temperate species (Table 6).
The optimum temperature for photosynthesis canvary with underwater irradiance (Bulthuis, 1987). Forexample, the optimum temperature for photosynthesisdecreased from 30 °C to b5 °C, as irradiance decreasedfrom 955 to 37 μmol photons m−2 s−1 in H. tasmanica(Bulthuis, 1987). This implies that seagrasses growingin low light conditions have lower optimum tempera-tures for photosynthesis than plants in high lightconditions. Plants at higher temperatures likely needmore light to maintain positive carbon balances thanthose at lower temperatures. Thus, photosynthetic pro-duction in seagrasses is more susceptible to high watertemperatures at reduced light conditions. Consequently,reductions in underwater light may be more harmful toseagrasses during summer rather than winter (Hillmanet al., 1989).
Table 7Average values of optimal temperatures for growth and photosynthesis of te
Species O
G
TemperateAmphibolis antarctica 2Amphibolis griffithiiHeterozostera tasmanicaPhyllospadix torreyi 1Posidonia australis 1Posidonia oceanica 1Posidonia sinuosaRuppia maritimaZostera asiatica 1Zostera capensis 1Zostera japonica 1Zostera marina 1
Tropical/subtropicalCymodocea nodosa 2Cymodocea rotundataEnhalus acoroidesHalophila decipiensHalophila johnsoniiHalophila ovalis 2Halodule wrightiiHalodule uninervis 2Syringodium filiforme 2Thalassia hemprichiiThalassia testudinum 2
As photosynthesis is only one of many factorsdetermining growth in seagrasses, the optimal temper-ature for photosynthesis should not be confused with theoptimal temperature for growth (Bulthuis, 1987). Therole of temperature on seagrass growth is considerablymore complicated than its effect on photosynthesis. Theimportance of temperature on nutrient availability anduptake, leaf senescence, nutrient partitioning within theplants, and respiration will contribute to the optimaltemperature for seagrasses (Marsh et al., 1986; Bulthuis,1987; Herzka and Dunton, 1997; Lee and Dunton,1999b). Both respiration and photosynthesis increasewith increasing water temperatures, but respirationusually increases more than photosynthesis at progres-sively higher temperatures, thus leading to a reduction innet photosynthesis (Bulthuis, 1983b; Dennison, 1987;Marsh et al., 1986; Pérez and Romero, 1992; Herzka andDunton, 1997; Masini and Manning, 1997). From theavailable data, the optimum temperatures for bothgrowth and photosynthesis were variable with seagrassspecies, but the optimum temperatures for growth wereusually lower than those for photosynthesis (Table 7).
Seagrasses in shallow or intertidal zones are exposedto a variety of environmental extremes, including high
mperate and tropical/subtropical seagrass species
ptimal temp. (°C)
rowth Photosynthesis
6 232330
3 239 235.5±2.5 32
20.525.5±2.5
2.67.58.5±3.55.3±1.6 23.3±1.8
4.5 31.0±0.527273032.5±2.5
5 27.527.7±1.5
4.58.7±1.8
279.1±0.3 29.0±1.2
161K.-S. Lee et al. / Journal of Experimental Marine Biology and Ecology 350 (2007) 144–175
solar radiation and wide temperature fluctuations. Asthere is a rapid decline in photosynthesis when in situtemperature exceeds the optimum temperature, elevatedtemperatures in shallow areas will have significantimpact on seagrass photosynthesis and productivity(Bulthuis, 1987; Ralph, 1998; Seddon and Cheshire,2001). Pulse amplitude modulated (PAM) fluorometershave been used to measure the effects of thermal stresson chlorophyll a fluorescence (Ralph, 1998; Seddonand Cheshire, 2001; Campbell et al., 2006). Photosyn-thetic efficiencies can decrease at extreme temperatures(Ralph, 1998; Seddon and Cheshire, 2001). For exam-ple, effective quantum yields (▵F/Fm′) and maximumquantum yields (Fv/Fm) of H. ovalis were similar andrelatively stable over a fairly wide range of tempera-tures. However, at extreme temperatures (40 °C or10 °C), substantial decreases were noted in both ▵F/Fm′and Fv/Fm (Ralph, 1998). This dramatic decline in Fv/Fm at extreme temperatures was linked to chronicinhibition of photosynthesis, as indicated by Fo and Fm
responses being completely quenched during excessivetemperature challenges. These plants were unable torecover from extreme temperature treatments, suggest-ing irreversible damage to photosynthetic structures(Ralph, 1998). The dramatic declines in Fv/Fm, due tochronic inhibition of photosynthesis by heat stress havealso been reported in seven tropical seagrass species(Campbell et al., 2006). The photosynthetic responses toelevated temperature in this experiment also suggest thatphotosynthesis likely underwent irreversible damagefrom short-term or episodic changes in seawater tem-peratures (as high as 40–45 °C; Campbell et al., 2006).
4. Nutrients and seagrass growth
4.1. Inorganic nutrients for seagrass growth
To maintain growth, primary producers such asseagrasses require inorganic carbon and nutrients. Mostmarine macrophytes can utilize both CO2 and HCO3
− forphotosynthetic carbon reduction (Beer, 1989; Durako,1993; Larkum and James, 1996; Beer and Rehnberg,1997; Invers et al., 2001). There are millimolar concen-trations of dissolved inorganic carbon (DIC) in seawaterwhich is approximately three orders of magnitudegreater than concentrations of inorganic N or P (Shortet al., 1985; Pérez et al., 1991; Lee and Dunton, 2000).While a number of elements are essential for plantgrowth, we are usually concerned with the few that arelikely to limit plant growth in natural systems. Nutrientsthat most commonly limit seagrass growth are N and P(Duarte, 1990; Romero et al., 2006). Carbon constitutes
approximately 30–40% of seagrass tissue dry weight,whereas N and P account for 1–4%, and 0.1–1.0% oftissue dry weight, respectively (Duarte, 1990; Pérez-Lloréns and Niell, 1993; Fourqurean et al., 1997; Leeand Dunton, 1999b; Terrados et al., 1999b). Variabilityin C content of seagrass leaves is much less than N or P(Duarte, 1990). This lower variability in C levels rela-tive to N or P suggests that C limited growth is rare inseagrasses (Short et al., 1985; Pérez et al., 1991; Lee andDunton, 2000).
Seagrasses can assimilate inorganic nutrients throughboth above- and below-ground tissues (Iizumi andHattori, 1982; Thursby and Harlin, 1982, 1984; Shortand McRoy, 1984; Stapel et al., 1996; Pedersen et al.,1997; Terrados and Williams, 1997; Lee and Dunton,1999b; Gras et al., 2003; Nielsen et al., 2006). Majorinorganic N sources available to seagrasses include NO3
−
and NH4+ in the water column, and NH4
+ in sediment porewaters. Higher leaf uptake rates have been reported forNH4
+ in comparison to NO3− in several seagrasses (Short
andMcRoy, 1984; Terrados andWilliams, 1997; Lee andDunton, 1999b). Assimilation of NO3
−, by plant tissues,is influenced by the availability of photosynthate and/orstored C, and thus is energetically costly (Thacker andSyrett, 1972; Lara et al., 1987; Turpin, 1991). Therefore,seagrasses would benefit from the uptake of reducedforms of N (i.e.NH4
+; Lee and Dunton, 1999b). The mainP source is PO4
3−, and occurs in the water column as wellas sediments. With the exception of areas characterizedby high river input, water column nutrient concentrationsare usually low (typically b3 μM for NO3
− and NH4+, and
b2 μM for PO43−; Tomasko and Lapointe, 1991;
Hemminga et al., 1995; Ruiz and Romero, 2003; Leeet al., 2005). In sediment pore water, however, nutrientconcentrations are much higher than the overlying watercolumn (Dennison et al., 1987; Lee and Dunton, 1999b;Terrados et al., 1999a; Lee et al., 2005; Kaldy, 2006).Concentrations of pore water NH4
+ usually range fromb20 μM to 1000 μM,whereas concentration of PO4
3− canexceed 20 μM in sediment pore waters (Udy andDennison, 1997; Touchette and Burkholder, 2000; Leeet al., 2005). Because of higher nutrient concentrations insediment compared to overlying water, pore waters areoften considered a main source of nutrients for sea-grasses (Iizumi and Hattori, 1982; Short and McRoy,1984; Zimmerman et al., 1987).
However, some studies have demonstrated highernutrient uptake affinities in leaves in comparison to roots(Pedersen et al., 1997; Lee andDunton, 1999b). Seagrassleaves are usually exposed to considerably lower nutrientconcentrations. Therefore, seagrass leaves may havedeveloped the ability to assimilate nutrients under lower

162 K.-S. Lee et al. / Journal of Experimental Marine Biology and Ecology 350 (2007) 144–175
concentrations. With this in mind, nutrient uptake mayalso saturate at lower concentrations in leaf tissues(Stapel et al., 1996; Lee and Dunton, 1999b). Converse-ly, nutrient uptake by roots exhibits saturation at muchhigher nutrient concentrations than those observed inleaves. Nutrient uptake kinetics in seagrass tissuesreflects plant adaptations to life in water column withlow nutrients and relatively high nutrients in sedimentpore water. Thus, although there are significant differ-ences in nutrient concentration between pore water andwater column, an equal contribution of water column andsediment nutrients in plant nutrient acquisition has beensuggested by various researchers (Iizumi and Hattori,1982; Short and McRoy, 1984; Zimmerman et al., 1987;Pedersen and Borum, 1992; Stapel et al., 1996; TerradosandWilliams, 1997; Lee andDunton, 1999b). Iizumi andHattori (1982) demonstrated that approximately 55% ofthe total N requirement for Z. marina growth wassupplied as sediment NH4
+. In another study using anumerical model, root contributions to NH4
+ uptakeaccounted for roughly 60% of total N (Zimmerman et al.,1987). In T. testudinum, root NH4
+ uptake from sedimentsaccounted for 50% of total plant N uptake, with leaf NO3
−
and NH4+ assimilation accounting for the remaining N
(Lee and Dunton, 1999b).The respective contributions of leaf and root nutrient
uptake may vary as a function of nutrient concentrationsin the water column and sediment (Zimmerman et al.,1987). However, in T. testudinum, proportional uptake ofN from leaves and roots were not significantly differentbetween sites which were markedly different with respectto sediment nitrogen concentrations (Lee and Dunton,1999b). Biomass allocations, produced by different nu-trient conditions, probably caused this discrepancy. Sea-grasses allocate more biomass into below-ground tissuesunder low sediment nutrient availability. In contrast, morebiomass in above-ground tissues can occurwhen nutrientsare readily available, thus allowing for greater carbonfixation (Lee and Dunton, 1999a). Therefore, in highsediment nutrient conditions, leaf nutrient acquisitionmay increase due to larger leaf biomass. Consequently,contributions of leaf and root nutrient uptake, from thewater column and sediments, to total nutrient acquisitionmay not change with sediment nutrient conditions (Leeand Dunton, 1999b).
4.2. Nutrient limitation and plant responses to nutrientenrichments
Increasing in situ nutrient availability by nutrientenrichment has been used to examine nutrient-limitedgrowth in seagrasses (Orth 1977; Harlin and Thorne-
Miller, 1981; Iizumi et al., 1982; Dennison et al., 1987;Short et al., 1990; Pérez et al., 1991; Murray et al., 1992;Agawin et al., 1996; Udy and Dennison, 1997; Lee andDunton, 2000). When supplying N and/or P to nutrient-limited plants, increases in biomass, productivities, andshoot size are typical responses (Bulthuis et al., 1992;Agawin et al., 1996; Udy and Dennison, 1997; Lee andDunton, 2000). However, seagrass growth is not alwayslimited by ambient nutrient concentrations, as increasednutrient availability sometimes has limited effect onseagrass growth (Bulthuis and Woelkerling, 1981;Dennison et al., 1987; Lee and Dunton, 2000).
Increased sediment nutrients have also led to increasedplant productivities through physiological changes in-cluding maximum rate of photosynthesis, photosyntheticefficiency, and/or increased chl concentrations (Agawinet al., 1996; Lee and Dunton, 1999a). Increased photo-synthetic performance and chl concentrations, followingnutrient enrichment of a nutrient-limited population,suggest an interaction between photosynthetic carbonfixation and nutrient availability. Increased seagrass tissueN, as a result of N enrichment, has been observed indifferent seagrasses (Bulthuis et al., 1992; Erftemeijeret al., 1994; Alcoverro et al., 1997; Udy and Dennison,1997; Lee and Dunton, 1999a). The assimilation of inor-ganicN requiresC skeletons for incorporating ammoniuminto amino acids (Turpin et al., 1990; Huppe and Turpin,1994). Carbon skeletons and reduction energy for Nuptake and assimilation can be supplied by photosyntheticprocesses. Therefore, increased nutrient availabilitymay induce photosynthetic C fixation and metabolism(Agawin et al., 1996; Lee and Dunton, 1999a). Increasedproductivity and biomass of leaves, as a result of nutrientenrichment, is the most common plant response whenliving in nutrient-limited environments (Orth, 1977;Bulthuis and Woelkerling, 1981; Agawin et al., 1996;Alcoverro et al., 1997; Udy and Dennison, 1997; Lee andDunton, 2000). These increases in leaf production andbiomass may be associated with increases in C fixationnecessary to meet the increased C demand during Nreduction and assimilation.
Although seagrasses can use inorganic nutrients fromthe water column, elevated water column nutrient levelscan adversely affect seagrasses through the stimulation ofphytoplanktonic, epiphytic and macroalgal productivities(Harlin and Thorne-Miller, 1981; Short, 1987; Colemanand Burkholder, 1994; Short et al., 1995; Wear et al.,1999). Blooms of competing primary producers, causedby water column nutrient enrichment, can lead to reduc-tions in light available to seagrasses (Harlin and Thorne-Miller, 1981; Van Montfrans et al., 1984; Borum, 1985;Giesen et al., 1990; Tomasko and Lapointe, 1991; Van
163K.-S. Lee et al. / Journal of Experimental Marine Biology and Ecology 350 (2007) 144–175
Lent et al., 1995; Wear et al., 1999). Additionally,Burkholder et al. (1992, 1994) demonstrated that watercolumn NO3
− enrichment promoted eelgrass declinethrough a direct physiological response unrelated toalgal light attenuation. Lack of an inhibition mechanismfor sustained NO3
− uptake by eelgrass leaves likely causedinternal imbalances in carbohydrates (Burkholder et al.,1992).
Short et al. (1990) investigated the role of P and N inthe primary production of a tropical seagrass S. filiformeusing long-term nutrient enrichment experiments. Sub-stantial increase in seagrass growth, biomass, and tissueP levels after P enrichment likely reflected P limitationfor these plants growing in tropical carbonate sediments.Pérez et al. (1991) also showed P limitation inC. nodosa growth in carbonate sediments. In theirstudy, increased sediment P levels resulted in increasedseagrass tissue P content, shoot growth, biomass anddensity, and reduced tissue N:P ratios (Pérez et al.,1991). Short (1987) demonstrated that sediment geo-chemistry in seagrass beds is important in determiningthe limiting nutrient to seagrass growth. Seagrassesgrowing in terrigenous sediment are usually nitrogen-limited, whereas seagrasses growing in biogeniccarbonate sediments are often phosphorus-limited dueto binding of phosphate in the carbonate sediments(Short et al., 1990; Pérez et al., 1991; Fourqurean et al.,1992a,b; Koch et al., 2001).
4.3. In situ nutrient concentrations and nutrientavailability
Because of high nutrient uptake affinities in leavesand possible detrimental effects of high water columnnutrient concentrations on seagrass growth (Orth andMoore, 1983; Silberstein et al., 1986; Giesen et al.,1990; Tomasko and Lapointe, 1991; Pedersen et al.,1997; Lee and Dunton, 1999b; Wear et al., 1999),seagrass production may not correlate well with watercolumn nutrients. Seagrass production dynamics, asrelated to sediment nutrient availability, is generally welldocumented, but comparably less is known about theeffects of in situ water column nutrient availability onseagrass growth. From available data in literature,productivities of seagrasses were not significantlycorrelated with water column nutrient concentrations(except for Z. marina production with water column P;Table 8). Productivity of Z. marina was strongly cor-related with water column P levels, suggesting possibleP limitation for Z. marina growth in some areas.
Significantly smaller eelgrass leaves and lower leafproductivities have been reported when sediment pore
water NH4+ concentrations dropped below 100 μM. Thus
a pore water NH4+ concentration of 100 μM have been
suggested as a threshold for N limitation in Z. marina(Short, 1983; Dennison et al., 1987), and is consistentwith saturation levels reported for NH4
+ uptake inZ. marina roots (Iizumi and Hattori, 1982; Thursbyand Harlin, 1982). For T. testudinum, plant growth didnot vary with sediment NH4
+ concentration from 100 μMto 2000 μM (Lee and Dunton, 2000). The lack of a plantresponse to changes in sediment NH4
+ suggests that porewater NH4
+ concentrations of 100 μM may provide anadequate pool of inorganic N for T. testudinum growth.Although sediment nutrient concentrations in someseagrass beds are indicative of nutrient growth limita-tion, in situ nutrient levels should not be confused withnutrient availability. Relationships between seagrass leafproductivities and sediment nutrient concentrations didnot exhibit strong positive correlations (Table 8). Theseweak correlations imply that in situ nutrient concentra-tion is not a good indicator of nutrients available forgrowth. As with water column P, sediment P alsoexhibited significant correlations with productivity ofZ. marina, suggesting P-limited growth for Z. marina insome locations (Table 8). Typically, P limitation forseagrass growth occurs in carbonate sediments (Shortet al., 1990; Pérez et al., 1991; Fourqurean et al., 1992a,b; Koch et al., 2001); however, P limitation has alsobeen reported in temperate bays with siliceous sedi-ments (Fourqurean and Cai, 2001; Johnson et al., 2006).Therefore, these results imply that P limitation for sea-grass growth is also common in temperate seagrass bedswith terrigenous sediments.
Sediment nutrients (e.g. NH4+ and PO4
3−) are oftensupplied by remineralization (Jørgensen, 1977, 1982;Hines and Lyons, 1982; Boon et al., 1986; Holmer andNielsen, 1997). In situ sediment nutrient concentrationsrepresent a balance between inorganic nutrient produc-tion and consumption. Both regeneration of inorganicnutrients in sediments and turnover rates of nutrientpools are important factors that determine the degree ofnutrient availability. Essential nutrients for seagrassgrowth may be derived from decomposition of organicmatter in water column and sediments (Opsahl andBenner, 1993; Ziegler and Benner, 1999; Holmer andOlsen, 2002; Kilminster et al., 2006). Seagrass litter islikely the main organic source for regenerated nutrientsin seagrass beds (Mateo and Romero, 1997; Opsahl andBenner, 1993; Holmer and Olsen, 2002), and nutrientrecycling within these beds can be accomplishedthrough rapid in situ decomposition of organic matter(Opsahl and Benner, 1993; Holmer and Olsen, 2002).In tropical areas, bacterial N fixation also provides
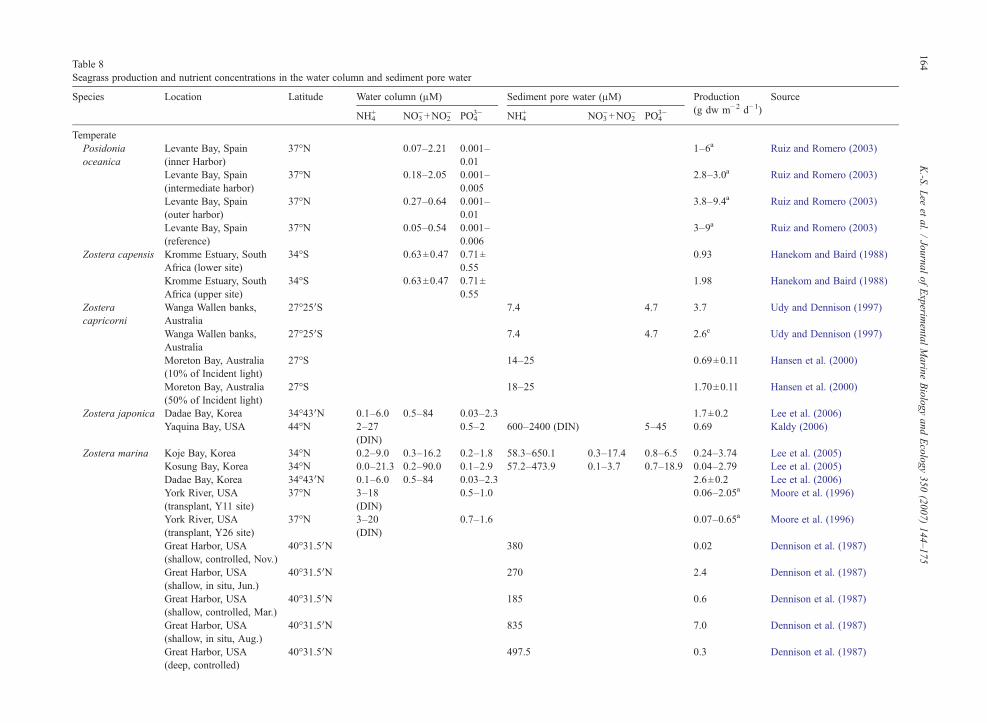
Table 8Seagrass production and nutrient concentrations in the water column and sediment pore water
Species Location Latitude Water column (μM) Sediment pore water (μM) Production(g dw m−2 d−1)
Source
NH4+ NO3
−+NO2− PO4
3− NH4+ NO3
−+NO2− PO4
3−
TemperatePosidoniaoceanica
Levante Bay, Spain(inner Harbor)
37°N 0.07–2.21 0.001–0.01
1–6a Ruiz and Romero (2003)
Levante Bay, Spain(intermediate harbor)
37°N 0.18–2.05 0.001–0.005
2.8–3.0a Ruiz and Romero (2003)
Levante Bay, Spain(outer harbor)
37°N 0.27–0.64 0.001–0.01
3.8–9.4a Ruiz and Romero (2003)
Levante Bay, Spain(reference)
37°N 0.05–0.54 0.001–0.006
3–9a Ruiz and Romero (2003)
Zostera capensis Kromme Estuary, SouthAfrica (lower site)
34°S 0.63±0.47 0.71±0.55
0.93 Hanekom and Baird (1988)
Kromme Estuary, SouthAfrica (upper site)
34°S 0.63±0.47 0.71±0.55
1.98 Hanekom and Baird (1988)
Zosteracapricorni
Wanga Wallen banks,Australia
27°25′S 7.4 4.7 3.7 Udy and Dennison (1997)
Wanga Wallen banks,Australia
27°25′S 7.4 4.7 2.6e Udy and Dennison (1997)
Moreton Bay, Australia(10% of Incident light)
27°S 14–25 0.69±0.11 Hansen et al. (2000)
Moreton Bay, Australia(50% of Incident light)
27°S 18–25 1.70±0.11 Hansen et al. (2000)
Zostera japonica Dadae Bay, Korea 34°43′N 0.1–6.0 0.5–84 0.03–2.3 1.7±0.2 Lee et al. (2006)Yaquina Bay, USA 44°N 2–27
(DIN)0.5–2 600–2400 (DIN) 5–45 0.69 Kaldy (2006)
Zostera marina Koje Bay, Korea 34°N 0.2–9.0 0.3–16.2 0.2–1.8 58.3–650.1 0.3–17.4 0.8–6.5 0.24–3.74 Lee et al. (2005)Kosung Bay, Korea 34°N 0.0–21.3 0.2–90.0 0.1–2.9 57.2–473.9 0.1–3.7 0.7–18.9 0.04–2.79 Lee et al. (2005)Dadae Bay, Korea 34°43′N 0.1–6.0 0.5–84 0.03–2.3 2.6±0.2 Lee et al. (2006)York River, USA(transplant, Y11 site)
37°N 3–18(DIN)
0.5–1.0 0.06–2.05a Moore et al. (1996)
York River, USA(transplant, Y26 site)
37°N 3–20(DIN)
0.7–1.6 0.07–0.65a Moore et al. (1996)
Great Harbor, USA(shallow, controlled, Nov.)
40°31.5′N 380 0.02 Dennison et al. (1987)
Great Harbor, USA(shallow, in situ, Jun.)
40°31.5′N 270 2.4 Dennison et al. (1987)
Great Harbor, USA(shallow, controlled, Mar.)
40°31.5′N 185 0.6 Dennison et al. (1987)
Great Harbor, USA(shallow, in situ, Aug.)
40°31.5′N 835 7.0 Dennison et al. (1987)
Great Harbor, USA(deep, controlled)
40°31.5′N 497.5 0.3 Dennison et al. (1987)
164K.-S.
Lee
etal.
/Journal
ofExperim
entalMarine
Biology
andEcology
350(2007)
144–175
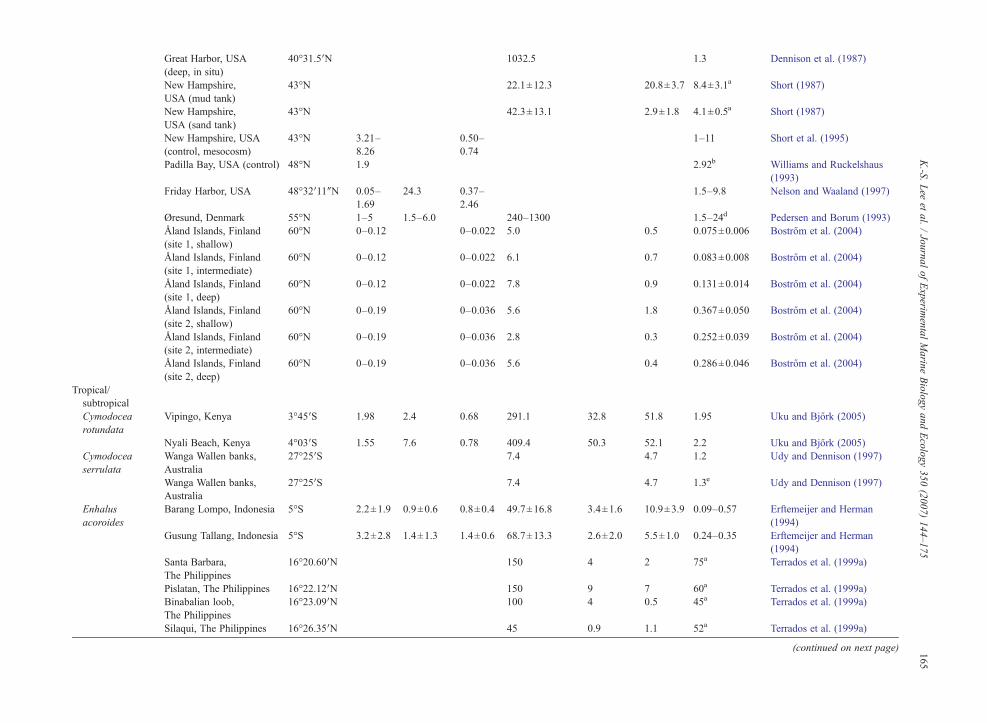
Great Harbor, USA(deep, in situ)
40°31.5′N 1032.5 1.3 Dennison et al. (1987)
New Hampshire,USA (mud tank)
43°N 22.1±12.3 20.8±3.7 8.4±3.1a Short (1987)
New Hampshire,USA (sand tank)
43°N 42.3±13.1 2.9±1.8 4.1±0.5a Short (1987)
New Hampshire, USA(control, mesocosm)
43°N 3.21–8.26
0.50–0.74
1–11 Short et al. (1995)
Padilla Bay, USA (control) 48°N 1.9 2.92b Williams and Ruckelshaus(1993)
Friday Harbor, USA 48°32′11″N 0.05–1.69
24.3 0.37–2.46
1.5–9.8 Nelson and Waaland (1997)
Øresund, Denmark 55°N 1–5 1.5–6.0 240–1300 1.5–24d Pedersen and Borum (1993)Åland Islands, Finland(site 1, shallow)
60°N 0–0.12 0–0.022 5.0 0.5 0.075±0.006 Bostrőm et al. (2004)
Åland Islands, Finland(site 1, intermediate)
60°N 0–0.12 0–0.022 6.1 0.7 0.083±0.008 Bostrőm et al. (2004)
Åland Islands, Finland(site 1, deep)
60°N 0–0.12 0–0.022 7.8 0.9 0.131±0.014 Bostrőm et al. (2004)
Åland Islands, Finland(site 2, shallow)
60°N 0–0.19 0–0.036 5.6 1.8 0.367±0.050 Bostrőm et al. (2004)
Åland Islands, Finland(site 2, intermediate)
60°N 0–0.19 0–0.036 2.8 0.3 0.252±0.039 Bostrőm et al. (2004)
Åland Islands, Finland(site 2, deep)
60°N 0–0.19 0–0.036 5.6 0.4 0.286±0.046 Bostrőm et al. (2004)
Tropical/subtropicalCymodocearotundata
Vipingo, Kenya 3°45′S 1.98 2.4 0.68 291.1 32.8 51.8 1.95 Uku and Bjőrk (2005)
Nyali Beach, Kenya 4°03′S 1.55 7.6 0.78 409.4 50.3 52.1 2.2 Uku and Bjőrk (2005)Cymodoceaserrulata
Wanga Wallen banks,Australia
27°25′S 7.4 4.7 1.2 Udy and Dennison (1997)
Wanga Wallen banks,Australia
27°25′S 7.4 4.7 1.3e Udy and Dennison (1997)
Enhalusacoroides
Barang Lompo, Indonesia 5°S 2.2±1.9 0.9±0.6 0.8±0.4 49.7±16.8 3.4±1.6 10.9±3.9 0.09–0.57 Erftemeijer and Herman(1994)
Gusung Tallang, Indonesia 5°S 3.2±2.8 1.4±1.3 1.4±0.6 68.7±13.3 2.6±2.0 5.5±1.0 0.24–0.35 Erftemeijer and Herman(1994)
Santa Barbara,The Philippines
16°20.60′N 150 4 2 75a Terrados et al. (1999a)
Pislatan, The Philippines 16°22.12′N 150 9 7 60a Terrados et al. (1999a)Binabalian loob,The Philippines
16°23.09′N 100 4 0.5 45a Terrados et al. (1999a)
Silaqui, The Philippines 16°26.35′N 45 0.9 1.1 52a Terrados et al. (1999a)
(continued on next page) 165K.-S.
Lee
etal.
/Journal
ofExperim
entalMarine
Biology
andEcology
350(2007)
144–175
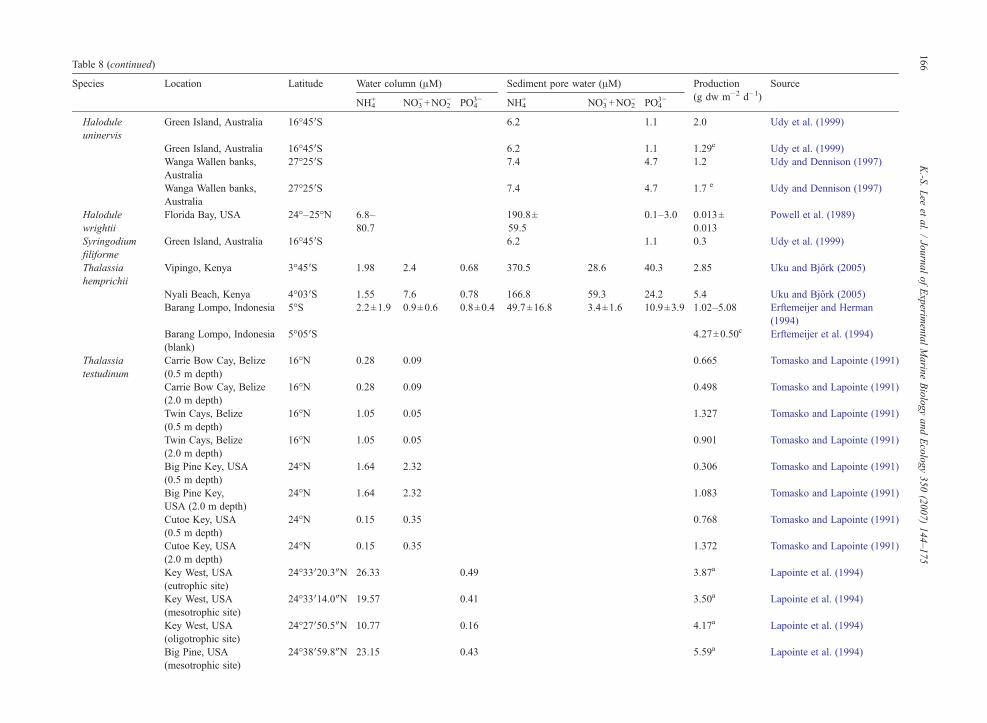
Table 8 (continued)
Species Location Latitude Water column (μM) Sediment pore water (μM) Production(g dw m−2 d−1)
Source
NH4+ NO3
−+NO2− PO4
3− NH4+ NO3
−+NO2− PO4
3−
Haloduleuninervis
Green Island, Australia 16°45′S 6.2 1.1 2.0 Udy et al. (1999)
Green Island, Australia 16°45′S 6.2 1.1 1.29e Udy et al. (1999)Wanga Wallen banks,Australia
27°25′S 7.4 4.7 1.2 Udy and Dennison (1997)
Wanga Wallen banks,Australia
27°25′S 7.4 4.7 1.7 e Udy and Dennison (1997)
Halodulewrightii
Florida Bay, USA 24°–25°N 6.8–80.7
190.8±59.5
0.1–3.0 0.013±0.013
Powell et al. (1989)
Syringodiumfiliforme
Green Island, Australia 16°45′S 6.2 1.1 0.3 Udy et al. (1999)
Thalassiahemprichii
Vipingo, Kenya 3°45′S 1.98 2.4 0.68 370.5 28.6 40.3 2.85 Uku and Bjőrk (2005)
Nyali Beach, Kenya 4°03′S 1.55 7.6 0.78 166.8 59.3 24.2 5.4 Uku and Bjőrk (2005)Barang Lompo, Indonesia 5°S 2.2±1.9 0.9±0.6 0.8±0.4 49.7±16.8 3.4±1.6 10.9±3.9 1.02–5.08 Erftemeijer and Herman
(1994)Barang Lompo, Indonesia(blank)
5°05′S 4.27±0.50c Erftemeijer et al. (1994)
Thalassiatestudinum
Carrie Bow Cay, Belize(0.5 m depth)
16°N 0.28 0.09 0.665 Tomasko and Lapointe (1991)
Carrie Bow Cay, Belize(2.0 m depth)
16°N 0.28 0.09 0.498 Tomasko and Lapointe (1991)
Twin Cays, Belize(0.5 m depth)
16°N 1.05 0.05 1.327 Tomasko and Lapointe (1991)
Twin Cays, Belize(2.0 m depth)
16°N 1.05 0.05 0.901 Tomasko and Lapointe (1991)
Big Pine Key, USA(0.5 m depth)
24°N 1.64 2.32 0.306 Tomasko and Lapointe (1991)
Big Pine Key,USA (2.0 m depth)
24°N 1.64 2.32 1.083 Tomasko and Lapointe (1991)
Cutoe Key, USA(0.5 m depth)
24°N 0.15 0.35 0.768 Tomasko and Lapointe (1991)
Cutoe Key, USA(2.0 m depth)
24°N 0.15 0.35 1.372 Tomasko and Lapointe (1991)
Key West, USA(eutrophic site)
24°33′20.3″N 26.33 0.49 3.87a Lapointe et al. (1994)
Key West, USA(mesotrophic site)
24°33′14.0″N 19.57 0.41 3.50a Lapointe et al. (1994)
Key West, USA(oligotrophic site)
24°27′50.5″N 10.77 0.16 4.17a Lapointe et al. (1994)
Big Pine, USA(mesotrophic site)
24°38′59.8″N 23.15 0.43 5.59a Lapointe et al. (1994)
166K.-S.
Lee
etal.
/Journal
ofExperim
entalMarine
Biology
andEcology
350(2007)
144–175
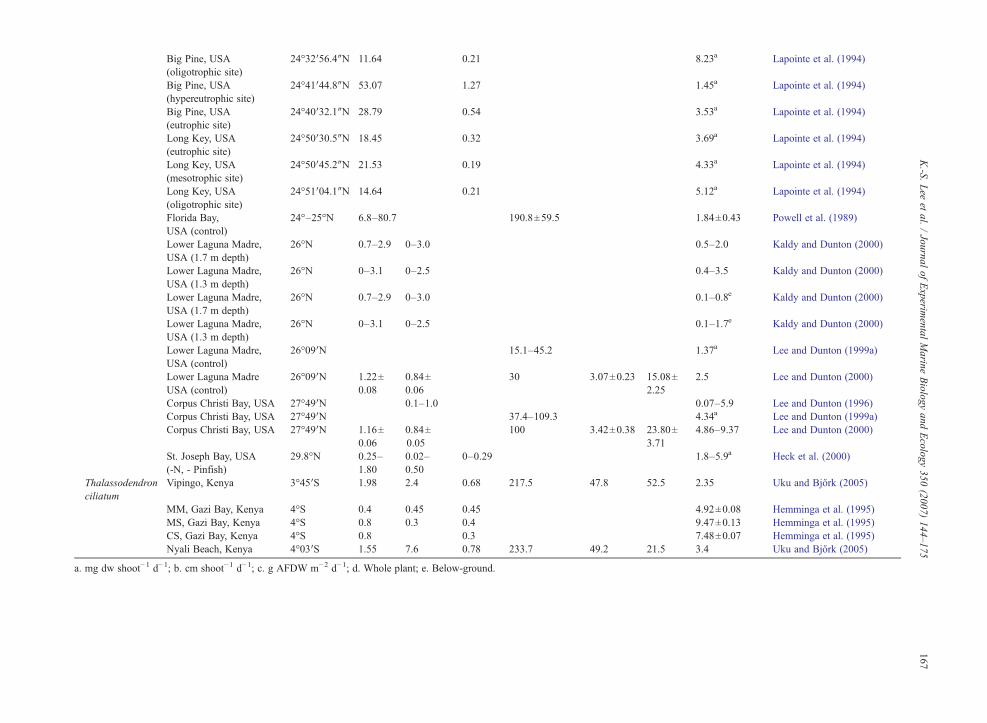
Big Pine, USA(oligotrophic site)
24°32′56.4″N 11.64 0.21 8.23a Lapointe et al. (1994)
Big Pine, USA(hypereutrophic site)
24°41′44.8″N 53.07 1.27 1.45a Lapointe et al. (1994)
Big Pine, USA(eutrophic site)
24°40′32.1″N 28.79 0.54 3.53a Lapointe et al. (1994)
Long Key, USA(eutrophic site)
24°50′30.5″N 18.45 0.32 3.69a Lapointe et al. (1994)
Long Key, USA(mesotrophic site)
24°50′45.2″N 21.53 0.19 4.33a Lapointe et al. (1994)
Long Key, USA(oligotrophic site)
24°51′04.1″N 14.64 0.21 5.12a Lapointe et al. (1994)
Florida Bay,USA (control)
24°–25°N 6.8–80.7 190.8±59.5 1.84±0.43 Powell et al. (1989)
Lower Laguna Madre,USA (1.7 m depth)
26°N 0.7–2.9 0–3.0 0.5–2.0 Kaldy and Dunton (2000)
Lower Laguna Madre,USA (1.3 m depth)
26°N 0–3.1 0–2.5 0.4–3.5 Kaldy and Dunton (2000)
Lower Laguna Madre,USA (1.7 m depth)
26°N 0.7–2.9 0–3.0 0.1–0.8e Kaldy and Dunton (2000)
Lower Laguna Madre,USA (1.3 m depth)
26°N 0–3.1 0–2.5 0.1–1.7e Kaldy and Dunton (2000)
Lower Laguna Madre,USA (control)
26°09′N 15.1–45.2 1.37a Lee and Dunton (1999a)
Lower Laguna MadreUSA (control)
26°09′N 1.22±0.08
0.84±0.06
30 3.07±0.23 15.08±2.25
2.5 Lee and Dunton (2000)
Corpus Christi Bay, USA 27°49′N 0.1–1.0 0.07–5.9 Lee and Dunton (1996)Corpus Christi Bay, USA 27°49′N 37.4–109.3 4.34a Lee and Dunton (1999a)Corpus Christi Bay, USA 27°49′N 1.16±
0.060.84±0.05
100 3.42±0.38 23.80±3.71
4.86–9.37 Lee and Dunton (2000)
St. Joseph Bay, USA(-N, - Pinfish)
29.8°N 0.25–1.80
0.02–0.50
0–0.29 1.8–5.9a Heck et al. (2000)
Thalassodendronciliatum
Vipingo, Kenya 3°45′S 1.98 2.4 0.68 217.5 47.8 52.5 2.35 Uku and Bjőrk (2005)
MM, Gazi Bay, Kenya 4°S 0.4 0.45 0.45 4.92±0.08 Hemminga et al. (1995)MS, Gazi Bay, Kenya 4°S 0.8 0.3 0.4 9.47±0.13 Hemminga et al. (1995)CS, Gazi Bay, Kenya 4°S 0.8 0.3 7.48±0.07 Hemminga et al. (1995)Nyali Beach, Kenya 4°03′S 1.55 7.6 0.78 233.7 49.2 21.5 3.4 Uku and Bjőrk (2005)
a. mg dw shoot−1 d−1; b. cm shoot−1 d−1; c. g AFDW m−2 d−1; d. Whole plant; e. Below-ground.
167K.-S.
Lee
etal.
/Journal
ofExperim
entalMarine
Biology
andEcology
350(2007)
144–175
168 K.-S. Lee et al. / Journal of Experimental Marine Biology and Ecology 350 (2007) 144–175
substantial inputs of N to seagrasses (Capone andTaylor, 1980; O'Donohue et al., 1991; Moriarty andO'Donohue, 1993; Blackburn et al., 1994). Nutrientpools in seagrass beds can have rapid turnover ratesranging from 0.3 to 6 d (Capone, 1982; Moriarty et al.,1985; Boon et al., 1986; Lee and Dunton, 1999b). InT. testudinum beds, for example, DIN turnover time inboth water column and sediment pore water was lessthan 2 d (Lee and Dunton, 1999b). These rapid turnoverrates indicate the importance of nutrient regeneration insupporting seagrass production (Moriarty et al., 1985;Boon et al., 1986).
4.4. Inorganic carbon limitation
Because of the high DIC concentrations in seawater,little attention has been paid to C limitation in seagrassgrowth. However, since carbon accounts for 30 to 40%of seagrass tissue dry weight (Duarte, 1990; Fourqureanet al., 1997; Lee and Dunton, 1999b), seagrasses need toassimilate large amounts of inorganic carbon. In contrastto terrestrial system, CO2 supply for photosynthesis inseawater can be restricted due to low solubility anddiffusion rates (Björk et al., 1997). Thus, manyseagrasses have adapted to utilize bicarbonate(HCO3
−), which is the most abundant form of DIC inseawater, for C fixation (Beer, 1989; Durako, 1993;Larkum and James, 1996; Beer and Rehnberg, 1997;Invers et al., 2001). Uncharged CO2 may permeate cellsby passive diffusion, whereas HCO3
− acquisition usuallyinvolves extracellular carbonic anhydrase (CA) forHCO3
− dehydration to CO2 prior to uptake (James andLarkum, 1996; Beer and Rehnberg, 1997; Björk et al.,1997; Invers et al., 1999). Thus, the affinity for CO2
may be higher than that of HCO3−. However, utilization
of HCO3− is important in seagrasses if they are to sustain
relatively high photosynthetic rates. Beer and Rehnberg(1997) concluded that Z. marina can utilize HCO3
−, as amajor source of inorganic C, from seawater forphotosynthesis at close-to-ambient conditions.
Although seagrasses can utilize HCO3− for their
photosynthetic needs, it would appear that seagrassesare less efficient in HCO3
− use than marine macroalgae(Beer, 1994; Beer and Rehnberg, 1997; Björk et al.,1997). Consequently, seagrass photosynthesis may notbe saturated with DIC at natural seawater concentra-tions (Beer and Koch, 1996; Beer and Rehnberg, 1997;Zimmerman et al., 1997). Thus, C limitation forseagrass photosynthesis has been suggested for bothtemperate and tropical species (Björk et al., 1997;Invers et al., 2001). Carbon limitation of photosynthesisappears to be a common physiological feature for
seagrasses, and may become intensified in stagnantwaters due to boundary layer resistance of CO2
diffusion (Barko et al., 1986).
Acknowledgements
Comments from B. Touchette and two anonymousreviewers improved an earlier version of this manu-script. This work was supported by the Ministry ofMaritime Affairs & Fisheries of Korea (Grant#20040053), the project of greenhouse gas removal byseaweeds, and the Korean Sea Grant Program. [SS]
References
Abal, E.G., 1996. Light, nutrient and water quality interactions withthe seagrass, Zostera capricorni Aschers. PhD Thesis, Departmentof Botany, The University of Queensland, Brisbane, Australia.
Abal, E.G., Loneragan, N., Bowen, P., Perry, C.J., Udy, J.W.,Dennison, W.C., 1994. Physiological and morphological responsesof the seagrass Zostera carpricorni Aschers. to light intensity.J. Exp. Mar. Biol. Ecol. 178, 113–129.
Addicott, F.T., Lyon, J.L., 1973. Physiological ecology of abscission.In: Kozlowski, T.T. (Ed.), Shedding of Plant Part. Academic Press,New York, pp. 85–124.
Agawin, N.S.R., Duarte, C.M., Fortes, M.D., 1996. Nutrient limitationof Philippine seagrasses (Cape Bolinao, NW Philippines): in situexperimental evidence. Mar. Ecol. Prog. Ser. 138, 233–243.
Agawin, N.S.R., Duarte, C.M., Fortes, M.D., Uri, J.S., Vermaat, J.E.,2001. Temporal changes in the abundance, leaf growth andphotosynthesis of three co-occurring Philippine seagrasses. J. Exp.Mar. Biol. Ecol. 260, 217–239.
Agostini, S., Pergent, G., Marchand, B., 2003. Growth and primaryproduction of Cymodocea nodosa in a coastal lagoon. Aquat. Bot.76, 185–193.
Alcoverro, T., Romero, J., Duarte, C.M., López, N.I., 1997. Spatial andtemporal variations in nutrient limitation of seagrass Posidoniaoceanica growth in the NW Mediterranean. Mar. Ecol. Prog. Ser.146, 155–161.
Alcoverro, T., Manzanera, M., Romero, J., 1998. Seasonal and age-dependent variability of Posidonia oceanica (L.) Delile photosyn-thetic parameters. J. Exp. Mar. Biol. Ecol. 230, 1–13.
Backman, T.W., Barilotti, D.C., 1976. Irradiance reduction: effects onstanding crops of the eelgrass Zostera marina in a coastal lagoon.Mar. Biol. 34, 33–40.
Barber, B.J., Behrens, P.J., 1985. Effects of elevated temperature onseasonal in situ leaf productivity of Thalassia testudinum Banks exKönig and Syringodium filiforme Kützing. Aquat. Bot. 22, 61–69.
Barko, J.W., Adams, M.S., Clesceri, N.L., 1986. Environmentalfactors and their consideration in the management of submersedaquatic vegetation: a review. J. Aquat. Plant Manage. 24, 1–10.
Bay, D., 1984. A field study of the growth dynamics and productivityof Posidonia oceanica (L.) Delile in Calvi Bay, Corsica. Aquat.Bot. 20, 43–64.
Beer, S., 1989. Photosynthesis and photorespiration of marineangiosperms. Aquat. Bot. 34, 153–166.
Beer, S., 1994. Mechanisms of inorganic carbon acquisition in marinemacroalgae (with special reference to Chlorophyta). Prog. Phycol.Res. 10, 179–207.
169K.-S. Lee et al. / Journal of Experimental Marine Biology and Ecology 350 (2007) 144–175
Beer, S., Koch, E., 1996. Photosynthesis of marine macroalgae andseagrasses in globally changing CO2 environments. Mar. Ecol.Prog. Ser. 141, 199–204.
Beer, S., Rehnberg, J., 1997. The acquisition of inorganic carbon bythe seagrass Zostera marina. Aquat. Bot. 56, 277–283.
Beer, S., Waisel, Y., 1982. Effects of light and pressure on photo-synthesis in two seagrasses. Aquat. Bot. 13, 331–337.
Biebl, R., McRoy, C.P., 1971. Plasmatic resistance and rate ofrespiration and photosynthesis of Zostera marina at differentsalinities and temperatures. Mar. Biol. 8, 48–56.
Björk, M., Weil, A., Semesi, S., Beer, S., 1997. Photosyntheticutilisation of inorganic carbon by seagrasses from Zanzibar, EastAfrica. Mar. Biol. 129, 363–366.
Blackburn, T.H., Nedwell, D.B., Wiebe, W.J., 1994. Active mineralcycling in a Jamaican seagrass sediment. Mar. Ecol. Prog. Ser. 110,233–239.
Boon, P.I., Moriarty, D.J.W., Saffigna, P.G., 1986. Rates of ammoniumturnover and the role of amino-acid deamination in seagrass(Zostera capricorni) beds of Moreton Bay, Australia. Mar. Biol.91, 259–268.
Borum, J., 1985. Development of epiphytic communities on eelgrass(Zostera marina) along a nutrient gradient in a Danish estuary.Mar. Biol. 87, 211–218.
Boström, C., Roos, C., Rönnberg, O., 2004. Shoot morphometry andproduction dynamics of eelgrass in the northern Baltic Sea. Aquat.Bot. 79, 145–161.
Bulthuis, D.A., 1983a. Effects of in situ light reduction on density andgrowth of the seagrass Heterozostera tasmanica (Martens exAschers.) den Hartog in Western Port, Victoria, Australia. J. Exp.Mar. Biol. Ecol. 67, 91–103.
Bulthuis, D.A., 1983b. Effects of temperature on the photosynthesis–irradiance curve of the Australian seagrass, Heterozosteratasmanica. Mar. Biol. Lett. 4, 47–57.
Bulthuis, D.A., 1987. Effects of temperature on photosynthesis andgrowth of seagrasses. Aquat. Bot. 27, 27–40.
Bulthuis, D.A., Woelkerling, W.J., 1981. Effects of in situ nitrogen andphosphorus enrichment of the sediments on the seagrassHeterozosteratasmanica (Martens exAschers.) denHartog inWestern Port, Victoria,Australia. J. Exp. Mar. Biol. Ecol. 53, 193–207.
Bulthuis, D.A., Axelrad, D.M., Mickelson, M.J., 1992. Growth of theseagrass Heterozostera tasmanica limited by nitrogen in PortPhillip Bay, Australia. Mar. Ecol. Prog. Ser. 89, 269–275.
Burd, A.B., Dunton, K.H., 2001. Field verification of a light-drivenmodel of biomass changes in the seagrass Halodule wrightii. Mar.Ecol. Prog. Ser. 209, 85–98.
Burkholder, J.M., Mason, K.M., Glasgow Jr., H.B., 1992. Water-column nitrate enrichment promotes decline of eelgrass Zosteramarina: evidence from seasonal mesocosm experiments. Mar.Ecol. Prog. Ser. 81, 163–178.
Burkholder, J.M., Glasgow Jr., H.B., Cooke, J.E., 1994. Comparativeeffects of water-column nitrate enrichment on eelgrass Zosteramarina, shoalgrass Halodule wrightii, and widgeongrass Ruppiamaritima. Mar. Ecol. Prog. Ser. 105, 121–138.
Cabello-Pasini, A., Lara-Turrent, C., Zimmerman, R.C., 2002. Effectof storms on photosynthesis, carbohydrate content and survival ofeelgrass populations from a coastal lagoon and the adjacent openocean. Aquat. Bot. 74, 149–164.
Cabello-Pasini, A., Muñiz-Salazar, R., Ward, D.H., 2003. Annual varia-tions of biomass and photosynthesis in Zostera marina at its southernend of distribution in the North Pacific. Aquat. Bot. 76, 31–47.
Caffrey, J.M., Kemp, W.M., 1991. Seasonal and spatial patternsof oxygen production, respiration and root-rhizome release in
Potamogeton perfoliatus L. and Zostera marina L. Aquat. Bot. 40,109–128.
Cambridge, M.L., McComb, A.J., 1984. The loss of seagrasses inCockburn Sound, Western Australia. I. The time course and mag-nitude of seagrass decline in relation to industrial development.Aquat. Bot. 20, 229–243.
Cambridge, M.L., Chiffings, A.W., Brittan, C., Moore, L., McComb,A.J., 1986. The loss of seagrass in Cockburn Sound, WesternAustralia. II. Possible causes of seagrass decline. Aquat. Bot. 24,269–285.
Campbell, S.J., McKenzie, L.J., Kerville, S.P., 2006. Photosyntheticresponses of seven tropical seagrasses to elevated seawatertemperature. J. Exp. Mar. Biol. Ecol. 330, 455–468.
Capone, D.G., 1982. Nitrogen fixation (acetylene reduction) byrhizosphere sediments of the eelgrass Zostera marina. Mar. Ecol.Prog. Ser. 10, 67–75.
Capone, D.G., Taylor, B.F., 1980. N2 fixation in the rhizosphere ofThalassia testudinum. Can. J. Microbiol. 26, 998–1005.
Carruthers, T.J.B., Walker, D.I., 1997. Light climate and energy flowin the seagrass canopy of Amphibolis griffithii (J.M. Black) denHartog. Oecologia 109, 335–341.
Carruthers, T.J.B., Walker, D.I., 1999. Sensitivity of transects across adepth gradient for measuring changes in aerial coverage and abun-dance of Ruppia megacarpa Mason. Aquat. Bot. 65, 281–292.
Coleman, V.L., Burkholder, J.M., 1994. Community structure andproductivity of epiphytic microalgae on eelgrass (Zostera marinaL.) under water-column nitrate enrichment. J. Exp. Mar. Biol. Ecol.179, 29–48.
Connell, E.L., Colmer, T.D.,Walker, D.I., 1999. Radial oxygen loss fromintact roots of Halophila ovalis as a function of distance behind theroot tip and shoot illumination. Aquat. Bot. 63, 219–228.
Czerny, A.B., Dunton, K.H., 1995. The effects of in situ light reductionon the growth of two subtropical seagrasses, Thalassia testudinumand Halodule wrightii. Estuaries 18, 418–427.
Dawes, C.J., Lawrence, J.M., 1980. Seasonal changes in the proximateconstituents of the seagrasses Thalassia testudinum, Halodulewrightii, and Syringodium filiforme. Aquat. Bot. 8, 371–380.
Dawes, C.J., Tomasko, D.A., 1988. Depth distribution of Thalassiatestudinum in twomeadows on thewest coast of Florida; a differencein effect of light availability. PSZN I: Mar. Ecol. 9, 123–130.
Dawes, C., Chan, M., Chinn, R., Koch, E.W., Lazar, A., Tomasko, D.,1987. Proximate composition, photosynthetic and respiratoryresponses of the seagrass Halophila engelmannii from Florida.Aquat. Bot. 27, 195–201.
Dawes, C.J., Lobban, C.S., Tomasko, D.A., 1989. A comparison of thephysiological ecology of the seagrasses Halophila decipiensOstenfeld and H. johnsonii Eiseman from Florida. Aquat. Bot. 33,149–154.
Dennison, W.C., 1987. Effects of light on seagrass photosynthesis,growth and depth distribution. Aquat. Bot. 27, 15–26.
Dennison, W.C., Alberte, R.S., 1982. Photosynthetic responses ofZostera marina L. (eelgrass) to in situ manipulations of lightintensity. Oecologia 55, 137–144.
Dennison, W.C., Alberte, R.S., 1985. Role of daily light period in thedepth distribution of Zostera marina (eelgrass). Mar. Ecol. Prog.Ser. 25, 51–61.
Dennison, W.C., Alberte, R.S., 1986. Photoadaptation and growth ofZostera marina L. (eelgrass) transplants along a depth gradient.J. Exp. Mar. Biol. Ecol. 98, 265–282.
Dennison, W.C., Aller, R.C., Alberte, R.S., 1987. Sediment ammo-nium availability and eelgrass (Zostera marina) growth. Mar. Biol.94, 469–477.

170 K.-S. Lee et al. / Journal of Experimental Marine Biology and Ecology 350 (2007) 144–175
Dennison, W.C., Orth, R.J., Moore, K.A., Stevenson, J.C., Carter, V.,Kollar, S., Bergstrom, P.W., Batiuk, R.A., 1993. Assessing waterquality with submersed aquatic vegetation. Bioscience 43, 86–94.
Drew, E.A., 1978. Factors affecting photosynthesis and its seasonalvariation in the seagrasses Cymodocea nodosa (Ucria) Aschers,and Posidonia oceanica (L.) Delile in the Mediterranean. J. Exp.Mar. Biol. Ecol. 31, 173–194.
Drew, E.A., 1979. Physiological aspects of primary production inseagrasses. Aquat. Bot. 7, 139–150.
Drysdale, F.R., Barbour, M.G., 1975. Response of the marineangiosperm Phyllospadix torreyi to certain environmental vari-ables: a preliminary study. Aquat. Bot. 1, 97–106.
Duarte, C.M., 1990. Seagrass nutrient content. Mar. Ecol. Prog. Ser.67, 201–207.
Duarte, C.M., 1991. Seagrass depth limits. Aquat. Bot. 40, 363–377.Duarte, C.M., Kalff, J., 1987. Latitudinal influences on the depths of
maximum colonization and maximum biomass of submergedangiosperms in lakes. Can. J. Fish. Aquat. Sci. 44, 1759–1764.
Dunton, K.H., 1990. Production ecology of Ruppia maritima L. s.l.and Halodule wrightii Aschers. in two subtropical estuaries.J. Exp. Mar. Biol. Ecol. 143, 147–164.
Dunton, K.H., 1994. Seasonal growth and biomass of the subtropicalseagrass Halodule wrightii in relation to continuous measurementsof underwater irradiance. Mar. Biol. 120, 479–489.
Dunton, K.H., 1996. Photosynthetic production and biomass of thesubtropical seagrass Halodule wrightii along an estuarine gradient.Estuaries 19, 436–447.
Dunton, K.H., Tomasko, D.A., 1994. In situ photosynthesis in theseagrass Halodule wrightii in a hypersaline subtropical lagoon.Mar. Ecol. Prog. Ser. 107, 281–293.
Durako, M.J., 1993. Photosynthetic utilization of CO2(aq) and HCO3− in
Thalassia testudinum (Hydrocharitaceae). Mar. Biol. 115, 373–380.Durako, M.J., Moffler, M.D., 1985. Spatial influences on temporal
variations in leaf growth and chemical composition of Thalassiatestudinum Banks ex König in Tampa bay, Florida. Gulf Res. Rep.8, 43–49.
Edgecumbe, D.J., 1980. Some preliminary observations on thesubmerged aquatic Zostera capensis Setchell. J. South. Afr. Bot.46, 53–66.
Enríquez, S., Pantoja-Reyes, N.I., 2005. Form-function analysis of theeffect of canopy morphology on leaf self-shading in the seagrassThalassia testudinum. Oecologia 145, 235–243.
Enríquez, S., Agustí, S., Duarte, C.M., 1994. Light absorption bymarine macrophytes. Oecologia 98, 121–129.
Enríquez, S., Duarte, C.M., Sand-Jensen, K., 1995. Patterns in thephotosynthetic metabolism of Mediterranean macrophytes. Mar.Ecol. Prog. Ser. 119, 243–252.
Enríquez, S., Merino, M., Iglesias-Prieto, R., 2002. Variations in thephotosynthetic performance along the leaves of the tropicalseagrass Thalassia testudinum. Mar. Biol. 140, 891–900.
Erftemeijer, P.L.A., Herman, P.M.J., 1994. Seasonal changes inenvironmental variables, biomass, production and nutrient con-tents in two contrasting tropical intertidal seagrass beds in SouthSulawesi, Indonesia. Oecologia 99, 45–59.
Erftemeijer, P.L.A., Stapel, J., Smekens, M.J.E., Drossaert, W.M.E.,1994. The limited effect of in situ phosphorus and nitrogenadditions to seagrass beds on carbonate and terrigenous sedimentsin South Sulawesi, Indonesia. J. Exp. Mar. Biol. Ecol. 182,123–140.
Evans, A.S., Webb, K.L., Penhale, P.A., 1986. Photosynthetictemperature acclimation in two coexisting seagrasses, Zosteramarina L. and Ruppia maritima L. Aquat. Bot. 24, 185–197.
Flanigan, Y.S., Critchley, C., 1996. Light response of D1 turnover andphotosystem II efficiency in the seagrass Zostera capricorni.Planta 198, 319–323.
Fourqurean, J.W., Cai, Y., 2001. Arsenic and phosphorus in seagrassleaves from the Gulf of Mexico. Aquat. Bot. 71, 247–258.
Fourqurean, J.W., Zieman, J.C., 1991. Photosynthesis, respiration andwhole plant carbon budget of the seagrass Thalassia testudinum.Mar. Ecol. Prog. Ser. 69, 161–170.
Fourqurean, J.W., Moore, T.O., Fry, B., Hollibaugh, J.T., 1997. Spatialand temporal variation in C:N:P ratios δ15N and δ13C of eelgrassZostera marina as indicators of ecosystem processes, TomalesBay, California, USA. Mar. Ecol. Prog. Ser. 157, 147–157.
Fourqurean, J.W., Zieman, J.C., Powell, G.V.N., 1992a. Phosphoruslimitation of primary production in Florida bay: evidence fromC:N:Pratios of the dominant seagrass Thalassia testudinum. Limnol.Oceanogr. 37, 162–171.
Fourqurean, J.W., Zieman, J.C., Powell, G.V.N., 1992b. Relationshipsbetween porewater nutrients and seagrasses in a subtropicalcarbonate environment. Mar. Biol. 114, 57–65.
Fry, B., Virnstein, R.W., 1988. Leaf production and export of theseagrass Syringodium filiforme Kütz. in Indian River Lagoon,Florida. Aquat. Bot. 30, 261–266.
Gallegos, C.L., Correll, D.L., Pierce, J.W., 1990. Modeling spectraldiffuse attenuation, absorption, and scattering coefficients in aturbid estuary. Limnol. Oceanogr. 35, 1486–1502.
Giesen, W.B.J.T., van Katwijk, M.M., den Hartog, C., 1990. Eelgrasscondition and turbidity in the Dutch Wadden Sea. Aquat. Bot. 37,71–85.
Gilbert, S., Clark, K.B., 1981. Seasonal variation in standing crop ofthe seagrass Syringodium filiforme and associated macrophytes inthe northern Indian River, Florida. Estuaries 4, 223–225.
Goodman, J.L., Moore, K.A., Dennison, W.C., 1995. Photosyn-thetic responses of eelgrass (Zostera marina L.) to light andsediment sulfide in a shallow barrier island lagoon. Aquat. Bot.50, 37–47.
Gordon, D.M., Grey, K.A., Chase, S.C., Simpson, C.J., 1994. Changesto the structure and productivity of a Posidonia sinuosa meadowduring and after imposed shading. Aquat. Bot. 47, 265–275.
Gras, A.F., Koch, M.S., Madden, C.J., 2003. Phosphorus uptakekinetics of a dominant tropical seagrass Thalassia testudinum.Aquat. Bot. 76, 299–315.
Greenway, M., 1974. The effects of cropping on the growth ofThalassia testudinum (König) in Jamaica. Aquaculture 4, 199–206.
Grice, A.M., Loneragan, N.R., Dennison, W.C., 1996. Light intensityand the interactions between physiology, morphology and stableisotope ratios in five species of seagrass. J. Exp. Mar. Biol. Ecol.195, 91–110.
Hanekom, N., Baird, D., 1988. Distribution and variations in seasonalbiomass of eelgrass Zostera capensis in the Kormme estuary, St.Francis Bay, South Africa. S. Afr. J. Mar. Sci. 7, 51–59.
Hansen, J.W., Udy, J.W., Perry, C.J., Dennison, W.C., Lomstein, B.A.,2000. Effect of the seagrass Zostera capricorni on sedimentmicrobial processes. Mar. Ecol. Prog. Ser. 199, 83–96.
Harlin,M.M., Thorne-Miller, B., 1981. Nutrient enrichment of seagrassbeds in a Rhode Island coastal lagoon. Mar. Biol. 65, 221–229.
Heck Jr., K.L., Westone, G.S., 1977. Habitat complexity andinvertebrate species richness and abundance in tropical seagrassmeadows. J. Biogeogr. 4, 135–142.
Heck Jr., K.L., Pennock, J.R., Valentine, J.F., Coen, L.D., Sklenar, S.A.,2000. Effects of nutrient enrichment and small predator density onseagrass ecosystems: an experimental assessment. Limnol. Ocea-nogr. 45, 1041–1057.
171K.-S. Lee et al. / Journal of Experimental Marine Biology and Ecology 350 (2007) 144–175
Hemminga, M.A., Gwada, P., Slim, F.J., de Koeyer, P., Kazungu, J.,1995. Leaf production and nutrient contents of the seagrassThalassodendron ciliatum in the proximity of a mangrove forest(Gazi Bay, Kenya). Aquat. Bot. 50, 159–170.
Hena, M.K.A., Misri, K., Sidik, B.J., Hishamuddin, O., Hidir, H.,2001. Photosynthesis of seagrass Cymodocea serrulata (Magno-liophyta/Potamogetonales/Cymodoceaceae) in field and laborato-ry. Indian J. Mar. Sci. 30, 253–256.
Henley, W.J., 1993. Measurement and interpretation of photosyntheticlight-response curves in algae in the context of photoinhibition anddiel changes. J. Phycol. 29, 729–739.
Herzka, S.Z., Dunton, K.H., 1997. Seasonal photosynthetic patterns ofthe seagrass Thalassia testudinum in the western Gulf of Mexico.Mar. Ecol. Prog. Ser. 152, 103–117.
Herzka, S.Z., Dunton, K.H., 1998. Light and carbon balance in theseagrass Thalassia testudinum: evaluation of current productionmodels. Mar. Biol. 132, 711–721.
Hillman, K., Walker, D.I., Larkum, A.W.D., McComb, A.J., 1989.Productivity and nutrient limitation. In: Larkum, A.W.D.,McComb, A.J., Shepherd, S.A. (Eds.), Biology of Seagrasses: ATreatise on the Biology of Seagrasses with Special Reference to theAustralian Region. Elsevier, Amsterdam, pp. 635–685.
Hillman, K., McComb, A.J., Walker, D.I., 1995. The distribution,biomass and primary production of the seagrass Halophila ovalisin the Swan/Canning Estuary, Western Australia. Aquat. Bot. 51,1–54.
Hines,M.E., Lyons,W.B., 1982. Biogeochemistry of nearshoreBermudasediments. I. Sulfate reduction rates and nutrient generation. Mar.Ecol. Prog. Ser. 8, 87–94.
Holmer, M., Bondgaard, E.J., 2001. Photosynthetic and growthresponse of eelgrass to low oxygen and high sulfide concentrationsduring hypoxic events. Aquat. Bot. 70, 29–38.
Holmer, M., Nielsen, S.L., 1997. Sediment sulfur dynamics related tobiomass-density patterns in Zostera marina (eelgrass) beds. Mar.Ecol. Prog. Ser. 146, 163–171.
Holmer, M., Olsen, A.B., 2002. Role of decomposition of mangroveand seagrass detritus in sediment carbon and nitrogen cycling in atropical mangrove forest. Mar. Ecol. Prog. Ser. 230, 87–101.
Huh, S.H., Kitting, C.L., 1985. Trophic relationships amongconcentrated populations of small fishes in seagrass meadows.J. Exp. Mar. Biol. Ecol. 92, 29–43.
Huppe, H.C., Turpin, D.H., 1994. Interaction of carbon and nitrogenmetabolism in plant and algal cells. Annu. Rev. Plant Physiol.Plant Mol. Biol. 45, 577–607.
Ibarra-Obando, S.E., Huerta-Tamayo, R., 1987. Blade production ofZostera marina L. during the summer-autumn period on thepacific coast of Mexico. Aquat. Bot. 28, 301–315.
Iizumi, H., Hattori, A., 1982. Growth and organic production ofeelgrass (Zostera marina L.) in temperate waters of the Pacificcoast of Japan. III. The kinetics of nitrogen uptake. Aquat. Bot. 12,245–256.
Iizumi, H., Hattori, A., McRoy, C.P., 1982. Ammonium regenerationand assimilation in eelgrass (Zostera marina) beds. Mar. Biol. 66,59–65.
Invers, O., Pérez, M., Romero, J., 1999. Bicarbonate utilization inseagrass photosynthesis: role of carbonic anhydrase in Posidoniaoceanica (L.) Delile and Cymodocea nodosa (Ucria) Ascherson.J. Exp. Mar. Biol. Ecol. 235, 125–133.
Invers, O., Zimmerman, R.C., Alberte, R.S., Pérez, M., Romero, J.,2001. Inorganic carbon sources for seagrass photosynthesis: anexperimental evaluation of bicarbonate use in species inhabitingtemperate waters. J. Exp. Mar. Biol. Ecol. 265, 203–217.
James, P.L., Larkum, A.W.D., 1996. Photosynthetic inorganic carbonacquisition of Posidonia australis. Aquat. Bot. 55, 149–157.
Jiménez, C., Niell, F.X., Algarra, P., 1987. Photosynthetic adaptationof Zostera noltii Hornem. Aquat. Bot. 29, 217–226.
Johnson, M.W., Heck Jr., K.L., Fourqurean, J.W., 2006. Nutrientcontent of seagrasses and epiphytes in the northern Gulf ofMexico: evidence of phosphorus and nitrogen limitation. Aquat.Bot. 85, 103–111.
Jørgensen, B.B., 1977. The sulfur cycle of a coastal marine sediment(Limfjorden, Denmark). Limnol. Oceanogr. 22, 814–832.
Jørgensen, B.B., 1982. Mineralization of organic matter in the sea bed—the role of sulphate reduction. Nature 296, 643–645.
Kaldy, J.E., 2006. Production ecology of the non-indigenous seagrass,dwarf eelgrass (Zostera japonica Ascher, & Graeb.), in a PacificNorthwest Estuary, USA. Hydrobiologia 553, 201–217.
Kaldy, J.E., Dunton, K.H., 1999. Ontogenetic photosynthetic changes,dispersal and survival ofThalassia testudinum (turtle grass) seedlingsin a sub-tropical lagoon. J. Exp. Mar. Biol. Ecol. 240, 193–212.
Kaldy, J.E., Dunton, K.H., 2000. Above- and below-groundproduction, biomass and reproductive ecology of Thalassiatestudinum (turtle grass) in a subtropical coastal lagoon. Mar.Ecol. Prog. Ser. 193, 271–283.
Kenworthy, W.J., Fonseca, M.S., 1996. Light requirements ofseagrasses Halodule wrightii and Syringodium filiforme derivedfrom the relationship between diffuse light attenuation andmaximum depth distribution. Estuaries 19, 740–750.
Kenworthy, W.J., Haunert, D.E., 1991. The light requirements ofseagrasses: proceedings of a workshop to examine the capability ofwater quality criteria, standards and monitoring programs toprotect seagrasses. NOAA Technol. Mem. NMFS-SEFC-287,NOAA.
Kenworthy, W.J., Zieman, J.C., Thayer, G.W., 1982. Evidence for theinfluence of seagrasses on the benthic nitrogen cycle in a coastalplain estuary near Beaufort, North Carolina (USA). Oecologia 54,152–158.
Kilminster, K.L., Walker, D.I., Thompson, P.A., Raven, J.A., 2006.Limited nutritional benefit to the seagrass Halophila ovalis, inculture, following sediment organic matter enrichment. Estuar.Coast. Shelf Sci. 68, 675–685.
Koch, E.W., 1994. Hydrodynamics, diffusion-boundary layers andphotosynthesis of the seagrasses Thalassia testudinum and Cymo-docea nodosa. Mar. Biol. 118, 767–776.
Koch, E.W., Beer, S., 1996. Tides, light and the distribution of Zosteramarina in Long Island Sound, USA. Aquat. Bot. 53, 97–107.
Koch, M.S., Benz, R.E., Rudnick, D.T., 2001. Solid-phase phosphoruspools in highly organic carbonate sediments of NortheasternFlorida Bay. Estuar. Coast. Shelf Sci. 52, 279–291.
Kuo, J., den Hartog, C., 2006. Seagrass morphology, anatomy, andultrastructure. In: Larkum, A.W.D., Orth, R.J., Duarte, C.M.(Eds.), Seagrasses: Biology, Ecology and Conservation. Springer,pp. 51–87.
Lara, C., Romero, J.M., Guerrero, M.G., 1987. Regulated nitratetransport in the cyanobacterium Anacystis nidulans. J. Bacteriol.169, 4376–4378.
Lapointe, B.E., Tomasko, D.A., Matzie, W.R., 1994. Eutrophicationand trophic state classification of seagrass communities in theFlorida Keys. Bull. Mar. Sci. 54, 696–717.
Larkum, A.W.D., James, P.L., 1996. Towards a model for inorganiccarbon uptake in seagrasses involving carbonic anhydrase. In:Kuo, J., Phillips, R.C., Walker, D.I., Kirkman, H. (Eds.), SeagrassBiology. The University of Western Australia, Nedlands, Australia,pp. 191–196.
172 K.-S. Lee et al. / Journal of Experimental Marine Biology and Ecology 350 (2007) 144–175
Lee, K.-S., Dunton, K.H., 1996. Production and carbon reservedynamics of the seagrass Thalassia testudinum in Corpus ChristiBay, Texas, USA. Mar. Ecol. Prog. Ser. 143, 201–210.
Lee, K.-S., Dunton, K.H., 1997. Effects of in situ light reduction on themaintenance, growth and partitioning of carbon resources in Thalas-sia testudinum Banks ex König. J. Exp. Mar. Biol. Ecol. 210, 53–73.
Lee, K.-S., Dunton, K.H., 1999a. Influence of sediment nitrogen-availability on carbon and nitrogen dynamics in the seagrassThalassia testudinum. Mar. Biol. 134, 217–226.
Lee, K.-S., Dunton, K.H., 1999b. Inorganic nitrogen acquisition in theseagrass Thalassia testudinum: development of a whole-plantnitrogen budget. Limnol. Oceanogr. 44, 1204–1215.
Lee, K.-S., Dunton, K.H., 2000. Effects of nitrogen enrichment onbiomass allocation, growth, and leaf morphology of the seagrassThalassia testudinum. Mar. Ecol. Prog. Ser. 196, 39–48.
Lee, K.-S., Park, S.R., Kim, J.-B., 2005. Production dynamics of theeelgrass, Zostera marina in two bay systems on the south coast ofthe Korean peninsula. Mar. Biol. 147, 1091–1108.
Lee, S.Y., Kim, J.B., Lee, S.M., 2006. Temporal dynamics of subtidalZostera marina and intertidal Zostera japonica on the southerncoast of Korea. Mar. Ecol. 27, 133–144.
Longstaff, B.J., Dennison, W.C., 1999. Seagrass survival duringpulsed turbidity events: the effects of light deprivation on theseagrasses Halodule pinifolia and Halophila ovalis. Aquat. Bot.65, 105–121.
Longstaff, B.J., Loneragan, N.R., O, 'Donohue, M.J., Dennison, W.C.,1999. The effects of light deprivation on the survival and recovery ofthe seagrass Halophila ovalis. J. Exp. Mar. Biol. Ecol. 234, 1–27.
Luning, K., Dring, M.J., 1979. Continuous underwater lightmeasurement in the sublittoral region. Helgol. Wiss. Meeressun-ters. 32, 403–424.
Macauley, J.M., Clark, J.R., Price, W.A., 1988. Seasonal changes inthe standing crop and chlorophyll content of Thalassia testudinumBanks ex König and its epiphytes in the northern Gulf of Mexico.Aquat. Bot. 31, 277–287.
Major, K.M., Dunton, K.H., 2000. Photosynthetic performance inSyringodium filiforme: seasonal variation in light-harvestingcharacteristics. Aquat. Bot. 68, 249–264.
Markager, S., Sand-Jensen, K., 1992. Light requirements and depthzonation of marine macroalgae. Mar. Ecol. Prog. Ser. 88, 83–92.
Marsh Jr., J.A., Dennison, W.C., Alberte, R.S., 1986. Effects oftemperature on photosynthesis and respiration in eelgrass (Zosteramarina L.). J. Exp. Mar. Biol. Ecol. 101, 257–267.
Masini, R.J., Manning, C.R., 1997. The photosynthetic responses toirradiance and temperature of four meadow-forming seagrasses.Aquat. Bot. 58, 21–36.
Masini, R.J., Cary, J.L., Simpson, C.J., McComb, A.J., 1995. Effects oflight and temperature on the photosynthesis of temperate meadow-forming seagrasses in Western Australia. Aquat. Bot. 49, 239–254.
Masini, R.J., Anderson, P.K., McComb, A.J., 2001. A Halodule-dominated community in a subtropical embayment: physicalenvironment, productivity, biomass, and impact of dugong grazing.Aquat. Bot. 71, 179–197.
Mateo, M.A., Romero, J., 1997. Detritus dynamics in the seagrassPosidonia oceanica: elements for an ecosystem carbon andnutrient budget. Mar. Ecol. Prog. Ser. 151, 43–53.
Mazzella, L., Alberte, R.S., 1986. Light adaptation and the role ofautotrophic epiphytes in primary production of the temperateseagrass, Zostera marina L. J. Exp. Mar. Biol. Ecol. 100, 165–180.
McPherson, B.F., Miller, R.L., 1987. The vertical attenuation of lightin Charlotte Harbor, a shallow, subtropical estuary, south-westernFlorida. Estuar. Coast. Shelf Sci. 25, 721–737.
McRoy, C.P.,McMillan, C., 1977. Production ecology and physiology ofseagrasses. In: McRoy, C.P., Helfferich, C. (Eds.), SeagrassEcosystems:AScientific Perspective. Dekker, NewYork, pp. 53–81.
Middelboe, A.L., Markager, S., 1997. Depth limits and minimum lightrequirements of freshwater macrophytes. Freshw. Biol. 37, 553–568.
Moore, K.A., Neckles, H.A., Orth, R.J., 1996. Zostera marina(eelgrass) growth and survival along a gradient of nutrients andturbidity in the lower Chesapeake Bay. Mar. Ecol. Prog. Ser. 142,247–259.
Moore, K.A., Wetzel, R.L., Orth, R.J., 1997. Seasonal pulses ofturbidity and their relations to eelgrass (Zostera marina L.)survival in an estuary. J. Exp. Mar. Biol. Ecol. 215, 115–134.
Moriarty, D.J.W., O, 'Donohue, M.J., 1993. Nitrogen fixation inseagrass communities during summer in Gulf of Carpentaria,Australia. Aust. J. Mar. Freshw. Res. 44, 117–125.
Moriarty, D.J.W., Boon, P.I., Hansen, J.A., Hunt, W.G., Poiner, I.R.,Pollard, P.C., Skyring, G.W., White, D.C., 1985. Microbial biomassand productivity in seagrass beds. Geomicrobiol. J. 4, 21–51.
Morris, L.J., Tomasko, D.A. (Eds.), 1993. Proceedings and Conclu-sions of Workshops on the Submerged Aquatic VegetationInitiative and Photosynthetically Active Radiation. Special Publi-cation SJ93-SP13. St. Johns River Water Management District,Palatka, FL, pp. 149–158.
Murray, L., Dennison, W.C., Kemp, W.M., 1992. Nitrogen versusphosphorus limitation for growth of an estuarine population ofeelgrass (Zostera marina L.). Aquat. Bot. 44, 83–100.
Nelson, T.A., Waaland, J.R., 1997. Seasonality of eelgrass, epiphyte,and grazer biomass and productivity in subtidal eelgrass meadowssubjected to moderate tidal amplitude. Aquat. Bot. 56, 51–74.
Neverauskas, V.P., 1988. Response of a Posidonia community toprolonged reduction in light. Aquat. Bot. 31, 361–366.
Nielsen, O.I., Koch, M.S., Jensen, H.S., Madden, C.J., 2006. Tha-lassia testudinum phosphate uptake kinetics at low in situconcentrations using a 33P radioisotope technique. Limnol.Oceanogr. 51, 208–217.
O 'Donohue, M.J., Moriarty, D.J.W., McRae, I.C., 1991. Nitrogenfixation in sediments and the rhizosphere of the seagrass Zosteracapricorni. Microb. Ecol. 22, 53–64.
Olesen, B., Sand-Jensen, K., 1993. Seasonal acclimatization ofeelgrass Zostera marina growth to light. Mar. Ecol. Prog. Ser.94, 91–99.
Olesen, B., Enríquez, S., Duarte, C.M., Sand-Jensen, K., 2002. Depth-acclimation of photosynthesis, morphology and demography ofPosidonia oceanica and Cymodocea nodosa in the SpanishMediterranean Sea. Mar. Ecol. Prog. Ser. 236, 89–97.
Onuf, C.P., 1994. Seagrasses, dredging and light in Laguna Madre,Texas, U.S.A. Estuar. Coast. Shelf Sci. 39, 75–91.
Opsahl, S., Benner, R., 1993. Decomposition of senescent blades ofthe seagrass Halodule wrightii in a subtropical lagoon. Mar. Ecol.Prog. Ser. 94, 191–205.
Orth, R.J., 1977. Effect of nutrient environment on growth of theeelgrass Zostera marina in the Chesapeake Bay, Virginia, USA.Mar. Biol. 44, 187–194.
Orth, R.J., Moore, K.A., 1983. Chesapeake Bay: an unprecedenteddecline in submerged aquatic vegetation. Science 222, 51–53.
Orth, R.J., Moore, K.A., 1986. Seasonal and year-to-year variations inthe growth of Zostera marina L. (eelgrass) in the lowerChesapeake Bay. Aquat. Bot. 24, 335–341.
Orth, R.J., Heck Jr., K.L., van Montfrans, J., 1984. Faunalcommunities in seagrass beds: a review of the influence of plantstructure and prey characteristics on predator-prey relationships.Estuaries 7, 339–350.
173K.-S. Lee et al. / Journal of Experimental Marine Biology and Ecology 350 (2007) 144–175
Parnik, T., Bil, K., Kolmakov, P., Titlyanov, E., 1992. Photosynthesisof the seagrass Thalassodendron ciliatum: leaf anatomy andcarbon metabolism. Photosynthetica 26, 213–223.
Pedersen, M.F., Borum, J., 1992. Nitrogen dynamics of eelgrassZostera marina during a late summer period of high growth andlow nutrient availability. Mar. Ecol. Prog. Ser. 80, 65–73.
Pedersen, M.F., Borum, J., 1993. An annual nitrogen budget for aseagrass Zostera marina population. Mar. Ecol. Prog. Ser. 101,169–177.
Pedersen, M.F., Paling, E.I., Walker, D.I., 1997. Nitrogen uptake andallocation in the seagrass Amphibolis antarctica. Aquat. Bot. 56,105–117.
Peduzzi, P., Vukovič, A., 1990. Primary production of Cymodoceanodosa in the Gulf of Trieste (Northern Adriatic Sea): acomparison of methods. Mar. Ecol. Prog. Ser. 64, 197–207.
Penhale, P.A., 1977. Macrophyte-epiphyte biomass and productivity inan eelgrass (Zostera marina L.) community. J. Exp. Mar. Biol.Ecol. 26, 211–224.
Peralta, G., Pérez-Lloréns, J.L., Hernández, I., Vergara, J.J., 2002.Effects of light availability on growth, architecture and nutrientcontent of the seagrass Zostera noltii Hornem. J. Exp. Mar. Biol.Ecol. 269, 9–26.
Pérez, M., Romero, J., 1992. Photosynthetic response to light andtemperature of the seagrass Cymodocea nodosa and the predictionof its seasonality. Aquat. Bot. 43, 51–62.
Pérez, M., Romero, J., Duarte, C.M., Sand-Jensen, K., 1991.Phosphorus limitation of Cymodocea nodosa growth. Mar. Biol.109, 129–133.
Pérez-Lloréns, J.L., Niell, F.X., 1993. Seasonal dynamics of biomassand nutrient content in the intertidal seagrass Zostera noltiiHornem. from Palmones River estuary, Spain. Aquat. Bot. 46,49–66.
Philippart, C.J.M., 1995. Effects of shading on growth, biomass andpopulation maintenance of the intertidal seagrass Zostera noltiiHornem. in the Dutch Wadden Sea. J. Exp. Mar. Biol. Ecol. 188,199–213.
Phillips, R.C., McMillan, C., Bridges, K.W., 1983. Phenology ofeelgrass, Zostera marina L., along latitudinal gradients in NorthAmerica. Aquat. Bot. 15, 145–156.
Powell, G.V.N., Kenworthy, W.J., Fourqurean, J.W., 1989. Experi-mental evidence for nutrient limitation of seagrass growth in atropical estuary with restricted circulation. Bull. Mar. Sci. 44,324–340.
Ralph, P.J., 1998. Photosynthetic response of laboratory-cultured Ha-lophila ovalis to thermal stress. Mar. Ecol. Prog. Ser. 171, 123–130.
Ralph, P.J., Burchett, M.D., Pulkownik, A., 1992. Distribution ofextractable carbohydrate reserves within the rhizome of theseagrass Posidonia australis Hook. f. Aquat. Bot. 42, 385–392.
Roesler, C.S., Perry, M.J., Carder, K.L., 1989. Modeling in situphytoplankton absorption from total absorption spectra in productiveinland marine waters. Limnol. Oceanogr. 34, 1510–1523.
Romero, J., Lee, K.-S., Pérez, M., Mateo, M.A., Alcoverro, T., 2006.Nutrients dynamics in seagrass ecosystems. In: Larkum, A.W.D.,Orth, R.J., Duarte, C.M. (Eds.), Seagrasses: Biology, Ecology andConservation. Springer, pp. 227–254.
Ruiz, J.M., Romero, J., 2001. Effects of in situ experimental shadingon the Mediterranean seagrass Posidonia oceanica. Mar. Ecol.Prog. Ser. 215, 107–120.
Ruiz, J.M., Romero, J., 2003. Effects of disturbances caused by coastalconstructions on spatial structure, growth dynamics and photo-synthesis of the seagrass Posidonia oceanica. Mar. Pollut. Bull.46, 1523–1533.
Ruiz, J.M., Pérez, M., Romero, J., 2001. Effects of fish farm loadingson seagrass (Posidonia oceanica) distribution, growth andphotosynthesis. Mar. Pollut. Bull. 42, 749–760.
Sand-Jensen, K., 1975. Biomass, net production and growth dynamics inan eelgrass (ZosteramarinaL.) population inVellerupVig,Denmark.Ophelia 14, 185–201.
Sand-Jensen, K., 1988. Minimum light requirements for growth inUlva lactuca. Mar. Ecol. Prog. Ser. 50, 187–193.
Sand-Jensen, K., Borum, J., 1983. Regulation of growth of eelgrass(Zostera marina L.) in Danish coastal waters. Mar. Technol. Soc. J.17, 15–21.
Schwarz, A.-M., 2004. Contribution of photosynthetic gains during tidalemersion to production of Zostera capricorni in a North Island, NewZealand estuary. N. Z. J. Mar. Freshw. Res. 38, 809–818.
Seddon, S., Cheshire, A.C., 2001. Photosynthetic response of Am-phibolis antarctica and Posidonia australis to temperature anddesiccation using chlorophyll fluorescence. Mar. Ecol. Prog. Ser.220, 119–130.
Setchell, W.A., 1929. Morphological and phenological notes on Zosteramarina L. Univ. Calif. Publ. Bot. 14, 389–452.
Sfriso, A., Ghetti, P.F., 1998. Seasonal variation in biomass,morphometric parameters and production of seagrasses in thelagoon of Venice. Aquat. Bot. 61, 207–223.
Sheldon, R.B., Boylen, C.W., 1977. Maximum depth inhabited byaquatic vascular plants. Am. Midl. Nat. 97, 248–254.
Short, F.T., 1983. The seagrass, Zostera marina L.: plant morphologyand bed structure in relation to sediment ammonium in IzembekLagoon, Alaska. Aquat. Bot. 16, 149–161.
Short, F.T., 1987. Effects of sediment nutrients on seagrasses: literaturereview and mesocosm experiment. Aquat. Bot. 27, 41–57.
Short, F.T., McRoy, C.P., 1984. Nitrogen uptake by leaves and roots ofthe seagrass Zostera marina L. Bot. Mar. 27, 547–555.
Short, F.T., Davis, M.W., Gibson, R.A., Zimmermann, C.F., 1985.Evidence for phosphorus limitation in carbonate sediments of theseagrass Syringodium filiforme. Estuar. Coast. Shelf Sci. 20,419–430.
Short, F.T., Dennison, W.C., Capone, D.G., 1990. Phosphorus-limitedgrowth of the tropical seagrass Syringodium filiforme in carbonatesediments. Mar. Ecol. Prog. Ser. 62, 169–174.
Short, F.T., Burdick, D.M., Kaldy, J.E., 1995. Mesocosm experimentsquantify the effects of eutrophication on eelgrass, Zostera marina.Limnol. Oceanogr. 40, 740–749.
Short, F.T., Wyllie-Echeverria, S., 1996. Natural and human-induceddisturbance of seagrasses. Environ. Conserv. 23, 17–27.
Silberstein, K., Chiffings, A.W., McComb, A.J., 1986. The loss ofseagrass in Cockburn Sound, Western Australia. III. The effect ofepiphytes on productivity of Posidonia australis Hook. F. Aquat.Bot. 24, 355–371.
Silva, J., Santos, R., 2004. Can chlorophyll fluorescence be used toestimate photosynthetic production in the seagrass Zostera noltii?J. Exp. Mar. Biol. Ecol. 307, 207–216.
Smith, R.D., Dennison, W.C., Alberte, R.S., 1984. Role of seagrassphotosynthesis in root aerobic processes. Plant Physiol. 74,1055–1058.
Stapel, J., Aarts, T.L., van Duynhoven, B.H.M., de Groot, J.D., vanden Hoogen, P.H.W., Hemminga, M.A., 1996. Nutrient uptake byleaves and roots of the seagrass Thalassia hemprichii in theSpermonde Archipelago, Indonesia. Mar. Ecol. Prog. Ser. 134,195–206.
Steward, J.S., Virnstein, R.W., Morris, L.J., Lowe, E.F., 2005. Settingseagrass depth, coverage, and light targets for the Indian RiverLagoon System, Florida. Estuaries 28, 923–935.
174 K.-S. Lee et al. / Journal of Experimental Marine Biology and Ecology 350 (2007) 144–175
Strickland, J.D.H., 1958. Solar radiation penetrating the ocean. Areview of requirements, data and methods of measurement, withparticular reference to photosynthetic productivity. J. Fish. Res.Board Can. 15, 453–493.
Summerson, H.C., Peterson, C.H., 1984. Role of predation inorganizing benthic communities of a temperate-zone seagrassbed. Mar. Ecol. Prog. Ser. 15, 63–77.
Terrados, J., Ros, J.D., 1995. Temperature effects on photosynthesisand depth distribution of the seagrass Cymodocea nodosa (Ucria)Ascherson in a Mediterranean coastal lagoon: the Mar Menor (SESpain). Mar. Ecol. 16, 133–144.
Terrados, J., Williams, S.L., 1997. Leaf versus root nitrogen uptake bythe surfgrass Phyllospadix torreyi. Mar. Ecol. Prog. Ser. 149,267–277.
Terrados, J., Agawin, N.S.R., Duarte, C.M., Fortes, M.D., Kamp-Nielsen, L., Borum, J., 1999a. Nutrient limitation of the tropicalseagrass Enhalus acoroides (L.) Royle in Cape Bolinao, NWPhilippines. Aquat. Bot. 65, 123–139.
Terrados, J., Borum, J., Duarte, C.M., Fortes, M.D., Kamp-Nielsen, L.,Agawin, N.S.R., Kenworthy, W.J., 1999b. Nutrient and massallocation of South-east Asian seagrasses. Aquat. Bot. 63, 203–217.
Thacker, A., Syrett, P.J., 1972. The assimilation of nitrate and ammo-nium by Chlamydomonas reinhardi. New Phytol. 71, 423–433.
Thom, R.M., 1990. Spatial and temporal patterns in plant standingstock and primary production in a temperate seagrass system. Bot.Mar. 33, 497–510.
Thursby, G.B., Harlin, M.M., 1982. Leaf–root interaction in the uptakeof ammonia by Zostera marina. Mar. Biol. 72, 109–112.
Thursby, G.B., Harlin, M.M., 1984. Interaction of leaves and roots ofRuppia maritima in the uptake of phosphate, ammonia and nitrate.Mar. Biol. 83, 61–67.
Tomasko, D.A., Dawes, C.J., 1989. Evidence for physiologicalintegration between shaded and unshaded short shoots of Thalas-sia testudinum. Mar. Ecol. Prog. Ser. 54, 299–305.
Tomasko, D.A., Hall, M.O., 1999. Productivity and biomass of theseagrass Thalassia testudinum along a gradient of freshwaterinfluence in Charlotte Harbor, Florida. Estuaries 22, 592–602.
Tomasko, D.A., Lapointe, B.E., 1991. Productivity and biomass ofThalassia testudinum as related to water column nutrient avail-ability and epiphyte levels: field observations and experimentalstudies. Mar. Ecol. Prog. Ser. 75, 9–17.
Torquemada, Y.F., Durako, M.J., Lizaso, J.L.S., 2005. Effects ofsalinity and possible interactions with temperature and pH ongrowth and photosynthesis of Halophila johnsonii Eiseman. Mar.Biol. 148, 251–260.
Touchette, B.W., 1999. Physiological and developmental responses ofeelgrass (Zostera marina L.) to increases in water-column nitrateand temperature. Ph.D. Dissertation, North Carolina StateUniversity, Raleigh, NC.
Touchette, B.W., Burkholder, J.M., 2000. Review of nitrogen andphosphorus metabolism in seagrasses. J. Exp. Mar. Biol. Ecol. 250,133–167.
Turpin, D.H., 1991. Effects of inorganic N availability on algalphotosynthesis and carbon metabolism. J. Phycol. 27, 14–20.
Turpin, D.H., Botha, F.C., Smith, R.G., Feil, R., Horsey, A.K.,Vanlerberghe, G.C., 1990. Regulation of carbon partitioning torespiration during dark ammonium assimilation by the green algaSelenastrum minutum. Plant Physiol. 93, 166–175.
Tutin, T.G., 1942. Zostera. J. Ecol. 30, 217–266.Udy, J.W., Dennison, W.C., 1997. Growth and physiological responses
of three seagrass species to elevated sediment nutrients in MoretonBay, Australia. J. Exp. Mar. Biol. Ecol. 217, 253–277.
Udy, J.W., Dennison, W.C., Lee Long, W.J., McKenzie, L.J., 1999.Responses of seagrass to nutrients in the Great Barrier Reef,Australia. Mar. Ecol. Prog. Ser. 185, 257–271.
Uku, J., Björk, M., 2005. Productivity aspects of three tropical sea-grass species in areas of different nutrient levels in Kenya. Estuar.Coast. Shelf Sci. 63, 407–420.
Van Lent, F., Verchuure, J.M., van Veghel, L.J., 1995. Comparativestudy on populations of Zostera marina L. (eelgrass): in situnitrogen enrichment and light manipulation. J. Exp. Mar. Biol.Ecol. 185, 55–76.
Van Montfrans, J., Wetzel, R.G., Orth, R.J., 1984. Epiphyte–grazerrelationships in seagrass meadows: consequences for seagrassgrowth and production. Estuaries 7, 289–309.
Van Tussenbroek, B.I., 1995. Thalassia testudinum leaf dynamics in aMexican Caribbean coral reef lagoon. Mar. Biol. 122, 33–40.
Vermaat, J.E., Verhagen, F.C.A., 1996. Seasonal variation in theintertidal seagrass Zostera noltii Hornem.: coupling demographicand physiological patterns. Aquat. Bot. 52, 259–281.
Vermaat, J.E., Hootsmans, M.J.M., Nienhuis, P.H., 1987. Seasonaldynamics and leaf growth of Zostera noltii Hornem., a perennialintertidal seagrass. Aquat. Bot. 28, 287–299.
Walker, D.I., McComb, A.J., 1988. Seasonal variation in theproduction, biomass and nutrient status of Amphibolis antarctica(Labill.) Sonder ex Aschers. and Posidonia australis Hook.f. inShark Bay, Western Australia. Aquat. Bot. 31, 259–275.
Watanabe, M., Nakaoka, M., Mukai, H., 2005. Seasonal variation invegetative growth and production of the endemic Japaneseseagrass Zostera asiatica: a comparison with sympatric Zosteramarina. Bot. Mar. 48, 266–273.
Wear, D.J., Sullivan, M.J., Moore, A.D., Millie, D.F., 1999. Effects ofwater-column enrichment on the production dynamics of threeseagrass species and their epiphytic algae. Mar. Ecol. Prog. Ser.179, 201–213.
Weidemann, A.D., Bannister, T.T., 1986. Absorption and scat-tering coefficients in Irondequoit Bay. Limnol. Oceanogr. 31,567–583.
West, R.J., 1990. Depth-related structural and morphological varia-tions in an Australian Posidonia seagrass bed. Aquat. Bot. 36,153–166.
Wetzel, R.L., Penhale, P.A., 1983. Production ecology of seagrasscommunities in the lower Chesapeake Bay. Mar. Technol. Soc. J.17, 22–31.
Wiginton, J.R., McMillan, C., 1979. Chlorophyll composition undercontrolled light conditions as related to the distribution ofseagrasses in Texas and the U.S. Virgin Islands. Aquat. Bot. 6,171–184.
Williams, S.L., Ruckelshaus,M.H., 1993. Effects of nitrogen availabilityand herbivory on eelgrass (Zostera marina) and epiphytes. Ecology74, 904–918.
Ziegler, S., Benner, R., 1999. Nutrient cycling in the water column of asubtropical seagrass meadow. Mar. Ecol. Prog. Ser. 188, 51–62.
Zieman, J.C., 1975. Seasonal variation of turtle grass, Thalassiatestudinum König, with reference to temperature and salinityeffects. Aquat. Bot. 1, 107–123.
Zieman, J.C., Wetzel, R.G., 1980. Productivity in seagrasses: methodsand rates. In: Phillips, R.C., McRoy, C.P. (Eds.), Handbook ofSeagrass Biology: An Ecosystem Perspective. Garland STPMPress, New York, pp. 87–116.
Zimmerman, R.C., Smith, R.D., Alberte, R.S., 1987. Is growth ofeelgrass nitrogen limited? A numerical simulation of the effects oflight and nitrogen on the growth dynamics of Zostera marina. Mar.Ecol. Prog. Ser. 41, 167–176.

175K.-S. Lee et al. / Journal of Experimental Marine Biology and Ecology 350 (2007) 144–175
Zimmerman, R.C., Cabello-Pasini, A., Alberte, R.S., 1994. Modelingdaily production of aquatic macrophytes from irradiance measure-ments: a comparative analysis. Mar. Ecol. Prog. Ser. 114, 185–196.
Zimmerman, R.C., Reguzzoni, J.L., Alberte, R.S., 1995. Eelgrass(Zostera marina L.) transplants in San Francisco Bay: role of light
availability on metabolism, growth and survival. Aquat. Bot. 51,67–86.
Zimmerman, R.C., Kohrs, D.G., Steller, D.L., Alberte, R.S., 1997.Impacts of CO2 enrichment on productivity and light requirementsof eelgrass. Plant Physiol. 115, 599–607.