modeling the irradiance and temperature dependence of pv modules in pvsyst
DESCRIPTION
Presented at the IEEE Photovoltaic Specialists Conference in June 2014.TRANSCRIPT

Kenneth J. Sauer and Thomas Roessler
Yingli Solar
Clifford W. Hansen
Sandia National Laboratories
40th IEEE Photovoltaic Specialists Conference | June 8-13, 2014
Modeling the Irradiance and
Temperature Dependence of
PV Modules in PVsyst

2 2
Outline
• Basics
• Irradiance and Temperature Dependence in PVsyst
• Modeling Approaches
• Results
• Summary and Outlook

3 3
Basics: Main Components of PV Module Models
Electrical Parameters
at STC (I-V curve)
Irradiance Dependence
Temperature Dependence Incidence Angle Dependence
(see Poster 396-M20)
Module Model
…or physical modeling Provision via datasheet or
additional characterization
Additional characterization…
4 4
Basics: Irradiance and Temperature Dependence of
PV Modules
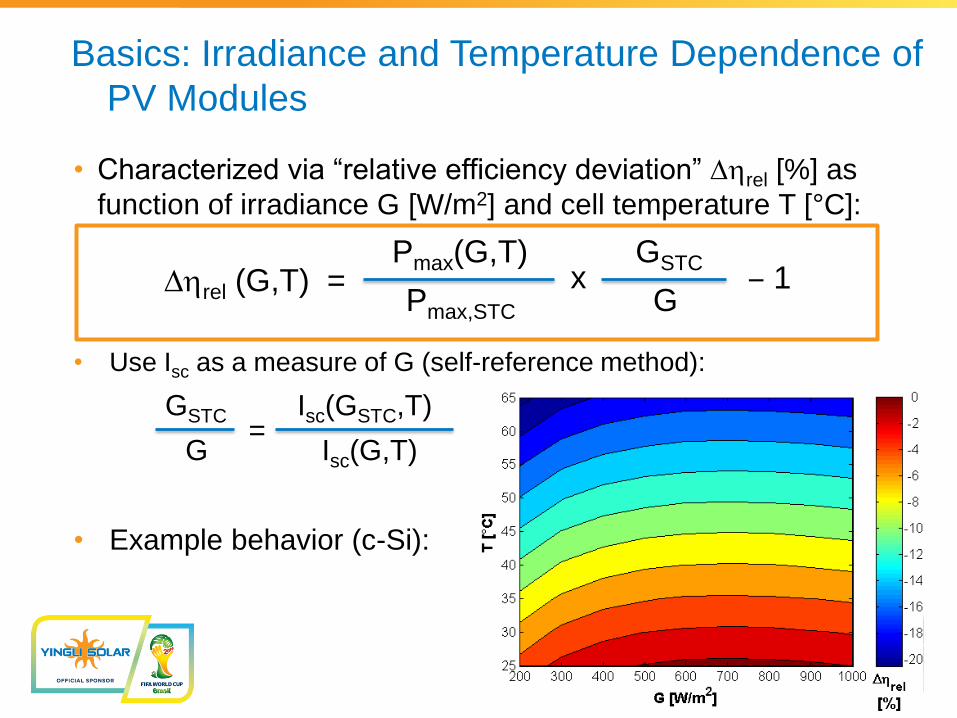
• Characterized via “relative efficiency deviation” ∆rel [%] as
function of irradiance G [W/m2] and cell temperature T [°C]:
Pmax(G,T) GSTC
Pmax,STC G
• Use Isc as a measure of G (self-reference method):
GSTC Isc(GSTC,T)
G Isc(G,T)
• Example behavior (c-Si):
∆rel (G,T) = x ‒ 1
=

5 5
Irradiance Dependence in PVsyst
Rsh,ref, Rs
Rsh,0, Rsh,exp

6 6
Temperature Dependence in PVsyst
“µPmpp,PVsyst”, µγ
γ(T) = γref + µγ·(T – TSTC)

7 7
Improved Model for Temperature Dependence:
“Then T" Approach
Measurement Data
Linear Fit to Measurement Data
PVsyst Standard Model (µPmpp,NP)(µPmpp,NP)
Pmax(Tmin)
Pmax,STC
Pmax(Tmax)
Tmin TSTC Tmax
Derivative
equal to
µPmpp,NP

8 8
Improved Model for Temperature Dependence:
“Then T" Approach
Measurement Data
Linear Fit to Measurement Data
PVsyst Standard Model (µPmpp,NP)
"Then T" Approach (Optimized µγ)
(µPmpp,NP)
µγ)
Pmax(Tmin)
Pmax,STC
Pmax(Tmax)
Tmin TSTC Tmax
Optimize uγ so that
µPmpp,slope ≈ µPmpp,NP

9 9
Overview of Modeling Approaches

10 10
-5%
-4%
-3%
-2%
-1%
0%
1%
200 300 400 500 600 700 800 900 1000
Δη
rel(G
, 2
5
C)
G [W/m2]
Measurement Data
PVsyst Standard Model
• (20) 310 W Yingli Solar mc-Si PV modules
• Yingli Americas PV Testing Lab (PVTL)
• Class AAA flash tester with temperature
control unit and insulated test chamber
• Pmax at STC
• 80 additional measurements at AM1.5G
– G = 200:100:1,000 W/m2 at each T
– T = 25:5:65 °C at each G
• Δηrel(200 W/m2, 25 °C)
– Nameplate / Measured Avg. = -3.3 %
– PVsyst Standard Model (V6) = -4.8 %
• µPmpp(1,000 W/m2, T)
– Nameplate / Measured Avg. = -0.429 %/°C
– PVsyst Standard Model (V6) = -0.442 %/°C
Example Data and PVsyst Standard Model

11 11
Results: Comparison of Modeling Approaches
Modeling
Approach
RMSD
[W]
MBE
[W]
Dev. from
µPmpp,NP [%]
Diff. from
Δηrel,LIC [%]
G-T Matrix 0.25 -0.18 0.78 -0.16
Only G Then T 0.40 -0.33 0.04 0.01
V6 Tool Then T 0.47 -0.39 0.52 0.12
Only G Input
µPmpp,NP 0.89 -0.73 2.68 0.01
V6 Tool Input
µPmpp,NP 0.97 -0.79 3.19 0.12
Standard
Model Then T 1.52 -1.39 0.27 -1.59
Standard
Model
Input
µPmpp,NP 1.92 -1.79 2.96 -1.59

12 12
-25%
-20%
-15%
-10%
-5%
0%
20
0
40
0
60
0
80
0
10
00
30
0
50
0
70
0
90
0
20
0
40
0
60
0
80
0
10
00
25 45 65
Δη
rel
G [W/m2] // T [ C]
Measurement Data PVsyst Standard Model
PVsyst "V6 Tool" Model "Only G - Then T" Model
"G-T Matrix" Model
Results: Visualization I

13 13
Results: Visualization II

14 14
Results: Impact on Energy Yield Forecasts
0.0%
0.2%
0.4%
0.6%
0.8%
1.0%
1.2%
1.4%
1.6%
1.8%
Antofagasta, Chile
Berlin, Germany
Phoenix, USA
Trivandrum, India
Gain
in
Fo
recaste
d A
nn
ual
En
erg
y Y
ield
over
PV
syst
Sta
nd
ard
Mo
del
PVsyst "V6 Tool" Model
"Only G - Then T" Model
"G-T Matrix" Model

15 15
Summary and Outlook
• Correct model for Pmax(G,T) more reliable energy forecast
• Introduced two new optimization approaches
1. “Only G - Then T” Model
– Exact fit of µPmpp,NP and Δηrel(LIC)
– Good fit of global Pmax(G,T)
2. “G-T Matrix” Model
– Improved global fit for Pmax(G,T)
– Slight deviation from µPmpp,NP and Δηrel(LIC)
• Both models clearly better than the PVsyst Standard Model
and still significantly better than the PVsyst “V6 Tool” Model
• Next up:
– Location-optimized models
– Optimized measurement data set for modeling c-Si

16
Thank You for Your Attention