effects of fertilization and density control on...
TRANSCRIPT

EFFECTS OF FERTILIZATION ANDDENSITY CONTROL ON GROWTH
AND YIELD OF YOUNGDOUGLAS-FIR PLANTATIONS:
RESULTS FROM SMC TYPE IINSTALLATIONS
YUZHEN LIERIC C. TURNBLOM
DAVID G. BRIGGS
COLLEGE OF FOREST RESOURCESUNIVERSITY OF WASHINGTON
BOX 352100SEATTLE WASHINGTON 98115-2100
HTTP://WWW.STANDMGT.ORG
STAND MANAGEMENT COOPERATIVESMC WORKING PAPER NUMBER 4
AUGUST 2005


EFFECTS OF FERTILIZATION ANDDENSITY CONTROL ON GROWTH
AND YIELD OF YOUNG DOUGLAS-FIRPLANTATIONS:
RESULTS FROM SMC TYPE IINSTALLATIONS
YUZHEN LI, MS.ERIC C. TURNBLOM, ASSOCIATE PROFESSOR, AND SILVICULTURE
PROJECT LEADERDAVID G. BRIGGS, PROFESSOR, AND SMC DIRECTOR
STAND MANAGEMENT COOPERATIVESMC WORKING PAPER NUMBER 4
AUGUST 2005
COLLEGE OF FOREST RESOURCESUNIVERSITY OF WASHINGTON
BOX 352100SEATTLE WASHINGTON 98115-2100
HTTP://WWW.STANDMGT.ORG

II
III
TABLE OF CONTENTS
ACKNOWLEDGEMENTS ..........................................................................................VII
ABSTRACT .....................................................................................................................IX
CHAPTER 1. INTRODUCTION ..................................................................................1
CHAPTER 2. OBJECTIVES ...........................................................................................3
CHAPTER 3. METHODOLOGY ..................................................................................5
3.1 EXPERIMENTAL SITES .................................................................................................. 5
3.2 TREATMENT REGIMES .................................................................................................. 5
3.3 MEASUREMENTS ......................................................................................................... 8
3.4 ESTIMATION OF SITE INDEX ......................................................................................... 9
3.5 DATA ANALYSIS ......................................................................................................... 9
CHAPTER 4. RESULTS ...............................................................................................11
4.1 INITIAL CONDITIONS ................................................................................................. 11
4.2 WHOLE STAND GROWTH ANALYSIS RESULTS ............................................................ 11
4.2.1 Periodic Annual Diameter Increment ........................................................ 11
4.2.2 Periodic Annual Basal Area Increment ..................................................... 13
4.2.3 Periodic Annual Dominant Height Increment ......................................... 13
4.2.4 Periodic Annual Volume Increment .......................................................... 17
4.3 WHOLE STAND YIELD ANALYSIS RESULTS ................................................................ 17
4.3.1 Quadratic Mean Diameter ........................................................................... 17
4.3.2 Diameter Distribution .................................................................................. 19
4.3.3 Basal Area Per Acre ...................................................................................... 19
4.3.4 Dominant Height .......................................................................................... 23
4.3.5 Volume Per Acre .......................................................................................... 23
4.4 WHOLE STAND MORTALITY ANALYSIS RESULTS ....................................................... 27


V
4.5 CROP TREE GROWTH AND YIELD ANALYSIS RESULTS ................................................ 27
4.5.1 Quadratic Mean Diameter ........................................................................... 29
4.5.2 Basal Area Per Acre ...................................................................................... 30
4.5.3 Cubic Foot Volume ...................................................................................... 31
CHAPTER 5. DISCUSSION ......................................................................................33
5.1 WHOLE STAND ......................................................................................................... 33
5.1.1 Density Effect ................................................................................................ 33
5.1.2 Fertilization Effect ........................................................................................ 35
5.1.3 Fertilization Effect Within Different Density Treatments ....................... 36
5.2 CROP TREE ............................................................................................................... 37
CHAPTER 6. CONCLUSIONS ...................................................................................41
REFERENCES ................................................................................................................43

VI

VII
ACKNOWLEDGMENTS
This project is part of Yuzhen Li’s Master of Science thesis recently finished at theUniversity of Washington. It was supported by the USFS Focused Science Delivery Programand the Stand Management Cooperative. The authors wish to thank SMC members for con-tributing their data and support. Randy Collier, SMC database manager, provided assis-tance in database searching and analyses.


IX
ABSTRACT
The objective of this study was to assess fertilization and density (early spacing andsubsequent thinning) effects on young Douglas-fir (Pseudotsuga menziesii (Mirb.) Franco) plan-tations in the Pacific Northwest. Seven different treatment regimes were studied in sixty-three plots from nine locations across western Washington and Oregon. For fertilization treat-ment, 200lb N/acre urea was applied at stand establishment and every fourth year thereaf-ter. For density control, four different regimes were used: initial density with no furtherthinning, initial density with repeated thinning later; spacing to half initial density with mini-mal thinning later and spacing to one-fourth initial density with no further thinning. Plotswere established when mean stand age was 9 years. Measurements at establishment andafter three, 4-year growth periods, corresponding to mean stand age of 13, 17, and 21 years,formed the basis of growth and yield analyses conducted at the whole stand and crop tree(the 40 largest diameter trees per acre) levels.
Results showed that density control significantly affects diameter, basal area and vol-ume growth and yield, but not height. Initially, the densest stands had the greatest overallyield and growth. However, accumulation in the dense stands was declining with time andthe less dense stands caught or exceeded them by the end of twelve years. Density alsoaffected diameter class distribution with less dense stands having a greater proportion oftrees in larger diameter classes. Across all densities, fertilization produced additional growthand yield in terms of diameter, basal area and volume, but not in height. Quadratic MeanDiameter (QMD), basal area and volume growth were significantly increased by the first andsecond urea applications, but not by the third. In contrast, the first fertilization was insuffi-cient to produce a significant yield increase in QMD, basal area per acre or volume per acre.Significant increases in these variables were found following the second and the third ureaapplications. This study found no statistically significant interaction between fertilizationand density control treatments on all variables tested, but fertilization gains in different den-sity stands did show a little difference. Fertilization gains in basal area and volume growthhad a decreasing trend in the dense stands, whereas in the less dense stands, they increasedfirst then slightly decreased. Mortality increased quickly in the dense stands whereas it re-mained stable in the less dense stands. Also, mortality in fertilized plots was less than inunfertilized plots and relatively more stable. Both fertilization and spacing produced largercrop tree growth and yield. Compared to the whole stand, crop tree responses were smallerin magnitude and expressed later in time.
.

II
1
CHAPTER 1. INTRODUCTION
For decades, the timber industry in the Pacific Northwest depended on the large vol-ume of natural old-growth Douglas-fir (Pseudotsuga menziesii (Mirb.) Franco) present whensettlement began. However, as the supply of old-growth Douglas-fir was harvested and publicdemand for wildlife habitat protection and other non-wood resources increased, this harvestof commercial timber from natural old-growth stands was significantly reduced. At the sametime, the demand for forest products continues to grow as population growth increases.These changes have caused the timber industry in the Pacific Northwest to change from old-growth Douglas-fir forests to actively managed second-growth forests and intensively man-aged plantations.
Density control and fertilization are two commonly used silvicultural managementpractices. They both provide increased levels of nutrients, moisture and sunlight to a re-sidual stand. By mitigating factors that may constrain tree growth, both allow the residualstand to develop larger trees sooner. The effects of fertilization and density on Douglas-firforests have been studied in the past few decades across the Pacific Northwest. General re-sults from previous research are summarized below (for a complete literature review, see Li,2005):
Density: Douglas-fir diameter growth is very sensitive to stand density with diameter growthincreasing with increased spacing up to the point at which trees grow without competition(Sjolte-Jorgensen 1967, King 1986, Curtis and Marshall 2002). Besides the mean diameter,spacing also affects diameter distribution by increasing the proportion of larger trees (King1986, Curtis and Marshall 2002). For height growth, density effects reported in the literatureare mixed. Both decreased (Crown et al 1977, Miller and Reukema 1977) and increased (Curtisand Reukema 1970, Smith and Reukema 1986) height growth following thinning have beenpreviously reported. Others found that height growth is insensitive to density change(Hagglund 1981, Miller et al 2001). As for density effects on basal area and volume, the mostcommon results are: immediately after a thinning, basal area and volume growth will bereduced, but the differences between the thinned and unthinned stands will decrease andthe thinned stands may eventually exceed unthinned stands (Staebler 1956, Harringtion andReukema 1983, Curtis and Marshall 2002). In general, past studies demonstrated that com-mercial thinning in previously unthinned natural stands resulted in moderate increases indiameter increment and some reduction in basal area and gross volume increment, accom-panied by a reduction in mortality which may result in modest gains in net volume growth(Reukema 1972, Reukema and Bruce 1977).
Fertilization: Forest growth in the Pacific Northwest is limited by the supply of plant avail-able nitrogen (Gessel et al 1965, Chappell et al 1992). Since the 1960s, several comprehensiveforest nutrition research projects were carried out at the region level: Regional Forest Nutri-tion Research Project (RFNRP) in western Washington and Oregon, the British ColumbiaMinistry of Forests Experimental Project 703 (EP703) and the Shawnigan Lake Ecosystemstudy. Results from these studies found that 1) coastal Douglas-fir stands responded posi-tively to nitrogen fertilization; 2) the largest and most long-lasting responses occur when

2
nutrient deficiencies were severe and when fertilization was combined with thinning (Chappellet al 1992, Brix 1993); and 3) mortality was accelerated by fertilization in unthinned stands,but not in thinned stands (Miller et al 1986); 4) fertilization response lasted about 6 to 8 years,and refertilization could be applied after 7-10 years (Chappell et al 1992). However, thesegenerally positive responses found in RFNRP and BC trials are not always the case. Accord-ing to Peterson and others (1986), about 30% of unthinned and 20% thinned coast Douglas-firstands did not respond to N fertilization. Fertilizer trials in the Oregon coast range indicatedsmall and statistically nonsignificant response to nitrogen fertilizers (Miller et al 1991, Milleret al 1999).
Interaction between fertilization and density: By increasing tree growth, fertilization canalso increase competition in high density stands and thus accelerate mortality losses in smallerthan average trees. However, results on interaction effects were not consistent in the litera-ture. Both significant (Lee and Barclay 1985, Stegemoeller and Chappell 1991, Brix 1993) andinsignificant (Heilman 1975, McWilliams and Therien 1996, Miller et al 2001) interactionshave been reported.
Although previous studies generated a large amount of valuable information; they raisedmany new questions and, as operational forest management changed over time, the relevanceof earlier studies was questioned. For example, most past studies were initiated in the 1960sor 1970s, when 365 stems per acre was considered to be low stocking, but now a stockingwith one half this number is common in coastal Douglas-fir where no commercial thinning isplanned (Brix 1993). Wide spacing as practiced today was not fully represented in the earlystudies. Also fertilization regimes began shifting from single to repeated applications, somore information is needed to understand the effect of combining fertilization with thinning;the effect of fertilization on long-term site productivity and wood quality. Furthermore, mostprevious studies were conducted in second-growth stands that originated from natural seedingor planting and which received little subsequent management. Research with more inten-sively managed young Douglas-fir plantations was fragmentary and limited in scope. Sincethe 1960’s, Douglas-fir plantations have expanded remarkably across the region and willrapidly replace second-growth stands as the main commercial timber resource of the PacificNorthwest. Unlike old- and second-growth stands, intensively managed plantations requirelarge investments for establishment and subsequent culture. Because most of them are stillyoung, little is known about their response, especially long-term response to silviculturaltreatment. Since plantations will be intensively managed to maturity, research results fromunmanaged second-growth stands may not apply to young plantations.
3
CHAPTER 2. OBJECTIVES
The general objective of this study is to assess fertilization and density effects on growthand yield of young Douglas-fir plantations in the Pacific Northwest. In detail, this studyattempts to answer the following five research questions.
1. Do different density control regimes significantly affect stand growth and yield interms of diameter, basal area, height and cubic foot volume?
2. Do repeated urea applications produce significant increases in stand growth andyield in terms of diameter, basal area, height and cubic foot volume?
3. Do significant interactions exist between fertilization and density treatments?
4. Do density and fertilization treatments affect stand mortality?
5. Does the crop tree stand component (the 40 largest diameter trees per acre) have thesame response pattern as the whole stand?

4
5
CHAPTER 3. METHODOLOGY
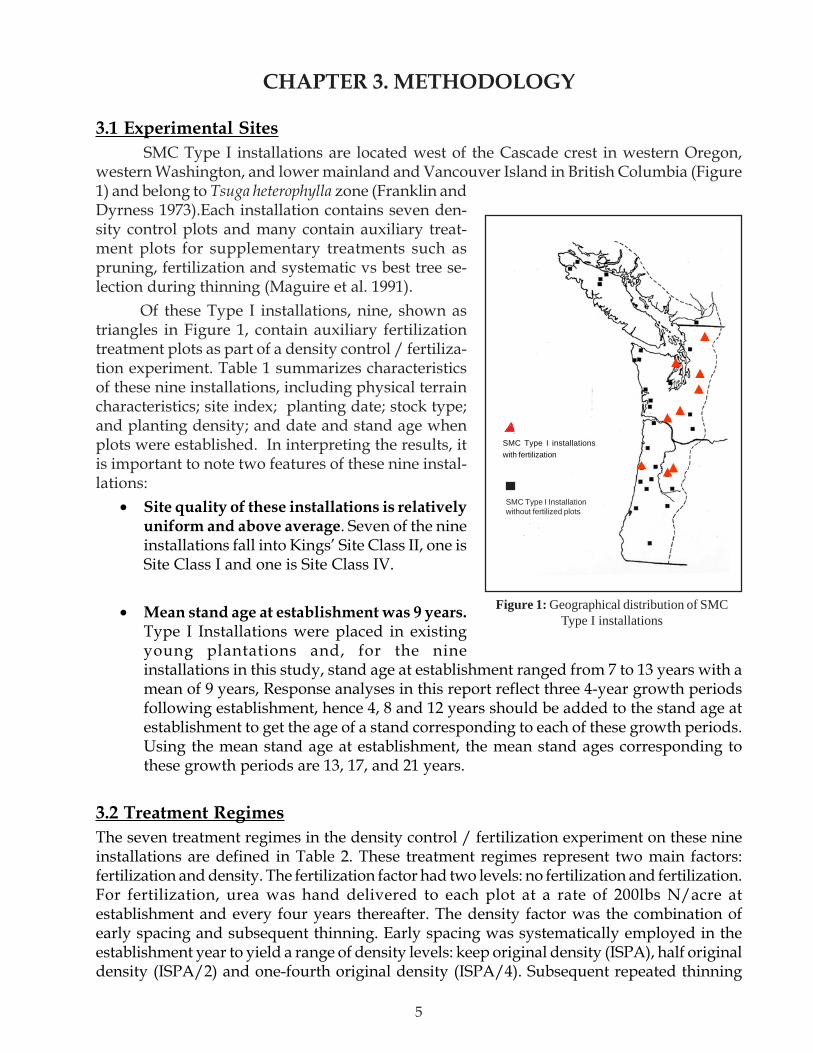
3.1 Experimental SitesSMC Type I installations are located west of the Cascade crest in western Oregon,
western Washington, and lower mainland and Vancouver Island in British Columbia (Figure1) and belong to Tsuga heterophylla zone (Franklin andDyrness 1973).Each installation contains seven den-sity control plots and many contain auxiliary treat-ment plots for supplementary treatments such aspruning, fertilization and systematic vs best tree se-lection during thinning (Maguire et al. 1991).
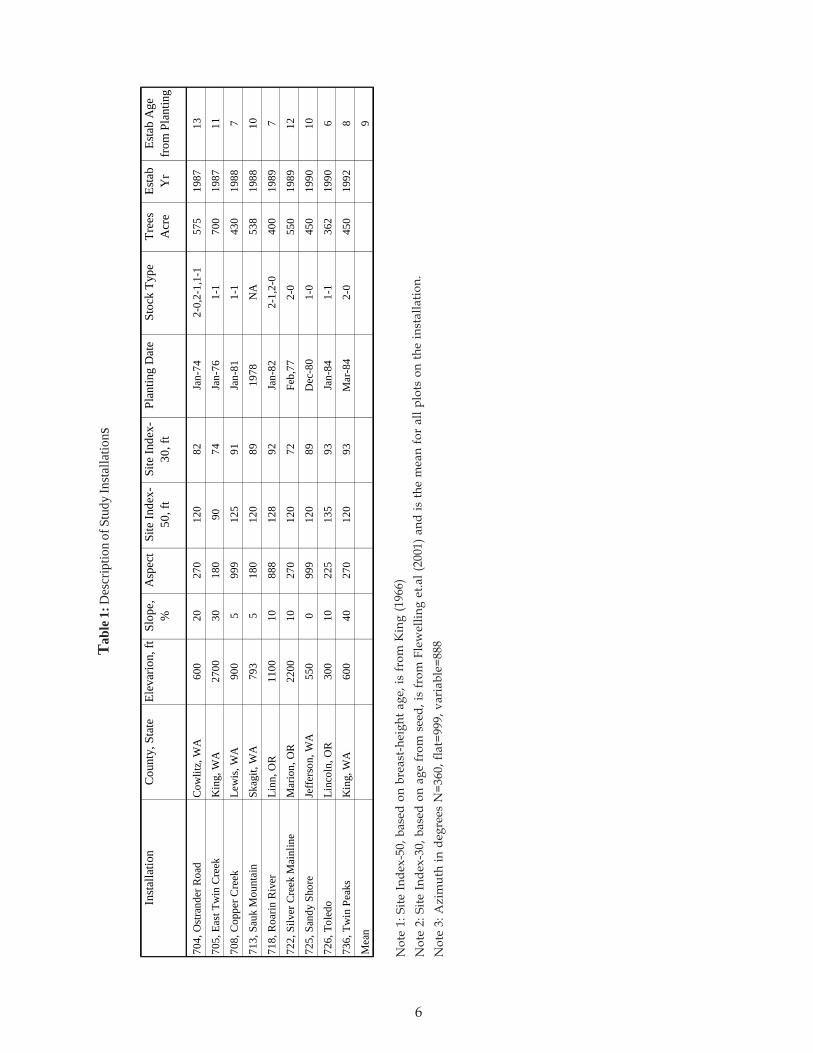
Of these Type I installations, nine, shown astriangles in Figure 1, contain auxiliary fertilizationtreatment plots as part of a density control / fertiliza-tion experiment. Table 1 summarizes characteristicsof these nine installations, including physical terraincharacteristics; site index; planting date; stock type;and planting density; and date and stand age whenplots were established. In interpreting the results, itis important to note two features of these nine instal-lations:
• Site quality of these installations is relativelyuniform and above average. Seven of the nineinstallations fall into Kings’ Site Class II, one isSite Class I and one is Site Class IV.
• Mean stand age at establishment was 9 years.Type I Installations were placed in existingyoung plantations and, for the nineinstallations in this study, stand age at establishment ranged from 7 to 13 years with amean of 9 years, Response analyses in this report reflect three 4-year growth periodsfollowing establishment, hence 4, 8 and 12 years should be added to the stand age atestablishment to get the age of a stand corresponding to each of these growth periods.Using the mean stand age at establishment, the mean stand ages corresponding tothese growth periods are 13, 17, and 21 years.
3.2 Treatment RegimesThe seven treatment regimes in the density control / fertilization experiment on these nineinstallations are defined in Table 2. These treatment regimes represent two main factors:fertilization and density. The fertilization factor had two levels: no fertilization and fertilization.For fertilization, urea was hand delivered to each plot at a rate of 200lbs N/acre atestablishment and every four years thereafter. The density factor was the combination ofearly spacing and subsequent thinning. Early spacing was systematically employed in theestablishment year to yield a range of density levels: keep original density (ISPA), half originaldensity (ISPA/2) and one-fourth original density (ISPA/4). Subsequent repeated thinning
SMC Type I installationswith fertilization
SMC Type I Installationwithout fertilized plots
Figure 1: Geographical distribution of SMCType I installations
6
Tab
le 1
: Des
crip
tion
of S
tudy
Inst
alla
tions
Not
e 1:
Site
Inde
x-50
, bas
ed o
n br
east
-hei
ght a
ge, i
s fr
om K
ing
(196
6)
Not
e 2:
Site
Inde
x-30
, bas
ed o
n ag
e fr
om s
eed,
is fr
om F
lew
ellin
g et
.al (
2001
) and
is th
e m
ean
for
all p
lots
on
the
inst
alla
tion.
Not
e 3:
Azi
mut
h in
deg
rees
N=3
60, f
lat=
999,
var
iabl
e=88
8
Insta
llatio
nC
ount
y, S
tate
Elev
ario
n, ft
Slop
e,
%A
spec
tSi
te In
dex-
50, f
tSi
te In
dex-
30, f
tPl
antin
g D
ate
Stoc
k Ty
peTr
ees
A
cre
Esta
b Y
rEs
tab
Age
fr
om P
lant
ing
704,
Ost
rand
er R
oad
Cow
litz,
WA
600
2027
012
082
Jan-
742-
0,2-
1,1-
157
519
8713
705,
Eas
t Tw
in C
reek
Kin
g, W
A27
0030
180
9074
Jan-
761-
170
019
8711
708,
Cop
per C
reek
Lew
is, W
A90
05
999
125
91Ja
n-81
1-1
430
1988
7
713,
Sau
k M
ount
ain
Skag
it, W
A79
35
180
120
8919
78N
A53
819
8810
718,
Roa
rin R
iver
Linn
, OR
1100
1088
812
892
Jan-
822-
1,2-
040
019
897
722,
Silv
er C
reek
Mai
nlin
eM
ario
n, O
R22
0010
270
120
72Fe
b,77
2-0
550
1989
12
725,
San
dy S
hore
Jeffe
rson
, WA
550
099
912
089
Dec
-80
1-0
450
1990
10
726,
Tol
edo
Linc
oln,
OR
300
1022
513
593
Jan-
841-
136
219
906
736,
Tw
in P
eaks
Kin
g, W
A60
040
270
120
93M
ar-8
42-
045
019
928
Mea
n9

7
was conducted in a subset of ISPA plots and minimal thinning was conducted in ISPA/2plots. So the density factor had four levels: ISPA_NoThin, ISPA_RepThin, ISPA/2_MinThinand ISPA/4_NoThin. With the exception of the ISPA with no further treatments (treatment 1in Table 2), other density levels had both a fertilized and unfertilized plot, producing theother six treatment regimes as shown in Table 2. Within each installation, treatment regimeswere randomly assigned to plots. Since the objective of SMC installations is to provide datafor regional responses rather than site-specific assessments, there is no replications within aninstallation. Instead, treatment regimes are replicated across installations in the region. Therewere nine installations for each treatment regime, hence totally sixty-three plots are availablefor analysis (Table 3).
Among these sixty-three plots, fifty-six plots have the first four measurements data availablefor analysis, i.e. establishment year, 4th, 8th and 12th year, and the other seven plots only havethree measurements data available, i.e. establishment year, 4th and 8th year. So there are 63sample plots during growth periods 1 and 2, and 56 sample plots during growth period 3.
Table 2: Treatment regimes common to nine SMC Type I Douglas-fir installations
Table 3: Number of sample plots for each treatment regime
Number Name Description
1 ISPA_NoThinNoFert Plots remained at their Initial Stems Per Acre (ISPA) with no further thinning and no fertilization
2 ISPA_RepThinNoFert Plots remained at their initial density (ISPA), but were repeatedly thinned later. No fertilization.
3 ISPA_RepThinFert Plots remained at their initial density (ISPA), but were repeatedly thinned* later. Urea was applied at establishment and every four years later.
4 ISPA/2_MinThinNoFert Plots were spaced to half their initial density (ISPA/2) with minimal thinning† later. No Fertilization.
5 ISPA/2_MinThinFert Plots were spaced to half their initial density (ISPA/2) with minimal thinning later. Urea was applied at establishment and every four years later.
6 ISPA/4_NoThinNoFert Plots were spaced to one-fourth of their initial density (ISPA/4) with no further thinning. No fertilization.
7 ISPA/4_NoThinFert Plots were spaced to one-fourth of their initial density (ISPA/4) with no further thinning. Urea was applied at establishment and every four years later.
*Repeated thinning: first thin when RD = 55 and thin to RD = 35, next when RD = 55 again thin to RD = 40,subsequently whenever RD =60, thin to RD = 40.† Minimal thinning: When RD = 55, thin to RD = 35. No further thinning.
ISP A _N oT hin ISP A _R epT hin ISP A /2_M inT hin ISP A /4_N oT hin
N o Fertilization 9 9 9 9 Fertilization - 9 9 9
8
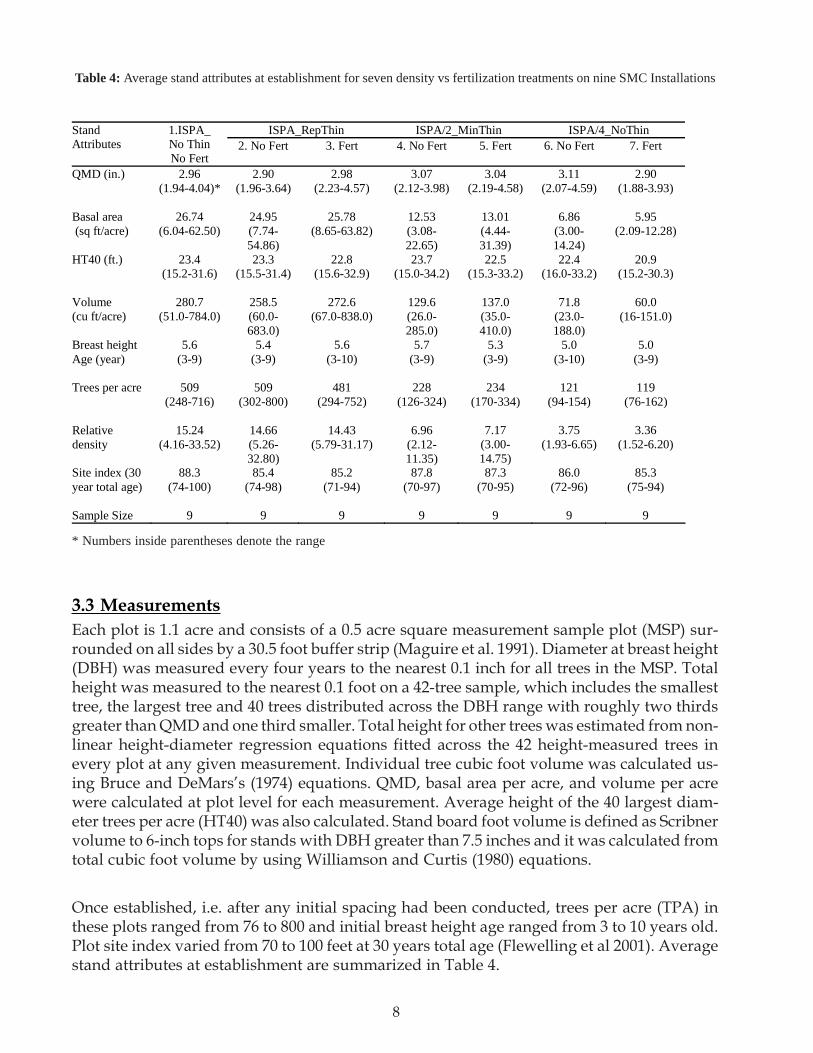
Table 4: Average stand attributes at establishment for seven density vs fertilization treatments on nine SMC Installations
* Numbers inside parentheses denote the range
3.3 MeasurementsEach plot is 1.1 acre and consists of a 0.5 acre square measurement sample plot (MSP) sur-rounded on all sides by a 30.5 foot buffer strip (Maguire et al. 1991). Diameter at breast height(DBH) was measured every four years to the nearest 0.1 inch for all trees in the MSP. Totalheight was measured to the nearest 0.1 foot on a 42-tree sample, which includes the smallesttree, the largest tree and 40 trees distributed across the DBH range with roughly two thirdsgreater than QMD and one third smaller. Total height for other trees was estimated from non-linear height-diameter regression equations fitted across the 42 height-measured trees inevery plot at any given measurement. Individual tree cubic foot volume was calculated us-ing Bruce and DeMars’s (1974) equations. QMD, basal area per acre, and volume per acrewere calculated at plot level for each measurement. Average height of the 40 largest diam-eter trees per acre (HT40) was also calculated. Stand board foot volume is defined as Scribnervolume to 6-inch tops for stands with DBH greater than 7.5 inches and it was calculated fromtotal cubic foot volume by using Williamson and Curtis (1980) equations.
Once established, i.e. after any initial spacing had been conducted, trees per acre (TPA) inthese plots ranged from 76 to 800 and initial breast height age ranged from 3 to 10 years old.Plot site index varied from 70 to 100 feet at 30 years total age (Flewelling et al 2001). Averagestand attributes at establishment are summarized in Table 4.
ISPA_RepThin ISPA/2_MinThin ISPA/4_NoThin Stand Attributes
1.ISPA_ No Thin No Fert
2. No Fert 3. Fert 4. No Fert 5. Fert 6. No Fert 7. Fert
QMD (in.) 2.96 (1.94-4.04)*
2.90 (1.96-3.64)
2.98 (2.23-4.57)
3.07 (2.12-3.98)
3.04 (2.19-4.58)
3.11 (2.07-4.59)
2.90 (1.88-3.93)
Basal area (sq ft/acre)
26.74 (6.04-62.50)
24.95 (7.74-54.86)
25.78 (8.65-63.82)
12.53 (3.08-22.65)
13.01 (4.44-31.39)
6.86 (3.00-14.24)
5.95 (2.09-12.28)
HT40 (ft.) 23.4 (15.2-31.6)
23.3 (15.5-31.4)
22.8 (15.6-32.9)
23.7 (15.0-34.2)
22.5 (15.3-33.2)
22.4 (16.0-33.2)
20.9 (15.2-30.3)
Volume (cu ft/acre)
280.7 (51.0-784.0)
258.5 (60.0-683.0)
272.6 (67.0-838.0)
129.6 (26.0-285.0)
137.0 (35.0-410.0)
71.8 (23.0-188.0)
60.0 (16-151.0)
Breast height Age (year)
5.6 (3-9)
5.4 (3-9)
5.6 (3-10)
5.7 (3-9)
5.3 (3-9)
5.0 (3-10)
5.0 (3-9)
Trees per acre 509 (248-716)
509 (302-800)
481 (294-752)
228 (126-324)
234 (170-334)
121 (94-154)
119 (76-162)
Relative density
15.24 (4.16-33.52)
14.66 (5.26-32.80)
14.43 (5.79-31.17)
6.96 (2.12-11.35)
7.17 (3.00-14.75)
3.75 (1.93-6.65)
3.36 (1.52-6.20)
Site index (30 year total age)
88.3 (74-100)
85.4 (74-98)
85.2 (71-94)
87.8 (70-97)
87.3 (70-95)
86.0 (72-96)
85.3 (75-94)
Sample Size 9 9 9 9 9 9 9

9
3.4 Estimation of Site IndexTwo kinds of site index are available in the SMC database: installation site index and plotsite index. Installation site index is based on King’s (1966) site index curve, (Tabel 1) which isthe dominant height at breast height age 50. A concern with installation site index is that itwas provided by landowners and could be based on various sources such as soil properties,site index of the adjacent stand, or site index of the preceding stand. There are concerns overthe accuracy of these diverse estimates as well as concerns that they may not accurately re-flect the productivity of the current stand on the site. In response to these concerns, the SMCdeveloped a new site index, which is the mean height of the largest 40 trees per acre bydiameter at total age 30 (Flewelling 2001). This site index has been calculated for each plotbased on the current stand; mean values by installation are shown in Table 1 and mean val-ues by treatment are shown in Table 4.
3.5 Data AnalysisFor each plot, average net periodic annual increments (PAI) of QMD, basal area, dominantheight (HT40) and cubic foot volume were calculated for every four-year growth period afterestablishment. Growth analysis was then conducted on these variables in terms of three four-year growth periods, i.e. the first growth period (0-4 year), the second growth period (4-8year) and the third growth period (8-12 year). Average breast height age during these threegrowth periods is 6-10, 10-14 and 14-18 respectively. Because urea was applied to fertilizedplots at the start of each growth period, growth response to fertilizer reflects response to200lb N/acre in the first growth period, 400lb N/acre in the second growth period and 600lbN/acre in the third growth period. Yield analysis was conducted on net yield of QMD, basalarea, dominant height and cubic foot volume at establishment, the 4th, 8th and 12th year, whichrespectively correspond to mean breast height age 6, 10, 14 and 18. Yield response reflectsresponse to 0lb N/acre at establishment, 200lb N/acre in the 4th year, 400lb N/acre in the 8th
year and 600lb N/acre in the 12th year. Besides the whole stand, growth and yield analysesfor the forty largest diameter trees per acre (crop tree) were also performed.
Data were analyzed as an augmented two-factor fixed-effect model with initial trees per acre(before spacing), breast height age (BHAge) and plot site index (PlotSI) as covariates. PlotSIhere is site index at total age 30. The main effects of fertilization and density, their interaction,along with covariance effects, were tested by using analysis of covariance (ANCOVA) in SASat 0.05 significance level. ANCOVA was used in an attempt to reduce or account for measur-able extraneous factors that contribute to variability in the dependent variables. The initialgeneral linear model has the following form:
Dependent variable = f (fertilization, density, fertilization * density, TPA, BHAge, PlotSI)Where:Dependent variables are
QMD, basal area per acre, dominant height and cubic foot volume per acre atestablishment, the 4th, 8th and 12th yearPAI of these stand variables during the 1st, 2nd and 3rd growth periods

10
Independent variables areFertilization: represents the effect of fertilizer, two levels;Density: represents the effect of density regime, four levels;Fertilization * Density: represents the interaction effect;TPA: represents the initial (before spacing) trees per acre;BHAge: represents the breast height age (in years) andPlotSI: represents the site index at total age 30.
Based on ANCOVA results, non-significant effects were deleted from the initial models. Thenmodified models were fitted to data again. Specific comparisons between treatment regimeswere conducted by using the modified ANCOVA model with the mean squared error as thepooled variances.

11
CHAPTER 4. RESULTS
This section briefly presents results of whole stand growth and yield, whole standmortality and crop tree growth and yield. For the complete results and additional findings,please see Li (2005). Keep in mind that since installations are across the region, these resultsonly represent regional-level trends and are less suited for site specific assessment.
Three points should be noted in interpreting the results presented in this Chapter.First, the site index of the nine installations is relatively high and uniform. Using King’s 50year site index, seven belong to site class II, one is site class I, and one is site class IV. Second,as stated previously, response to fertilizer at the end of any growth period is the response tocumulative application of 200 lb/acre of fertilizer at establishment and every subsequent 4th
year. Third, keeping in mind that the mean stand age at study establishment and after 4-yeargrowth period for these installations are 9, 13, 17, and 21 years respectively.
4.1 Initial ConditionsAs shown in Table 4, there were no significant differences in quadratic mean diameter (QMD),height, breast height age and site index at establishment among the seven treatment regimes.Basal area (BA), volume, trees per acre and relative density did show differences as wouldbe expected due to the spacing treatments imposed in the establishment year, and their ra-tios were about 4:2:1 between ISPA, ISPA/2 and ISPA/4. Within each density level, BA, vol-ume, TPA and relative density were statistically the same between fertilized and unfertil-ized treatments.
4.2 Whole Stand Growth Analysis Results
4.2.1 Periodic Annual Diameter IncrementFigure 2 shows average periodic annual QMD increment during the first three growth peri-ods for the seven treatment regimes, pooled density treatments and pooled fertilization treat-ments. From Figure 2, it’s clear that ISPA/4 with fertilization had the greatest periodic an-nual QMD increment for all three growth periods while no treatment (ISPA_NoThinNoFert)had the least. Density showed a greater effect than did fertilization since the distance be-tween different density levels is larger than the distance between fertilization and no fertili-zation. Within each density level, QMD annual growth in fertilized plots was greater than inunfertilized counterparts. However, these QMD growth gains were not all statistically sig-nificant. Specific comparison tests between fertilized and unfertilized plots within each den-sity indicated that during the 1st growth period, QMD PAI fertilization gains were significantin ISPA_RepThin and ISPA/2_MinThin, but not in ISPA/4_NoThin. During the 2nd growthperiod, these gains were significant only in ISPA/4_NoThin. During the 3rd growth period,none of these gains were statistically significant.
Pooling the plots of the same density treatment together produces Figure 2b. From Figure2b, density affected periodic annual QMD increment greatly with denser stands exhibitingless QMD growth rate. During the first three growth periods, ISPA/4 had the largest QMDgrowth rate, ISPA/2 was in the middle, and ISPA exhibited the least QMD growth rate with

12
Figure 2: Quadratic mean diameter annual increment trends over the course of the study
a. Seven treatment regimes
0
0.1
0.2
0.3
0.4
0.5
0.6
0.7
0.8
0.9
0~4 (200) 4~8 (400) 8~12 (600)Growth Period (cumulative lb of fertilizer)
QM
D a
nnua
l gro
wth
(inch
/yea
r)
1. ISPA_NoThinNoFert
2. ISPA_RepThinNoFert
3. ISPA_RepThinFert
4. ISPA/2_MinThinNoFert
5. ISPA/2_MinThinFert
6. ISPA/4_NoThinNoFert
7. ISPA/4_NoThinFert
b. Different densities
0.00
0.10
0.20
0.30
0.40
0.50
0.60
0.70
0.80
0.90
0~4 (200) 4~8 (400) 8~12 (600)Grow th Period (Cumulative lb of fertilizer)
QM
D a
nnua
l gro
wth
(Inch
/yea
r)
ISPA_NoThin (Treatment 1)
ISPA_RepThin (Pooled datafrom treatment 2 and 3)
ISPA/2_MinThin (Pooled datafrom treatment 4 and 5)
ISPA/4_NoThin (Pooled datafrom treatment 6 and 7)
c. Fertilization vs No fertilization
0.00
0.10
0.20
0.30
0.40
0.50
0.60
0.70
0.80
0~4 (200) 4~8 (400) 8~12 (600)Growth Period (Cumulative lb of fertilizer)
QM
D a
nnua
l gro
wth
(Inch
/yea
r) No Fertilization (Pooled datafrom treatment 1, 2, 4 and 6)
Fertilization (Pooled datafrom treatment 3, 5 and 7)
13
ISPA_NoThin not different from ISPA_RepThin. During the 1st growth period, the differencebetween ISPA/2 and ISPA/4 was not significant, but their differences increased over timeand ISPA/4 became significantly greater than ISPA/2 in the 2nd and 3rd growth periods. Pooling the plots with the same fertilization treatment together produces Figure 2c. Acrossall densities, fertilization increased QMD annual increment by 0.08, 0.05 and 0.04 inch/yearrespectively in the 1st, 2nd and 3rd growth periods, and these represented 12.7%, 9.6% and10.0% growth gain in diameter. Statistical testing indicated that these gains were significantduring the 1st (p=0.0010) and 2nd (p=0.0183) growth periods, but not significant during the 3rd
growth period (p=0.0807).
4.2.2 Periodic Annual Basal Area IncrementLike QMD, basal area growth response was more strongly affected by density treatmentsthan by fertilization treatment, especially in the first two growth periods (Figure 3a). But thebasal area response patterns to density treatment are different than found for QMD. For basalarea, denser ISPA plots exhibited greater growth rate than less dense ISPA/2 and ISPA/4plots due to the larger number of trees per acre (Figure 3a, 3b). However, from period 2 to 3,BA growth rate in ISPA dropped sharply and fell below ISPA/2. In contrast, BA growth ratein ISPA/2 and ISPA/4 continued to increase at a more modest rate. Within each densitylevel, fertilized plots generally exhibited greater basal area growth rate than their unfertil-ized counterparts. Significant fertilization gains were found in the 1st growth period for ISPA/4 and again in the 2nd growth period for all three densities. But these gains became insignifi-cant during the 3rd growth period and even disappeared in ISPA_RepThin regime. Across allseven treatment regimes, the difference in basal area annual growth became smaller overtime.
Pooling the same density plots together, BA growth rate during the 3rd growth period wasstatistically the same among these four density levels, implying that ISPA/2 and ISPA/4 areaccumulating basal area at about the same rate as ISPA (Figure 3b).
Figure 3c shows basal area growth over the pooled fertilization treatments. Compared to theunfertilized counterpart, fertilization increased basal area growth by 1.3, 1.5 and 0.6 sqft/acre/year respectively in the 1st, 2nd and 3rd growth periods and these increases were signifi-cant for the first two growth periods (p=0.0097, 0.0003), but not for the third growth period(p=0.1477).
4.2.3 Periodic Annual Dominant Height IncrementFigure 4 shows periodic dominant height growth rate during the first three growth periods.A slight reduction in height growth after spacing was observed for the growth periods 1 and2 as shown in Figure 4a and Figure 4b, in which both ISPA/2 and ISPA/4 had less dominantheight growth than ISPAs. However, ISPA/2 caught ISPA during the 3rd growth period andboth had the same dominant height annual growth. The reduction was recovered in ISPA/2plots. But ISPA/4 was still below ISPA and ISPA/2. ANCOVA testing indicated that thesereductions were not statistically significant. Within each density level, trees in fertilized plotshad a slightly greater dominant height growth rate than in unfertilized plots (Figure 4a), butthese fertilization gains were not statistically significant either. This is also true for heightgrowth rate fertilization gains across all density levels (Figure 4c).

14
Figure 3: Basal area annual increment changes over the course of the study
a. Seven treatment regimes
0.00
2.00
4.00
6.00
8.00
10.00
12.00
14.00
16.00
0~4 (200) 4~8 (400) 8~12 (600)
Growth Period (Cumulative lb of fertilizer)
BA
ann
ual g
row
th
(sq
ft/a
cre/
year
) 1. ISPA_NoThinNoFert
2. ISPA_RepThinNoFert
3. ISPA_RepThinFert
4. ISPA/2_MinThinNoFert
5. ISPA/2_MinThinFert
6. ISPA/4_NoThinNoFert
7. ISPA/4_NoThinFert
b. Different density
0.00
2.00
4.00
6.00
8.00
10.00
12.00
14.00
0~4 (200) 4~8 (400) 8~12 (600)
Growth Period (Cumulative lb of fertilizer)
BA
ann
ual i
ncre
men
t(s
q ft
/acr
e/ye
ar)
ISPA_NoThin (Treatment 1)
ISPA_RepThin (Pooled datafrom treatment 2 and 3)
ISPA/2_MinThin (Pooled datafrom treatment 4 and 5)
ISPA/4_NoThin (Pooled datafrom treatment 6 and 7)
C. Fertilization vs No fertilization
0.00
2.00
4.00
6.00
8.00
10.00
12.00
14.00
0~4 (200) 4~8 (400) 8~12 (600)Growth Period (Cumulative lb of fertilizer)
BA
ann
ual i
ncre
men
t (s
q ft
/acr
e/ye
ar)
No Fertilization (Pooled datafrom treatment 1, 2, 4 and 6)
Fertilization (Pooled datafrom treatment 3, 5 and 7)

15
Figure 4: Dominant height annual increment trends over the course of the study
a. Seven treatment regimes
2.52.62.72.82.9
33.13.23.33.43.53.63.73.83.9
4
0~4 (200) 4~8 (400) 8~12 (600)
Grow th Period (Cum ulative lb of fertilizer)
Hei
ght a
nnua
l gro
wth
(ft/y
ear)
1. ISPA_NoThinNoFert
2. ISPA_RepThinNoFert
3. ISPA_RepThinFert
4. ISPA/2_MinThinNoFert
5. ISPA/2_MinThinFert
6. ISPA/4_NoThinNoFert
7. ISPA/4_NoThinFert
b. Different densities
2.52.62.72.82.9
33.13.23.33.43.53.63.73.8
0~4 (200) 4~8 (400) 8~12 (600)
Growth Period (Cumulative lb of fertilizer)
Hei
ght a
nnua
l gro
wth
(f
t/yea
ar)
ISPA_NoThin (Treatment 1)
ISPA_RepThin (Pooled datafrom treatment 2 and 3)
ISPA/2_MinThin (Pooled datafrom treatment 4 and 5)
ISPA/4_NoThin (Pooled datafrom treatment 6 and 7)
c. Fertilization vs No fertilization
2.52.62.72.82.9
33.13.23.33.43.53.63.73.8
0~4 (200) 4~8 (400) 8~12 (600)Growth Period (Cumulative lb of fertilizer)
Hei
ght a
nnua
l gro
wth
(f
t/yea
r)
No Fertilization (Pooled datafrom treatment 1, 2, 4 and 6)
Fertilization (Pooled datafrom treatment 3, 5 and 7)

16
Figure 5: Volume annual increment trends over the course of the study
a. Seven treatment regimes
0.0
50.0
100.0
150.0
200.0
250.0
300.0
350.0
400.0
0~4 (200) 4~8 (400) 8~12 (600)Growth Period (Cumulative lb of fertilizer)
Volu
me
annu
al in
crem
ent
(Cu
ft/a
cre/
year
)
1. ISPA_NoThinNoFert
2. ISPA_RepThinNoFert
3. ISPA_RepThinFert
4. ISPA/2_MinThinNoFert
5. ISPA/2_MinThinFert
6. ISPA/4_NoThinNoFert
7. ISPA/4_NoThinFert
b. Different densities
0
50
100
150
200
250
300
350
400
450
0~4 (200) 4~8 (400) 8~12 (600)
Growth Period (Cumulative lb of fertilizer)
Volu
me
annu
al in
crem
ent
(Cu
ft/a
cre/
year
) ISPA_NoThin (Treatment 1)
ISPA_RepThin (Pooled datafrom treatment 2 and 3)
ISPA/2_MinThin (Pooled datafrom treatment 4 and 5)
ISPA/4_NoThin (Pooled datafrom treatment 6 and 7)
c. Fertilization vs No fertilization
0
50
100
150
200
250
300
350
400
0~4 (200) 4~8 (400) 8~12 (600)
Growth Period (Cumulative lb of fertilizer)
Volu
me
annu
al g
row
th
(cu
ft/a
cre/
year
)
No Fertilization (Pooled datafrom treatment 1, 2, 4 and 6)
Fertilization (Pooled data fromtreatment 3, 5 and 7)

17
4.2.4 Periodic Annual Volume IncrementFigure 5 presents periodic volume annual growth trends. All treatment regimes exhibitedincreasing volume growth rate trends and fertilization generally increased volume annualgrowth (Figure 5a and 5c). ISPA_RepThin had the greatest volume growth rate, but its fertili-zation gain disappeared during the 3rd growth period, while in ISPA/2 and ISPA/4, volumegrowth rate fertilization gains were still observed. Specific comparison tests indicated thatduring the 1st growth period, fertilization gain was significant only in ISPA_RepThin and,not in ISPA/2 and ISPA/4. During the 2nd growth period, ISPA_RepThin and ISPA/2_MinThinhad significant fertilization gains, but ISPA/4 didn’t. During the 3rd growth period, there wasno fertilization gain in any of the density management regimes.
Within each density level, combining fertilized plots and unfertilized plots produces Figure5b. ISPA had the greatest volume growth rate and ISPA/4 had the least. Removal of growingstock by spacing had a negative effect on volume growth during the first three growth peri-ods. However, volume growth rate in ISPA began to slow down during the 3rd growth pe-riod, while ISPA/2 and ISPA/4 still kept a strong increasing trend.
Pooling sample plots together according to fertilization treatment produces Figure 5c. Acrossall densities, fertilization increased volume annual growth by about 12%, 14% and 7% re-spectively for the 1st, 2nd and 3rd growth periods and fertilization increases in the first twogrowth periods were statistically significant (p=0.0520, 0.0010), but not in the 3rd growth pe-riod (p=0.1185).
4.3 Whole Stand Yield Analysis Results
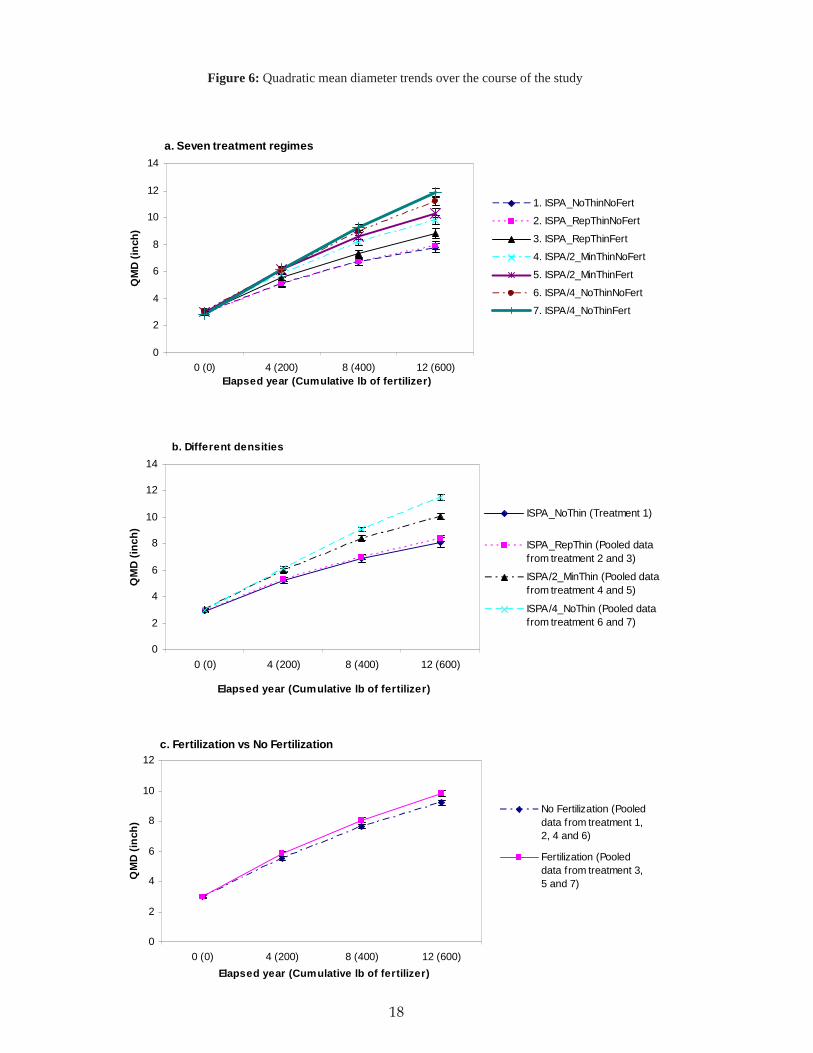
4.3.1 Quadratic Mean DiameterFigure 6 displays QMD development trends for the first twelve years after establishment. Asshown in Figure 6a, these seven treatment regimes began with almost the same initial QMD,but ended with 4.06 inches difference twelve years later. ISPA/4 with fertilization had thelargest QMD, ISPA with no further treatment had the least QMD, while others were betweenthese two. QMD in ISPA_RepThinNoFert treatment didn’t show much difference from that inISPA_NoThinNoFert. That’s probably because during the first twelve years, not manyISPA_RepThinNoFert plots reached their thinning trigger, and thinning was not actuallyperformed extensively in ISPA_RepThinNoFert plots. Within each density level, QMD infertilized plots was greater than their unfertilized counterparts, but most of these fertiliza-tion increases were not statistically significant and the only significant one was in theISPA_RepThin in the 12th year. Compared to fertilization, density effect on QMD yield wasmuch greater.
Combining all plots within each density regime, we see that initial QMD was the same amongISPAs, ISPA/2 and ISPA/4 (Figure 6b). Four years later, differences began to emerge withdenser plots exhibiting smaller QMD. As time elapsed, the difference became increasinglylarge. It went from 0.85 inch in the 4th year to 2.18 inch in the 8th year and 3.44 inch in the 12th
year. The QMD differences in the 8th and 12th year were statistically significant.
18
Figure 6: Quadratic mean diameter trends over the course of the study
a. Seven treatment regimes
0
2
4
6
8
10
12
14
0 (0) 4 (200) 8 (400) 12 (600)Elapsed year (Cumulative lb of fertilizer)
QM
D (i
nch)
1. ISPA_NoThinNoFert
2. ISPA_RepThinNoFert
3. ISPA_RepThinFert
4. ISPA/2_MinThinNoFert
5. ISPA/2_MinThinFert
6. ISPA/4_NoThinNoFert
7. ISPA/4_NoThinFert
b. Different densities
0
2
4
6
8
10
12
14
0 (0) 4 (200) 8 (400) 12 (600)
Elapsed year (Cumulative lb of fertilizer)
QM
D (i
nch)
ISPA_NoThin (Treatment 1)
ISPA_RepThin (Pooled datafrom treatment 2 and 3)
ISPA/2_MinThin (Pooled datafrom treatment 4 and 5)
ISPA/4_NoThin (Pooled datafrom treatment 6 and 7)
c. Fertilization vs No Fertilization
0
2
4
6
8
10
12
0 (0) 4 (200) 8 (400) 12 (600)Elapsed year (Cumulative lb of fertilizer)
QM
D (i
nch)
No Fertilization (Pooleddata from treatment 1,2, 4 and 6)
Fertilization (Pooleddata from treatment 3,5 and 7)

19
Across all densities, initial QMD in fertilized plots (2.96in.) was a little less than that in unfer-tilized plots (3.01in.) (Figure 6c). However, four years later, QMD in fertilized plots became0.28 inch greater than QMD in unfertilized plots. The first urea application increased QMDby 5.1%. As urea was repeatedly applied at every fourth year, QMD in fertilized plots be-came increasingly larger than that in unfertilized plots. Eight years later, QMD gain by fer-tilization was 0.45 inch. Twelve years later, this gain increased to 0.65 inch. ANCOVA testingindicated that the QMD gain by fertilization were not significant in the 4th year, but becamesignificant in the 8th (p=0.0343) and 12th year (p=0.0165) after establishment.
4.3.2 Diameter DistributionNot only did widely spaced treatment regimes exhibit larger QMD, they also had a higherproportion of trees in larger diameter classes. When established, diameter distribution curveswere very similar among the seven treatment regimes, but they gradually differentiate fromeach other over time (Figure 7). Diameter distribution curve for ISPA/4 plots moved furtherright than ISPA/2 and ISPAs, implying that ISPA/4 had a greater proportion of trees in largerdiameter classes. Within each density level, the diameter distribution curve for fertilizedplots was to the right of the unfertilized counterparts, so fertilized plots had more largerdiameter trees than their unfertilized counterparts. This can be better visualized by the bargraphs in Figure 8. At the start of the study, all seven treatment regimes had about the samediameter class proportions: 86% 1-4 inch trees and 14% 5-8 inch trees. Four years later, 9-12inch trees began to show up in ISPA/2 and ISPA/4, but not in ISPAs. Eight years later, 72% oftrees in ISPA/4 with fertilization were between diameter class 9 to 12 inches, while forISPA_NoThinNoFert and ISPA_RepThinNoFert, this percentage was only 18%. Twelve yearslater, about half of the trees in ISPA/4 were 13-17 inches and another half was 9-12 inches. ForISPAs, the 13-17 inch diameter class accounted for only 1-2% of the trees, while the 5-8 inchdiameter classes accounted for about 50%. Within each density level, the fertilized plots hadsomewhat more larger trees than their unfertilized counterparts. However, this differencewas not as big as the difference among different densities.
4.3.3 Basal Area Per AcreAll treatment regimes had an increasing basal area stocking pattern during the first 12 yearsafter establishment with denser stands having more basal area (Figure 9a). However,ISPA_NoThinNoFert treatment began exhibiting a slowing of the basal area increase fromyear 8 to year 12 while the other treatments displayed no evidence of slowing. In year 12,basal area per acre in ISPA/2_MinThinFert was getting very close to that inISPA_NoThinNoFert. Within each density level, fertilized plots outperformed their unfertil-ized counterparts, but specific comparison testing indicated that only fertilization gains inISPA_RepThin in year 8 were significant. Fertilization gain on basal area was not significantin ISPA/2 and ISPA/4 for the first twelve years. Compared to fertilization, the density effectwas greater and statistically significant.
As shown in Figure 9b, basal area stocking fell into three significantly different density groups:ISPA, ISPA/2 and ISPA/4. ISPA_NoThin and ISPA_RepThin are in the same ISPA group.However, ISPA_RepThin began to exceed the ISPA_NoThin in the 12th year. The basal arearatio between ISPA, ISPA/2 and ISPA/4 changed from 4:2:1 at establishment to 4:3:2 in the12th year.

20
Figure 7: Diameter distribution changes over the course of the study
At establishment
0.00
0.05
0.10
0.15
0.20
0.25
0.30
0.35
0.40
0.45
0 2 4 6 8 10
Diameter Class (in.)
Rel
ativ
e Fr
eque
ncy
8 years later
0
0.05
0.1
0.15
0.2
0.25
0.3
0.35
0 5 10 15 20
Diameter Class (in.)
Rel
ativ
e Fr
eque
ncy
ISPA_NoThinNoFert
ISPA_RepThinFert
ISPA/2_MinThinFert
ISPA/4_NoThinFert
4 years later
0
0.05
0.1
0.15
0.2
0.25
0.3
0.35
0 5 10 15
Diameter Class (in.)R
elat
ive
Freq
uenc
y
12 years later
0
0.05
0.1
0.15
0.2
0.25
0 5 10 15 20
Diameter Class (in.)
Rel
ativ
e Fr
eque
cy
ISPA_RepThinNoFert
ISPA/2_MinThinNoFert
ISPA/4_NoThinNoFert

21
Figure 8: Diameter class proportion changes over the time of the study
1: ISPA_NoThinNoFert,
2: ISPA_RepThinNoFert; 3: ISPA_RepThinFert;
4: ISPA/2_MinThinNoFert 5: ISPA/2_MinThinFert;
6: ISPA/4_NoThinNoFert; 7: ISPA/4_NoThinFert
8 years later
0%
20%
40%
60%
80%
100%
1 2 3 4 5 6 7
1 to 4 inches 5 to 8 inches
12 years later
0%
20%
40%
60%
80%
100%
1 2 3 4 5 6 7
9 to 12 inches 13 to 17 inches
In establishment year
0%
20%
40%
60%
80%
100%
1 2 3 4 5 6 7
4 years later
0%
20%
40%
60%
80%
100%
1 2 3 4 5 6 7

22
Figure 9: Basal area per acre trends over the course of the study
a. Seven treatment regimes
0
20
40
60
80
100
120
140
160
180
200
0 (0) 4 (200) 8 (400) 12 (600)Elapsed year(Cumulative lb of fertilizer)
BA
(sq.
ft/a
cre) 1. ISPA_NoThinNoFert
2. ISPA_RepThinNoFert
3. ISPA_RepThinFert
4. ISPA/2_MinThinNoFert
5. ISPA/2_MinThinFert
6. ISPA/4_NoThinNoFert
7. ISPA/4_NoThinFert
b. Different densities
0
20
40
60
80
100
120
140
160
180
200
0 (0) 4 (200) 8 (400) 12 (600)
Elapsed year(Cumulative lb of fertilizer)
BA
(sq.
ft/a
cre)
ISPA_NoThin (Treatment 1)
ISPA_RepThin (Pooled datafrom treatment 2 and 3)
ISPA/2_MinThin (Pooled datafrom treatment 4 and 5)
ISPA/4_NoThin (Pooled datafrom treatment 6 and 7)
c. Fertilization vs No Fertilization
0
20
40
60
80
100
120
140
160
0 (0) 4 (200) 8 (400) 12 (600)
Elapsed year(Cumulative lb of fertilizer)
BA
(sqf
t/acr
e)
No Fertilization (Pooled datafrom treatment 1, 2, 4 and 6)
Fertilization (Pooled datafrom treatment 3, 5 and 7)

23
Across all densities, initial stand basal area was statistically the same between fertilized andunfertilized plots (Figure 9c). Four years later, basal area in fertilized plots gained about 10%(5.28 sqft/acre) over unfertilized plots, but this gain was not significant at 0.05 level (p=0.1047).After 8 years, basal area in fertilized plots gained 12% (11.35 sqft/acre) and this increase wassignificant (p=0.0049). In year 12, basal area difference between fertilized and unfertilizedplots was 11.82 sqft/acre, which is also statistically significant.
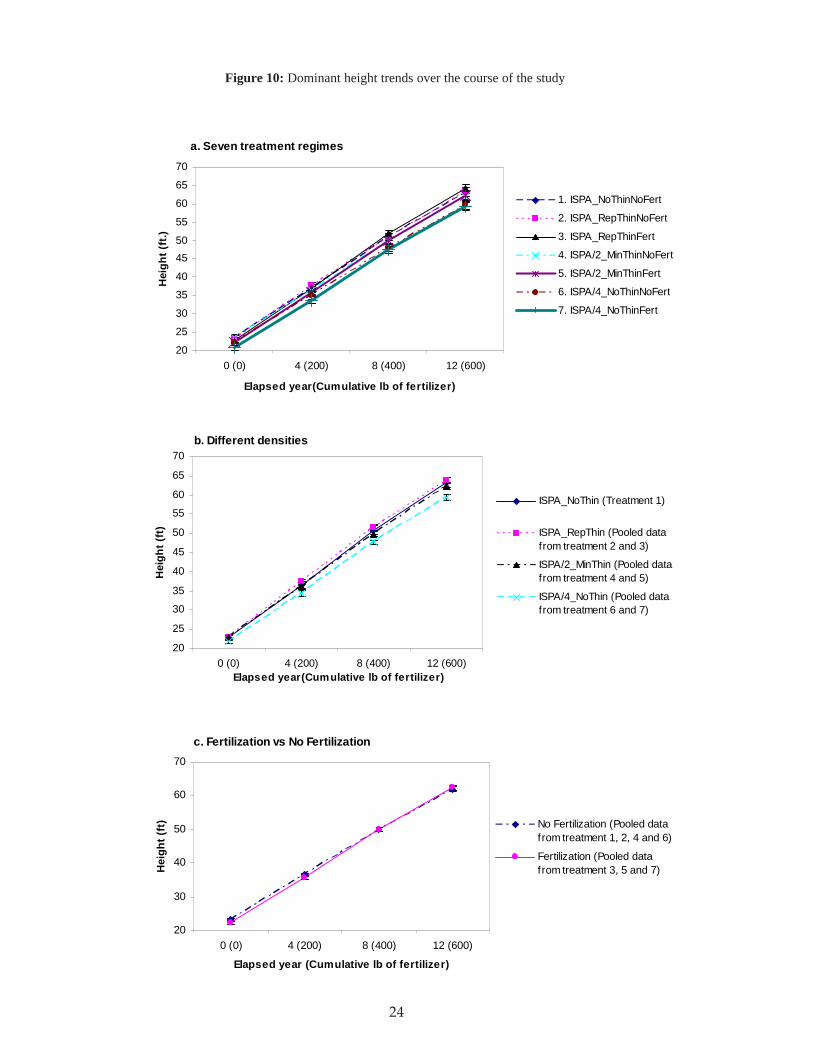
4.3.4 Dominant HeightBoth ISPA/2 and ISPA/4 had slightly shorter dominant height than ISPAs (Figure 10). It islikely because dominant height in ISPA/2 and ISPA/4 was slightly less than in ISPAs fromthe very beginning. Dominant height in fertilized plots had almost the same trend as that inunfertilized plots and fertilization didn’t show a significant effect on height at any density.ANCOVA testing supported this finding and most of height differences among differenttreatment regimes were not statistically significant.
4.3.5 Volume Per AcreFigure 11 presents cubic foot volume per acre over the study period. As shown in Figure 11a,the greatest cubic foot volume yield was in ISPA_RepThinFert treatment and the least was inISPA/4_NoThinNoFert treatment. Within each density level, fertilized curves were aboveunfertilized counterparts implying fertilization increased cubic foot volume at all densities.However, specific comparison testing indicated that only the fertilization increase inISPA_RepThin in year 8 was significant. Also from Figure 11a, ISPA_RepThinNoFert was notdistinguishable from ISPA_NoThinNoFert until in the 12th year, which may suggest that thethinning effect was beginning to show in the year 12.
As shown in Figure 11b, cubic foot volume by density exhibited a general pattern similar tothat previously discussed for basal area. The four density treatments fell into three signifi-cantly different groups with ISPA_NoThin and ISPA_RepThin in the same group. Twelveyears after establishment, ISPAs still exhibited more cubic foot volume per acre than ISPA/2and ISPA/4. Spaced stands (ISPA/2 and ISPA/4) had not recovered from the initial spacing.ISPA_RepThin was slightly less than ISPA_NoThin in the 4th and 8th years, but had passed theISPA_NoThin in the 12th year.
Across all densities, initial cubic foot volume in fertilized plots was statistically the same asthat in unfertilized plots (Figure 11c). However, in the 4th, 8th, and 12th year, cubic foot volumeper acre was increased by fertilization by 113.2, 218.2 and 313.6cuft/acre respectively, whichrepresented about 9.5%, 12.1% and 10.2% volume gain. These gains were not significant inthe 4th year; the significant increase in periodic annual volume growth caused by the firstfertilization didn’t translate into significant volume stocking increase in the 4th year. After thesecond fertilization and 4 more years of growth, fertilization effect on stand volume stockingbecame significant. This significant effect remained in the 12th year.
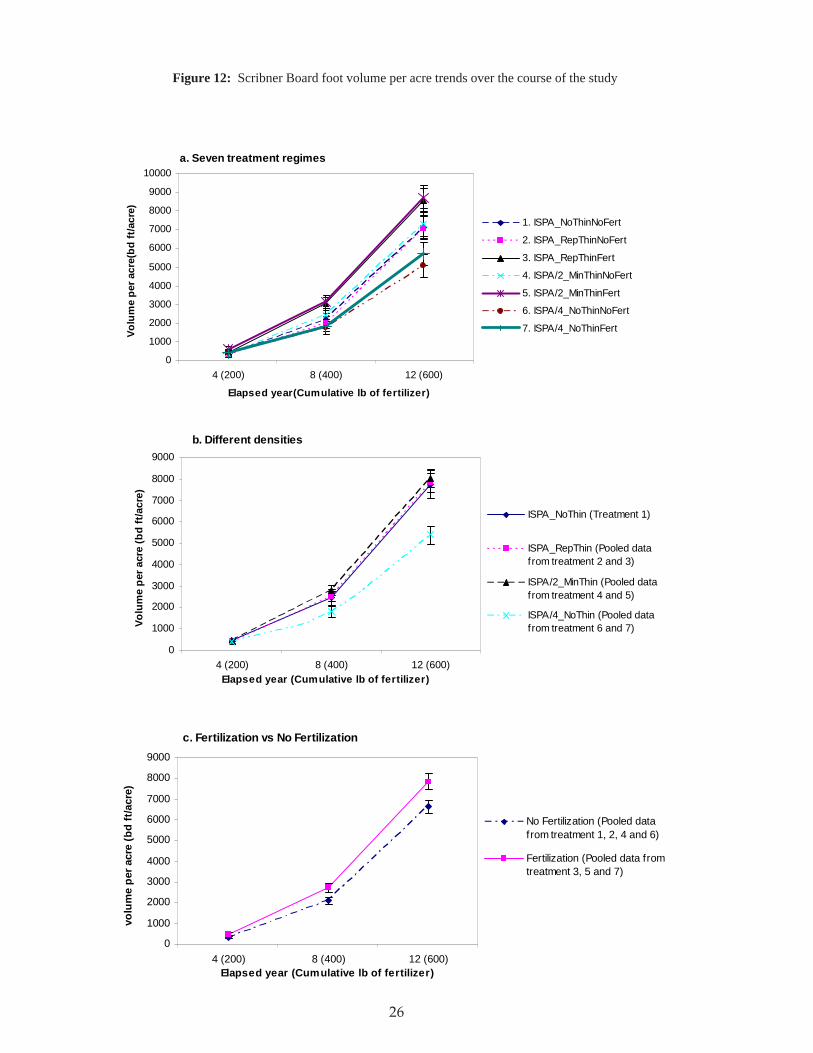
Figure 12 presents Scribner board foot volume per acre counterparts to the cubic foot volumesin Figure 11. Scribner volume was calculated according to procedures of Williamson andCurtis (1980) and represents volume to a 6-inch top for stands with mean QMD greater than
24
Figure 10: Dominant height trends over the course of the study
a. Seven treatment regimes
20
25
30
35
40
4550
55
60
65
70
0 (0) 4 (200) 8 (400) 12 (600)
Elapsed year(Cumulative lb of fertilizer)
Hei
ght (
ft.)
1. ISPA_NoThinNoFert
2. ISPA_RepThinNoFert
3. ISPA_RepThinFert
4. ISPA/2_MinThinNoFert
5. ISPA/2_MinThinFert
6. ISPA/4_NoThinNoFert
7. ISPA/4_NoThinFert
b. Different densities
20
25
30
35
40
45
50
55
60
65
70
0 (0) 4 (200) 8 (400) 12 (600)Elapsed year(Cumulative lb of fertilizer)
Hei
ght (
ft)
ISPA_NoThin (Treatment 1)
ISPA_RepThin (Pooled datafrom treatment 2 and 3)
ISPA/2_MinThin (Pooled datafrom treatment 4 and 5)
ISPA/4_NoThin (Pooled datafrom treatment 6 and 7)
c. Fertilization vs No Fertilization
20
30
40
50
60
70
0 (0) 4 (200) 8 (400) 12 (600)
Elapsed year (Cumulative lb of fertilizer)
Hei
ght (
ft) No Fertilization (Pooled data
from treatment 1, 2, 4 and 6)
Fertilization (Pooled datafrom treatment 3, 5 and 7)

25
Figure 11: Cubic foot volume per acre trends over the course of the study
a. Seven treatment regimes
0
500
1000
1500
2000
2500
3000
3500
4000
4500
5000
0 (0) 4 (200) 8 (400) 12 (600)
Elapsed year(Cumulative lb of fertilizer)
Volu
me
per a
cre
(cu
ft/a
cre)
1. ISPA_NoThinNoFert
2. ISPA_RepThinNoFert
3. ISPA_RepThinFert
4. ISPA/2_MinThinNoFert
5. ISPA/2_MinThinFert
6. ISPA/4_NoThinNoFert
7. ISPA/4_NoThinFert
b. Different densities
0
500
1000
1500
2000
2500
3000
3500
4000
4500
0 (0) 4 (200) 8 (400) 12 (600)Elapsed year (Cumulative lb of fertilizer)
Volu
me
per a
cre
(cu.
ft/a
cre)
ISPA_NoThin (Treatment 1)
ISPA_RepThin (Pooled datafrom treatment 2 and 3)
ISPA/2_MinThin (Pooled datafrom treatment 4 and 5)
ISPA/4_NoThin (Pooled datafrom treatment 6 and 7)
c. Fertilization vs No Fertilization
0
500
1000
1500
2000
2500
3000
3500
4000
0 (0) 4 (200) 8 (400) 12 (600)Elapsed year (Cumulative lb of fertilizer)
volu
me
per a
cre
(cu.
ft/a
cre)
No Fertilization (Pooled datafrom treatment 1, 2, 4 and 6)
Fertilization (Pooled data fromtreatment 3, 5 and 7)
26
Figure 12: Scribner Board foot volume per acre trends over the course of the study
a. Seven treatment regimes
0
1000
2000
3000
4000
5000
6000
7000
8000
9000
10000
4 (200) 8 (400) 12 (600)
Elapsed year(Cumulative lb of fertilizer)
Volu
me
per a
cre(
bd ft
/acr
e)
1. ISPA_NoThinNoFert
2. ISPA_RepThinNoFert
3. ISPA_RepThinFert
4. ISPA/2_MinThinNoFert
5. ISPA/2_MinThinFert
6. ISPA/4_NoThinNoFert
7. ISPA/4_NoThinFert
b. Different densities
0
1000
2000
3000
4000
5000
6000
7000
8000
9000
4 (200) 8 (400) 12 (600)Elapsed year (Cumulative lb of fertilizer)
Volu
me
per a
cre
(bd
ft/a
cre)
ISPA_NoThin (Treatment 1)
ISPA_RepThin (Pooled datafrom treatment 2 and 3)
ISPA/2_MinThin (Pooled datafrom treatment 4 and 5)
ISPA/4_NoThin (Pooled datafrom treatment 6 and 7)
c. Fertilization vs No Fertilization
0
1000
2000
3000
4000
5000
6000
7000
8000
9000
4 (200) 8 (400) 12 (600)Elapsed year (Cumulative lb of fertilizer)
volu
me
per a
cre
(bd
ft/a
cre)
No Fertilization (Pooled datafrom treatment 1, 2, 4 and 6)
Fertilization (Pooled data fromtreatment 3, 5 and 7)

27
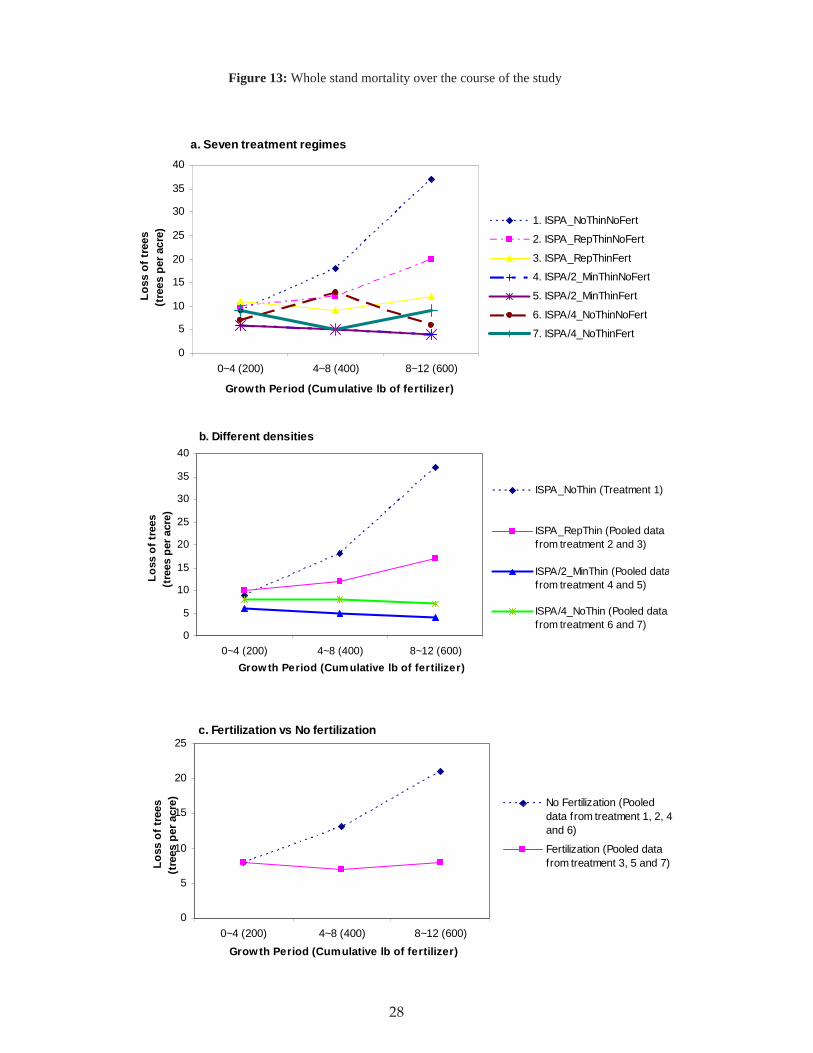
4.4 Whole Stand Mortality Analysis ResultsTree losses during the first three growth periods are shown in Figure 13. During the 1st growthperiod these seven treatment regimes had a similar number of dead trees, but their differencesbegan to show during the 2nd growth period and continued to increase during the 3rd growthperiod. The ISPA_NoThinNoFert regime exhibited much more mortality than other treatmentregimes. That’s probably because its large initial density without subsequent thinning causedearlier crown closure and inter-tree competition. During the 1st growth period,ISPA_RepThinFert had slightly more dead trees than its unfertilized counterpart, but it fellbelow its unfertilized counterpart during the 2nd and 3rd growth periods and their differenceseems to be increasing with time. Fertilization seemed to reduce mortality in ISPA_RepThintreatment. That’s probably because ISPA_RepThin fertilized plots reached their thinning trig-ger earlier than unfertilized counterparts. The subsequent thinning in ISPA_RepThinFert plotsdecreased inter-tree competition and thus decreased mortality. In fact, during the first twelveyears, more thinning took place in ISPA_RepThin fertilized plots than in unfertilized counter-parts. In ISPA/2 and ISPA/4, mortality remained stable during the first three growth periodsand there was no significant mortality difference between fertilized and unfertilized plots inISPA/2 and ISPA/4.
Examining pooled data for density treatments showed that ISPA/2 didn’t differentiate fromISPA/4 on mortality, but they both had significantly less mortality than ISPA_NoThin andISPA_RepThin during the 2nd and 3rd growth periods (Figure 13b). Mortality in ISPA_NoThinincreased very quickly during the 2nd and 3rd growth periods and became significantly greaterthan that in ISPA_RepThin.
Figure 13c shows stand mortality from pooled fertilized and unfertilized plots. Fertilized plotsexperienced relatively constant but small mortality (about 8 trees per acre per growth period),while mortality in unfertilized plots increased quickly from 8 trees per acre during the 1st
growth period, to 13 trees per acre during the 2nd growth period, and to 21 trees per acreduring the 3rd growth period.
4.5 Crop Tree Growth and Yield Analysis ResultsIn this study, crop tree is defined as the 40 largest diameter trees per acre. The idea of crop treeanalysis is to see how the large trees respond to density and fertilization treatments, since agiven amount of response in larger trees may represent potentially greater final harvest valuethan the same amount spread over all trees in the stand.
7.5 inches. At establishment when means stand age was 9 years, average QMD was about 3inches (Table 4, Figure 6) too small for the Scribner calculation. After the frist growth periodwhen mean stand age was 13, some plots reached the QMD threshold where Scribner volumecould be calculated thus Figure 12 only shows the Scribner board foot volume at 4th, 8th and12th year, mean stand age 13, 17, and 21 respectively, after establishment. Compared with thecubic foot volume trends in Figure 11, Scribner trends are generally similar but there aresome shifts that undoubtedly reflect the minimum thresholds and other characteristics of theScribner rule. For example, ISPA/2_MinThinFert has the greatest Scribner board foot volumefrom the 8th year after the establishment (Figure 12a), whereas for the cubic foot volume,ISPA/2_MinThinFert has less volume than all ISPAs (Figure 11a).
28
Figure 13: Whole stand mortality over the course of the study
a. Seven treatment regimes
0
5
10
15
20
25
30
35
40
0~4 (200) 4~8 (400) 8~12 (600)
Growth Period (Cumulative lb of fertilizer)
Loss
of t
rees
(tre
es p
er a
cre)
1. ISPA_NoThinNoFert
2. ISPA_RepThinNoFert
3. ISPA_RepThinFert
4. ISPA/2_MinThinNoFert
5. ISPA/2_MinThinFert
6. ISPA/4_NoThinNoFert
7. ISPA/4_NoThinFert
b. Different densities
0
5
10
15
20
25
30
35
40
0~4 (200) 4~8 (400) 8~12 (600)Grow th Period (Cum ulative lb of fertilizer)
Loss
of t
rees
(t
rees
per
acr
e)
ISPA_NoThin (Treatment 1)
ISPA_RepThin (Pooled datafrom treatment 2 and 3)
ISPA/2_MinThin (Pooled datafrom treatment 4 and 5)
ISPA/4_NoThin (Pooled datafrom treatment 6 and 7)
c. Fertilization vs No fertilization
0
5
10
15
20
25
0~4 (200) 4~8 (400) 8~12 (600)Grow th Period (Cumulative lb of fertilizer)
Loss
of t
rees
(tre
es p
er a
cre) No Fertilization (Pooled
data from treatment 1, 2, 4and 6)
Fertilization (Pooled datafrom treatment 3, 5 and 7)

29
For crop tree analysis, only results from diameter, basal area and volume are presented sinceheight results from the 40 largest trees per acre (dominant height) have already been dis-cussed in the previous whole stand section. Crop tree growth and yield results are presentedtogether and only those differing from the whole stand are highlighted.
4.5.1 Quadratic Mean DiameterAs shown in Figure 14, crop trees had a similar diameter response pattern as did the wholestand, which is the denser stands exhibited less QMD growth and yield and fertilizationincreased QMD growth and yield within each density. Initial crop tree QMD in ISPA/4 plotswas a little less than that in ISPA/2 plots, which was a little less than that in ISPA plots(Figure 14b), but in the 4th year, ISPA/2 plots exceeded ISPA because of its greater crop treeQMD growth rate during the 1st growth period (Figure 14a). However, ISPA/4 was indistin-guishable from ISPA in the 4th year despite its greatest QMD growth rate during the 1st growthperiod. After eight years, crop tree QMD yield in ISPA/4 exceeded ISPA/2 and ISPA andbecame the largest one, followed by ISPA/2, then by ISPA. At year twelve, the year 8 patterncontinued to be true but with bigger differences. Within each density level, fertilization gen-
Figure 14: Crop tree diameter growth and yield trends over the course of the study
a. Quadratic mean diameter growth
0
0.2
0.4
0.6
0.8
1
1.2
0~4 (200) 4~8 (400) 8~12 (600)
Growth period (Cumulative lb of fertilizer)
QM
D a
nnua
l gro
wth
(inch
/yea
r)
1. ISPA_NoThinNoFert
2. ISPA_RepThinNoFert
3. ISPA_RepThinFert
4. ISPA/2_MinThinNoFert
5. ISPA/2_MinThinFert
6. ISPA/4_NoThinNoFert
7. ISPA/4_NoThinFert
b. Quadratic mean diameter yield
2
4
6
8
10
12
14
16
0 (0) 4 (200) 8 (400) 12 (600)Elapsed year (Cumulative lb of fertilizer)
QM
D (i
nch)
1. ISPA_NoThinNoFert
2. ISPA_RepThinNoFert
3. ISPA_RepThinFert
4. ISPA/2_MinThinNoFert
5. ISPA/2_MinThinFert
6. ISPA/4_NoThinNoFert
7. ISPA/4_NoThinFert
30
erally increased crop tree QMD growth and yield, but these increases were not statisticallysignificant.
For crop tree QMD growth and yield, there was no significant interaction between densityand fertilization treatments. The effects of density control were insignificant for QMD growthduring the 1st growth period, but became significant during the 2nd and 3rd periods. Fertiliza-tion effects were significant only in the 2nd growth period. As for QMD yield, density wassignificant in year 8 and 12, but fertilization was not significant at any measurement.
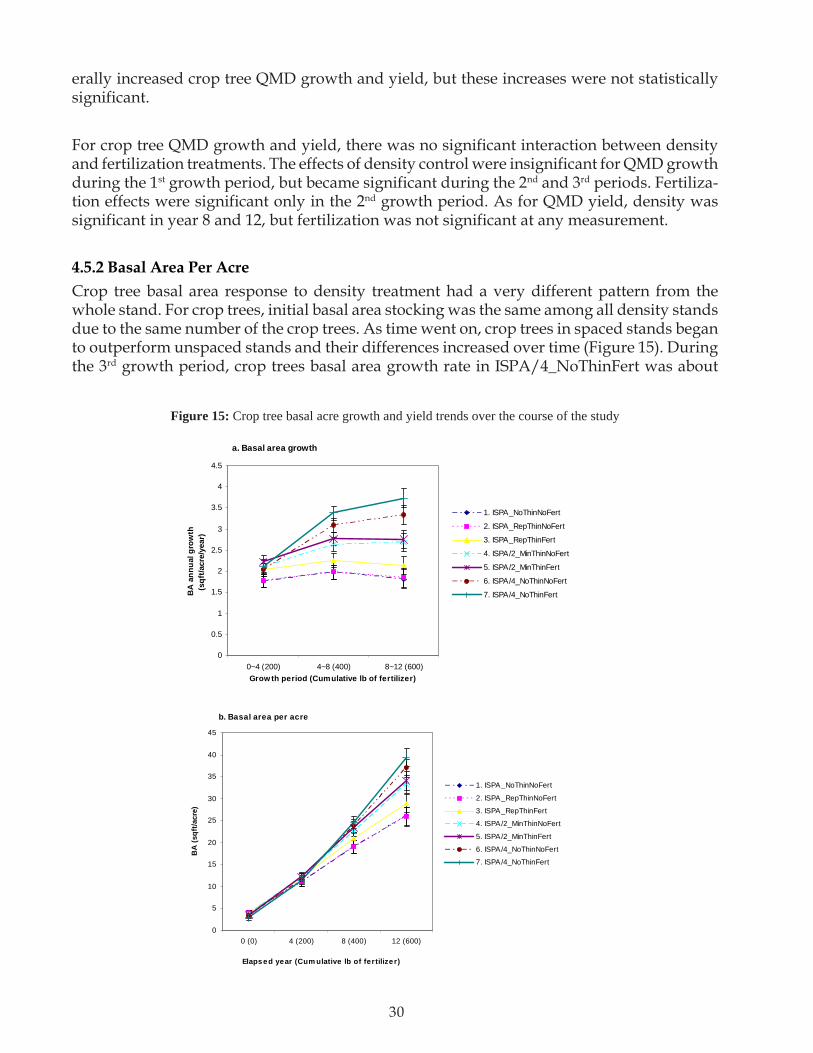
4.5.2 Basal Area Per AcreCrop tree basal area response to density treatment had a very different pattern from thewhole stand. For crop trees, initial basal area stocking was the same among all density standsdue to the same number of the crop trees. As time went on, crop trees in spaced stands beganto outperform unspaced stands and their differences increased over time (Figure 15). Duringthe 3rd growth period, crop trees basal area growth rate in ISPA/4_NoThinFert was about
Figure 15: Crop tree basal acre growth and yield trends over the course of the study
a. Basal area growth
0
0.5
1
1.5
2
2.5
3
3.5
4
4.5
0~4 (200) 4~8 (400) 8~12 (600)Grow th period (Cumulative lb of fertilizer)
BA
ann
ual g
row
th(s
qft/a
cre/
year
)
1. ISPA_NoThinNoFert
2. ISPA_RepThinNoFert
3. ISPA_RepThinFert
4. ISPA/2_MinThinNoFert
5. ISPA/2_MinThinFert
6. ISPA/4_NoThinNoFert
7. ISPA/4_NoThinFert
b. Basal area per acre
0
5
10
15
20
25
30
35
40
45
0 (0) 4 (200) 8 (400) 12 (600)
Elapsed year (Cum ulative lb of fertilize r)
BA
(sqf
t/acr
e)
1. ISPA_NoThinNoFert
2. ISPA_RepThinNoFert
3. ISPA_RepThinFert
4. ISPA/2_MinThinNoFert
5. ISPA/2_MinThinFert
6. ISPA/4_NoThinNoFert
7. ISPA/4_NoThinFert

31
twice that in ISPA_NoThin and ISPA_RepThin. For the whole stand, the results were theopposite with spaced stands having less basal area growth and yield due to the fewer num-ber of trees. Within each density level, fertilization generally increased basal area growthand yield, but these increases were not statistically significant.
For crop tree basal area growth and yield, there was no significant interaction between densityand fertilization treatments. The effects of density control were insignificant for basal areagrowth rate during the 1st growth period, but became significant during the 2nd and 3rd periods.As for basal area yield, density treatment was significant in year 8 and 12, but not in year 4.Fertilization was not significant for basal area growth and yield at any measurement.
4.5.3 Cubic Foot VolumeCrop tree volume responded to density treatment in a pattern similar to that described forbasal area. As shown in Figure 16, initial crop tree volume growth and yield were statisti-cally the same among the different densities. As time went on, less dense plots experienced
Figure 16: Crop tree cubic foot volume growth and yield trends over the course of the studya. Cubic foot volume growth
0
20
40
60
80
100
120
0~4 (200) 4~8 (400) 8~12 (600)
Growth period (Cumulative lb of fertilizer)
Volu
me
annu
al g
row
th (c
uft/a
cre/
year
)
1. ISPA_NoThinNoFert
2. ISPA_RepThinNoFert
3. ISPA_RepThinFert
4. ISPA/2_MinThinNoFert
5. ISPA/2_MinThinFert
6. ISPA/4_NoThinNoFert
7. ISPA/4_NoThinFert
b. Cuboc foot volume per acre
0
100
200
300
400
500
600
700
800
900
1000
0 (0) 4 (200) 8 (400) 12 (600)
Elapsed year (Cumulative lb of fertilizer)
Volu
me
(cuf
t/acr
e)
1. ISPA_NoThinNoFert
2. ISPA_RepThinNoFert
3. ISPA_RepThinFert
4. ISPA/2_MinThinNoFert
5. ISPA/2_MinThinFert
6. ISPA/4_NoThinNoFert
7. ISPA/4_NoThinFert

32
greater crop tree volume growth. Within each density level, fertilization generally increasedcrop tree growth and yield, but these increases were not statistically significant.
For crop tree cubic foot volume growth and yield, there was no significant interaction be-tween density and fertilization treatments. The effects of density control on volume growthwere significant during the 2nd and 3rd periods. But this significant volume growth differenceduring the 2nd growth period didn’t translate into significant volume yield difference in year8, and significant volume yield difference didn’t appear until year 12. Fertilization effectswere not significant for volume growth and yield at any measurement.

33
CHAPTER 5. DISCUSSION
5.1 Whole StandTable 5 summarizes the whole stand attributes after three four-year growth periods, a total of12 years. Compared to Table 4, one can see that, after 12 years, QMD had significantly in-creased and was progressively greater from ISPA to ISPA/2 to ISPA/4. Basal area and vol-ume also increased significantly and the ratio between ISPA, ISPA/2 and ISPA/4 changedfrom 4:2:1 at establishment to 4:3:2 in the 12th year. Although height changed over the 12-yearperiod, it remained indistinguishable among the seven treatment regimes. Within each den-sity level, fertilization plots exhibited greater QMD, basal area per acre and volume per acrethan their unfertilized counterparts.
5.1.1 Density EffectDensity had great effects on stand growth and yield, and most of the density effects camefrom the initial spacing since only eight plots were actually thinned during the 12 yearsstudy period. That’s why in most cases ISPA_NoThinNoFert and ISPA_RepThinNoFert werenot significantly different from each other.
Diameter: Many sources indicate that radial growth increases with increased spacing (Sjolte-Jorgensen 1967, King 1986, Curtis and Marshall 2002). This was supported by this study. Atestablishment, there were no significant differences among the treatments on stand quadraticmean diameter (Table 4). After 12 years growth, QMD progressively increased from ISPA toISPA/2 to ISPA/4 since the wider spacing experienced by ISPA/4 and ISPA/2 gave remain-ing trees more room to grow. In fact, ISPA/4 exhibited the greatest QMD growth rate for allthree growth periods (Figure 2). Not only did widely spaced treatment regimes exhibit largerQMD, they also had a higher proportion of trees in larger diameter classes (Figures 7 and 8),implying higher value at final harvest. This finding is consistent with results from the LOGSstudy (Curtis and Marshall 2002).
Basal Area: Basal area is positively correlated with density level, with denser stands havinggreater basal area growing stock. Removal of growing stock by spacing at establishment hada negative effect on basal area growth immediately after establishment. ISPAs with moretrees had greater periodic annual basal area growth than both ISPA/2 and ISPA/4. Twelveyears after establishment, ISPAs continued to exhibit more basal area per acre than did ISPA/2 and ISPA/4. However, ISPA/2 and ISPA/4 had an increasing basal area annual growthpattern while ISPA had a decreasing pattern. By the end of the 3rd growth period, basal areagrowth rate in ISPA/4 became close to ISPAs, and basal area growth rate in ISPA/2 actuallyexceeded the ISPAs (Figure 3). This implies that ISPA/2 and ISPA/4 have started to accumu-late basal area at the same or even greater rate than the ISPAs. We could expect that lightlyspaced ISPA/2 stands would recover from initial stocking removal and quickly catch ISPAsin terms of basal area per acre. Heavier spaced ISPA/4 stands might also catch the ISPA inthe future.

34
Table 5: Average stand attributes in the 12th year after establishment for 56 SMC Type I Douglas-fir plots
Height: Height response to density control is mixed in the literature. In this study, a slightheight growth reduction after early spacing was observed for the first eight years since bothISPA/2 and ISPA/4 exhibited less dominant height growth than ISPAs during the first twofour-year growth periods (Figure 4). However, ANCOVA testing indicated that these reduc-tions were not statistically significant. During the 3rd growing period, both ISPA and ISPA/2had the same dominant height growth rate and the reduction was recovered in ISPA/2. Thin-ning shock was not really observed in this study. The reason is perhaps because of the rela-tively high site quality of these installations.
Volume: Volume growth and yield exhibited a general pattern similar to that previouslydiscussed for basal area. ISPAs had the greatest cubic foot volume, ISPA/2 was in the middleand ISPA/4 had the least volume (Figure 11). However, during the 3rd growth period, theISPA_NoThin began to slow down in terms of volume annual growth while others still keptan increasing volume growth trend (Figure 5).
Mortality: As would be expected, density also affected stand mortality with the denser standhaving greater mortality (Figure 13), especially during the last growth period in which thecanopy began to close in the unspaced stands and inter-tree competition was intensified.This result is consistent with both RFNRP and BC Shawnigan Lake studies.
* Numbers inside parentheses denote the range
ISPA_RepThin ISPA/2_M inThin ISPA/4_NoThin Stand Attributes
1.ISPA_ No Thin No
Fert 2. No Fert 3. Fert 4. No Fert 5. Fert 6. No Fert 7. Fert
QM D (in.) 2.96 (1.94-4.04)*
2.90 (1.96-3.64)
2.98 (2.23-4.57)
3.07 (2.12-3.98)
3.04 (2.19-4.58)
3.11 (2.07-4.59)
2.90 (1.88-3.93)
Basal area (sq ft/acre)
26.74 (6.04-62.50)
24.95 (7.74-54.86)
25.78 (8.65-63.82)
12.53 (3.08-22.65)
13.01 (4.44-31.39)
6.86 (3.00-14.24)
5.95 (2.09-12.28)
HT40 (ft.) 23.4 (15.2-31.6)
23.3 (15.5-31.4)
22.8 (15.6-32.9)
23.7 (15.0-34.2)
22.5 (15.3-33.2)
22.4 (16.0-33.2)
20.9 (15.2-30.3)
Volume (cu ft/acre)
280.7 (51.0-784.0)
258.5 (60.0-683.0)
272.6 (67.0-838.0)
129.6 (26.0-285.0)
137.0 (35.0-410.0)
71.8 (23.0-188.0)
60.0 (16-151.0)
Breast height Age (year)
5.6 (3-9)
5.4 (3-9)
5.6 (3-10)
5.7 (3-9)
5.3 (3-9)
5.0 (3-10)
5.0 (3-9)
Trees per acre
509 (248-716)
509 (302-800)
481 (294-752)
228 (126-324)
234 (170-334)
121 (94-154)
119 (76-162)
Relative density
15.24 (4.16-33.52)
14.66 (5.26-32.80)
14.43 (5.79-31.17)
6.96 (2.12-11.35)
7.17 (3.00-14.75)
3.75 (1.93-6.65)
3.36 (1.52-6.20)
Site index (30 year total age)
88.3 (74-100)
85.4 (74-98)
85.2 (71-94)
87.8 (70-97)
87.3 (70-95)
86.0 (72-96)
85.3 (75-94)
Sample Size
9 9 9 9 9 9 9
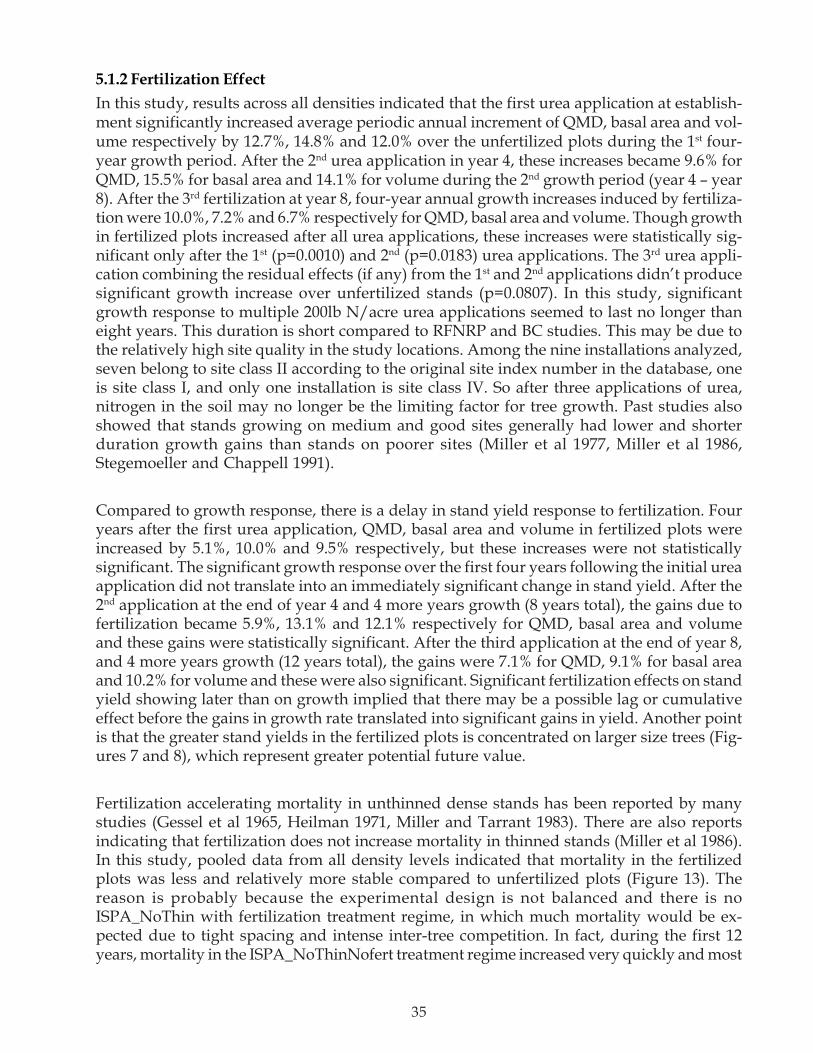
35
5.1.2 Fertilization EffectIn this study, results across all densities indicated that the first urea application at establish-ment significantly increased average periodic annual increment of QMD, basal area and vol-ume respectively by 12.7%, 14.8% and 12.0% over the unfertilized plots during the 1st four-year growth period. After the 2nd urea application in year 4, these increases became 9.6% forQMD, 15.5% for basal area and 14.1% for volume during the 2nd growth period (year 4 – year8). After the 3rd fertilization at year 8, four-year annual growth increases induced by fertiliza-tion were 10.0%, 7.2% and 6.7% respectively for QMD, basal area and volume. Though growthin fertilized plots increased after all urea applications, these increases were statistically sig-nificant only after the 1st (p=0.0010) and 2nd (p=0.0183) urea applications. The 3rd urea appli-cation combining the residual effects (if any) from the 1st and 2nd applications didn’t producesignificant growth increase over unfertilized stands (p=0.0807). In this study, significantgrowth response to multiple 200lb N/acre urea applications seemed to last no longer thaneight years. This duration is short compared to RFNRP and BC studies. This may be due tothe relatively high site quality in the study locations. Among the nine installations analyzed,seven belong to site class II according to the original site index number in the database, oneis site class I, and only one installation is site class IV. So after three applications of urea,nitrogen in the soil may no longer be the limiting factor for tree growth. Past studies alsoshowed that stands growing on medium and good sites generally had lower and shorterduration growth gains than stands on poorer sites (Miller et al 1977, Miller et al 1986,Stegemoeller and Chappell 1991).
Compared to growth response, there is a delay in stand yield response to fertilization. Fouryears after the first urea application, QMD, basal area and volume in fertilized plots wereincreased by 5.1%, 10.0% and 9.5% respectively, but these increases were not statisticallysignificant. The significant growth response over the first four years following the initial ureaapplication did not translate into an immediately significant change in stand yield. After the2nd application at the end of year 4 and 4 more years growth (8 years total), the gains due tofertilization became 5.9%, 13.1% and 12.1% respectively for QMD, basal area and volumeand these gains were statistically significant. After the third application at the end of year 8,and 4 more years growth (12 years total), the gains were 7.1% for QMD, 9.1% for basal areaand 10.2% for volume and these were also significant. Significant fertilization effects on standyield showing later than on growth implied that there may be a possible lag or cumulativeeffect before the gains in growth rate translated into significant gains in yield. Another pointis that the greater stand yields in the fertilized plots is concentrated on larger size trees (Fig-ures 7 and 8), which represent greater potential future value.
Fertilization accelerating mortality in unthinned dense stands has been reported by manystudies (Gessel et al 1965, Heilman 1971, Miller and Tarrant 1983). There are also reportsindicating that fertilization does not increase mortality in thinned stands (Miller et al 1986).In this study, pooled data from all density levels indicated that mortality in the fertilizedplots was less and relatively more stable compared to unfertilized plots (Figure 13). Thereason is probably because the experimental design is not balanced and there is noISPA_NoThin with fertilization treatment regime, in which much mortality would be ex-pected due to tight spacing and intense inter-tree competition. In fact, during the first 12years, mortality in the ISPA_NoThinNofert treatment regime increased very quickly and most

36
Figure 17: Whole stand mortality trends for fertilization regimes (without ISPA_NoThinNoFert plots) over the course of the study
5.1.3 Fertilization Effect Within Different Density TreatmentsAcross all densities, fertilization significantly increased diameter, basal area and volumegrowth in the first two growth periods. However, close inspection revealed that growth re-sponse patterns to fertilization were not the same among different density stands, even thoughno statistically significant interaction was found. Figure 18 shows the growth rate gains byfertilization for each growth period and each density treatment. These gains were calculatedby subtracting the growth rate of unfertilized plots from their fertilized counterparts. Asshown in Figure 18, after the first 200lb N/acre urea application, the greatest growth boostwas in ISPA_RepThin. As time went on and more urea applied, QMD growth rate fertiliza-tion gains didn’t change much, but basal area and volume growth rate gains in ISPA_RepThindecreased. After three urea applications, basal area and volume growth rate in ISPA_RepThinfertilized plots fell below those in the unfertilized plots. In contrast, after the first urea appli-cation, stand annual growth in QMD, basal area and volume for the ISPA/4_NoThin regimedidn’t gain much, but as more urea was applied, growth rate increased. So denser standsresponded to the first fertilization faster and greater than did the less dense stands. How-ever, these responses in denser stands decreased over time, while responses in less densestands increased. That’s probably because in denser stands, like ISPA_RepThin, nitrogenwas the limiting factor during the first growth period and it responded quickly to the firsturea application. As a result, fertilized stands in ISPA_RepThin reached thinning triggersearlier than their unfertilized counterparts, and the subsequent thinning in fertilized stands
mortality came from this treatment. Figure 17 shows the mortality in pooled fertilized andunfertilized plots but without the ISPA_NoThinNoFert plots. Compared to Figure 12c, afterleaving ISPA_NoThinNoFert plots out, mortality in unfertilized plots dropped quickly, thusthe mortality difference between fertilized and unfertilized plots decreased. However, mor-tality in fertilized plots is still below that in unfertilized plots. This may be due to the rela-tively modest stand densities tested, in which tree vigor was increased by fertilizer, thus theprobability of tree death decreased.
0
2
4
6
8
10
12
14
0~4 (200) 4~8 (400) 8~12 (600)
Growth period (Cumulative lb of fertilizer)
Loss
of t
rees
(tre
es p
er a
cre)
No Fertilization (Pooleddata from treatment 2, 4and 6)
Fertilization (Pooled datafrom treatment 3, 5 and 7)

37
decreased stand growth in the following growth periods. As for low density stands, widespacing delayed the use of nitrogen by trees, perhaps due to competition by other vegetationfor nitrogen use.
As regards stand yield, fertilization gains in diameter and volume per acre had increasingpatterns for all density stands (Figure 19). However, from year 8 to year 12, fertilization gainsin volume per acre increased little in ISPA_RepThin, whereas they increased a lot in lessdense ISPA/2 and ISPA/4 stands. Due to the decreasing fertilization gains in volume growthrate in ISPA_RepThin (Figure 18), we could expect fertilization gains in volume yield inISPA_RepThin will decrease soon. Fertilization gains in basal area decreased inISPA_RepThin while they increased in ISPA/2 and ISPA/4 stands. So after the 1st and 2nd
urea applications, fertilization gains in basal area and volume in dense stands were greaterthan those in less dense stands, but as more urea was applied, these gains either decreasedor stayed the same in dense stands while gains increased in less dense stands.
The growth and yield gains shown in Figure 18 and 19 are the marginal gain due to fertiliza-tion for each density. They should not be interpreted as evidence of interaction betweendensity and fertilization treatments. As presented earlier, statistical testing using actual mea-surement data found no significant interaction. The effects from fertilization and densitywere additive. This is consistent with Shawnigan Lake results (McWilliams and Therien 1996),but contradicts the RFNRP results (Segemoeller and Chappell 1991). The reason is probablybecause spacing to half and one-quarter of initial density is relatively heavy, and spacedstands haven’t fully recovered from this during the first 12 years. As time goes on, after spacedstands catch up with the unspaced ones in terms of stand yield, the advantage of combiningdensity control and fertilization treatments is very likely to be observed.
5.2 Crop TreeCrop tree density responses were very different from the whole stand. When only crop treeswere considered, more intensively spaced stands had greater basal area and volume growthand yield, while in the whole stand, spaced stands had less basal area and volume growthand yield. Crop trees in the ISPA/4 exhibited the greatest growth and yield of diameter,basal area per acre and volume per acre, followed by ISPA/2, then ISPAs. Significant croptree growth responses to the density treatments occurred during the 2nd and 3rd growth peri-ods, but not in the 1st growth period. So compared to the whole stand, density effects on croptree growth appeared later. As for the fertilization treatments, crop tree responses were muchless than the whole stand. ANCOVA tests indicated that the fertilization effect was only sig-nificant on crop tree QMD annual growth during the 2nd growth period and it was not signifi-cant on crop tree yield at any measurement. Compared to the whole stand, crop tree re-sponses to density and fertilization treatments were less in magnitude during the first 12-years of the study. That’s probably because crop trees are dominant trees and they are supe-rior in competing for resources. So the relatively good site quality provides sufficient re-sources for them and they may not need the additional advantage from urea application anddensity treatments.

38
Figure 18: Whole stand growth gains due to fertilization for each growth period and each density treatment
QMD Growth
0
0.1
0~4 (200) 4~8 (400) 8~12 (600)
Growth Period (Cumulative lb of fertilizer)
Diff
eren
ce b
etw
een
fert
an
d un
fert
(in/
year
)
BA Growth
-0.5
0
0.5
1
1.5
2
2.5
0~4 (200) 4~8 (400) 8~12 (600)
Growth period (Cumulative lb of fertilizer)
Diff
eren
ce b
etw
een
fert
an
d un
fert
(sqf
t/acr
e/ye
ar)
Volume Growth
-10
0
10
20
30
40
50
0~4 (200) 4~8 (400) 8~12 (600)
Growth period (Cumulative lb of fertilizer)
Diff
eren
ce b
etw
een
fert
and
un
fert
(cuf
t/acr
e/ye
ar)
ISPA_RepThin ISPA/2_Min ISPA/4_NoThin

39
Figure 19: Whole stand yield gains due to fertilization at establishment, year 4, 8 and 12
QMD Yield
-0.3
-0.1
0.1
0.3
0.5
0.7
0.9
0 (0) 4 (200) 8 (400) 12 (600)
Elapsed year (Cumulative lb of Fertilizer)
Diffe
renc
e be
twee
n fe
rt
and
unfe
rt (i
nch)
BA YIeld
-202468
1012141618
0 (0) 4 (200) 8 (400) 12 (600)Elapsed year (Cumulative lb of Fertilizer)
Diff
eren
ce b
etw
een
fert
an
d un
fert
(sq.
ft/a
cre)
Volume YIeld
-50
0
50
100
150
200
250
300
350
400
0 (0) 4 (200) 8 (400) 12 (600)
Elapsed year (Cumulative lb of fertilizer)
Diffe
renc
e be
twee
n fe
rt an
d un
fert
(cuf
t/acr
e)
ISPA_RepThin ISPA/2_Min ISPA/4_NoThin

40

41
CHAPTER 6. CONCLUSIONS
The objective of this study was to analyze growth and yield response to fertilizationand density treatments in young Douglas-fir stands. Based on previous discussion, now theresearch questions listed in Chapter 2 will be answered as below.
1. Do different density control regimes significantly affect stand growth and yield interms of diameter, basal area, height and cubic foot volume?
Different density control regimes do significantly affect whole stand diameter, basalarea and volume growth and yield, but don’t affect height very much. Initially, thedensest stand had the greatest overall stocking and growth rate. However, accumu-lation in the dense stands is declining with time and the less dense stands are catch-ing or exceeding them.
Density control regime also affected diameter class distribution with less densestands having greater proportions of trees in larger diameter classes.
2. Do repeated urea applications produce significant increases in stand growth andyield in terms of diameter, basal area, height and cubic foot volume?
Across all densities, fertilization produced additional growth and yield in diameter,basal area and cubic foot volume, but not in dominant height. QMD, basal area andvolume growth rates were significantly increased by the first and second ureaapplications but not by the third. In contrast, the first fertilization was insufficient toproduce a significant increase in QMD, basal area per acre or volume per acre;significant increases in these variables were found following the second and thethird applications.
Compared to density treatment, fertilization treatment had less effect on standgrowth and yield.
3. Do significant interactions exist between fertilization and density treatments?
No, no significant interactions were found for all variables tested. However, fertili-zation responses did show different trends among the different density treatmentsover time. Fertilization gains in stand basal area and volume growth and yield weredecreasing with time in denser stands whereas they were increasing in less densestands, but these differences are not statistically significant.
42
4. Do density and fertilization treatments affect stand mortality?
Yes. During the twelve-year study period, mortality increased quickly in denserstands whereas it remained stable in less dense stands. Mortality in fertilized standswas less than unfertilized counterparts
5. Does the crop tree stand component (the 40 largest diameter trees per acre) have thesame response pattern as the whole stand?
Compared to the whole stand, crop trees responded differently to the density treat-ment with crop trees in less dense stands exhibiting greater basal area and volumegrowth and yield. Also crop trees responses to density treatment appeared later.Like in the whole stand, fertilization produced additional crop trees growth andyield, but these gains in crop trees were not statistically significant.

43
REFERENCES
Brix, H. 1993. Fertilization and thinning effect on a Douglas-fir ecosystem at Shawnigan Lake: asynthesis of project results. FRDA Rep. 196. Victoria, BC: Forest Canada, Pacific Forestry Cen-ter; BC ministry of forests, research branch. 64p.
Bruce, D. and Demars, D.J. 1974. Volume equations for second-growth Douglas-fir. Res. Note.PNW-239. Portland, Oregon: USDA Forest Service. PNW station. 5p.
Chappell, H.N.; Omule, S.A.Y. and Gessel, S.D. 1992. Fertilization in coastal northwest forests:using response information in developing stand-level tactics. In Forest fertilization: sustainingand improving nutrition and growth of western forests. Edit by Chappell, H.N.; Weetman, G.F;Miller, R.E. University of Washington, College of Forest Resources, Institute of Forest Resources.Seattle. Contrib. 73. : 98-113.
Crown, M., Quenet, R.V., and Layton, C.R. 1977. Fertilizaiton and thinning effects on a Douglas-firecosystem at Shawnigan Lake. Can. For. Serv Pac. Forest Research Center Inf. Rep. BC-X-152.
Curtis, R.O. and Reukema, D.L. 1970. Crown development and site estimates in a Douglas-firplantation spacing test. Forest Science: 16(3): 287-301.
Curtis, R.O. and Marshall, D.D. 2002. Levels-of-growing-stock cooperative study in Douglas-fir:report no. 14 – Stampede Creek: 30-year results. Res. Pap. PNW-RP-543. Portland, OR: USDAForest Service, PNW station. 77p.
Franklin, J.F. and Dyrness, C.T. 1973. Natural vegetation of Oregon and Washington. Gen Tech.Rep. PNW-8. Porland, OR: USDA Forest Service, PNW station. 417p.
Flewelling, J., Collier, R., Gonyea, B., Marshall, D. and Turnblom, E. 2001. Height-age vurves forplanted stand of Douglas-fir, with adjustments for density. Stand Management Cooperativeworking paper. No.1. 25p.
Gessel, S.P., Stoate, T.N. and Turnbull, K.J. 1965. The growth behavior of Douglas-fir eith nitrog-enous fertilizer in western Washington. Institute of Forest Resources, Contrib. No. 1. Universityof Washington, Seattle. 204p.
Hagglund, B. 1981. Evaluation of forest site productivity. For. Abstr. 42 (11): 515-527
Harrington, C.A. and Reukema, D.L. 1983. Initial shock and long term stand development follow-ing thinning in a Douglas-fir plantation. Forest Science 29 (1): 33-46.
Heilman, P. 1975. Thinning method and response to urea in Douglas-fir. Forest Science. 21 (4): 418-420.
King, J.E. 1966. Site index curves for Douglas-fir in the Pacific Northwest. Weyerhaeuser ForestPaper. 8. Weyerhaeuser Company Research Center, Centralia, Washington. 49p.

44
King, J.E. 1986. Review of Douglas-fir thinning trials. In Douglas-fir: Stand management for thefuture. Edited by C.D.Oliver, D.P. Hanley and J.A. Johnson. College of forest resources, Univer-sity of Washington, Seattle. Contrib. No.55. 258-280.
Lee, Y. J. and Barclay, H. J. 1985. Ten-year growth response of a 25-year-old and a 55-year-oldDouglas-fir. Information report. Pacific Forest Research Center, Canada. BC-X-260, 14p.
Li, Y. Zh. 2005. Effects of Fertilization and Density on Growth and Yield of Young Douglas-firPlantations in the Pacific Northwest. MS thesis. College of Forest Resources, University of Wash-ington, Seattle, WA.
Maguire, D.A, Bennett, W.S., Kershaw, Jr. J. A., Gonyea, R. and Chappell, H. N. 1991. Stand Man-agement Cooperative silviculture project field installations: Establishment report 27p.
McWilliams, E.R.G. and Therien G. 1996. Fertilization and thinning effects on a Douglas-fir ecosys-tem at Shawnigan Lake: 24-year growth response. Canada-British Columbia Partership Agree-ment on Forest Resource Development: FRDA II. FRDA Report 269. 44p
Miller, R.E. and Reukema, D.L. 1977. Urea fertilizer increases growth of 20-year-ole thinned Dou-glas-fir on a poor quality site. Res. Note PNW-291. Portland, OR: USDA Forest Service, PNWstation. 8p.
Miller, R.E. and Tarrant, R.F. 1983. Long-term growth response of Douglas-fir to ammonium ni-trate fertilizer. Forest Science 29:127-137.
Miller, R.E., Barker, P.R., Peterson, C.E. and Webster, S.R. 1986. Using nitrogen fertilizers in man-agement of coastal Douglas-fir I. Regional trends of response. In Douglas-fir: Stand managementfor the future. Edited by C.D.Oliver, D.P. Hanley and J.A. Johnson. College of forest resources,University of Washington, Seattle. Contrib. No.55. 290-303
Miller, R.E.; Hazard, J.W. and Bruce, D. 1991. Response of western Oregon stands to nitrogenfertilizer. Interagency Agreement PNW 88-557. Portland, OR.
Miller, R. E., Obermeyer, E. L. and Anderson, H. W. 1999. Comparative effects of precommercialthinning, urea fertilizer, and red alder in a site II, coast Douglas-fir plantation. Res. Pap. PNW-RP-513. Portland, OR: U.S. Department of Agriculture, Forest Service, PNW Research station.25p.
Miller, R. E., Smith, J. and Anderson, H.W. 2001. Detecting response of Douglas-fir plantations tourea fertilizer at three locations in the Oregon Coast Range. Res. Pap. PNW-RP-533. Portland,OR: USDA, Forest Service, PNW station. 20p.
Peterson, C.E.; Webster, S.R.; Barker, P.R. and Miller, R.E. 1986. Using Nitrogen fertilizers in man-agement of coast Douglas-fir: II future informational needs. In Douglas-fir: Stand managementfor the future. Edited by C.D.Oliver, D.P. Hanley and J.A. Johnson. College of forest resources,University of Washington, Seattle. Contrib. No.55. 304-309.
Reukema, D.L. 1972. Twenty-one-year development of Douglas-fir stands repeatedly thinned atvarying intercals. Res. Pap. PNW-141. Portland, OR: USDA Forest Service, PNW station. 23p.

45
Reukema, D.L. and Bruce, D. 1977. Effects of thinning on yield of Douglas-fir: Concept and someestimates obtained by simulation. Gen. Tech. Rep. PNW-58. Portland, OR: USDA, Forest Ser-vice, PNW station. 36p.
Sjolte-Jorgensen, J. 1967. The influence of spacing in the growth and development of coniferousplantations. Int. Rev. For. Res. 2: 43-94.
Smith, H. J. and Reukema, D. L. 1986. Effects of plantation and juvenile spacing on tree and standdevelopment. In Douglas-fir: Stand management for the future. Edited by C.D.Oliver, D.P. Hanleyand J.A. Johnson. College of forest resources, University of Washington, Seattle. Contrib. No.55.239-245.
Staebler, G.R. 1956. Evidence of shock following thinning of young Douglas-fir. Journal of Forestry.54(5): 339.
Stegemoeller, K.A. and Chappel H.N. 1991. Effects of fertilization and thinning on 8-year growthresponses of second-growth Douglas-fir stands. Canadian Journal of Forest Research. 21: 516-521.
Williamson, R. L. and Curtis, R.O. 1980. Estimating merchantable volumes of second growth Dou-glas-fir stands from total cubic volume and associated stand characteristics. USDA Forest Ser-vice Research Note, PNW-353. 1