effects of detachment and size of particles in totally
TRANSCRIPT

ARTICLE IN PRESS
0378-4371/$ - se
doi:10.1016/j.ph
�CorrespondE-mail addr
Physica A 379 (2007) 595–606
www.elsevier.com/locate/physa
Effects of detachment and size of particles in totallyasymmetric simple exclusion processes
Xian-Qing Yanga,�, Kang Qiua, Wei Zhanga, Lin Rena,Wen-Tao Xua, You-Jin Dengb
aCollege of Science, China University of Mining and Technology, Xuzhou 221008, ChinabDepartment of Physics, New York University, 4 Washington Square Place, New York, NY 10003, USA
Received 15 July 2006; received in revised form 22 January 2007
Available online 16 February 2007
Abstract
In this article, the effects of irreversible detachments of particles in totally asymmetric simple exclusion processes
(TASEPs) with extended particles which occupy more than one lattice site, are investigated. First, an approximate mean-
field theory is used to calculate phase diagrams and density profiles. The results show that the detachment and the size of
the particles have distinct effects on the stationary phases in the two sublattices divided by the detachment, especially in the
mc/hd and the hd/hd phase. Here, symbols ‘‘mc’’, ‘‘hd’’, and ‘‘ld’’ are initials of maximal current, high density, and low
density, respectively, and ‘‘mc/hd’’ represents the stationary state that the left sublattice is in the maximum-current (mc)
phase while the right sublattice is in the high density (hd) phase. When the detachment rate is very large, there are four
stationary phases, including ld/ld, ld/hd, mc/ld, and mc/hd phases. When the value of the detachment rate is in the middle
range, the hd/hd phase occurs, and hence there exist five stationary phases. When the rate is very small, the mc/hd phase
disappears, and there are only four phases again. These theoretical results qualitatively and quantitatively agree with
computer Monte Carlo simulations especially in the case of large value of the detachment rate.
r 2007 Elsevier B.V. All rights reserved.
Keywords: TASEPs; Detachment; Extended particle; Density profile
1. Introduction
In recent years, totally asymmetric simple exclusion processes (TASEPs) have become a subject ofincreasing scientific interest in physics, chemistry and biology [1,2]. They serve as simple models for collectivephenomena ranging from traffic flows to molecular motors [3–7]. The TASEPs are one-dimensional lattice gasmodels where particles move preferentially in one direction and interact only through hard-core exclusion.Despite their simple rules, the TASEPs still exhibit very rich dynamical behavior. Examples include boundaryinduced phase transitions [8], spontaneous symmetry breaking [9,10], and phase segregations [11,12].
e front matter r 2007 Elsevier B.V. All rights reserved.
ysa.2007.01.007
ing author.
ess: [email protected] (X.-Q. Yang).

ARTICLE IN PRESSX.-Q. Yang et al. / Physica A 379 (2007) 595–606596
Recently, systems without particle conservation in the bulk have attracted much attention. In Ref. [13], theeffects of a single detachment or attachment site in the bulk of an asymmetric simple exclusion process wereinvestigated in detail for the transportation of single particles, and complex dynamics were analyzed. In Refs.[14–17], the interplay of the totally asymmetric exclusion process with local absorption/desorption kinetics ofsingle particles acting at all sites, termed ‘‘Langmuir kinetics’’ (LK) was considered. The combined processesof TASEPs and LK show the new feature of a local shock in the density profile of the stationary state. Further,the TASEPs with extended particles that can occupy more than one lattice site have been investigated bymean-field and various continuum approaches [18–22]. The extended particle model is believed to be ofphysical relevance in realistic biological processes such as ribosomes moving along mRNA, large molecules orvesicles moving along filaments or microtubules and RNA translation. For example, ribosomes typically cover10–12 codon sites but move only to one codon at one time. Effects of local inhomogeneity in the TASEPs withextended objects have also been investigated [20].
To our knowledge, the effect of irreversible detachments on dynamics of the TASEPs with extendedobjectives has not been systematically studied yet. In this paper, we present a simple detachment model inwhich the inhomogeneity is at the middle of the lattice. The goal of this work is to investigate the mixed effectof detachments and size of particles on the density profiles in the system of TASEPs. Most of our results willbe derived from mean-field calculations and Monte Carlo simulations. The paper is organized as follows. InSection 2, a model is presented to describe the detachment of TASEPs with extended particles. Section 3summarizes some known results for homogeneous TASEPs with extended particles; some calculations for ourmodel from a simple approximate theory are presented. In Section 4, the associated phase diagrams areobtained by Monte Carlo simulations, and a comparison between the numerical results and the theoreticalpredictions is made. A brief summary is given in Section 5.
2. Model
Consider a chain of N lattice sites with open boundary conditions at both ends and a bunch of identicalparticles of size lX1 moving through the lattice from the left to the right (N is here a large even number). Theparticles, each of which covers lX1 lattice sites, interact through hard-core repulsion. For convenience, weshall locate the position of a particle by its left edge. A particle enters the system from the left with rate a if thefirst l sites are empty, and exits the lattice with rate b if it sits at site N. In the bulk, the particle at site i willalways move to the next site i þ 1 as long as site i þ l is unoccupied. In addition, when a particle is at thespecial site k, which is far away from the boundaries, it will jump off the lattice with rate q, if site k þ 2l � 1 iscovered, otherwise it can jump to the next site with unit rate. In this work, we set k ¼ N=2 (as shown in Fig. 1),and define the particle density as the coverage density. Namely, the density is given by r ¼Ml=N, where M isthe number of the extended particles on the lattice. Here we are mainly interested in the asymptotic behavior inthe limit Nb1; l.
The model reduces to the homogeneous TASEP with extended particles [18] if rate q ¼ 0, the normalTASEP with detachment [13] if size l ¼ 1, and the simple TASEP if q ¼ 0 and l ¼ 1. For the last case, themodel can be investigated analytically by the matrix-product ansatz [1,2].
3. Mean-field approximation
The TASEPs with a local inhomogeneity have been extensively investigated [23–27,29]. In this case, a simplemean-field approximation is found to be rather successful in describing the associated stationary phases.
�
l =31
1 x xq
N2 + 2l-1 N
�
N2
Fig. 1. Model for TASEPs with extended particles and detachment. System with size l ¼ 3 particles is shown. Hopping rate in the bulk is 1
and the detachment rate at special site N=2 is q. Entrance and exit rates are a and b, respectively.

ARTICLE IN PRESSX.-Q. Yang et al. / Physica A 379 (2007) 595–606 597
The mean-field theory involves two plausible assumptions [13,20,28]: the effect of a local inhomogeneity is justto divide the whole system into two coupled TASEPs without defect, and the density correlations between twosublattices can be neglected. Since the above assumptions do not depend on particle sizes, we follow theprocedures in Refs. [13,20,28], and also consider the system as two coupled homogeneous TASEPs withextended particles.
According to Refs. [18,21], there are three stationary phases in the TASEPs with extended particles: themaximal current, entry-limited current, and exit-limited current phases. The latter two are also referred to thelow-density (ld) and the high-density (hd) phases. The steady-state currents J and densities, together with thevalues of entrance rate a and exit rate b, in these stationary phases are described by
�
Maximal-current (mc) phase is in range aX1=ðffiffilpþ 1Þ and bX1=ðffiffilpþ 1Þ, and has
J ¼1
ðffiffilpþ 1Þ2
; r ¼
ffiffilp
ffiffilpþ 1
. (1)
�
High-density (hd) phase is in range a4b and bo1=ðffiffilpþ 1Þ, and hasJ ¼bð1� bÞ
1þ ðl � 1Þb; r ¼ 1� b. (2)
�
Low-density (ld) phase is in range aob and ao1=ðffiffilpþ 1Þ, and hasJ ¼að1� aÞ
1þ ðl � 1Þa; r ¼
al
1þ ðl � 1Þa. (3)
The local inhomogeneity is at site N=2 in the present model, and thus the left sublattice will have theentrance rate a and an effective exit rate beff at site i ¼ N=2, given by
beff ¼ qþ ð1� rN=2þ2l�1Þ, (4)
where rN=2þ2l�1 is the coverage density of site N=2þ 2l � 1. The first term q is the rate for a particle atN=2 to jump off the lattice. The second term describes that a particle will move into the right lattice site withrate 1 as long as sites from N=2þ l to N=2þ 2l � 1 are empty. The probability of this event is equal to1� rN=2þ2l�1, because an empty site at N=2þ 2l � 1 guarantees that sites from N=2þ l to N=2þ 2l � 1 areempty.
If the particles are considered to be uniformly distributed among the whole right sublattice in the steadystate (we expect that neglect of boundary effects will affect the locations of phase diagrams, but does not havequalitative consequences), Eq. (4) then reduces to
beff ¼ qþ 1� rr, (5)
where subscript r represents the right sublattice.Analogously, the right sublattice will have the exit rate b and an effective entrance rate aeff , given by
aeff ¼rl
l, (6)
where rl is the coverage density of the left sublattice in a steady state. The factor 1=l is due to the fact that aparticle covers l lattice sites.
Since each sublattice can have three stationary phases, there are nine potential phases for the wholesystem with irreversible detachment. Nevertheless, since the current on the right sublattice must besmaller than that on the left sublattice due to detachment, the right sublattice cannot reach the mc state.Thus, the three associated phases—the ld/mc, hd/mc, and mc/mc phases, cannot occur. Here, we haveused symbol ‘‘ld/mc’’ to represent that the left (right) sublattice is in the low-density (maximal-current) phase;the same applies to symbols ‘‘hd/mc’’ and ‘‘mc/mc’’. The conditions for the remaining six phases can be

ARTICLE IN PRESSX.-Q. Yang et al. / Physica A 379 (2007) 595–606598
found by using the properties of the TASPs with extended particles and Eqs. (5) and (6). We shall discussthem sequentially:
1.
The high-density/low-density hd/ld phase. Following Refs. [18,21], this phase occurs only ifa4beff ; beff o1ffiffi
lpþ 1
,
aeff ob; aeff o1ffiffi
lpþ 1
. (7)
The particle density rl (rr) on the left (right) sublattice is given by
rl ¼ 1� beff ; rr ¼aeff l
1þ ðl � 1Þaeff
. (8)
Substituting Eq. (8) into Eqs. (5) and (6), we can derive the effective exit rate from the left lattice and theeffective entrance rate to the right lattice as
aeff ¼1
l�
2l þ ðl � 1Þq�
ffiffiffiffiffiffiffiffiffiffiffiffiffiffiffiffiffiffiffiffiffiffiffiffiffiffiffiffiffiffiffiffiffiffiffiffiffiffiffiffiffiffiffiffiffiffiffiffiffiffiffiffiffiffiffiffiffiðl � 1Þ2ðq2 � 4qÞ þ 4ð2l � 1Þ
q
2lðl � 1Þ,
beff ¼2l þ ðl � 1Þqþ
ffiffiffiffiffiffiffiffiffiffiffiffiffiffiffiffiffiffiffiffiffiffiffiffiffiffiffiffiffiffiffiffiffiffiffiffiffiffiffiffiffiffiffiffiffiffiffiffiffiffiffiffiffiffiffiffiffiðl � 1Þ2ðq2 � 4qÞ þ 4ð2l � 1Þ
q
2ðl � 1Þðla1Þ. (9)
With some simple calculations, one finds that Eqs. (7) and (8) do not have any common solution. Thus, weconclude that the hd/ld phase does not occur.
2.
The low-density/low-density (ld/ld) phase. This occurs in rangeao1ffiffi
lpþ 1
; aobeff ,
aeff o1ffiffi
lpþ 1
; aeff ob. (10)
The densities are
rl ¼al
1þ ðl � 1Þa; rr ¼
aeff l
1þ ðl � 1Þaeff
. (11)
From Eqs. (5), (6) and (11), we have the effective entrance aeff and exit rates beff as
aeff ¼a
1þ ðl � 1Þa; beff ¼ qþ 1�
al
1þ 2ðl � 1Þa. (12)
Using conditions (10), the parameter ranges for ld/ld phase for a given value of q can be given by
ao1ffiffi
lpþ 1
; b4a
1þ ðl � 1Þa. (13)
3.
The low-density/high-density (ld/hd) phase. It hasao1ffiffi
lpþ 1
; aobeff ,
aeff 4b; bo1ffiffi
lpþ 1
. (14)
The densities are
rl ¼al
1þ ðl � 1Þa; rr ¼ 1� b, (15)

ARTICLE IN PRESSX.-Q. Yang et al. / Physica A 379 (2007) 595–606 599
and the effective entrance and exit rates are
aeff ¼a
1þ ðl � 1Þa; beff ¼ qþ b. (16)
The existence conditions are given by
aoqþ b; ao1ffiffi
lpþ 1
,
boa
1þ ðl � 1Þa; bo
1ffiffilpþ 1
. (17)
Therefore, the ld/hd phase is in the region of ao1=ðffiffilpþ 1Þ and boa=ð1þ ðl � 1ÞaÞ.
4.
The mc/ld phase occurs if (according to Refs. [18,21])a41ffiffi
lpþ 1
; beff 41ffiffi
lpþ 1
,
aeff o1ffiffi
lpþ 1
; aeff ob. (18)
The densities are
rl ¼
ffiffilp
ffiffilpþ 1
; rr ¼aeff l
1þ ðl � 1Þaeff
. (19)
Substituting Eq. (19) into Eqs. (5) and (6) yields the effective entrance and exit rates
aeff ¼1ffiffi
lpðffiffilpþ 1Þ
; beff ¼ qþ 1�l
2l � 1þffiffilp . (20)
Finally, the parameter ranges for the mc/ld phase is given by
a41ffiffi
lpþ 1
; b41ffiffi
lpðffiffilpþ 1Þ
, (21)
for any given value of q.
5. The mc/hd phase is given bya41ffiffi
lpþ 1
; beff 41ffiffi
lpþ 1
,
aeff 4b; bo1ffiffi
lpþ 1
, (22)
with densities profiles
rl ¼
ffiffilp
ffiffilpþ 1
; rr ¼ 1� b. (23)
Using Eqs. (5) and (6), we obtain
aeff ¼1ffiffi
lpðffiffilpþ 1Þ
; beff ¼ qþ b. (24)
This phase condition can be obtained by performing similar calculations. The mc/hd phase exists in thefollowing region:
1ffiffilpþ 1� qobo
1ffiffilpðffiffilpþ 1Þ
; a41ffiffi
lpþ 1
. (25)
According to the above inequalities, when q41=ðffiffilpþ 1Þ, the mc/hd phase occur for a41=ð
ffiffilpþ 1Þ and
0obo1=ffiffilpðffiffilpþ 1Þ, and when 1=lððl þ 1Þ=ð
ffiffilpþ 1Þ � 1Þoqo1=ð
ffiffilpþ 1Þ, the mc/hd phase only exists in

ARTICLE IN PRESSX.-Q. Yang et al. / Physica A 379 (2007) 595–606600
the region of a41=ðffiffilpþ 1Þ and 1=ð
ffiffilpþ 1Þ � qobo1=
ffiffilpðffiffilpþ 1Þ. But, when the value of q is smaller than
1=lððl þ 1Þ=ðffiffilpþ 1Þ � 1Þ, there is no mc/hd phase in the phase diagram.
6.
The high-density/high-density (hd/hd) phase is described bya4beff ; beff o1ffiffi
lpþ 1
,
aeff 4b; bo1ffiffi
lpþ 1
(26)
and
rl ¼ 1� beff ; rr ¼ 1� b. (27)
Substituting this last equation into Eqs. (5) and (6) yields the effective entrance and exit rates
aeff ¼1� q� b
l; beff ¼ qþ b. (28)
Comparing these expressions with the inequalities (26), we obtain the conditions of the hd/hd phase asfollowing. For ao1=ð
ffiffilpþ 1Þ
a4q; boa� q, (29)
while for a41=ðffiffilpþ 1Þ
bo1� q
l þ 1,
bo1ffiffi
lpþ 1� q. (30)
The inequalities (29) and (30) determine the conditions for the existence of the hd/hd phase. Accordingto the inequalities (30), the hd/hd phase exists only for qo1=ð
ffiffilpþ 1Þ. But for the exit rate b, there
are two possibilities. When ð1� qÞ=ðl þ 1Þ41=ðffiffilpþ 1Þ � q is satisfied, inequalities bo1=ð
ffiffilpþ 1Þ � q
and q41=lððl þ 1Þ=ðffiffilpþ 1Þ � 1Þ are obtained. However, if ð1� qÞ=ðl þ 1Þo1=ð
ffiffilpþ 1Þ � q is satisfied,
there are inequalities boð1� qÞ=ðl þ 1Þ and qo1=lððl þ 1Þ=ðffiffilpþ 1Þ � 1Þ. Therefore the hd/hd phase
appear in the following region, depending on the value of q. The hd/hd phase occurs for boa� q
in the case of ao1=ðffiffilpþ 1Þ; and for a41=ð
ffiffilpþ 1Þ and bo1=ð
ffiffilpþ 1Þ � q if the inequality 1=lððl þ
1Þ=ðffiffilpþ 1Þ � 1Þoqo1=ð
ffiffilpþ 1Þ is satisfied; and for a41=ð
ffiffilpþ 1Þ and boð1� qÞ=ðl þ 1Þ if
qo1=lððl þ 1=ðffiffilpþ 1Þ � 1Þ is met. However if q41=ð
ffiffilpþ 1Þ, there is no hd/hd phase in the phase
diagram.
In summary, the phase diagrams of the model in Section 2 depend both on the detaching rate q and theparticle size l. If q41=ð
ffiffilpþ 1Þ, there are four stationary phases: the mc/ld, mc/hd, ld/ld, and ld/hd phases; the
hd/hd phase does not occur. When 1=lððl þ 1Þ=ðffiffilpþ 1Þ � 1Þoqo1=ð
ffiffilpþ 1Þ, the hd/hd phase emerges, and
there are five stationary phases in total.When qo1=lððl þ 1Þ=ð
ffiffilpþ 1Þ � 1Þ is satisfied, the mc/hd phase cannot occur, there remains four phases.
Nevertheless, we notice that the situation 1=ðffiffilpðffiffilpþ 1ÞÞoboð1� qÞ=ðl þ 1Þ is allowed, where both the mc/ld
and the hd/hd phases are given by the above mean-field theory. Thus, the approximate method cannot bevalid. This is a consequence of neglect of boundary correlations; namely, we have simply substituted thecoverage density on boundaries by the bulk density in the above calculations. In reality, when the value of thedetaching rate q is very small, the coverage density near the local inhomogeneity is larger than that in the bulkof the sublattice, therefore the deviations may be resulted in. In case of qo1=lððl þ 1Þ=ð
ffiffilpþ 1Þ � 1Þ, the
condition bo1=ðffiffilpþ 1Þ is satisfied, therefore there is a hd phase in the right sublattice. In the left sublattice,
when the particle is on the site N=2, it must make l jumps with rate q and one jump with rate 1, because thedensity in the right sublattice is high. The effective probability for the particle to jump off per time step isbq ¼ ðlqþ 1Þ=ðl þ 1Þ. The condition qo1=lððl þ 1Þ=ð
ffiffilpþ 1Þ � 1Þ yields bqo1=ð
ffiffilpþ 1Þ, therefore the hd phase

ARTICLE IN PRESSX.-Q. Yang et al. / Physica A 379 (2007) 595–606 601
appears in the left sublattice. Thus, in the region of 1=ðffiffilpðffiffilpþ 1ÞÞoboð1� qÞ=ðl þ 1Þ under the condition
qo1=lððl þ 1Þ=ðffiffilpþ 1Þ � 1Þ, there is the hd/hd phase in the phase diagram.
4. Monte Carlo simulations
In order to test the predictions of the mean-field theory, we performed Monte Carlo simulations for a chainof N ¼ 3000 lattice sites with particle size l ¼ 3. The random sequential updating is used. In each Monte Carlostep (MCs), there is a pool containing M particles plus a free particle, where M is the number of the extendedparticles on the lattice before this MCs is updated. The M þ 1 particles are chosen at random. If a particle onthe normal lattice is selected, it attempt to move forward. But if a particle on the lattice site N=2 is chosen, itcan jump completely into the right subsystem with unit rate if the site N=2þ 2l � 1 is not covered, otherwise itdetaches from the lattice with rate q and if a particle is free, it can enter the lattice at left end with rate a if thefirst l sites are empty. Simulations are begun with an empty lattice and run until steady states are reached. Inthe process of simulations the steady states are reached after 4� 107 MCs. And density profiles are obtainedby averaging over every 100 MCs in additional 2� 106 MCs after steady states are attained.
According to the mean-field theory discussed earlier, the phase diagram of the present model depends ondetaching rate q. For instance, for q41=ð
ffiffilpþ 1Þ, there exist four stationary phases. For l ¼ 3, the inequality
q41=ðffiffilpþ 1Þ implies q40:366. Simulations were performed with l ¼ 3, N ¼ 3000, and q ¼ 0:7. The density
profiles are shown in Fig. 2, in which the solid lines correspond to the mean-field predictions. This confirms themean-field calculations.
Fig. 3 shows the density profiles calculated by the approximate approach and those obtained by MonteCarlo simulations with the same parameter values of Fig. 2. The ld/ld, mc/hd, mc/ld, and ld/hd phases arepresented in Fig. 3(a)–(d), respectively. As shown in Fig. 3, it is found that an excellent qualitative andquantitative agreement between the theoretical results and Monte Carlo simulations, has been obtained. InFig. 3(a) and (c), we also observe that the density profiles split into approximately two branches near the rightedge of the system. This phenomenon has also been obtained in the TASEPs with particles of arbitrary size inRefs. [18,21]. Especially, the bifurcation can also be observed near the right of the left sublattice in the mc/hddensity profile, as shown in Fig. 3(b).
The decrease of the value of q causes another phase, i.e., the hd/hd phase in the phase diagram, as shown inFig. 4. When the value of the detaching rate q is smaller than 1=ð
ffiffilpþ 1Þ, and larger than
1=lððl þ 1Þ=ðffiffilpþ 1Þ � 1Þ, i.e., 1=lððl þ 1Þ=ð
ffiffilpþ 1Þ � 1Þ ¼ 0:155oqo1=ð
ffiffilpþ 1Þ ¼ 0:366, according to the
above theoretical results, the hd/hd phase exists in the region where when ao1=ðffiffilpþ 1Þ ¼ 0:366, boa� q,
however when a41=ðffiffilpþ 1Þ ¼ 0:366, bo1=ð
ffiffilpþ 1Þ � q. The Monte Carlo simulations show an excellent
0.0 0.2 0.4 0.6 0.8 1.00.0
0.2
0.4
0.6
0.8
1.0
β
α
q=0.7,N=3000, l=3
ld/ld
ld/hd
mc/ld
mc/hd
Fig. 2. Phase diagram for the TASEPs with extended particles and irreversible detachments for q41=ðffiffilpþ 1Þ. The points correspond to
the phase transition boundaries obtained by Monte Carlo simulations, and the lines are derived from an approximate method.
ARTICLE IN PRESS
0 500 1000 1500 2000 2500 30000.0
0.5
1.0
1.5
2.0
ρ (i)
i
ld phase
hd phase
0 500 1000 1500 2000 2500 30000.00.10.20.30.40.50.60.70.80.91.0
ld phaseρ (i)
i
0 500 1000 1500 2000 2500 30000.0
0.2
0.4
0.6
0.8
1.0
1.2
1.4
ρ (i)
i
hd phase
0 500 1000 1500 2000 2500 30000.0
0.2
0.4
0.6
0.8
1.0
ρ (i)
i
α=0.2, β=0.1, q=0.7, l=3, N=3000 α=0.2, β=0.8, q=0.7, l=3, N=3000
α=0.8,β=0.1,q=0.7,l=3,N=3000 α=0.8,β=0.8,q=0.7,l=3,N=3000
ld phase
mc phase
a b
c d
ld phase
mc phase
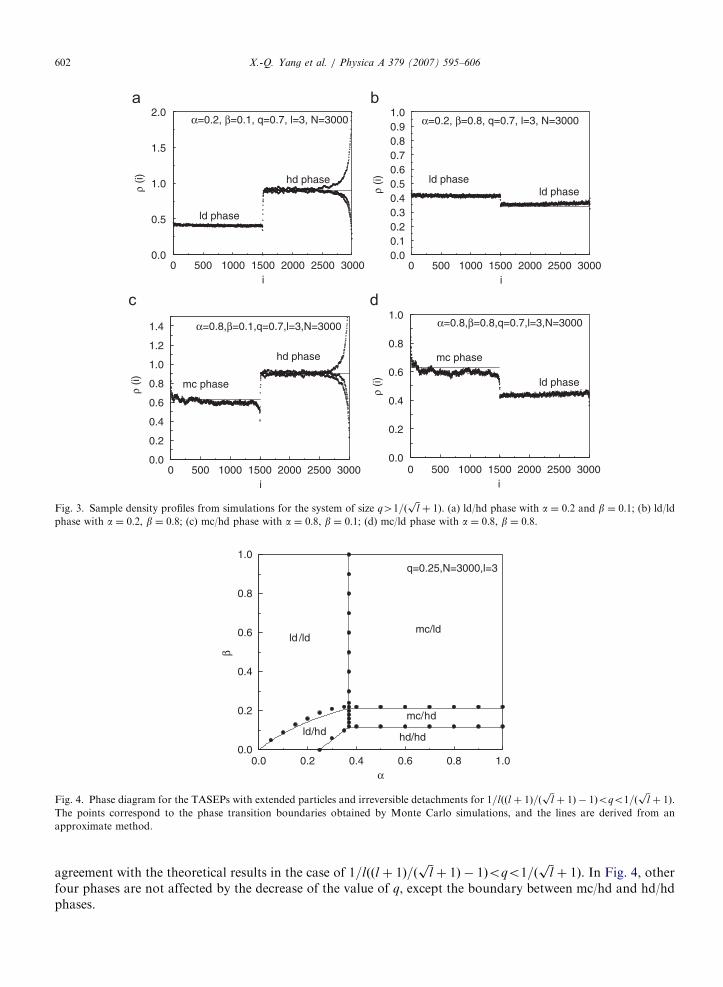
Fig. 3. Sample density profiles from simulations for the system of size q41=ðffiffilpþ 1Þ. (a) ld/hd phase with a ¼ 0:2 and b ¼ 0:1; (b) ld/ld
phase with a ¼ 0:2, b ¼ 0:8; (c) mc/hd phase with a ¼ 0:8, b ¼ 0:1; (d) mc/ld phase with a ¼ 0:8, b ¼ 0:8.
0.0 0.2 0.4 0.6 0.8 1.00.0
0.2
0.4
0.6
0.8
1.0
mc/hd
ld /ld
ld/hd hd/hd
mc/ld
β
α
q=0.25,N=3000,l=3
Fig. 4. Phase diagram for the TASEPs with extended particles and irreversible detachments for 1=lððl þ 1Þ=ðffiffilpþ 1Þ � 1Þoqo1=ð
ffiffilpþ 1Þ.
The points correspond to the phase transition boundaries obtained by Monte Carlo simulations, and the lines are derived from an
approximate method.
X.-Q. Yang et al. / Physica A 379 (2007) 595–606602
agreement with the theoretical results in the case of 1=lððl þ 1Þ=ðffiffilpþ 1Þ � 1Þoqo1=ð
ffiffilpþ 1Þ. In Fig. 4, other
four phases are not affected by the decrease of the value of q, except the boundary between mc/hd and hd/hdphases.

ARTICLE IN PRESSX.-Q. Yang et al. / Physica A 379 (2007) 595–606 603
Fig. 5 shows the density profiles derived from the mean-field theory and computer simulations for q ¼ 0:25.As shown in Fig. 5, an excellent agreement has been obtained between the theoretical results and the computersimulations. Only differences can be observed in the region near the boundaries and the special site N=2 fromwhich irreversible detachments may occur. There are two reasons to induce these consequences. One is that thedensity profiles on the boundaries cannot be replaced by the bulk density of the sublattice in the approximatemethod. For example, as shown in Fig. 5(b), there is a larger difference in density profile in the ld/ld phase,especially on the right sublattice; the other is that the mean-field theory neglects the correlations especially
0 500 1000 1500 2000 2500 30000.0
0.3
0.6
0.9
1.2
1.5
ρ (i)
i
hd phase
0 500 1000 1500 2000 2500 30000.0
0.2
0.4
0.6
0.8
1.0
ld phaseρ (i)
i
0 500 1000 1500 2000 2500 30000.0
0.5
1.0
1.5
2.0
hd
hd
ρ (i)
i
0 500 1000 1500 2000 2500 30000.2
0.4
0.6
0.8
1.0
1.2
ρ (i)
i
hd phase
0 500 1000 1500 2000 2500 30000.2
0.4
0.6
0.8
1.0
ρ (i)
i
mc phase
ld phase
ld phase
α=0.2,β=0.1,q=0.25,l=3,N=3000
ld phase
α=0.2,β=0.8,q=0.25,l=3,N=3000
α=0.8,β=0.16,q=0.25,l=3,N=3000
mc phase
α=0.8,β=0.05,q=0.25,l=3,N=3000
α=0.8,β=0.8,q=0.25,l=3,N=3000
a b
c d
e
Fig. 5. Sample density profiles from simulations for 1=lððl þ 1Þ=ðffiffilpþ 1Þ � 1Þoqo1=ð
ffiffilpþ 1Þ. (a) ld/hd phase with a ¼ 0:2, b ¼ 0:1; (b)
ld/ld phase with a ¼ 0:2, b ¼ 0:8; (c) hd/hd phase with a ¼ 0:8, b ¼ 0:1; (d) mc/hd phase with a ¼ 0:8, b ¼ 0:16; (e) mc/ld phase with
a ¼ 0:8, b ¼ 0:8.

ARTICLE IN PRESSX.-Q. Yang et al. / Physica A 379 (2007) 595–606604
near the special site N=2. The correlations usually have significant effects on the density profiles, and in realsystem determine the behavior of the system. Moreover, about two branches have been observed near the rightboundary of both the right and the left sublattice when there is the hd phase in the corresponding sublattice, asshown in Fig. 5(a), (c) and (d). Particularly, bifurcation can even be observed near the right boundary of theleft sublattice when the mc/hd phase occurs in the system, as shown in Fig. 5(d).
Further decrease of the value of q induces decrease of the number of phases. Fig. 6 shows the phase diagramin the case of qo1=lððl þ 1Þ=ð
ffiffilpþ 1Þ � 1Þ ¼ 0:155. As shown in Fig. 6, we can observe that the mc/hd phase in
the phase diagram disappears and only four stationary phases can be obtained. The approximate theory givesan incompatible results which both the mc/hd and the hd/hd phases are in the region of a41=ð
ffiffilpþ 1Þ and
1=ffiffilpðffiffilpþ 1Þoboð1� qÞ=ðl þ 1Þ, and the boundary of the phase ld/hd calculated by the theoretical method is
also different from the simulation results, as shown in Fig. 6. In fact, in the region of 1=ffiffilpðffiffilpþ 1Þoboð1�
0.0 0.2 0.4 0.6 0.8 1.00.0
0.2
0.4
0.6
0.8
1.0
β
α
q=0.1,N=3000,l=3
mc/ldld/ld
hd/hdld/hd
Fig. 6. Phase diagram for the TASEPs with extended particles and irreversible detachments for qo1=lððl þ 1Þ=ðffiffilpþ 1Þ � 1Þ. The points
correspond to the phase transition boundaries obtained by Monte Carlo simulations, and the lines are derived from an approximate
method.
0 500 1000 1500 2000 2500 30000.0
0.2
0.4
0.6
0.8
1.0
1.2
ρ (i)
i
hdhd
α=0.7,β=0.24,q=0.05,L=3000,l=3
Fig. 7. The hd/hd phase from simulations for qo1=lððl þ 1Þ=ðffiffilpþ 1Þ � 1Þ and 1=
ffiffilpðffiffilpþ 1Þoboð1� qÞ=ðl þ 1Þ.

ARTICLE IN PRESS
0 500 1000 1500 2000 2500 30000.0
0.2
0.4
0.6
0.8
1.0
ρ (i)
i
Shock phase
ld phase
α=0.3,β=0.2,q=0.7,l=3,N=3000
Fig. 8. Sample density profiles near the transition from the ld/hd to the ld/ld phase. The transition is expected to occur at b ¼ 0:1875. Thedensity profile is a shock wave in the right of the system which is the first-order transition.
X.-Q. Yang et al. / Physica A 379 (2007) 595–606 605
qÞ=ðl þ 1Þ under the condition qo1=lððl þ 1Þ=ðffiffilpþ 1Þ � 1Þ, there is the hd/hd phase in the phase diagram, as
shown in Fig. 7. The hd/hd phase is also predicted by a simple approximate method, as discussed above.In the process of simulations, there are two types of phase transitions in the system. One is the first-order
phase transitions involving a jump in the particle density in one of the sublattice, the first-order phaseboundaries are those between ld/ld and ld/hd, between ld/hd and hd/hd, and between mc/ld and mc/hd; Otheris the second-order phase transitions whose density profiles change continuously, such as boundaries betweenld/ld and mc/ld phases, between mc/hd and hd/hd phases, and between mc/hd and ld/hd phases. For the first-order phase transition, the transition lines are easily found. But, for the second-order phase transition, thephase transitions are difficultly confirmed and identified as follows. For example, the transition between theld/hd phase and the ld/ld phase is expected to produce a shock wave in the right half of the system, as shown inFig. 8. Similarly, the other phase boundaries can be determined in this way. Visual inspection of the densityprofiles allows the transition lines to be located within about 0.02 units. As shown in Figs. 2, 4 and 6, thesephase boundaries obtained from Monte Carlo simulations accord with theoretically calculated boundaries,although there are small deviations at the first-order phase boundaries and in the case of small value of q.
5. Conclusions
We have investigated the effect of irreversible detachments in totally asymmetric simple exclusion processeswith extended particles. The local inhomogeneity is set at the site N=2, which is far away from the boundaries.Based on the assumptions that the local inhomogeneity divides the lattice into two coupled totally asymmetricsimple exclusion processes without the local defect and that density correlations near the boundary betweentwo sublattices are neglected, we define the effective entrance rate aeff and the exit rate beff , and obtain twohomogeneous totally simple exclusion process with extended particles.
The low-density, the high-density, and the maximal-current phases have been obtained in the TASEPs withextended particles, therefore the detachment may induce nine possible stationary phases in the TASEPs withextended particles. However, three phases, such as the ld/mc, the hd/mc and the mc/mc phases cannot occurdue to the fact that the particle current in the right sublattice cannot reach its maximal value because of theeffects of the detachment. Furthermore, the approximate theory also indicates that the hd/ld phase cannotexist. The steady phases in the phase diagram depend on the detaching rate q and the size of the particles l.When the rate q is larger than 1=ð
ffiffilpþ 1Þ, i.e., q41=ð
ffiffilpþ 1Þ, there are just four stationary phases, such as ld/
ld, mc/ld, ld/hd and mc/hd phases. Decreasing the value of q results in the occurrence of the hd/hd phase,therefore there are total five stationary phases in the phase diagram. However, when qo1=lððl þ 1Þ=ðffiffilpþ 1Þ � 1Þ, the mc/hd phase disappears, only four phases exist in the phase diagram. The approximate

ARTICLE IN PRESSX.-Q. Yang et al. / Physica A 379 (2007) 595–606606
theory can excellently explain the Monte Carlo simulations, except the case of qo1=lððl þ 1Þ=ðffiffilpþ 1Þ � 1Þ. In
the case of qo1=lððl þ 1Þ=ðffiffilpþ 1Þ � 1Þ, these differences between the theoretical results and computer
simulations may be caused by substituting the coverage density of the boundary in the sublattice for the bulkdensity of the sublattice in the steady state in the process of deriving the boundary conditions. When the valueof the detaching rate q is very small, the coverage density near the local inhomogeneity is larger than that inthe bulk sublattice, hence results in the deviations. The systematical errors from the mean-field theory may beeliminated by finite-segment mean-field theory (FSMFT) [29]. Moreover, the hydrodynamic method forTASEPs with l41 investigated in Ref. [22] can also be extended to our model. Those can be explored in thefuture.
Compared with the known results, we find that the detachment and size of the particles leads to distincteffects in the TASEPs. In the TASEPs with l ¼ 1, the occurrence of the hd/hd phase depends on the value of q
[13]. For q4 12, the hd/hd phase does not appear and there are only four phases, while for qo 1
2, the hd/hd
phase is added. But for la1, not only the mc/hd phase but also the hd/hd phase can be determined by thedetachment. Obviously, for l ¼ 1, the results obtained in the paper can accord with the previous results,because of 1=lððl þ 1Þ=ð
ffiffilpþ 1Þ � 1Þ ¼ 0 and the detachment rate must be positive. In addition, for l !1, the
expression 1=lððl þ 1Þ=ðffiffilpþ 1Þ � 1Þ ! 0, the stationary phases in the phase diagram are expected to the same
as those for l ¼ 1. This situation should be further investigated.
References
[1] B. Derrida, Phys. Rep. 301 (1998) 65.
[2] G.M. Schutz, Integrable stochastic many-body systems, in: C. Domb, J. Lebowitz (Eds.), Phase Transitions and Critical Phenomena,
vol. 19, Academic, London, 2000.
[3] D. Chowdhury, L. Santen, A. Schadschneider, Phys. Rep. 329 (2000) 199.
[4] T. Chou, Phys. Rev. Lett. 80 (1998) 85.
[5] M.J. Schnitzer, K. Visscher, S.M. Block, Nat. Cell Biol. 2 (2000) 718.
[6] M.E. Fisher, A.B. Kolomeisky, Proc. Natl. Acad. Sci. USA 98 (2001) 7748.
[7] A.B. Kolomeisky, M.E. Fisher, Physica A 279 (2000) 1.
[8] J. Krug, Phys. Rev. Lett. 67 (1992) 1882.
[9] M.R. Evans, Y. Kafri, H.M. Koduvely, D. Mukamel, Phys. Rev. Lett. 80 (1998) 425.
[10] M.R. Evans, D.P. Foster, C. Godreche, D. Mukamel, J. Stat. Phys. 80 (1995) 69.
[11] Y. Kafri, E. Levine, D. Mukamel, G.M. Schutz, J. Torok, Phys. Rev. Lett. 89 (2002) 035702.
[12] Y. Kafri, E. Levine, D. Mukamel, G.M. Schutz, R.D. Willmann, Phys. Rev. E 68 (2003) 035101.
[13] N. Mirin, A.B. Kolomeisky, J. Stat. Phys. 110 (2003) 811.
[14] A. Parmeggiani, T. Franosch, E. Frey, Phys. Rev. Lett. 90 (2003) 086601;
A. Parmeggiani, T. Franosch, E. Frey, Phys. Rev. E 70 (2004) 046101.
[15] V. Popkov, A. Rakos, R.D. Willmann, A.B. Kolomeisky, G.M. Schutz, Phys. Rev. E 67 (2003) 066117.
[16] M. Evans, R. Juhasz, L. Santen, Phys. Rev. E 68 (2003) 026117;
R. Juhasz, L. Santen, J. Phys. A: Math. Gen. 37 (2004) 3933.
[17] R. Lipowsky, S. Klumpp, T.M. Nieuwenhuizen, Phys. Rev. Lett. 87 (2001) 108101;
S. Klumpp, R. Lipowsky, J. Stat. Phys. 113 (2003) 233.
[18] G. Lakatos, T. Chou, J. Phys. A: Math. Gen. 36 (2003) 2027.
[19] L.B. Shaw, R.K.P. Zia, K.H. Lee, Phys. Rev. E 68 (2003) 021910.
[20] L.B. Shaw, A.B. Kolomeisky, K.H. Lee, J. Phys. A: Math. Gen. 37 (2004) 2105.
[21] L.B. Shaw, J.P. Sethna, K.H. Lee, Phys. Rev. E 70 (2004) 021901.
[22] G. Schonherr, G.M. Schutz, J. Phys. A 37 (2004) 8215.
[23] G. Tripathy, M. Barma, Phys. Rev. E 58 (1998) 1911.
[24] J. Krug, Braz. J. Phys. 30 (2000) 97.
[25] K.M. Kolwankar, A. Punnoose, Phys. Rev. E 61 (2000) 2453.
[26] C. Enaud, B. Derrida, Europhys. Lett. 66 (2004) 83.
[27] R.J. Harris, R.B. Stinchcombe, Phys. Rev. E 70 (2004) 016108.
[28] A.B. Kolomeisky, J. Phys. A 31 (1998) 1153.
[29] T. Chou, G. Lakatos, Phys. Rev. Lett. 93 (2004) 198101.