effects of body size and lifestyle on evolution of … of body size and lifestyle on evolution of...
TRANSCRIPT

Effects of body size and lifestyle onevolution of mammal life historiesRichard M. Sibly*†‡ and James H. Brown‡§¶
*School of Biological Sciences, University of Reading, Reading RG6 6AS, United Kingdom; †Centre for Integrated Population Ecology, Roskilde University,Universitetsvej 1, P.O. Box 260, DK-4000 Roskilde, Denmark; §Department of Biology, University of New Mexico, Albuquerque, NM 87131; and ¶Santa FeInstitute, 1399 Hyde Park Road, Santa Fe, NM 87501
Contributed by James H. Brown, August 17, 2007 (sent for review July 26, 2007)
It has recently been proposed that life-history evolution is subjectto a fundamental size-dependent constraint. This constraint limitsthe rate at which biomass can be produced so that production perunit of body mass is inevitably slower in larger organisms than insmaller ones. Here we derive predictions for how changes in bodysize and production rates evolve in different lifestyles subject tothis constraint. Predictions are tested by using data on the mass ofneonate tissue produced per adult per year in 637 placentalmammal species and are generally supported. Compared withterrestrial insectivores with generalized primitive traits, mammalsthat have evolved more specialized lifestyles have divergent mass-specific production rates: (i) increased in groups that specialize onabundant and reliable foods: grazing and browsing herbivores(artiodactyls, lagomorphs, perissodactyls, and folivorous rodents)and flesh-eating marine mammals (pinnipeds, cetaceans); and (ii)decreased in groups that have lifestyles with reduced death rates:bats, primates, arboreal, fossorial, and desert rodents, bears,elephants, and rhinos. Convergent evolution of groups with similarlifestyles is common, so patterns of productivity across mammaliantaxa reflect both ecology and phylogeny. The overall result is thatgroups with different lifestyles have parallel but offset relation-ships between production rate and body size. These results shedlight on the evolution of the fast–slow life-history continuum,suggesting that variation occurs along two axes corresponding tobody size and lifestyle.
allometry � production rate � metabolic ecology � fast-slow
L ife history attributes vary with body size (1–3). Small organ-isms typically are highly productive, live fast, and die young
(4). Mass-specific rates of metabolism and production scale as
R � R1M�b, [1]
where R1 is a normalization constant, M is body mass, and b isan exponent that is generally between 1/4 and 1/3 in mammals(e.g., refs. 5–8). When data for production rates of mammals areplotted on logarithmic axes (Fig. 1A), the general scaling rela-tionship predicted by Eq. 1 is observed, but some groups, suchas bats, primates, artiodactyls, and whales, contribute substantialvariation by having rates consistently lower or higher than themajority. More generally, certain taxonomic and functionalgroups can be characterized by having normalization constantsfor mass-specific life-history traits that apparently reflect adap-tive changes during the evolutionary history of lineages. Here weinterpret these divergences in terms of natural selection. Webegin by deriving predictions for how mammals are expected toevolve if subject to a size-dependent constraint on production.These predictions are then tested by using the largest availabledata set on the life-history attributes of the eutherian mammals.
Theory of Evolution Under a Production ConstraintLife-history evolution is subject to a fundamental size-dependent constraint (9). This constraint limits the rate at whichbiomass can be produced so that production per unit body mass(termed specific production rate hereafter) is inevitably slower
in larger organisms than in smaller ones. The constraint isthought to be the result of limitations on the ways bodies can bedesigned (4, 10, 11). Because their specific production rate ishigher, smaller animals produce offspring faster than larger onesand so would always be selected if all sizes had the same deathrates. However, there are situations in which larger body size isadvantageous (9), and this has allowed the evolution of largerbody sizes, which has been a general trend in the evolution of themammals [Cope’s rule (12)].
Within this general framework, some evolutionary changes tobody design and production rate are possible. How do thesecome about? Natural selection favors heritable innovations thatincrease birth rates and decrease death rates (9). The outcomeof such an adaptive innovation would be the evolution of apopulation with a substantially higher or lower normalizationconstant but a similar exponent, b, for the allometry of mass-specific production rate in Eq. 1. On the one hand, birth ratesdirectly depend on rates of biomass production, so they may beincreased by adaptations to exploit more abundant or reliablefood resources. On the other hand, death rates can be reducedby adaptations that affect mortality either directly, or indirectlythrough changes in ecology. An example of the former would bethe acquisition of defensive spines or armor. An example of thelatter would be adoption of a volant, arboreal, or fossoriallifestyle, which has the effect of reducing susceptibility to thenormal predators of surface-dwelling mammals.
We shall refer to a suite of functionally interrelated traits asa lifestyle. The lifestyle traits may be ecological attributesaffecting birth rates through trophic relations or affecting deathrates through risk of predation, together with anatomical andphysiological attributes affecting resource allocation to fitnesscomponents (i.e., reproduction, growth, and survival). So, life-styles and their associated life history attributes should reflectboth the phylogenetic histories of lineages and the ecologicalconditions that shaped their adaptations.
If the above innovations in ecology or nutritional physiologyare advantageous, they can give rise to a new adaptive radiation,with speciation and diversification in body size and other at-tributes to exploit the new lifestyle. Diversication of body size,however, will still be subject to the fundamental size-dependentproduction constraint described above.
Transient effects of adaptive changes that increase productionor decrease mortality are increased fitness and populationgrowth. After adaptive changes have occurred, though, birth and
Author contributions: R.M.S. and J.H.B. designed research; R.M.S. and J.H.B. performedresearch; R.M.S. and J.H.B. analyzed data; and R.M.S. and J.H.B. wrote the paper.
The authors declare no conflict of interest.
Abbreviation: GLM, General Linear Model.
See Commentary on page 17565.
‡To whom correspondence may be addressed. E-mail: [email protected] [email protected].
This article contains supporting information online at www.pnas.org/cgi/content/full/0707725104/DC1.
© 2007 by The National Academy of Sciences of the USA
www.pnas.org�cgi�doi�10.1073�pnas.0707725104 PNAS � November 6, 2007 � vol. 104 � no. 45 � 17707–17712
EVO
LUTI
ON
SEE
COM
MEN
TARY

death rates are adjusted by ‘‘ecological compensation’’ (13, 14),so that population growth rate returns to zero. The mechanismsby which this occurs are the subject of population ecology (see,e.g., ref. 15) and do not concern us here. However, it is importantfor our arguments that ecological compensation does not negatethe initial adaptive changes in vital rates. This assumption is validif the adaptive change in lifestyle permanently changes eitherproduction or mortality rate, and then the ecological compen-sation subsequently adjusts the opposing rate so that the pop-ulation growth rate returns to zero.
Here we provide a quantitative analysis and adaptive inter-pretation of the allometric scaling of mass-specific production ineutherian mammals. Based on the above theory and ref. 9, wemake the following specific predictions:
1. Allometric equations fitted to mammals grouped by lifestylewill have generally similar slopes but may have different
normalization constants. The regressions for certain groupswill be displaced from each other as predicted below.
2. Insectivores will exhibit intermediate relationships. This isbecause they include the most ancient surviving eutherianmammal lineage, and most representatives retain primitivetraits of the ancestral stocks from which other eutheriangroups have evolved. Consequently, insectivores can beviewed as a baseline from which to assess the adaptivedisplacements of other groups, toward both higher and lowerproduction rates, as discussed below. Fissiped carnivoresshould have similarly intermediate production rates, becausemost representatives are relatively unspecialized flesh eatersof generalized body form.
3. Compared with insectivores, grazing and browsing herbivoresshould have higher normalizations, resulting in higher pro-duction rates than most other mammals of comparable size.This is because the various morphological, physiological, andecological adaptations that allowed these mammals to ac-quire, ingest, and digest green vegetation gave access to anabundant and generally reliable food resource that could fuelhigh rates of production.
4. Similarly, marine mammals should have high rates of pro-duction, because invasion of the marine realm made availableabundant, reliable, high-quality food resources in the form offish and invertebrates. Normalizations for pinniped carni-vores (seals, sea lions, and walruses) and both odontocete(toothed) and mysticete (baleen) whales should be substan-tially higher than those for the baseline insectivores and theterrestrial carnivores.
5. Groups that have been able to lower death rates by adoptinghabits and invading habitats where predation is low shouldhave relatively low production rates as a result of ecologicalcompensation (13, 14). The reasoning here is that a majorinnovation affecting life history evolution was a shift to alifestyle or environment that reduced predation. Specifically,at least five functional groups are predicted to have lowernormalization constants than the baseline: (i) f lying bats; (ii)arboreal mammals, including primates and arboreal squirrels;(iii) fossorial forms, including moles among the insectivoresand among the rodents, several different clades that arefossorial and spend the vast majority of their lives in burrowsbelow ground; (iv) several different lineages of desert-dwelling rodents, especially those that have evolved enlargedears or bipedal locomotion to detect and avoid predators(16–18); and (v) very large mammals, including megaherbi-vores and bears, which have escaped most predators by virtueof their size.
6. Predictions may be complicated when the above factorstending to increase and decrease production rates are offset-ting. So, for example, sloths might be expected to have highrates, because they are folivorous and low rates because theyare arboreal, and rhinos and elephants might be expected tohave high rates because they are folivorous but low onesbecause they have reduced predation by evolving extremelylarge body size. In such cases, the observed production ratesmight be expected to be somewhat intermediate, lower thanthose of other folivores but higher than those expected just onthe basis of the reduced mortality alone.
7. The observed relationships will be better explained, and thepredictions will be better supported when the data areanalyzed by lifestyle as well as by phylogeny. This followsdirectly from the assumption that the shifts in normalizationconstants reflect adaptive life history evolution. So adapta-tion of different lineages to similar ecological regimes arepredicted to result in convergent life history evolution. Forexample, we predict that arboreal squirrels and the multipleclades of rodents that have independently evolved fossorial
Fig. 1. Specific production rates of 637 mammal species as a function of bodymass. (A) The whole data set, showing the different orders. (B) Plot for thespecies in orders with �10 data values. Symbols as in A, except that theCarnivora have been split into suborders Fissipedia (red triangles) and Pin-nipedia (blue triangles) (compare Fig. 3B). The lines are fitted by GLM so as tohave the same slopes, and they are color-coded according to taxon. (C) Plot forthe species in the orders not shown in B. Symbols are as in A. The pink line,shown for purposes of comparison, is for Insectivora (see text).
17708 � www.pnas.org�cgi�doi�10.1073�pnas.0707725104 Sibly and Brown

and desert-dwelling lifestyles will have lower production ratesthan more closely related rodents in other functional groups.The same logic can be applied to make and test finerpredictions or to explain individual species or genera that areobvious outliers. For example, is the sea otter more produc-tive than terrestrial mustelid carnivores of comparable size?Do the highly arboreal dormice (family Myoxidae) haveproduction rates that are more similar to those of arborealsquirrels than to related myomorph rodents?
ResultsMass-specific production rate is plotted against adult body masson log scales for all 637 species in Fig. 1 A. The different ordersare color-coded. It is immediately apparent that specific pro-duction rate declines with adult body mass, and the data can befitted with an allometric scaling relation of the form of Eq. 1,which gives specific production rate � 0.98 M�0.28. This accordswith the hypothesis of a general metabolic constraint because ofbody size acting on mammalian life history (4). The slope of thefitted regression line, �0.28 � 0.01 (SE), is intermediate be-tween the theoretically predicted values of �1/4 and �1/3 (4, 8)but closer to the former. It is also apparent that there is avariation of �1 order of magnitude among species of the samebody size. Indeed, the fitted regression accounts for only 59% ofthe variation (Radj
2 ), which is not large considering that thevariation in body mass spans �8 orders of magnitude. As shownby the clustering of the values for different orders, this variationis not randomly distributed but related in systematic ways to thedifferent taxonomic and functional groups.
We now analyze this variation in the context of evaluating theabove predictions:
1. Allometric equations fitted to different taxonomic or lifestylegroups of mammals have generally similar slopes but differentnormalization constants. This was tested by using the GeneralLinear Model (GLM) to fit lines of common slope to thedifferent taxa (Fig. 1B; the residuals were normally distrib-uted). The prediction of similar slopes was generally sup-ported, accounting for 72.1% of the variation in the data(Radj
2 ). This rises by only 1.7% if the slopes are allowed to vary,although this is statistically significant (F8,594 � 6.1, P �0.001). Primates had a steeper slope than the consensus(�0.51), whereas chiroptera, pinnipeds, and lagomorpha hadshallower slopes (�0.09, �0.12, and �0.21, respectively;Table 1). The consensus slope was �0.37 � SE 0.017. This isgreater than the theoretically predicted value of �1/4 (z � 7.1,
P � 0.001) but not significantly different from �1/3 (4, 8). Theprediction of different normalization constants is supportedqualitatively by observing that the parallel lines fitted to thetaxa in Fig. 1B are often widely separated. This is quantifiedin Fig. 2 and Table 1, which show that the normalizationconstants, calculated by fitting lines of common slope to thedata of Fig. 1B, vary by almost 1 order of magnitude, from�0.1 for chiroptera to 0.7–0.8 for lagomorphs, pinnipeds, andcetaceans. To control for lack of independence among spe-cies, we repeated these analyses using genus and family meansand found similar relationships. The consensus slopes were�0.33 � SE 0.02 and �0.28 � SE 0.04 using genus and familymeans, respectively. The conclusions about normalization
Table 1. Descriptive statistics and allometric relationships for the principal taxonomic groupings referred to in the text
No. ofspecies
Medianbody mass, g
Minimumbody mass, g
Maximumbody mass, g
Normalizationconstant at 1 g � SE
Slope(regressioncoefficient) �SE
Mammalia 612 483 4 149,000,000 0.007 0.031 �0.275 0.009Artiodactyla 75 71,500 4,550 1,258,333 0.610 0.041 �0.364 0.048Carnivora 96 12,025 50 716,667 �0.212 0.048
Fissipedia 71 4,500 50 286,367 0.103 0.034 �0.461 0.059Pinnipedia 25 101,250 27,000 716,667 0.750 0.059 �0.116 0.075
Cetacea 18 813,000 32,500 149,000,000 0.696 0.076 �0.301 0.053Chiroptera 105 17 4 888 �0.069 0.048 �0.085 0.045Insectivora 28 102 4 957 0.170 0.058 �0.361 0.066Lagomorpha 19 2,121 115 4,506 0.713 0.060 �0.208 0.076Perissodactyla 9 384,000 257,000 2,233,333 0.420 0.108 �0.823 0.280Primates 81 3,495 66 101,386 0.005 0.032 �0.506 0.034Rodentia 190 97 6 55,000 0.337 0.034 �0.378 0.032
The normalization constants and and regression coefficients (slopes) for the class Mammalia, in the top row, were obtained by regression. The othernormalization constants were obtained by GLM fitting lines of common slope to the data in Fig. 1B. The consensus slope of these fitted lines was �0.366 � 0.017.The slopes in the penultimate column were obtained by separate regressions.
Fig. 2. Normalization constants for the major taxonomic and lifestyle group-ings [mean, SE (thick bars) and SD (thin bars)], obtained by using GLM to fitlines of common slope to the data in Fig. 1B. Normalization constants measurethe vertical displacement of the regression lines (i.e., y intercepts) (see Table1). SDs are presented to show the variation within each grouping (see text).The dashed horizontal line, shown for purposes of comparison, is the normal-ization constant for Insectivora. Symbols on shaded backgrounds depict sub-groups of carnivores and rodents based on lifestyle. ‘‘Rodentia nonfolivorous’’refers to rodents that are arboreal, fossorial, or desert dwelling (see SI Table2 for classification).
Sibly and Brown PNAS � November 6, 2007 � vol. 104 � no. 45 � 17709
EVO
LUTI
ON
SEE
COM
MEN
TARY

constants also were little affected by using genus or familymeans [supporting information (SI) Fig. 5].
2. Insectivores and terrestrial carnivores exhibit intermediaterelationships. This can be seen in Fig. 1B, where the pink andred regression lines of insectivores and fissiped carnivoreshave very similar slopes and normalizations. They are abovethe bat and primate lines but below those for most othergroups (see also Table 1).
3. Grazing and browsing foliovores have higher production ratesthan most other mammals of comparable size. This predictionis supported by the data in Fig. 3A, which shows that almostall artiodactyls, lagomorphs, perissodactyls, and rodents lie
above the insectivore line. It is also apparent in the highnormalization constants of the lagomorphs, artiodactyls androdents in Fig. 2 and Table 1; all are above the insectivore line.Some of the rodents are arboreal or fossorial and others arenot specialized foliage eaters, which increases the variationand lowers the normalization constant for the order Rodentiaas a whole, as discussed below.
4. Marine mammals have high rates of production. This predic-tion is supported by the fact that data points for seals and sealions and baleen and toothed whales all lie well above theinsectivore line (Fig. 3B). The pinniped marine carnivoreshave some of the highest rates of all mammals and are moreproductive than their terrestrial fissiped relatives (Fig. 3C).
5. Groups that have adopted habits and invaded habitats wherepredation is low have low production rates; these groupsinclude flying bats, arboreal mammals, such as primates,arboreal squirrels, and dormice, and fossorial mammals, suchas moles, pocket gophers, and other subterranean rodents.This prediction is supported by Figs. 1B and 2 and Table 1,which show that bats and primates have the lowest produc-tivity of the major groups, and by Fig. 3D, which shows thatarboreal, fossorial, and desert rodents are less productive thantheir folivorous relatives. Fossorial moles, Family Talpidae,are only slightly and not significantly less productive than theother insectivores, but this may be confounded by the fact thatsome other insectivores possess traits (odors, spines, andaquatic) that may also confer protection from predation andhence low death rates. The largest bears (Family Ursidae)have production rates well below other fissiped carnivores(Fig. 3C).
6. When the factors tending to increase and decrease productionrates are offsetting, the groups tend to have intermediaterelationships, and to deviate from their closest relatives in thepredicted direction. Thus megaherbivore elephants (Pro-boscidea) and rhinos (the largest Perissodactyls) have pro-duction rates considerably lower than most folivorous mam-mals (Figs. 1C and 3A). Insectivorous bats generally havelower production rates not only than terrestrial insectivoresbut also than frugivorous and nectarivorous bats (Fig. 3E).Arboreal folivorous sloths have lower production rates thanmost herbivore groups but not conspicuously lower than theirxenarthran relatives, some of which, however (armadillos),are armored.
7. The patterns of production in eutherian mammals reflect theevolutionary influence of both ecology and phylogeny. Ob-served relationships are best explained and predictions moststrongly supported when the data are analyzed by lifestyle(Fig. 2), which accounts for substantial variance in thenormalization constants (40% in the carnivores, comparingfissipeds and pinnipeds, F1,94 � 61.4, P � 0.001; 38% in therodents, comparing folivores with nonfolivores, F1,108 � 67.1,P � 0.001). Fig. 2 shows how variation at the order level isreduced substantially by separating the component functionalgroups (shown on shaded backgrounds). Life history adap-tations associated with divergent lifestyles also appear toexplain several data points for individual species that areoutliers with respect to their relatives (see numbered pointsin Fig. 3). As predicted, the sea otter (Enhydra lutris) has ahigher production rate than any of the 21 terrestrial mustelids.Perhaps similarly, the crab-eating fox (Cerdocyon thous) hasa higher rate than any other canid. Other outliers call forexplanation. The high rates of production of the naked molerat (Heterocephalus glaber) and African wild dog (Lycaonpictus) suggest that ‘‘helpers’’ increase the productivity of thesingle reproductive female within a social group. Overall, it isapparent that production rates of species with divergentlifestyles are often quite different from their closest relatives
Fig. 3. Specific production rate as a function of body mass for speciesgrouped by lifestyle. Grazers and browsers (A); baleen and toothed whalesand pinnipeds (B); terrestrial (fissiped) and marine (pinniped) carnivores (C);rodents (D); frugivorous and nectarivorous (green symbols) and insectivorous(black symbols) bats in the families containing more than five species (E). ThePhyllostomidae, which include carnivorous, insectivorous, and fruit-eatingspecies (http://animaldiversity.ummz.umich.edu), are not shown. The pinkline shown in each image, for purposes of comparison, is for Insectivores. Someexceptional cases are highlighted: 1, crab-eating fox (C. thous); 2, African civet(Civettictis civetta); 3, sea otter (E. lutris); 4, African wild dog (L. pictus); 5, bearsof the family Ursidae; 6, naked mole rat (H. glaber). See text for discussion.
17710 � www.pnas.org�cgi�doi�10.1073�pnas.0707725104 Sibly and Brown
and convergently similar to distantly related mammals withsimilar behaviors and ecologies.
DiscussionIn general, the data for mammalian life histories support theo-retically predicted relationships between rates of mass-specificproduction and lifestyle. Compared with the baseline set bygeneralized primitive terrestrial insectivores and carnivores or bytheir nearest relatives, groups that have specialized on abundantand reliable food sources (most notably grazing and browsingherbivores and marine mammals) have high production rates.Also, groups that have specialized in ways that reduce predation(most notably flying bats, arboreal primates, arboreal, fossorial,and desert rodents and the largest bears) have low productionrates. These patterns are often deeply rooted in eutherianmammalian phylogeny, where they presumably reflect lifestyleinnovations in ancient lineages. Evidence of convergent evolu-tion reflecting ecological adaptations comes from two patterns(i) similar production rates in distantly related mammals thathave adopted similar lifestyles, and (ii) divergent productionrates in closely related mammals that have adopted divergentlifestyles.
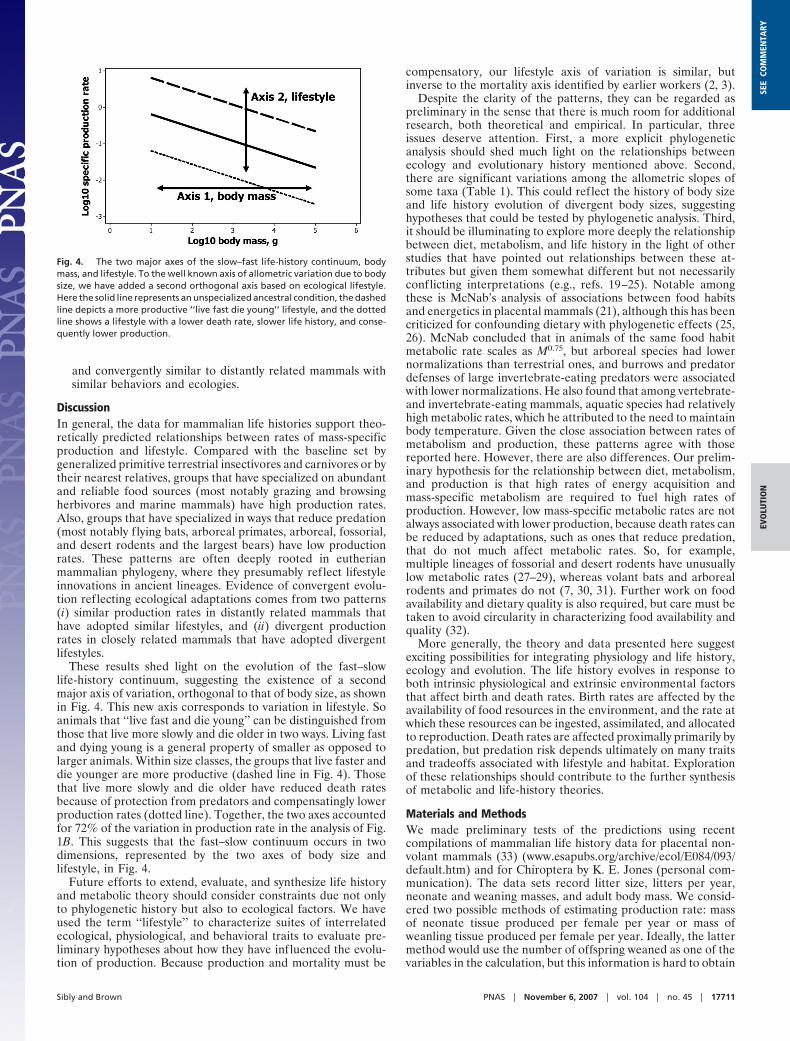
These results shed light on the evolution of the fast–slowlife-history continuum, suggesting the existence of a secondmajor axis of variation, orthogonal to that of body size, as shownin Fig. 4. This new axis corresponds to variation in lifestyle. Soanimals that ‘‘live fast and die young’’ can be distinguished fromthose that live more slowly and die older in two ways. Living fastand dying young is a general property of smaller as opposed tolarger animals. Within size classes, the groups that live faster anddie younger are more productive (dashed line in Fig. 4). Thosethat live more slowly and die older have reduced death ratesbecause of protection from predators and compensatingly lowerproduction rates (dotted line). Together, the two axes accountedfor 72% of the variation in production rate in the analysis of Fig.1B. This suggests that the fast–slow continuum occurs in twodimensions, represented by the two axes of body size andlifestyle, in Fig. 4.
Future efforts to extend, evaluate, and synthesize life historyand metabolic theory should consider constraints due not onlyto phylogenetic history but also to ecological factors. We haveused the term ‘‘lifestyle’’ to characterize suites of interrelatedecological, physiological, and behavioral traits to evaluate pre-liminary hypotheses about how they have influenced the evolu-tion of production. Because production and mortality must be
compensatory, our lifestyle axis of variation is similar, butinverse to the mortality axis identified by earlier workers (2, 3).
Despite the clarity of the patterns, they can be regarded aspreliminary in the sense that there is much room for additionalresearch, both theoretical and empirical. In particular, threeissues deserve attention. First, a more explicit phylogeneticanalysis should shed much light on the relationships betweenecology and evolutionary history mentioned above. Second,there are significant variations among the allometric slopes ofsome taxa (Table 1). This could reflect the history of body sizeand life history evolution of divergent body sizes, suggestinghypotheses that could be tested by phylogenetic analysis. Third,it should be illuminating to explore more deeply the relationshipbetween diet, metabolism, and life history in the light of otherstudies that have pointed out relationships between these at-tributes but given them somewhat different but not necessarilyconflicting interpretations (e.g., refs. 19–25). Notable amongthese is McNab’s analysis of associations between food habitsand energetics in placental mammals (21), although this has beencriticized for confounding dietary with phylogenetic effects (25,26). McNab concluded that in animals of the same food habitmetabolic rate scales as M0.75, but arboreal species had lowernormalizations than terrestrial ones, and burrows and predatordefenses of large invertebrate-eating predators were associatedwith lower normalizations. He also found that among vertebrate-and invertebrate-eating mammals, aquatic species had relativelyhigh metabolic rates, which he attributed to the need to maintainbody temperature. Given the close association between rates ofmetabolism and production, these patterns agree with thosereported here. However, there are also differences. Our prelim-inary hypothesis for the relationship between diet, metabolism,and production is that high rates of energy acquisition andmass-specific metabolism are required to fuel high rates ofproduction. However, low mass-specific metabolic rates are notalways associated with lower production, because death rates canbe reduced by adaptations, such as ones that reduce predation,that do not much affect metabolic rates. So, for example,multiple lineages of fossorial and desert rodents have unusuallylow metabolic rates (27–29), whereas volant bats and arborealrodents and primates do not (7, 30, 31). Further work on foodavailability and dietary quality is also required, but care must betaken to avoid circularity in characterizing food availability andquality (32).
More generally, the theory and data presented here suggestexciting possibilities for integrating physiology and life history,ecology and evolution. The life history evolves in response toboth intrinsic physiological and extrinsic environmental factorsthat affect birth and death rates. Birth rates are affected by theavailability of food resources in the environment, and the rate atwhich these resources can be ingested, assimilated, and allocatedto reproduction. Death rates are affected proximally primarily bypredation, but predation risk depends ultimately on many traitsand tradeoffs associated with lifestyle and habitat. Explorationof these relationships should contribute to the further synthesisof metabolic and life-history theories.
Materials and MethodsWe made preliminary tests of the predictions using recentcompilations of mammalian life history data for placental non-volant mammals (33) (www.esapubs.org/archive/ecol/E084/093/default.htm) and for Chiroptera by K. E. Jones (personal com-munication). The data sets record litter size, litters per year,neonate and weaning masses, and adult body mass. We consid-ered two possible methods of estimating production rate: massof neonate tissue produced per female per year or mass ofweanling tissue produced per female per year. Ideally, the lattermethod would use the number of offspring weaned as one of thevariables in the calculation, but this information is hard to obtain
Fig. 4. The two major axes of the slow–fast life-history continuum, bodymass, and lifestyle. To the well known axis of allometric variation due to bodysize, we have added a second orthogonal axis based on ecological lifestyle.Here the solid line represents an unspecialized ancestral condition, the dashedline depicts a more productive ‘‘live fast die young’’ lifestyle, and the dottedline shows a lifestyle with a lower death rate, slower life history, and conse-quently lower production.
Sibly and Brown PNAS � November 6, 2007 � vol. 104 � no. 45 � 17711
EVO
LUTI
ON
SEE
COM
MEN
TARY

and is not in the database, so the only option would be to uselitter size as a surrogate. Because the ratio of neonate toweanling mass does not vary with the logarithm of body mass(GLM taking account of the taxonomic groups in Fig. 1B,F1,149 � 1.78, nonsignificant) and differs only from 0.10 to 0.30among lifestyle groups, calculating production rates by the twomethods and using litter size gives similar results, as shown in SIFig. 6 (compare Fig. 1B). We used the neonate method forcalculating production rates in this article because there weremany more measurements of neonate mass than of weaningmass, measurements of weaning mass were imprecise, and nodata on the sizes of litters actually weaned.
Therefore, production rate was estimated here as the mass ofneonate tissue produced per adult female per year, and this wascalculated as the product of litter size, litters per year, andneonate mass. The units are grams per year. This value wasdivided by adult body mass in grams to obtain mass-specificproduction rate, in units of y�1. Values were calculated for 637species, representing 374 genera, 94 families, and 15 orders, forwhich data on litter size, litters per year, neonate mass, and adultbody size were available. Our analysis does not includemonotremes or marsupials, which are long-divergent lineages
with dramatically different reproductive biologies, egg-layingand pouch-rearing, respectively. Data manipulation and statis-tical analyses were performed by using Minitab 14.1 (Minitab,State College, PA)
We analyzed the data by using the level of taxonomy thatseemed most appropriate. Only 8 orders, Artiodactyla, Car-nivora, Cetacea, Chiroptera, Insectivora, Lagomorpha, Pri-mates, and Rodentia, contained �10 species, and these wereanalyzed separately. We also singled out particular taxonomic(e.g., suborder or families) or functional groups (e.g., arboreal orfossorial rodents) for focused comparisons where appropriate.We followed the taxonomic classification of Wilson Reader (34),which is a relatively recent reorganization that incorporatesmodern phylogenetic information.
We thank K. E. Jones for supplying the bat data, E. L. Charnov andmembers of the University of New Mexico/Santa Fe Institute scalinggroup for helpful discussions, and R. M. Alexander and S. F. Dobson forconstructive comments on the manuscript. We are grateful for financialsupport from a Royal Society travel grant (to R.M.S.) and from NationalScience Foundation Grant DEB-0083422 and a Packard Interdiscipli-nary Science grant (to J.H.B.).
1. Blueweiss L, Fox H, Kudzma V, Nakashima D, Peters R, Sams S (1978)Oecologia 37:257–272.
2. Promislow DEL, Harvey PH (1990) J Zool 220:417–437.3. Read AF, Harvey PH (1989) J Zool 219:329–353.4. Brown JH, Gillooly JF, Allen AP, Savage VM, West GB (2004) Ecology 85:1771–1789.5. Calder WA (1984) Size, Function and Life History (Harvard Univ Press,
Cambridge, MA).6. Peters RH (1983) The Ecological Implications of Body Size (Cambridge Univ
Press, Cambridge, UK).7. Charnov EL (1993) Life History Invariants: Some Explorations of Symmetry in
Evolutionary Ecology (Oxford Univ Press, Oxford).8. Glazier DS (2005) Biol Rev 80:611–662.9. Brown JH, Sibly RM (2006) Proc Natl Acad Sci USA 103:17595–17599.
10. West GB, Brown JH, Enquist BJ (1997) Science 276:122–126.11. McMahon TA, Bonner JT (1983) On Size and Life (Scientific American Books, New
York).12. Alroy J (1998) Science 280:731–734.13. Sibly R, Calow P (1987) J Theor Biol 125:177–186.14. Sibly RM, Calow P (1986) Physiological Ecology of Animals (Blackwell Scientific
Publications, Oxford).15. Begon M, Townsend CR, Harper JL (2006) Ecology: From Individuals to
Ecosystems (Blackwell Publishing, Malden, MA).16. Kotler BP (1984) Ecology 65:689–701.17. Kotler BP, Brown JS, Mitchell WA (1994) Austr J Zool 42:449–466.18. Mares MA (1993) Bioscience 43:372–379.
19. Williams TM, Haun J, Davis RW, Fuiman LA, Kohin S (2001) Comp BiochemPhysiol A 129:785–796.
20. McNab BK (2002) The Physiological Ecology of Vertebrates: A View fromEnergetics (Cornell Univ Press, Ithaca, NY).
21. McNab BK (1986) Ecol Monogr 56:1–19.22. Cruz-Neto AP, Bozinovic F (2004) Physiol Biochem Zool 77:877–889.23. Calder WA (2000) in Scaling in Biology, eds Brown JH, West GB (Oxford Univ
Press, Oxford), pp 297–323.24. Harvey PK, Bennett PM (1983) Nature 306:314–315.25. Harvey PH, Pagel MD, Rees JA (1991) Am Nat 137:556–566.26. Elgar MA, Harvey PH (1987) Funct Ecol 1:25–36.27. Contreras LC, McNab BK (1990) in Evolution of Subterranean Mammals at the
Organismal and Molecular Levels, eds Nevo E, Reig OA (Wiley–Liss, NewYork), pp 231–250.
28. Hinds DS, MacMillen RE (1985) Physiol Zool 58:282–298.29. McNab BK (1979) Ecology 60:1010–1021.30. Savage VM, Gillooly JF, Woodruff WH, West GB, Allen AP, Enquist BJ,
Brown JH (2004) Funct Ecol 18:257–282.31. Harvey PH, Clutton-Brock TH (1981) Behav Ecol Sociobiol 8:151–155.32. Crawley MJ (1983) Herbivory. The Dynamics of Animal–Plant Interactions
(Blackwell Scientific Publications, Oxford).33. Ernest SKM (2003) Ecology 84:3402.34. Wilson DE, Reader DM (2005), Mammal Species of the World: A Taxonomic
and Geographic Reference (John Hopkins Univ Press, Baltimore), 3rd Ed.
17712 � www.pnas.org�cgi�doi�10.1073�pnas.0707725104 Sibly and Brown