effects of a food contaminant on cell cycl ref - duo.uio.no · denne masteroppgaven ble utført ved...
TRANSCRIPT

Effects of a food contaminant
on cell cycle Glycidamide induced S-phase arrest followed by apoptosis in a lymphoblastoid cell line.
by Elin Bakken Ansok
Master thesis in Toxicology
Department of Toxicology
Institute of Biology
University of Oslo
June 2009

2
Effects of a food contaminant on cell cycle - Glycidamide induced S-phase arrest followed by apoptosis in a lymphoblastoid cell line. Master thesis by Elin Bakken Ansok 2009
1. Acknowledgments
Denne masteroppgaven ble utført ved avdeling for kjemikalietoksikologi (MIKT), divisjon for
miljømedisin ved Nasjonalt follkehelseinstitutt (FHI). Hovedveileder har vært Kristine Bjerve
Gutzkow, biveileder Gunnar Brunborg, og Steinar Øvrebø som internveileder ved Universitet
i Oslo.
For å gjøre det kort: takk til alle gærninger ved MIKT for en artig tid og meget sosial
avdeling! For det første veileder Kristine B. Gutzkow! Christine, Silja og Håvard, mine kjære
medstudenter som har bidratt til en livlig lab til alle døgnets tider! Siri, nå skal jeg slutte å
mase om statistikk og akrylamid! Elisabeth, uten deg hadde jeg vel blitt litt smågal! Silje, våre
mange diskusjoner! Ikke minst korrekturlesere!
Nå skal jeg gjøre andre ting! :-)
3
Effects of a food contaminant on cell cycle - Glycidamide induced S-phase arrest followed by apoptosis in a lymphoblastoid cell line. Master thesis by Elin Bakken Ansok 2009
Contents
1. ACKNOWLEDGMENTS ............................................................................................................................. 2
CONTENTS ........................................................................................................................................................ 3
2. ABBREVATIONS ....................................................................................................................................... 6
3. AIMS OF THE STUDY ................................................................................................................................ 9
4. SUMMARY ............................................................................................................................................ 11
5. INTRODUCTION ..................................................................................................................................... 13
5.1 ACRYLAMIDE ............................................................................................................................................... 13
5.1.1 Toxic effects of Acrylamide ............................................................................................................ 13
5.1.2 Genotoxicity of Acrylamide and Glycidamide ................................................................................ 15
5.1.3 Acrylamid on vital proteins of the mitotic spindle ......................................................................... 17
5.2 DNA DAMAGE ............................................................................................................................................ 18
5.2.1 DNA adducts .................................................................................................................................. 19
5.2.2 Single- and double-strand breaks .................................................................................................. 21
5.3 DNA REPAIR ............................................................................................................................................... 22
5.3.1 Base excision repair (BER) ............................................................................................................. 22
5.3.2 Nucleotide excision repair (NER) ................................................................................................... 23
5.4 DNA DAMAGE AND CELL CYCLE RESPONSE ........................................................................................................ 24
5.4.1 Regulation of the cell cycle machinery .......................................................................................... 24
5.4.2 Cell cycle checkpoints .................................................................................................................... 27
5.4.3 G1/S checkpoint ............................................................................................................................. 27
5.4.4 S-phase checkpoints ...................................................................................................................... 27
5.4.5 G2/M checkpoint ............................................................................................................................ 28
5.5 TUMOR SUPRESSOR PROTEIN, P53 .................................................................................................................. 28
5.6 CELL DEATH ................................................................................................................................................ 29
5.7 APOPTOSIS ................................................................................................................................................. 30
5.7.1 DNA-damage induced apoptosis ................................................................................................... 30
6. METHODS ............................................................................................................................................. 32
6.1 CELL CULTURES ............................................................................................................................................ 32
6.1.1 Lymphocytes versus lymphoid cell culture..................................................................................... 32
6.1.2 EBV transformed B-lymphocytes ................................................................................................... 32

4
Effects of a food contaminant on cell cycle - Glycidamide induced S-phase arrest followed by apoptosis in a lymphoblastoid cell line. Master thesis by Elin Bakken Ansok 2009
6.1.3 Isolation of primary lymphocytes from whole blood ..................................................................... 33
6.1.4 Stimulation of resting peripheral blood lymphocytes (PBL) into late G1 ....................................... 33
6.2 METABOLISM OF ACRYLAMIDE TO GLYCIDAMIDE USING LIVER S9 FRACTIONS ........................................................... 34
6.3 METHODS TO DETECT DNA DAMAGE AND REPAIR .............................................................................................. 35
6.3.1 The comet assay ............................................................................................................................ 35
6.3.2 Scoring of comets .......................................................................................................................... 38
6.3.3 Determination of repair capacity .................................................................................................. 38
6.4 FLOW CYTOMETRIC ANALYSIS OF CELL CYCLE DISTRIBUTION ................................................................................... 38
6.5 CELL CYCLE ANALYSIS BY PROPIDIUM IODIDE (PI) STAINING ................................................................................. 41
6.5.1 Fixation of cells: ............................................................................................................................. 41
6.6 CELL CYCLE ANALYSIS BY BROMODEOXYURIDINE ................................................................................................ 42
6.7 METHODS FOR DETECTION OF CELL DEATH ........................................................................................................ 43
6.7.1 Flow cytometric analysis for identification and quantification of apoptotic or necrotic cells ....... 43
6.7.2 Fluorescence microscopy ............................................................................................................... 44
6.8 DETERMINING THE VITALITY OF CELLS BY STAINING WITH PROPIDIUM IODIDE AND HOECHST 33342 ............................. 45
6.9 PROTEIN DETECTION METHODS ....................................................................................................................... 46
6.9.2 Western Blot .................................................................................................................................. 47
6.9.3 Preparation, separation and detection of proteins: ...................................................................... 47
6.9.4 Protein concentration: ................................................................................................................... 48
6.9.5 Seperation of proteins and Western Blot Procedure: .................................................................... 49
6.10 STATISTICAL ANALYSIS .............................................................................................................................. 52
7. RESULTS ................................................................................................................................................ 54
7.1 GLYCIDAMIDE, BUT NOT ACRYLAMIDE, INDUCES DNA DAMAGE RECOGNISED BY THE FPG-ENZYME IN LYMPHOID CELLS IN
VITRO. 54
7.2 REPAIR OF GA-INDUCED DNA DAMAGE IN LYMPHOID CELLS. ............................................................................... 59
7.3 CELL CYCLE ANALYSIS BY PI STAINING AND FLOW CYTOMETRY................................................................................ 62
7.3.1 Cell cycle analysis with BrdU incorporation ................................................................................... 67
7.4 GA-INDUCED PHOSPHORYLATION AND EXPRESSION OF P53 .................................................................................. 69
7.5 PROTEIN EXPRESSION OF THE CDK INHIBITORS, P21CIP1
AND P27KIP1
. .................................................................... 70
7.5.1 Protein expression of cyclin A after GA-exposure .......................................................................... 71
7.5.2 Protein expression of the NER proteins, XPA and XPC, following GA-exposure ............................. 71
7.6 CELL VIABILITY ............................................................................................................................................. 73
8. DISCUSSION: ......................................................................................................................................... 75
8.1 METHODOLOGICAL CONSIDERATIONS ............................................................................................................... 75
5
Effects of a food contaminant on cell cycle - Glycidamide induced S-phase arrest followed by apoptosis in a lymphoblastoid cell line. Master thesis by Elin Bakken Ansok 2009
8.1.1 An Epstein–Barr virus (EBV) immortilized B-cell, as a model system for stimulated normal human
peripheral lymphocytes. .............................................................................................................................. 75
8.1.2 The Comet assay............................................................................................................................ 76
8.1.3 Metabolizing AA with human S9 extract ....................................................................................... 77
8.1.4 Cell cycle analysis by Flow cytometry ............................................................................................ 78
8.1.5 Cell viability/Cell death .................................................................................................................. 79
8.1.6 Western ......................................................................................................................................... 80
8.2 STATISTICAL ANALYSIS ................................................................................................................................... 81
8.3 GA-INDUCED DNA DAMAGE ......................................................................................................................... 82
8.3.1 GA induced DNA damage recognized by Fpg ................................................................................ 83
8.3.2 GA induced DNA adducts............................................................................................................... 84
8.4 REPAIR OF GA-INDUCED DNA-DAMAGE .......................................................................................................... 85
8.5 BIOLOGICAL CONSEQUENCES OF GA-INDUCED LESIONS ....................................................................................... 87
8.5.1 GA-induced S-phase arrest and apoptosis ..................................................................................... 87
8.5.2 Regulation of cyclin A following GA-exposure ............................................................................... 89
8.5.3 Regulation of p53 and p21CIP1
following GA-exposure .................................................................. 90
8.5.4 Regulation of p27 following GA exposure ..................................................................................... 92
9. CONCLUSIONS AND FUTURE WORK ...................................................................................................... 94
REFERENCES ................................................................................................................................................... 96
10. APPENDIX ........................................................................................................................................... 107
10.1 SOLUTIONS AND MEDIA .......................................................................................................................... 109

6
Effects of a food contaminant on cell cycle - Glycidamide induced S-phase arrest followed by apoptosis in a lymphoblastoid cell line. Master thesis by Elin Bakken Ansok 2009
2. Abbrevations
8-oxo-G 7,8-dihydro-8-oxoguanine
β-ME β-Mercaptoethanol
AA Acrylamide
Ab Anti-body
AP site (Abasic) apurinic/apyrimidinic site
ALS Alkali Labile Sites
Ape1/APEX1 Mammalian AP Endonuclease 1
ATM Ataxia Teleangesica Mutated
BER Base Excision Repair
bp base pair
BPB Bromo Phenol Blue
BrdU Bromodeoxyuridine (5-bromo-2-deoxyuridine)
BSA Bovine Serum Albumin
DNA Deoxyribonucleic acid
DSB
DNA Double Strand Break
Fapy 2,6-diamino-4-hydroxy-5N-formamidopyrimidine
Fpg Formamidopyrimidine-DNA-glycolase
FITC fluorescein isothiocyanate

7
Effects of a food contaminant on cell cycle - Glycidamide induced S-phase arrest followed by apoptosis in a lymphoblastoid cell line. Master thesis by Elin Bakken Ansok 2009
GA Glycidamide
GAPDH Glyceraldehyde-3-Phosphate Dehydrogenase
GGR Global Genome Repair
GO Gene Ontology
GSH Glutathione
GST Gluthathione S-transferase
HRP Horseradish Peroxidase
IARC International Agency for Research on Cancer
ROS Reactive oxygen species
RNA Ribonucleid acid
MMR Mismatch Repair
N1-GA-Ade N1-(2-carboxy-2-hydroxyethyl)-2’-deoxyadenosine
N3-GA-Ade N3-(2-carbamoyl-2-hydroxyethyl)-adenine
N7-GA-Gua N-7-(2-carbamoyl-2-hydroxyethyl)guanine
NER Nucleotide Excision Repair
PCNA Proliferating Cell Nuclear Antigen
PI Propidium Iodide
PKC Protein Kinase C
Pol β Polymerase β
SDS Sodium Dodecyl Sulphate
8
Effects of a food contaminant on cell cycle - Glycidamide induced S-phase arrest followed by apoptosis in a lymphoblastoid cell line. Master thesis by Elin Bakken Ansok 2009
SPR Short-Patch Repair
SSBs DNA Single Strand Breaks
WHO World Health Organisation
3MeA 3-methyladenine
7MeG 7-methylguanine
AP1 AP endonuclease 1
MMR Mismatch repair
NHEJ nonhomologous end joining
HR homologous recombination
dRP deoxyribose phosphate
GG-NER global genomic NER
TCNER transcription coupled NER
XPA Xeroderma pigmentosum group A
XPC Xeroderma pigmentosum group C
TCNER transcription coupled NER
XPA Xeroderma pigmentosum group A
XPC Xeroderma pigmentosum group C

9
Effects of a food contaminant on cell cycle - Glycidamide induced S-phase arrest followed by apoptosis in a lymphoblastoid cell line. Master thesis by Elin Bakken Ansok 2009
3. Aims of the study
Cooking and food processing at high temperatures generate various kinds of toxic substances.
Acrylamide has been traced in many different types of processed food and beverages and
there is a risk for human exposure. Acrylamide is metabolized to the genotoxic mutagen
glycidamide. To contribute to a better estimation of the health risk associated with acrylamide
intake, its biological effects must be understood at a cellular and molecular level. We
therefore wanted to explore the genotoxic effect and the molecular impact of exposing human
peripheral lymphocytes (PBL) and the lymphoblastoid cell line GM00130 to glycidamide in
vitro. PBL and the cell line were both used for the genotoxic studies, while only the cell line
was exploited in all other mechanistic experiments.
Specific goals:
1. Determine the genotoxic effect of GA on human lymphoid cells. We
wanted to use the comet assay to determine the genotoxic effect of the
metabolite glycidamide, and to study the type of DNA lesions caused by
glycidamide. By introducing a specific repair enzyme to the comet assay,
more specific types of lesions induced by glycidamide could be detected. In
addition we wanted to explore the repair capability in lymphoid cells.
2. Analyse GA-induced changes in the cell cycle. By using flow cytometry
and DNA-staining, together with BrdU-incorporation, we were able to
determine changes in the cell cycle distribution, in GM00130, after GA-
exposure.

10
Effects of a food contaminant on cell cycle - Glycidamide induced S-phase arrest followed by apoptosis in a lymphoblastoid cell line. Master thesis by Elin Bakken Ansok 2009
3. Analyse the molecular mechanism of DNA damage responses of
glycidamide. With the use of western blotting we wanted to study GA-
induced altered expression of selected proteins involved in cell cycle
regulation, DNA repair or markers for genotoxic stress and apoptosis in
GM00130.
4. Analyse effects on cell viability. By using a cell viability assay such as
PI/Hoechst, we wanted to detect cytotoxic effects of GA in GM00130,
discriminating between the levels of apoptotic or necrotic cells induced by
GA.

11
Effects of a food contaminant on cell cycle - Glycidamide induced S-phase arrest followed by apoptosis in a lymphoblastoid cell line. Master thesis by Elin Bakken Ansok 2009
4. Summary
Exposure to environmental toxicants is a contributing factor to health disorders such as
cancer, asthma and allergy. A toxicant which has been studied more in depth the last years is
the well known neurotoxicant acrylamide (AA) and its metabolite, glycidamide (GA). The
reason for this is that AA have been traced in many different types of processed food and
beverages. Although the genotoxic effect of AA has been widely studied, the molecular
function remains mostly unclear. We therefore wanted to explore the molecular impact of the
genotoxic effect of glycidamide, and to look more carefully into the mechanisms involved. In
large biomonitoring studies, lymphocytes are an invaluable and often the only source of
medium for such genotoxic analysis, and, therefore human lymphocytes and a lymphoblastoid
cell line were used for the in vitro exposure studies.
In correspondence with results from ongoing studies in our laboratory, we found that very low
exposure of the GA, but not AA alone, induced high levels of DNA damage recognised by the
repair enzyme, Formamidopyrimidine glycosylase (Fpg). Further, when relatively high
concentrations of GA (1 mM and 0.5 mM) was used, together with long exposure duration, a
marked increase in DNA damage without the Fpg-enzyme was apparent. Thus, since GA is
found to be highly genotoxic we wanted to study GAs effect on lymphoid cell cycle and
survival when relatively low GA(0.1 mM) concentrations were used. No cell cycle arrest of
the lymphoblastoid cell line, GM00130, was seen with low GA concentrations. Instead, by
increasing the GA dose, starting from 0.5 mM, an accumulation of cells in early S-phase
became apparent after 24 hours exposure time. Preliminary results also indicated a reduction
in the incorporation of bromodeoxyuridine (5-bromo-2-deoxyuridine, BrdU) following GA-
exposure, indicating a halt in DNA-replication and an S-phase arrest. At the same GA-
concentration used, the tumor suppressor protein p53 was highly phosphorylated at ser15,
followed by a total p53 increase. An increase in the CDK inhibitor p21CIP1 was also notable at
0.5 mM GA concentration, while no significant changes were observed in the case of p27Kip1.
Further, the expression of cyclin A that drives S-phase did not decrease as expected. When
increasing the concentration of GA to 1 mM and also the time of exposure, an increased level
of cells arresting in S-phase was observed together with an elevation of cell undergoing

12
Effects of a food contaminant on cell cycle - Glycidamide induced S-phase arrest followed by apoptosis in a lymphoblastoid cell line. Master thesis by Elin Bakken Ansok 2009
apoptosis. Additionally, since the transcription of the NER-enzymes, XPA and XPC, was
previously found to be regulated by GA in other cell systems, we analysed the expression of
these proteins after GA-exposure. However, in a preliminary experiment, no notable GA-
induced increase in the protein level of these enzymes was noted.
Thus, unexpectedly, we found that the high number of Fpg-sensitive sites induced by low
levels of GA did not lead to any cell cycle arrest or cell death or any changes in protein
expression of important cell cycle parameters tested in the lymphoblastoma cell line. This
may indicate that lymphoid cells are able to overcome or ignore these lesions at low levels of
GA. However, continuous exposure may eventually lead to an accumulation of GA-induced
lesions leading to mutations and cancerous development over time. When increasing the
concentration and the exposure duration of GA, DNA-replication was markedly slowed down
and cells were arrested in S-phase followed by a significant progression of apoptosis. This
may be due to the observed GA-induced activation of p53 and the induction p21CIP1. All in all
it shows that GA is genotoxic and affects the lymphoid cell cycle in a dose and time
dependent matter.
13
Effects of a food contaminant on cell cycle - Glycidamide induced S-phase arrest followed by apoptosis in a lymphoblastoid cell line. Master thesis by Elin Bakken Ansok 2009
5. Introduction
5.1 Acrylamide
Acrylamide (AA) (2-propenamid) is an important industrial monomer, and has been
commercially available since the mid-1950s and is manufactured on a large scale world wide.
In addition of being a well known neurotoxicant (Deng et al., 1993; He et al., 1989), AA has
shown to induce the development of various tumors in several animal studies published in the
1980s (Friedman et al., 1995; Johnson et al., 1986). Therefore, epidemiologic evaluations of
cancer risk in workers who were exposed occupationally to AA were also undertaken in the
1980s (Sobel et al., 1986). However, no consistent effect of AA exposure on cancer incidence
was identified. Additional subsequent studies concluded the same (Collins et al., 1989; Marsh
et al., 1999).
AA is generated, predominantly, from the precursor aspargine (Stadler et al., 2002;
Tareke et al., 2000) in a Maillard reaction involving asparagine and reducing sugars during
the heating of carbohydrate-rich food with temperatures above 120˚C (Mottram et al., 2002;
Stadler et al., 2002) and is therefore found in baked and fried starchy foods, such as French
fries and chips (Svensson et al., 2003). Since AA surprisingly was found in measurable
significant quantities in many common human foods in addition to its presence in coffee and
smoke, it introduced a new dimension to carcinogenic risk assessment of AA. Therefore,
based on its effect in animals and that AA is biotransformed in mammalian tissue to a
genotoxic metabolite; the International Agency for Research on Cancer (IARC) classifies AA
as a 2A, a probable human carcinogen (IARC, 1994).
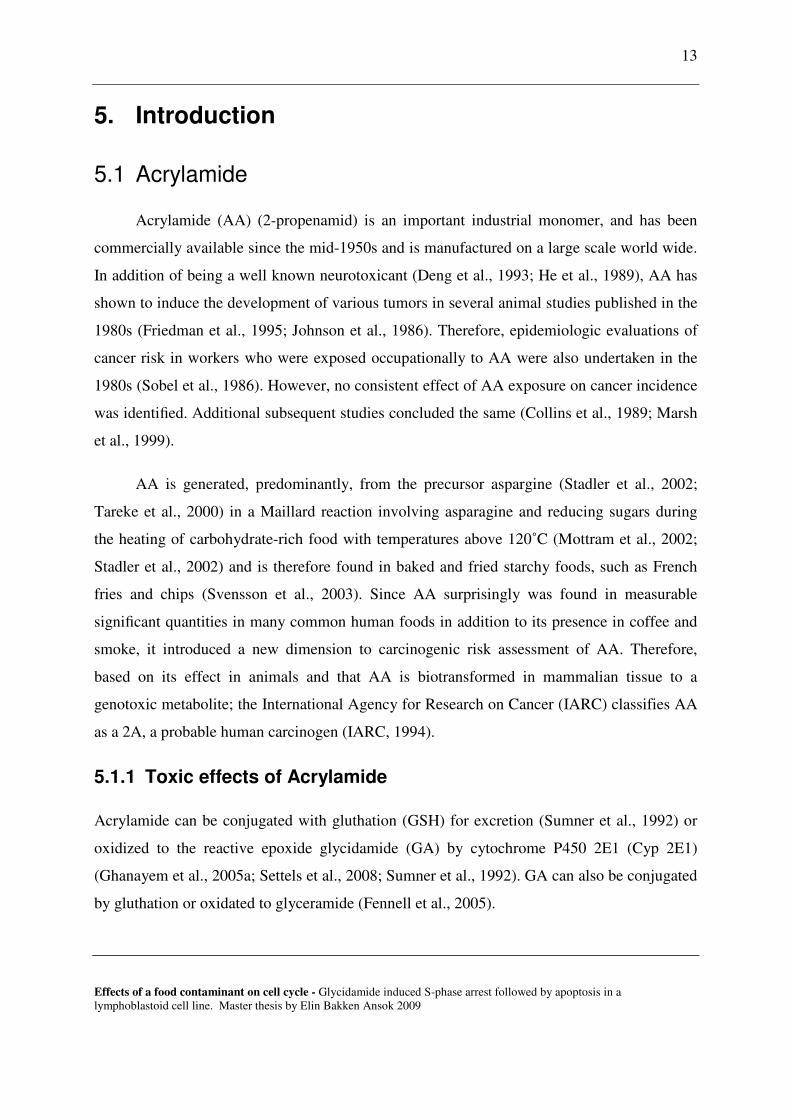
5.1.1 Toxic effects of Acrylamide
Acrylamide can be conjugated with gluthation (GSH) for excretion (Sumner et al., 1992) or
oxidized to the reactive epoxide glycidamide (GA) by cytochrome P450 2E1 (Cyp 2E1)
(Ghanayem et al., 2005a; Settels et al., 2008; Sumner et al., 1992). GA can also be conjugated
by gluthation or oxidated to glyceramide (Fennell et al., 2005).
14
Effects of a food contaminant on cell cycle - Glycidamide induced S-phase arrest followed by apoptosis in a lymphoblastoid cell line. Master thesis by Elin Bakken Ansok 2009
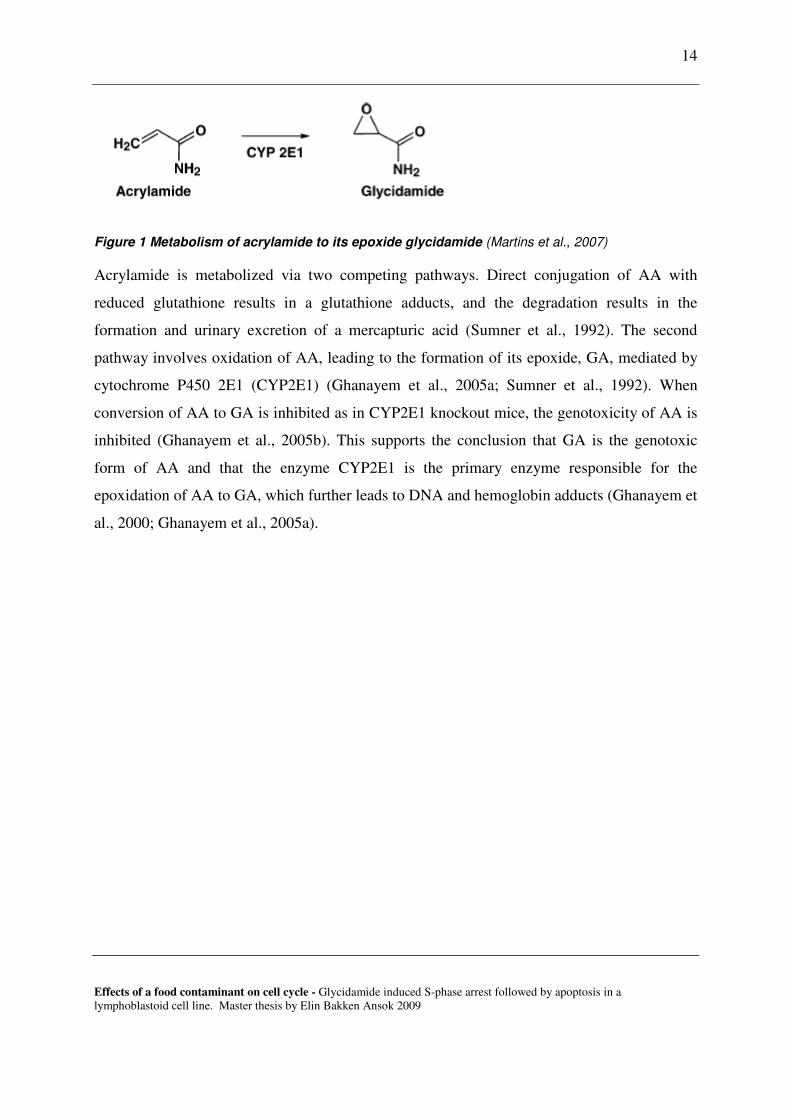
Figure 1 Metabolism of acrylamide to its epoxide glycidamide (Martins et al., 2007)
Acrylamide is metabolized via two competing pathways. Direct conjugation of AA with
reduced glutathione results in a glutathione adducts, and the degradation results in the
formation and urinary excretion of a mercapturic acid (Sumner et al., 1992). The second
pathway involves oxidation of AA, leading to the formation of its epoxide, GA, mediated by
cytochrome P450 2E1 (CYP2E1) (Ghanayem et al., 2005a; Sumner et al., 1992). When
conversion of AA to GA is inhibited as in CYP2E1 knockout mice, the genotoxicity of AA is
inhibited (Ghanayem et al., 2005b). This supports the conclusion that GA is the genotoxic
form of AA and that the enzyme CYP2E1 is the primary enzyme responsible for the
epoxidation of AA to GA, which further leads to DNA and hemoglobin adducts (Ghanayem et
al., 2000; Ghanayem et al., 2005a).
15
Effects of a food contaminant on cell cycle - Glycidamide induced S-phase arrest followed by apoptosis in a lymphoblastoid cell line. Master thesis by Elin Bakken Ansok 2009
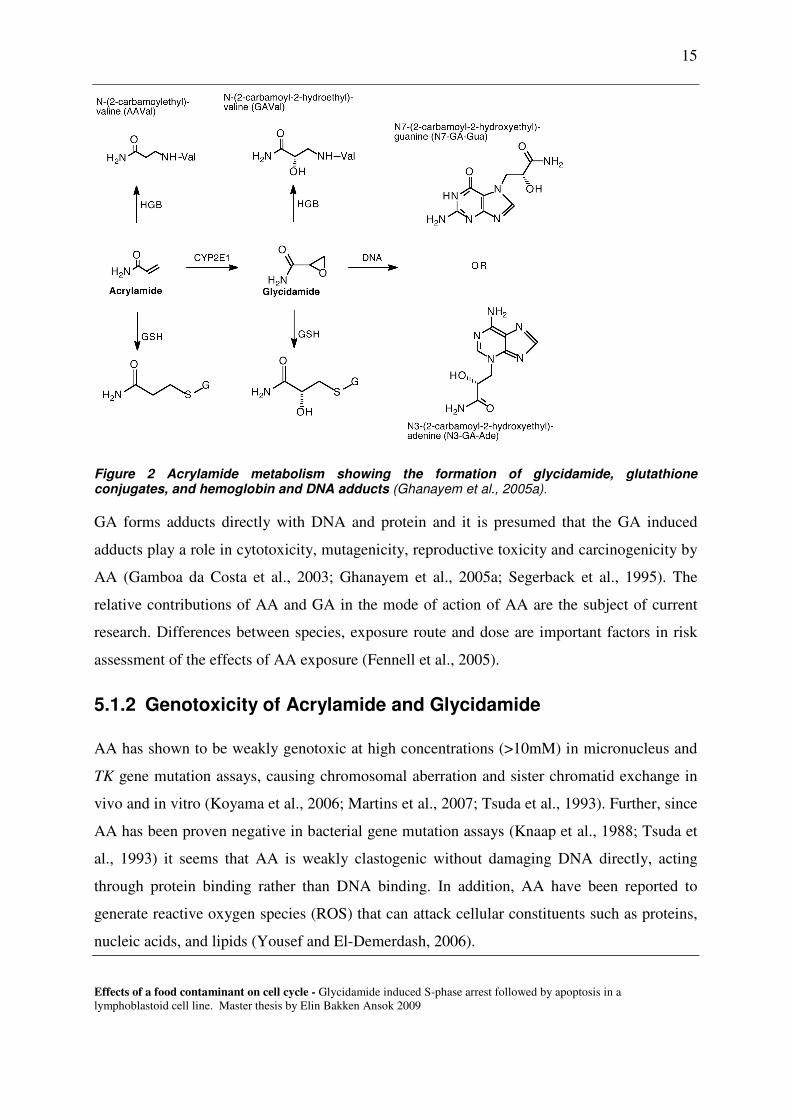
Figure 2 Acrylamide metabolism showing the formation of glycidamide, glutathione conjugates, and hemoglobin and DNA adducts (Ghanayem et al., 2005a).
GA forms adducts directly with DNA and protein and it is presumed that the GA induced
adducts play a role in cytotoxicity, mutagenicity, reproductive toxicity and carcinogenicity by
AA (Gamboa da Costa et al., 2003; Ghanayem et al., 2005a; Segerback et al., 1995). The
relative contributions of AA and GA in the mode of action of AA are the subject of current
research. Differences between species, exposure route and dose are important factors in risk
assessment of the effects of AA exposure (Fennell et al., 2005).
5.1.2 Genotoxicity of Acrylamide and Glycidamide
AA has shown to be weakly genotoxic at high concentrations (>10mM) in micronucleus and
TK gene mutation assays, causing chromosomal aberration and sister chromatid exchange in
vivo and in vitro (Koyama et al., 2006; Martins et al., 2007; Tsuda et al., 1993). Further, since
AA has been proven negative in bacterial gene mutation assays (Knaap et al., 1988; Tsuda et
al., 1993) it seems that AA is weakly clastogenic without damaging DNA directly, acting
through protein binding rather than DNA binding. In addition, AA have been reported to
generate reactive oxygen species (ROS) that can attack cellular constituents such as proteins,
nucleic acids, and lipids (Yousef and El-Demerdash, 2006).

Effects of a food contaminant on cell cycle
lymphoblastoid cell line. Master thesis by Elin Bakken Ansok 2009
Reactivity:
Apparently, AA will react very slowly with DNA
1985), forming adduct only under forced chemical conditions and after extended reaction time
(>40 days) (Solomon et al., 1985)
possible mechanism for the production of mutations and/or subsequent carcinogenicity
(Gamboa da Costa et al., 2003; Segerback et al., 1995)
rise to a number of DNA adducts including the two alkylating adducts N7
carbamoyl-2-hydroxyethyl)guanine), and to a lesser extent N3
hydroxyethyl)-adenine) (depurinating)
2-hydroxyethyl)-2’-deoxyadenosine) (stable)
2003; Segerback et al., 1995).
Figure 3. Structures of GA derived adducts.
The in vitro reaction of GA with DNA forms adduct in the following order: N7
N1-GA-dA > N3-GA-dA (Gamboa da Costa et al., 2003)
with other epoxides (Koskinen and Plna, 2000)
induced by GA and the predominant reaction of many alkylating chemicals
et al., 2003; Maniere et al., 2005; Mei et al., 2008)
cell cycle - Glycidamide induced S-phase arrest followed by apoptosis iMaster thesis by Elin Bakken Ansok 2009
will react very slowly with DNA (Friedman et al., 1995; Solomon et al.,
, forming adduct only under forced chemical conditions and after extended reaction time
(Solomon et al., 1985). Although AA is a weak mutagen, the DNA adducts is a
possible mechanism for the production of mutations and/or subsequent carcinogenicity
(Gamboa da Costa et al., 2003; Segerback et al., 1995). GA is much more reactive and gives
rise to a number of DNA adducts including the two alkylating adducts N7
hydroxyethyl)guanine), and to a lesser extent N3-GA-Ade (N3
adenine) (depurinating) in vivo and in vitro, and N1-GA-Ade (N1
deoxyadenosine) (stable) in vitro (Figure 3) (Gamboa da Costa et al.,
.
. Structures of GA derived adducts. Modified from (Gamboa da Costa
The in vitro reaction of GA with DNA forms adduct in the following order: N7
(Gamboa da Costa et al., 2003), a pattern which also have been seen
(Koskinen and Plna, 2000). Thus, N7-GA-Gua is the predominant adduct
induced by GA and the predominant reaction of many alkylating chemicals
et al., 2003; Maniere et al., 2005; Mei et al., 2008).
16
llowed by apoptosis in a
(Friedman et al., 1995; Solomon et al.,
, forming adduct only under forced chemical conditions and after extended reaction time
. Although AA is a weak mutagen, the DNA adducts is a
possible mechanism for the production of mutations and/or subsequent carcinogenicity
is much more reactive and gives
rise to a number of DNA adducts including the two alkylating adducts N7-GA-Gua (N-7-(2-
Ade (N3-(2-carbamoyl-2-
Ade (N1-(2-carboxy-
(Gamboa da Costa et al.,
et al., 2003)
The in vitro reaction of GA with DNA forms adduct in the following order: N7-GA-Gua >
, a pattern which also have been seen
Gua is the predominant adduct
induced by GA and the predominant reaction of many alkylating chemicals (Gamboa da Costa
17
Effects of a food contaminant on cell cycle - Glycidamide induced S-phase arrest followed by apoptosis in a lymphoblastoid cell line. Master thesis by Elin Bakken Ansok 2009
5.1.3 Acrylamid on vital proteins of the mitotic spindle
The neurotoxicity of AA is, among other effects, caused by interference with the kinesin-
related motor proteins in nerve cells (as reviewed in LoPachin, 2004). Effects on kinesin
proteins could also explain some of the indirect genotoxic effects of AA. These proteins form
the spindle fibers in the nucleus that function in the separation of chromosomes during cell
division.
Studies on the effects of AA on microtubules have shown very little effect. However,
microtubule-associated motor proteins are also essential components of the spindle, therefore
kinesin motors are logical targets due to their critical involvement in cell division and
previous observations of AA-induced neuronal kinesin inhibition (Sickles et al., 1996; Sickles
et al., 2007) Kinesins have shown AA-induced neuronal kinesin inhibition (Sickles et al.,
2007) and AA and GA specifically inhibit a type of kinesin motor proteins associated with the
mitotic/meiotic spindle, in a similar concentration range as the neuronal kinesins (Sickles et
al., 1996). So there seems to be a similar dose-response effect on dividing cells and
neurotoxicity caused by AA. This inhibition is relevant in relation to mutagenicity, cell cycle
effects and potential carcinogenicity of AA/GA. KRP2, a kinesin motor protein responsible
for spindle assembly and disassembly of kinetochore microtubuli, have shown to be
significantly inhibited by concentrations of GA of 5- to 10-fold less than AA. GA may
therefore act on multiple kinesin family members and produce toxicities in organs highly
dependent on microtubule-based functions (Sickles et al., 2007). This may also explain some
of the clastogen effects of AA and GA.
Overall, Since epidemiological studies presume that 20-50% of all human cancers are due to
dietary causes (Strickland and Groopman, 1995) food is likely to have an important impact on
cancer development. In addition, since AA is found as a by-product in different popular food
products, such as French fries and chips, and the carcinogenicity of AA in mice and rats is
well documented, there should be room for concerns.
The mode of action still remains unclear for AA-induced carcinogenicity. However, both AA
and GA show clastogenic effects. Additionally, GA and have been positive for mutagenicity
and DNA reactivity in a number of in vitro and in vivo assays. Thus, the potential for altered

18
Effects of a food contaminant on cell cycle - Glycidamide induced S-phase arrest followed by apoptosis in a lymphoblastoid cell line. Master thesis by Elin Bakken Ansok 2009
cell cycle regulation and genotoxicity is highly likely. Lastly, since neurotoxicity of AA is,
related to actions on proteins also important in cell division further research is still needed to
investigate the relationship between AA, GA and the effects at the molecular level leading to
carcinogenicity. For this reason, we have studied the affect of GA on DNA damage and cell
cycle regulation.
5.2 DNA damage
Cellular DNA is susceptible to damage every day from different carcinogenic compounds in
the environment or food, UV light, spontaneous hydrolytic events or normal reactive
metabolites. DNA damage can be divided into two major classes, endogenous and exogenous,
which may be partly overlapping although their cause is different. Endogenous DNA damage
includes mainly hydrolytic and oxidative reactions. Exogenous factors include physical and
chemical agents, especially electrophilic molecules and substances producing reactive oxygen
species.
Figure 4. Cellular responses to DNA damage (Friedberg, 2001).

19
Effects of a food contaminant on cell cycle - Glycidamide induced S-phase arrest followed by apoptosis in a lymphoblastoid cell line. Master thesis by Elin Bakken Ansok 2009
5.2.1 DNA adducts
Electrophilic compounds can interact with the ring nitrogens, exocyclic amino groups,
carbonyl oxygens, and the phosphodiester backbone. This results in alkylation products that
are covalent derivatives of reactive chemical species with DNA. Direct-alkylating agents
induce preferential binding to highly nucleophilic centers such as the N7 guanine (Loeb and
Preston, 1986).
DNA adducts are mostly connected to the nucleophilic groups of adenine and guanine.
The adduct can be stable or unstable (depurinating) depending on the position on the base at
which the adduct is formed (Loeb and Preston, 1986). Stable adducts remain covalently
bonded to DNA unless removed during repair, while depurinating adducts are spontaneously
released from DNA by destabilization of the glycosidic bond (as reviewed in Cavalieri et al.,
2000). Depurination of adenine most often leads to A � T mutations, while depurination of
guanine leads to G � T mutations (Cavalieri et al., 2000).
Figure 5 Double-stranded DNA showing the sites of DNA adduct formation including important targets for alkylators (N7G, N3A etc.) (Jenkins et al., 2005).
Depurination can occur spontaneously or following the formation of an unstable adduct (Loeb
and Preston, 1986). Cleavage of the N-glycosyl bond results in loss of bases from nucleic
acids leaving the sugar-phosphate behind as an abasic site (AP site). An AP site is denoted
”apurinic” with the loss of a purine, or ”apyrimidinic” with the loss of pyrimidine; these are
the most common DNA lesions generated by both spontaneous and induced base loss (Loeb
and Preston, 1986). During replication, a random nucleotide is incorporated opposite to the

20
Effects of a food contaminant on cell cycle - Glycidamide induced S-phase arrest followed by apoptosis in a lymphoblastoid cell line. Master thesis by Elin Bakken Ansok 2009
AP site, usually adenine, producing mispairing and hence a mutation after DNA replication.
The glycosyl bond at an AP site is susceptible to hydrolysis, which results in a single strand
break. The biological consequences of unrepaired AP sites are numerous. AP sites can block
progression of RNA and DNA polymerase, resulting in impairment of gene transcription and
DNA replication. If polymerases manage to bypass these lesions during transcription or
replication, the effect may be deleterious for genome stability since there is a high probability
that a wrong base will be inserted opposite an AP site leading to gene mutations (Frosina et
al., 1996).
Alkylating agents comprise one of the broadest classes of DNA-damaging agents. Of
particular interest are methylated bases, such as 3-methyladenine (3MeA) and 7-
methylguanine (7MeG) (Figure 6), that are formed i.e. by cancer chemotherapeutics, agents in
the environment, and also by endogenous cellular processes (Sedgwick, 1997).
Figure 6 N7-Methyleguanine (O'Connor et al., 1988)
Each of these lesions, if not properly repaired, may have detrimental effects. Of these, 7MeG
is considered to be the most harmless, since it does not appear to interfere directly with DNA
replication in vivo or in vitro. However, 7MeG lesions may spontaneously depurinate to form
potentially mutagenic abasic sites or the ring-opening formamidopyrimidines (Fapy)
derivative Fapy-7MeG with DNA inhibition potential in vitro (O'Connor et al., 1988; Wyatt
and Pittman, 2006).
N1-MeA and N3-MeA could serve as a block to DNA synthesis since N3-MeA can slow S-
phase progression in the absence of its repair (Engelward et al., 1998; Smith and Engelward,
2000) and has been shown to be a lethal lesion in vitro (Boiteux et al., 1984), while the N1
lesion disrupts basepairing (Singer, 1975). N7-alkylated guanines can depurinate or be
attacked by a hydroxyl group at the C-8 position leading to an opening of the imidazol ring

21
Effects of a food contaminant on cell cycle - Glycidamide induced S-phase arrest followed by apoptosis in a lymphoblastoid cell line. Master thesis by Elin Bakken Ansok 2009
giving an alkyl-FaPy-G lesion (Figure 7). Unsubstituted FapyA and FapyG caused by DNA
oxidation cause moderate inhibition of DNA synthesis, which is DNA polymerase and
sequence dependent. Fapy-7MeG, the methylated version of FapyG, efficiently inhibits DNA
replication in vitro, but is not mutagenic. FapyA and Fapy-7MeA on the other hand, possess
miscoding potential. Though, Fapy lesions are actively eliminated by repair glycosylases
specific for oxidized purines and pyrimidines (Tudek, 2003).
Figure 7 FapyA and FapyG (Krishnamurthy et al., 2008)
5.2.2 Single- and double-strand breaks
Radiation, oxidative damage and depurination can lead to single- and double-strand breaks.
Of the different types of DNA damage that occur in cells, single-strand breaks (SSBs) are the
most common, arising at a frequency of tens of thousands per cell per day from direct attack,
by intracellular metabolites and from spontaneous DNA decay. SSBs occur in three orders of
magnitude more frequently than double-strand breaks (DSBs). SSBs can occur directly by
disintegration of the oxidized sugar or indirectly during DNA base-excision repair (BER) of
oxidized bases, abasic sites, or bases that are damaged.(as reviewed in Hegde et al., 2008).
During BER, incision occurs at an AP site by the AP endonuclease 1 (AP1) or by the lyase
activity of a bifunctional DNA glycosylase occurs (Hegde et al., 2008). Chromosomal SSBs
can, if not repaired rapidly, block DNA replication forks during the S-phase of the cell cycle,
possibly leading to the formation of DSB (Kuzminov, 2001). Even though this type of DSB is
rapidly repaired by homologous recombination (HR), an acute increase in cellular SSB levels
might saturate this pathway, leading to genetic instability and/or cell death (Kuzminov, 2001).

22
Effects of a food contaminant on cell cycle - Glycidamide induced S-phase arrest followed by apoptosis in a lymphoblastoid cell line. Master thesis by Elin Bakken Ansok 2009
5.3 DNA repair
Since the genome suffer from various kinds of damage every day a multitude of different
mechanisms have evolved by which either damaged DNA is removed, or the potential
dangerous or lethal effects are mitigated. There are two fundamental DNA repair mechanisms
that involve either reversal of DNA damage or the excision of damaged elements (excision
repair). In excision repair the damaged bases can be excised as free bases in base excision
repair (BER), or as nucleotides in nucleotide excision repair (NER). Mismatch repair (MMR)
is another version of excision repair and involves the removal of mismatched bases in DNA.
Cells also acquire fracture in the sugar-phosphate backbone that results in either single- or
double-strand breaks. While strand breaks do not directly alter coding information in the
genome, fracture of the covalent integrity of the genome can interfere with normal DNA
transactions and lead to altered coding information.
DNA damage resulting in modified bases and sugars, DNA-protein adducts, base-free sites
and tandem lesions, can if unrepaired, impede DNA replication in dividing cells and provoke
DSB formation. The repair of DBSs is primarily divided into two types of pathway:
nonhomologous end joining (NHEJ) and homologous recombination (HR).Three different
mechanisms can be distinguished within excision repair: BER, NER and MMR. Mismatch
repair eliminated falsely paired bases or small DNA loops that occur during DNA slippage at
microsatellites during replication (Cann and Hicks, 2007; Frosina et al., 1996; Hegde et al.,
2008).
5.3.1 Base excision repair (BER)
Base excision repair (BER) is the predominant pathway for copying with a broad range of
small lesions resulting from oxidative, methylating, alkylating, deaminating and
depurination/depyrimidation damage. Typically, only a small region (1 to 13 nucleotides),
around the damaged base is removed and replaced during BER. It requires four to five
enzymes to carry out repair of DNA containing AP sites or base damage. These include a
specific DNA glycosylase that recognizes specific damaged bases and cleave the N-glycosidic
bond, and creating an AP site. An AP endonuclease cleaves the phosphodiester bond and
generates 3’OH and 5’deoxyribose phosphate (dRP) terminus. Then a DNA polymerase (Pol

23
Effects of a food contaminant on cell cycle - Glycidamide induced S-phase arrest followed by apoptosis in a lymphoblastoid cell line. Master thesis by Elin Bakken Ansok 2009
b) adds a new nucleotide and the nick is sealed by a DNA ligase. In addition to catalyzing the
cleavage of N-glycosidic bonds, some glycosylases have an additional AP lyase activity. The
gap filling and rejoining can continue by either of two sub-pathways: short-patch or long-
patch BER, whereby only one or 2-13 nucleotides are replaced, respectively. The decision to
proceed via the long-patch or short patch BER is not completely clear (Matsumoto et al.,
1994; Petermann et al., 2003). “Short-patch” repair represents approximately 80-90% of BER
activity. Long-patch requires many of the same factors as are involved in short-patch repair,
but unlike short-patch repair, long-patch is a PCNA dependent pathway (Frosina et al., 1996).
5.3.2 Nucleotide excision repair (NER)
NER is one of the most flexible DNA repair pathways, considering the diversity of DNA
lesion it may act upon. The most significant of the lesions are pyrimidine dimers caused by
UV. Other NER substrates include bulky chemical adducts, DNA intrastrand crosslinks, and
some form of oxidative damage. The common features of these lesions that are recognized by
NER are that they cause both helical distortion of the DNA duplex and a modification of the
DNA chemistry.
The NER process requires the action of more than 30 proteins in successive steps of damage
recognition, local opening of the DNA double helix around the injury, and incision of the
damaged strand on either side of the lesion. After excision of the damage-containing
oligonucleotide the resulting gap is filled by DNA repair synthesis, followed by strand ligation
(as reviewed in Fousteri and Mullenders, 2008).
There are two distinct forms of NER; global genomic NER (GG-NER) and transcription
coupled NER (TCNER). In both cases, the Xeroderma pigmentosum group C (XPC) protein
acts as the damage sensor and recruiter, and initiates the NER process (Leibeling et al., 2006).
Xeroderma pigmentosum group A (XPA) binds to the DNA and verifies the damage and
recruit further NER proteins. GG-NER corrects damage in trancriptionally silent areas
throughout the genome, and its repair efficiency varies across the genome most likely
influenced by the chromatin environment. TC-NER repairs lesions on the actively transcribed
strand of the DNA (as reviewed in Fousteri and Mullenders, 2008). The pathways are
identical except in mechanism of damage detection. (as reviewed in Fousteri and Mullenders,

24
Effects of a food contaminant on cell cycle - Glycidamide induced S-phase arrest followed by apoptosis in a lymphoblastoid cell line. Master thesis by Elin Bakken Ansok 2009
2008). The ability of certain proteins in the NER pathway to identify bulky DNA lesions that
have undergone helical distortions enables NER proteins to discriminate between damaged
and undamaged DNA. Three factors involved in the recognition step; XPC-RAD23B, XPA
and RPA, all show a binding preference to damaged duplex DNA compared to undamaged (as
reviewed in Shuck et al., 2008).
5.4 DNA damage and cell cycle response
Cell-cycle progression is a highly organized and tightly regulated process that controls cell
growth and cell proliferation and is tightly coupled with the regulation of DNA damage
repair. Changes in cell cycle regulators may lead to aberrant cell proliferation and
development of cancer. In order to better understand the mechanisms involved in response to
DNA damage it is essential to have a good knowledge of normal cell cycle regulation.
5.4.1 Regulation of the cell cycle machinery
The cell cycle is divided into four non-overlapping phases; G1, S, G2 and M. G1 and G2 are
gap phases that allow the cells to grow and prepare for transition to the next phase. In
addition, the cells may enter non-proliferative resting phase after mitosis (quiescent or
terminally differentiated cells) referred to as G0-phase. During G1 the biosynthetic activities of
the cell increases and the diploid cell has 2n chromosomes. Integration of proliferative and
anti-proliferative signals may lead to progression, pause or exit of the cell cycle. The S-phase
consists of DNA synthesis with doubling of the DNA content to 4n. Subsequently, cells enter
the G- phase where it prepares for mitosis in the M phase. Mitosis involves segregation of the
replicated genomes into separate nuclei and the division of the cell into two daughter cells
(Guttinger et al., 2009). Several control mechanisms exist to avoid inappropriate cell
proliferation.

25
Effects of a food contaminant on cell cycle - Glycidamide induced S-phase arrest followed by apoptosis in a lymphoblastoid cell line. Master thesis by Elin Bakken Ansok 2009
Figure 8. The cell cycle with its four phases (G1, S, G2, and M). Progression through the cell cycle is promoted by CDKs, which are regulated positively by cyclins and negatively by CDKIs. (Schwartz and Shah, 2005)
Progression through the different phases of the cell cycle is a highly regulated process
mediated by cyclin-dependent kinases (CDKs), a group of serine-threonine kinases.
Activation of CDKs is determined by their post-translational modification consisting of
phosphorylation/dephosphorylation events, and by the association of their respective cyclin,
the regulatory subunit of the CDK complex. Inhibition of CDK-cyclin complexes is
determined by the increased association of the cdk inhibitors (CKI’s) which will negatively
regulate the cell cycle (Jeffrey et al., 2000) (see Figure 8).
Cyclins
Cyclins are, as the name indicates, cycling proteins. They oscillate through the cell cycle and
form a complex with their CDK partners, which have stable protein levels. The first cyclins to
be expressed in G0/G1 are the D-type cyclins. Cyclin Ds complex with CDK4/6 and the
resulting active kinase-complex phosphorylates pRB initially in G1 and promotes the pRb-
dependent exit from the quiescent state of the cell cycle (as reviewed in Maddika et al., 2007).
Cyclin E is expressed in late G1-phase, with a peak in abundance at the G1/S boundary of the
cell cycle (Dulic et al., 1994). E-type cyclins are thought to be required to activate Cdk2 for
proper completion of the G1-phase and its activity is required for the G1-S transition and the

26
Effects of a food contaminant on cell cycle - Glycidamide induced S-phase arrest followed by apoptosis in a lymphoblastoid cell line. Master thesis by Elin Bakken Ansok 2009
initiation of DNA replication. Cyclin A is the second partner of CDK2 and its activity is
necessary for the passage through S-phase (as reviewed in Maddika et al., 2007).
Cyclin-dependent kinase inhibitors, CKI’s
CDKs, which in connection with their positive regulators, cyclins, allow the transition from
one cell cycle to the other. They are, in addition, tightly regulated by inhibitory
phosphorylation and by inhibitory molecules such as cdk inhibitors (CKI). Based on their
sequence homology and specificity of action, CKIs are divided into two distinct families:
INK4 and Cip/Kip. The INK4 family of CDKIs (p16INK4A, p15 INK4B, p18INK4C, p19INK4D)
interact specifically with cdk4 and cdk6 kinase subunit (cyclin D-associated kinases), and are
specific for early G1 phase regulation and prevent entry into S phase (Jeffrey et al., 2000). The
second family, the Cip/Kip (CDK interacting protein/kinase inhibitory protein) family
inlclude p21CIP1, p27KIP1 and p57KIP2 and inhibit a broader spectrum of cyclin-CDK
complexes during all phases of the cell cycle (Denicourt and Dowdy, 2004), and are therefore
not specific for a particular cell cycle phase.
p21CIP1 and p27 KIP1
Due to a high level of homology, p21CIP1 and p27KIP1 are believed to inhibit their targets
through similar mechanisms (as reviewed in Coqueret, 2003). Following anti-mitogenic
signals or DNA damage, p21CIP1 and p27KIP1 bind to cyclin-CDK complexes to inhibit their
catalytic activity and induces cell cycle arrest (Denicourt and Dowdy, 2004; Sanchez-Beato et
al., 1997; Vervoorts and Luscher, 2008). p27KIP1 protein levels significantly decrease once
cyclinE/CDK2 is activated in late G1 as a result of decreased p27KIP1 protein stability. The
main role of p21CIP1 in cell cycle regulation is to inhibit the activity of CDK4 and especially
CDK2, required for G1/S transition and may therefore lead to G1 arrest (Zhang et al., 1993).
Induction and activation of the tumour suppressor p53 in response to DNA damage may in
many cases lead to the induction of p21CIP , owing to the strong p53 binding element in the
p21CIP1 gene promoter (Dulic et al., 1994). Further, may this lead to a G1 arrest, and in
combination with other events, may lead to apoptosis (Deng et al., 1995). In addition, p21CIP1
is able to bind and inhibit the proliferating cell nuclear antigen (PCNA) (Zhang et al., 1993), a
subunit of the DNA-polymerase. This enables p21CIP1 to regulate DNA synthesis and thereby
contributing to the p53-dependent checkpoint of cell cycle progression by impeding DNA-

27
Effects of a food contaminant on cell cycle - Glycidamide induced S-phase arrest followed by apoptosis in a lymphoblastoid cell line. Master thesis by Elin Bakken Ansok 2009
replication. Additionally, p21CIP1 can be regulated via p53 independent pathways as well
(Somasundaram et al., 1997) (Coller et al., 2000). This may occur for example by post
translational modification, such as phosphorylation leading to cytoplasmic localization and
thereby inactivation of p21CIP1 (Zhou et al., 2001).
5.4.2 Cell cycle checkpoints
In conclusion, each phase of the cell cycle contains checkpoints that provide an opportunity to
put the cells on halt in order to repair damaged DNA and complete replication before
attempting further cell-cycle progression and entry into mitosis. After passing these
checkpoints cells are irreversibly committed to the next phase. DNA damage and/or
malfunction of the critical organelles or structures (e.g. faulty mitotic spindle) can activate
cell cycle arrest and even apoptotic cascades, leading to cell death which allows selective
removal of unwanted or damaged cells (Jeggo and Lobrich, 2006; Lukas et al., 2004; Su,
2006).
5.4.3 G1/S checkpoint
The activation of the G1/S checkpoint leads to cell cycle arrest before the onset of DNA
synthesis, giving time to repair the lesions in the DNA template. An important protein in this
step is p53 which is rapidly activated following DNA damage. In general, cell cycle arrest
before or during S phase (G1-S and intra-S chekpoints, respectively) occurs via inhibition of
cyclin-dependent kinase 2 (CDK2) activity, which is needed for S phase, either by binding of a
Cdk inhibitor or by reduction of Cdc25 phosphatase activity an activator of Cdk2. ATM,
Chk1- and Chk2-mediated phosphorylation, and subsequent degradation of Cdc25A,
contribute to both G1-S and intra S checkpoints (Su, 2006).
5.4.4 S-phase checkpoints
Given the complexity of the DNA replication, there are several errors and lesions that occur
spontaneously during the S-phase process of every cell. Protecting the integrity of the genome
during this critical phase is more significant than in G1 or G2 via checkpoints of these phases,
or the mitotic spindle checkpoint (Lukas et al., 2004). The S-phase checkpoints can be divided

28
Effects of a food contaminant on cell cycle - Glycidamide induced S-phase arrest followed by apoptosis in a lymphoblastoid cell line. Master thesis by Elin Bakken Ansok 2009
into three categories. 1) The replication checkpoint is initiated when the progression of
replication forks becomes stalled in response to stress. This checkpoint has two functions;
first to inhibit the initiation of DNA replication from hitherto unfired origins through targeting
cyclin-CDK complexes, and secondly to protect the integrity of the replication forks and
allowing the recovery of cell-cycle progression after DNA repair and/or restoration of the
dNTP pool. 2) The intra-S-phase checkpoint is activated by DSBs that are generated in the
genomic loci outside the active replicons. This is in contrast to the other checkpoints
independent of replication forks. 3) The S-M checkpoint ensures that cells do not attempt to
divide before their entire genome becomes fully duplicated. Failure results in mitotic
catastrophy of cells that have incompletely replicated DNA. None of these three S-phase
checkpoints has p53 as an absolute requirement, which is the key target of sustained G1 arrest,
but may contribute (Lukas et al., 2004).
5.4.5 G2/M checkpoint
The role of the G2/M checkpoint is to ensure that the chromosomes are intact and ready for
separation before cells enter mitosis. This is important for the genomic stability, since the
segregation of partially replicated or damaged chromosomes can result in DNA breakage and
lead to chromosomal aberrations and aneuploidy. However, the control mechanisms are not
absolute and cells with low levels of damage or incompletely separated/replicated DNA may
in fact enter mitosis (Shimada and Nakanishi, 2006). If cells enter S-phase after an aberrant
sister chromatide segregation during mitosis, known as mitotic slippage, this may result in
endoreduplication of the DNA, thus the DNA is duplicated without mitosis. p53 was found to
be activated during spindle checkpoint-mediated mitotic arrest thereby leading to a crucial
postmitotic G1-checkpoint. Thus, p53 activation together with an intact spindle checkpoint is
required to prevent endreduplication upon mitotic failure and therefore protects normal cells
from polyploidisation (Tsuiki et al., 2001; Vogel et al., 2004).
5.5 Tumor supressor protein, p53
The p53 tumour suppressor protein is a short-lived transcription factor that becomes stabilised
in response to a wide range of cellular stresses. Ubiquitination and the targeting of p53 for

29
Effects of a food contaminant on cell cycle - Glycidamide induced S-phase arrest followed by apoptosis in a lymphoblastoid cell line. Master thesis by Elin Bakken Ansok 2009
degradation by the proteasome is mediated by Mdm2 (mouse double minute clone 2), a
negative regulatory partner of p53. Serine 15 phosphorylation of p53 leads to a stabilization of
p53 by reducing its interaction with Mdm2. p53 regulates various cellular events, such as the
cell cycle, apoptosis and DNA repair in response to DNA damage, and plays an important role
in maintenance of genomic stability (Hoeijmakers, 2001). Therefore, p53-mediated DNA
repair may play an essential role in the maintenance of genomic stability. Moreover, p53 has
been shown to be involved in various types of DNA repair, including NER, BER and repair
DSBs (Smith and Seo, 2002; Zurer et al., 2004).
Once activated, p53 transcribes a number of genes. There are three primary responses to a
stress input signal by the p53 pathway; cell cycle arrest, apoptosis or cellular senescence. For
instance, p21CIP1 is a target gene of p53 that mediates G1 arrest, and is phosphorylated and
activated by p53 in response to cellular stress. This further inhibits CDK4/Cyclin D that
normally phosphorylates pRB which ultimately leads to inhibition of transcription of S-phase
genes required for G1 transition (Lavin and Gueven, 2006).
5.6 Cell death
Dying cells are engaged in a process that is reversible until an irreversible phase of “point-of-
no-return” is trespassed. This is not yet a clearly defines biochemical event, but the
Nomenclature committee on Cell Death (NCDD) proposes that a cell should be considered
dead when one of the following morphological criteria is met: (1) The cell integrity of the
plasmamembrane is lost, as defined by the incorporation of vital dyes (eg., PI) in vitro; (2)
complete fragmentation into discrete bodies (apoptotic bodies) of the cell and its nucleus;
and/or (3) its corpse (or its fragments) has been engulfed by an adjacent cell in vivo (as
reviewed in Kroemer et al., 2009). Thus, cell death can be classified according to its
morphological appearance (apoptotic, necrotic, autophagic or associated with mitosis),
enzymologial criteria (with or without the involvement of nucleases or proteases), functional
aspects (programmed or accidental, physiological or pathological) or immunological
characteristics (immunogenic and non-immunogenic) (Gorczyca, 1999).

30
Effects of a food contaminant on cell cycle - Glycidamide induced S-phase arrest followed by apoptosis in a lymphoblastoid cell line. Master thesis by Elin Bakken Ansok 2009
5.7 Apoptosis
Apoptosis is generally referred to as “programmed cell death” and is one of the main types of
programmed cell death which involves a series of biochemical events leading to specific cell
morphology characteristics and ultimately death of cells.
The apoptotic process commence with specific signals that initiates a number of distinctive
biochemical and morphological changes in the cell. A family of caspases and proteases are
activated early in the process and they cleave cellular substrates necessary for normal cellular
function, and activate other degradation enzymes which cleave the DNA. This results in the
appearance of morphological changes in the cells and extensive DNA cleavage (Riccardi and
Nicoletti, 2006). The morphological features of apoptosis include rounding up of the cell,
retraction of pseudopodes, reduction of cellular and nuclear volume (pykonosis), modification
of cytploasmic organelles, plasma membrane blebbing and engulfment of resident phagocytes
in vivo (Kroemer et al., 2009). Because DNA fragments are lost from apoptotic cells, nuclear
DNA content can be easily measured by flow cytometry, as they eventually end up in the sub-
G1 population. In contrast to apoptosis, the morphological features of necrosis include
cytplasmic swelling (oncosis), rupture of the plasma membrane, swelling of cytplasmic
organelles and moderate chromatin condensation, and is caused by a passive degenerative
process (Kroemer et al., 2009).
5.7.1 DNA-damage induced apoptosis
A DNA-damaging agent not only targets DNA but also causes damage to other cellular
components. Therefore targets other than DNA must also be taken into account when
studying DNA-damage and apoptosis. However, apoptosis provoked by genotoxins is largely
due to DNA damage (Roos and Kaina, 2006a). Apoptosis can be triggered by many different
types of DNA damage induced by for instance UV light or different types of carcinogens,
such as methylating agents found in tobacco smoke or food causing the killing lesion, O-6-
methyl-guanine. N-methylated bases that are induced by alkylating agents such as N3-methyl
adenine or N7-methylguanine are cytotoxic and at high levels such lesions can trigger
apoptosis(O'Connor et al., 1988). Chemical genotoxins like benzo(a)pyrene (BaP) from

31
Effects of a food contaminant on cell cycle - Glycidamide induced S-phase arrest followed by apoptosis in a lymphoblastoid cell line. Master thesis by Elin Bakken Ansok 2009
combustion reactions or smoke cause bulky adducts in the DNA and can trigger apoptosis.
One important pathway linking DNA damage to apoptosis is the ATM/ATR-triggered
pathway involving the checkpoint kinases, CHK1 and CHK2, and p53. p53 induces
transcriptional activation of pro-apoptotic factors such as FAS, PUMA and BAX leading to
mitochondria dysfunction and thereby apoptosis (Roos and Kaina, 2006b).
32
Effects of a food contaminant on cell cycle - Glycidamide induced S-phase arrest followed by apoptosis in a lymphoblastoid cell line. Master thesis by Elin Bakken Ansok 2009
6. Methods
6.1 Cell cultures
6.1.1 Lymphocytes versus lymphoid cell culture
Circulating human peripheral blood lymphocytes (PBL) will only survive for a short period of
time without undergoing morphological alterations, extensive synthesis of macromolecules or
mitosis, when cultured in vitro. The resting peripheral blood lymphocytes normally remain in
a quiescent state, described as G0, containing a diploid DNA content (2C). When stimulated,
they will increase their RNA, protein and DNA synthesis. The stimulation can be brought
about by several agents; in this case in this case phytohemagglutinin (PHA) was used. PHA
stimulation triggers a set of metabolic events resulting in entering of the G1-phase, after
approximately 12 hours, and RNA synthesis, which will continue to increase during the S-
phase, beginning about 30 hours after stimulation, in which DNA synthesis occurs.
As a model system for studying the effect of AA/GA on human lymphoid cells, we used a
continuously growing Epstein-Barr Virus (EBV) transformed B-lymphoid cell line already
available in our laboratory (GM00130C). The advantages of using a cell line are: 1) access to
a practically unlimited number of cells, 2) they can be grown for an extended time period and
3) easier handling and less time consuming cell isolation, than required for PBL. However,
there are also disadvantages using cell lines, especially when studying cell cycle control and
responses to DNA-damage. Obviously the cell cycle is altered in these cells and therefore
should be taken into consideration when interpreting the data.
6.1.2 EBV transformed B-lymphocytes
In this project, the GM00130C cell line was utilized as a model system resembling stimulated
normal lymphocytes. GM00130C is derived from B-lymphocytes immortalized by the
Epstein-Barr virus (EBV) and was obtained from Coriell Cell Repositories (Coriell Institute
for Medical Research, Camden, New Jersey). These cell lines are usually polyclonal in
derivation. The lymphoblasts were grown as a suspension culture in RPMI with 10% heat
33
Effects of a food contaminant on cell cycle - Glycidamide induced S-phase arrest followed by apoptosis in a lymphoblastoid cell line. Master thesis by Elin Bakken Ansok 2009
inactivated calf serum and 1% penicillin and streptomycin with 5% CO2 in air under saturated
humidity at 370C. Their morphology is small (7-9 micron) round cells that grow as loose
aggregates in suspension. The cells were cultured at a density between 0.2 x 10⁶ – 1 x 10⁶
cells/ml.
Cell culture treatment.
The cells were seeded out in Costar cell culture dishes at a concentration of 0.2 x 10⁶ cells/ml.
Cells were exposed to AA or its metabolite GA at concentrations varying from 20 µM to 1
mM. GA or AA was always prepared in fresh solutions the same day (diluted in PBS). All cell
treatment was performed under sterile conditions.
6.1.3 Isolation of primary lymphocytes from whole blood
Blood samples were obtained by venepuncture from healthy volunteers. Lymphocytes were
isolated by Ficoll-Hypaque density gradient as follows:
1. Whole blood was diluted 1:1 with PBS and transferred to pre-made lymphoprepTM
tube (Axis-Shield PoC AS). The tubes was centrifuged for 20 min 500 x G at room
temperature.
2. The layer of mononuclear cells was transferred to a new falcon tube and washed with
medium and centrifuged at 500 x G at room temperature for 5 minutes.
3. The pellet was resuspended in medium, counted and diluted in prewarmed RPMI-
medium containing 10% FCS and 1% PS to the desired cell concentration, preferably
2x10⁶/ml.
6.1.4 Stimulation of resting peripheral blood lymphocytes (PBL) into late G1
In order to obtain good control lysates for the Western procedure when detecting the cell
cycle parameters such as p21CIP1, p27, cyclin A and cyclin E, we stimulated PBL into late G1.
In resting cells, G0, the protein content of p21CIP/KIP is low and the content of p27KIP is high
due to p27 KIP contribution to maintain lymphocytes in a quiescent state (Vervoorts and
Luscher, 2008).When PBL are stimulated by PHA into late G1, around 30 hours post

34
Effects of a food contaminant on cell cycle - Glycidamide induced S-phase arrest followed by apoptosis in a lymphoblastoid cell line. Master thesis by Elin Bakken Ansok 2009
stimulation, the cyclins and p21KIP are upregulated while p27KIP is down regulated (Vervoorts
and Luscher, 2008).
1. The cells were seeded out at a concentration of 2 x 10⁶ cells/ml and
phytohemagglutinin (PHA) added to a final concentration of 1µg/ml.
2. The cells were incubated at 37oC with 5% CO2 for 31 hours until cells had reached
late G1. For western procedure, cells were pelleted by centrifugation at 500 x G for 5
minutes and lysed according to the protocol in section 6.9.5.
6.2 Metabolism of acrylamide to glycidamide using liver S9 fractions
In order to metabolize AA to GA in cell cultures we used liver S9 fractions which are
subcellular fractions that contain several drug-metabolizing enzymes, including the
cytochromes P450, flavin monooxygenases and UDP gluronyl transferases, and are therefore
expected to metabolize AA. Pooled human liver S9 obtained from In Vitro Technologies was
prepared form several donors with mixed sexes.
Procedure:
1. The final culture medium should contain 10% of S9-mix.
2. The NADPH Regenerating System (NRS) was prepared fresh every time and kept on
ice.
3. All ingredients were mixed except the G-6-P dehydrogenase and the S9-fraction.
4. Immediately before exposure to AA the S9-fraction and the G-6-P dehydrogenase was
added to the mixture.
From the stock solutions, the amount of S9-mix needed was prepared according to the
volumes (µl) in the Table 1:

35
Effects of a food contaminant on cell cycle - Glycidamide induced S-phase arrest followed by apoptosis in a lymphoblastoid cell line. Master thesis by Elin Bakken Ansok 2009
Table 1: Ingredients used in S9 mix
Total S9-mix volume Stock
solutions
100
µl
End conc.
(mM)
S9 fraction
NRS (stored stock
solutions at at 4˚C)
1 M KCl
0,25 M MgCl2*6H20
0,2 M G-6-P
G-6-P DH (140 U/ml)
0,04 M NADP
RO water
PBS x
1.118 g/15ml
0.762 g/15ml
0.913 g/15ml
0.473 g/15ml
30
3.3
3.2
2.5
2.7
10
21.0
30.0
33
8
5
263.75 U/ml
4
0.3x
6.3 Methods to detect DNA damage and repair
6.3.1 The comet assay
The comet assay (single cell gel electrophoresis or SCGE) is a simple and sensitive technique
for measuring DNA strand breaks in single cells (Olive et al. 259-67;Ostling and Johanson
291-98;Singh et al. 184-91). The comet assay can be performed under neutral or alkaline
conditions. The neutral version is generally less sensitive. It was thought that the DNA of the
head and tail primarily was double-stranded and that only double strand breaks was
measured, whereas under alkaline conditions ssDNA appears in the tail while the head largely
consist of dsDNA (Collins et al., 1997), but this is still debated. However, the alkaline version
detects both DNA double strand breaks (DSB), DNA single strand breaks (SSB) and alkali-
labile sites (ALS) leading to an increased DNA migration (Collins et al., 1997). In our studies
we have only used the alkaline version.
The method is based on embedding exposed cells in agarose and lysing the cells with
detergents and high salinity. After lysing, we are left with the ‘nucleoids’ in the gel.
Nucleoids are protein depleted nuclei containing intact supercoiled DNA loops. After
incubating the gel and running electrophoresis at high pH (13.2) the DNA unwinds and if
36
Effects of a food contaminant on cell cycle - Glycidamide induced S-phase arrest followed by apoptosis in a lymphoblastoid cell line. Master thesis by Elin Bakken Ansok 2009
damaged, migrates out of the nucleoid resulting in structures resembling comets. This alkaline
comet assay detects both ss- and dsDNA breaks. The ssDNA breaks, which dominate largely
in numbers, are generally quickly repaired and maybe not the most interesting type of lesions
since they are not regarded as a significant lethal or mutagenic lesion. When exposing cells to
genotoxic compounds the DNA may encounter AP (Apurinic or Apyrimidinic) sites and not
strand breaks directly. The high pH of the electrophoresisbuffer causes the transformation of
these alkali-labile AP sites to single strand breaks by introducing breaks in the phosphodiester
backbone. Thus, the supercoiled DNA becomes relaxed and can be pulled out of the nucleoide
towards the anode (Collins et al., 1993). Additionally, to make the comet assay more sensitive
and more specific, the DNA can be incubated with lesion-specific endonucleases that detect
and digest specific base lesions and thereby produce single strand breaks. The more strand
breaks that exist in the DNA the more loops can be pulled out and therefore, the percentage of
DNA in the tail is a direct measurement of the amount of damage the DNA possess. The net
damage obtained by the specific enzyme can be calculated by subtracting the damage
obtained without adding the enzyme, giving an estimate of the percentage of a specific lesion
the DNA has attained.
Lesion specific endonucleases
By introducing lesion-specific repair endonucleases any lesion for which a repair
endonuclease exist can be detected. This is a necessary step to allow detection of lesions that
are not frank breaks.
Formamido pyrimidine N-glycosylase (FPG)
The bacterial enzyme from Escherichia coli, formamido pyrimidine N-glycosylase (FPG)
protein is widely used and is recommended for the detection of oxidative DNA base damage
and frequently used in our laboratory. The Fpg-enzyme function is part of the BER-pathway
and it preferentially recognises 8-oxo guanine, but also ring-opened Fapy lesions. The ring-
opened Fpg-substrates include for instance Fapy-Gua (2,6-diamino-4-hydroxy-5-
formamidopyrimidine) and Fapy-Ade (4,6-diamino-5-formamidopyrimidine) (Boiteux et al.
106-10;Chetsanga and Lindahl 3673-84). The ring-opened purines of guanin will be excised
at the N-7 and C-8 position (Boiteux et al., 1987). Since the glycosylases in general have an
associated AP lyase or AP endonuclease activity, they cleave the DNA at the AP-sites and

37
Effects of a food contaminant on cell cycle - Glycidamide induced S-phase arrest followed by apoptosis in a lymphoblastoid cell line. Master thesis by Elin Bakken Ansok 2009
baseless sugars are left as BER intermediates. Since there might be other AP-sites not related
to oxidation, these too will be detected and cleaved by FPG. So, the enzyme specificity is not
absolute (Azqueta et al., 2008; Collins et al., 1993).
The comet assay protocol
DNA strand breaks and alkali labile sites were measured using the comet assay which was
performed using the method described by Singh et al. 1998 and Tice et al. 2000 with some
modifications.
1. After cell exposure, harvesting and washing the pellet, the cells were resuspended
carefully in PBS at a concentration of approximately 1 million cells per ml and kept on
ice.
2. The cells were then mixed 1:10 with 0,75% low melting agarose and dissolved in 10
mM EDTA in PBS at 37˚C. The cell suspension was mixed carefully and immediately
moulded out in the wells on a cold GelBond film with the use of a casting frame,
producing 12 gels on one film. Three technical replicates per sample were added each
time.
3. The GelBond films were then placed in cold lysis buffer at 4˚C for minimum 2 hours,
or overnight. Furthermore, the films were rinsed quickly in cold, distilled water before
equilibrating the gels in enzyme reaction buffer for 10 minutes followed by 50 minutes
prior to enzyme treatment.
4. The enzyme, Fpg, was added to a final concentration of 1 µg/ml to the preheated
enzyme reaction buffer, including 0.2 mg/ml bovine serum albumin (BSA) and
incubated at 37˚C for one hour.
5. The films were placed in electrophoresis buffer (pH 13.2) at 4˚C for 5 minutes + 35
minutes. This will stop the enzyme reaction and unwind the DNA.
6. Gel electrophoresis was performed in electrophoresis buffer (pH 13.2) at 8˚C for 20
minutes at 20 V and approximately 300mA, with an approximately voltage drop of
0.74 V/cm across the platform.
7. The films were neutralized in neutralizing buffer 2 x 5 min, to prevent further
unwinding. The gels were then fixed in absolute ethanol, dried and stored dark until
scoring.

38
Effects of a food contaminant on cell cycle - Glycidamide induced S-phase arrest followed by apoptosis in a lymphoblastoid cell line. Master thesis by Elin Bakken Ansok 2009
6.3.2 Scoring of comets
The DNA was stained with SYBR®Gold in TE-buffer for 20 minutes. The comets were
scored using the image analysis software “Comet assay IV” from Perceptive Instruments and
using a Leica DMLB with an Osram Mercury Short ARC HBO® 50W/2 light bulb or or an
Olympus BX51 microscope with an Osram Mercury Short ARC HBO 100® W/2 light bulb.
The comets were selected by the operator. For each comet, the software calculates the total
intensity (amount of DNA) of the comet, the intensity of the tail (from the middle of the head
and to the end of the tail) and of the head, and then calculates per cent DNA in the tail versus
that of the total comet. This “per cent tail intensity” was used as a measure of damage. It
increases linearly with break frequency. In each gel 50 comets were scored, overlapping
comets were avoided since the software cannot discriminate between them and this would
lead to an incorrect per cent tail DNA. Importantly, the cell density is critical when moulding
the cells in order to avoid overlapping cells or comet tails.
6.3.3 Determination of repair capacity
To determine the repair capacity of GA-induced lesions in GM00130C, suspension cells were
exposed to 0.1 mM and 0.5 mM GA in a cell incubator under standard conditions at 37˚C with
5% CO2. The cells were exposed to different concentrations of GA for 2 or 4 hours, washed
twice with medium and incubated further in medium for 2 and 20 hours, respectively. The
DNA damage and repair was then analyzed by the Comet assay procedure.
6.4 Flow cytometric analysis of cell cycle distribution
Flow cytometric analysis is a widely used method that allows simultaneous multi-parameter
analysis of single cells, and is predominantly used to measure fluorescence intensity produced
by fluorescent-labelled antibodies detecting proteins or ligands that bind to specific cell-
associated molecules, such as DNA binding by Propidium Iodide. All analysis was performed
on BD LSRII TM flow cytometer from BD Biosiences.

39
Effects of a food contaminant on cell cycle - Glycidamide induced S-phase arrest followed by apoptosis in a lymphoblastoid cell line. Master thesis by Elin Bakken Ansok 2009
Two of the most popular flow cytometric applications are the measurement of cellular DNA
content and determining the stages of the cell cycle within a population of cells. This can be
carried out on fixed or live cells using different fluorescent DNA binding dyes in conjunction
with antibodies to analyse antigen expression.
Cellular DNA content:
By adding a fluorescent dye that binds stoichiometrically to the DNA, the nuclear DNA
content can be quantitatively measured. The principle is based on that the stained material has
incorporated an amount of dye proportional to the amount of DNA. When measured in the
flow cytometer the emitted fluorescent signal yields an electronic pulse with a height
(amplitude) proportional to the total fluorescence emission from the cell. These data are
considered as a measurement of the cellular DNA content (Shapiro, 2003).
Cell cycle analysis:
The determination of the relative DNA content enables discrimination between the various
phases of the cell cycle. There are four distinct phases G1- S-, G2 and M-phase in a
proliferating cell cycle, However since both G2- and M-phase contain the same amount of
DNA they cannot be discriminated based on differing DNA contents.
One important aspect of DNA analysis by flow cytometry is the ability of the cytometer to
exclude cell doublets. A doublet is formed when two cells with a G1-phase DNA content are
recorded by the flow cytometer as one event with a cellular DNA content similar to a G2/M-
phase cell. If the sample analyzed contains many doublets this would yield an overestimation
of the G2/M-phase population. By looking at pulse width (i.e duration) versus pulse area one
can exclude cell doublets since a true G2 cell will have a smaller width compared to a pair of
G1 cells passing through the laser beam simultaneously. Since the width of the fluorescence
from the DNA dye increases with the diameter of the doublet particle, while both the
G1doublet and the G2/M single produce the same fluorescence area signal, one can
discriminate the G1-doublet from a single G2-cell (Figure 9). Therefore, in a dot plot
histogram it is possible to isolate or “gate” the population of singlet G1, S and G2/M cells in
order to study the population of interest (Nunez, 2001). Once the single cell population is

Effects of a food contaminant on cell cycle
lymphoblastoid cell line. Master thesis by Elin Bakken Ansok 2009
identified, the percentage of cells in G
subjectively setting gates or by using a program that will mathematically deconvolute the
DNA histogram and thus give a more accurate measureme
phase (Shapiro, 2003).
Figure 9 Gating of single cells in flow cytometry
Cell cycle analysis software
Several manufacturers have developed software for cell cycle analysis. These provide
mathematical models for fitting the DNA histogram. We used MultiCycle AV for Windows
from Phoenix flow systems and BD FACSDiva
mathematical models for fitting the DNA histogram. However in most cases a su
the background is required in order to remove events caused by debris, which will produce a
better fit with the models given by the software. Before the calculation of the phases, two
main regions at the left of G1
lower left region consists of debris and is excluded from the analysis by defining it as
background in the software. The upper left region is set by the position of G
starting point of the phase analysis.
the upper right region is gated out and excluded (
cell cycle - Glycidamide induced S-phase arrest followed by apoptosis iMaster thesis by Elin Bakken Ansok 2009
identified, the percentage of cells in G1-, S- and G2/M-phase can be estimated either by
subjectively setting gates or by using a program that will mathematically deconvolute the
DNA histogram and thus give a more accurate measurement of the percentage of cells in each
Gating of single cells in flow cytometry
Cell cycle analysis software
Several manufacturers have developed software for cell cycle analysis. These provide
mathematical models for fitting the DNA histogram. We used MultiCycle AV for Windows
from Phoenix flow systems and BD FACSDivaTM Software. These software programs provide
mathematical models for fitting the DNA histogram. However in most cases a su
the background is required in order to remove events caused by debris, which will produce a
better fit with the models given by the software. Before the calculation of the phases, two
1 and the right part of G2/M of the histogram are excluded. The
lower left region consists of debris and is excluded from the analysis by defining it as
background in the software. The upper left region is set by the position of G
starting point of the phase analysis. The lower right region marks the end of G
the upper right region is gated out and excluded (Figure 10).
40
llowed by apoptosis in a
phase can be estimated either by
subjectively setting gates or by using a program that will mathematically deconvolute the
nt of the percentage of cells in each
Several manufacturers have developed software for cell cycle analysis. These provide several
mathematical models for fitting the DNA histogram. We used MultiCycle AV for Windows
Software. These software programs provide
mathematical models for fitting the DNA histogram. However in most cases a subtraction of
the background is required in order to remove events caused by debris, which will produce a
better fit with the models given by the software. Before the calculation of the phases, two
of the histogram are excluded. The
lower left region consists of debris and is excluded from the analysis by defining it as
background in the software. The upper left region is set by the position of G1, and marks the
The lower right region marks the end of G2/M –phase and

Effects of a food contaminant on cell cycle
lymphoblastoid cell line. Master thesis by Elin Bakken Ansok 2009
Figure 10: Gating of cell cycle population.
6.5 Cell Cycle Analysis by Propidium Iodide (
Propidium iodide (PI) form complexes with double stranded DNA and RNA by intercalating
between the bases with a stoichiometry of one dye per 4
both double-stranded DNA (dsDNA) and double
treated with RNAse to ensure that the PI staining is DNA specific. Otherwise one would get
artificial broadening of the DNA content distribution due to fluore
stranded RNA. When excited by 488nm of laser light, the PI staining can be detected with
562-588nm band pass filter using flow cytometry
6.5.1 Fixation of cells:
1. After exposure, the cells were harvested
washed twice in ice cold Dulbecco’s PBS without Ca
2. The pellet was resuspended in PBS and added ice cold 100% ethanol, to give a final
concentration of 70% ethanol, and stored at
Propidium Iodide (PI) Staining procedure:
1. To facilitate the pelleting of ethanol fixated cells, the ethanol concentration of the
fixated cells were diluted to 50% or below with Dulbeccos PBS without Ca
and added 1% FCS to avoid clumping.
cell cycle - Glycidamide induced S-phase arrest followed by apoptosis iMaster thesis by Elin Bakken Ansok 2009
: Gating of cell cycle population.
Analysis by Propidium Iodide (PI) Staining
Propidium iodide (PI) form complexes with double stranded DNA and RNA by intercalating
between the bases with a stoichiometry of one dye per 4–5 base pairs of DNA
stranded DNA (dsDNA) and double-stranded RNA (dsRNA), cells must be
treated with RNAse to ensure that the PI staining is DNA specific. Otherwise one would get
artificial broadening of the DNA content distribution due to fluorescence dye bound to double
stranded RNA. When excited by 488nm of laser light, the PI staining can be detected with
588nm band pass filter using flow cytometry (Riccardi and Nicoletti, 2006)
Fixation of cells:
After exposure, the cells were harvested by centrifugation at 310 x G at 4
washed twice in ice cold Dulbecco’s PBS without Ca2+ or Mg2+.
The pellet was resuspended in PBS and added ice cold 100% ethanol, to give a final
concentration of 70% ethanol, and stored at -20˚C until analysis.
) Staining procedure:
To facilitate the pelleting of ethanol fixated cells, the ethanol concentration of the
fixated cells were diluted to 50% or below with Dulbeccos PBS without Ca
and added 1% FCS to avoid clumping.
41
llowed by apoptosis in a
) Staining
Propidium iodide (PI) form complexes with double stranded DNA and RNA by intercalating
5 base pairs of DNA. Since PI stains
stranded RNA (dsRNA), cells must be
treated with RNAse to ensure that the PI staining is DNA specific. Otherwise one would get
scence dye bound to double
stranded RNA. When excited by 488nm of laser light, the PI staining can be detected with
(Riccardi and Nicoletti, 2006).
by centrifugation at 310 x G at 4˚C and
The pellet was resuspended in PBS and added ice cold 100% ethanol, to give a final
To facilitate the pelleting of ethanol fixated cells, the ethanol concentration of the
fixated cells were diluted to 50% or below with Dulbeccos PBS without Ca2+ or Mg2+,

42
Effects of a food contaminant on cell cycle - Glycidamide induced S-phase arrest followed by apoptosis in a lymphoblastoid cell line. Master thesis by Elin Bakken Ansok 2009
2. The pellet was resuspended in 0.5 ml PBS with 40 µg/ml RNase, to remove any
residual RNA, and 20 µg/ml PI to stain the DNA, and incubated for 10 minutes at
37˚C.
The samples were then analyzed on a BD LSR II flow cytometry (BD Biosience) to determine
PI (red) staining and cell count.
6.6 Cell Cycle Analysis by Bromodeoxyuridine
The limitation of using only a single fluorochrome, such as PI, is that we do not get any
kinetic information. It is difficult to tell if cells that have an S-phase amount of DNA actually
are cycling. To assess this problem we can use bromodeoxyuridine (BrdU) which is an
analogue of thymidine that will be incorporated into the DNA of cycling cells. The BrdU
incorporation can be detected by unwinding the DNA and then using a FITC (fluorescein
isothiocyanate)-labelled antibody against BrdU. The result is a better separation of the S-
phase population from the G1 and G2 cells (Shapiro, 2003). Therefore, we can get a bivariate
analysis of total DNA content using propidium iodide staining along the X-axis, plotted
against BrdU incorporation detected by the FITC-labelled antibodies against BrdU on the Y-
axis. In addition, the rate of cell division can be monitored by puls labelling the cells with
BrdU and harvesting at different time points. In our experiments BrdU was added 1 hour prior
to harvesting the exposed cells. The cells were then fixed according to the protocol. After
labelling the cells with FITC-anti-BrdU and resuspending in RNAse/PI solution, cells that
synthesize DNA during the BrdU pulse labelling will be positive for FITC and thereby easily
detected. The benefit of using BrdU incorporation is that we are able to distinguish cells in
early S-phase from cells in G1- and late S-phase from those in G2-phase without the need of
mathematical software to deconvolute DNA histograms.
BrdU-FITC procedure:
Cells were exposed and harvested the same way as for PI-staining and flowcytometry.
1. To facilitate the pelleting of ethanol fixated cells, the ethanol concentration of the
fixated cells was diluted to 50% or below with Dulbeccos PBS (without Ca2+ or Mg2+),
and added 1% FCS to avoid clumping. Centrifugation for 20 minutes 250 x G.

43
Effects of a food contaminant on cell cycle - Glycidamide induced S-phase arrest followed by apoptosis in a lymphoblastoid cell line. Master thesis by Elin Bakken Ansok 2009
2. Pellet was resuspended in 1ml 2M HCl with 0.3 mg/ml pepsin, slowly while
vortexing carefully, and left for 30 minutes at room temperature to denature the DNA.
3. The HCl was neutralized by adding 3ml 0.1M sodium tetraborate.
4. Cells were pelleted by centrifugation at 250 x G for 10 minutes, then washed in IFA
buffer (10 mM HEPES [pH 7.4], 25 mM NaCl, 4% FCS) and pelleted again.
5. Pellet was resuspended in 1ml IFA with 0.5% tween for 10 minutes at room
temperature, then pelleted by centrifugation at 250 x G for 10 minutes.
6. The pellet was subsequently resuspended in 100 µl IFA together with the FITC
conjugated anti-BrdU antibody diluted 1:10 and incubated for 30 minutes at room
temperature.
7. After the final IFA wash and centrifugation, the pellet was resuspended in 0.5 ml PBS
with 40 µg/ml RNase to remove any residual DNA, and 20 µg/ml PI was added to
stain the DNA.
6.7 Methods for detection of cell death
6.7.1 Flow cytometric analysis for identification and quantification
of apoptotic or necrotic cells
Apoptotic cells show reduced DNA stainability following staining with a variety of
fluorochromes such as propidium iodide (PI), DAPI (4',6-diamidino-2-phenylindole), acridine
orange or Hoechst dyes. Therefore, the appearance of cells with lower DNA stainability than
that of G1 cells, sub-G1 peak, is considered to be a marker of cell death by apoptosis. This
reduced stainability is a consequence of partial loss of DNA due to activation of an
endogenous endonuclease and subsequent diffusion of the low molecular weight DNA
products from the apoptotic cell(Darzynkiewicz et al., 1992). A necrotic cell, on the other
hand, does generally not show an immediate reduction in DNA stainability. Thus the
discrimination by live- and necrotic- cells is not recommended based on single-parameter
DNA content analysis alone (Darzynkiewicz et al., 1992).

44
Effects of a food contaminant on cell cycle - Glycidamide induced S-phase arrest followed by apoptosis in a lymphoblastoid cell line. Master thesis by Elin Bakken Ansok 2009
Due to chromatin condensation and nuclear fragmentation during the process of apoptosis, the
apoptotic cells and bodies arising from G1
emit fluorescent signals that are lower than those of
G1
cells. The fluorescent signals can be much smaller than expected in non-apoptotic G1
cells
and thus represent only a fraction of the original amount of DNA in a whole nucleus.
Therefore, if the treatment causes a great increase in the percentage of apoptotic bodies, it
must be remembered that one G1
nucleus can fragment into many smaller condensed
chromatin units. As apoptosis progresses, the size of the fluorescent signal become
progressively smaller and at some point will be gated out together with the background
fluorescence. In this way, apoptotic G2/M- and S-phase nuclei progress backwards through S-,
G1- and eventually sub G1-phase as the apoptotic process progress.
6.7.2 Fluorescence microscopy
1. The integrity of the plasma membrane of cells undergoing apoptosis is preserved and
most functions of the membrane remain unchanged. Thus, apoptotic cells exclude dyes such
as PI or trypan blue, often used as “viability assays” dyes. This is in contrast to necrotic cells
where one of the earliest changes is loss of membrane function and its structural integrity. By
using PI and Hoechst 33342 staining simultaneously one can discriminate between live versus
apoptotic versus necrotic cells. In this method PI is not excluded by necrotic cells, and after
entering the cell PI intercalates with DNA, causing red fluorescence of the necrotic nucleus.
Vital cells actively take up Hoechst 33324 and show blue fluorescence of the cellular DNA.
When applied to apoptotic cells, Hoechst 33342 emits a more intense blue fluorescence than
live cells due to the condensation of the cell and nucleus. For a period of 4-6 hours the
apoptotic cells are still able to exclude PI. Thus, this method offers differentiation between
viable (blue fluorescence), apoptotic (intense blue fluorescence, unstained or only faintly red
fluorescence) and necrotic cells (red fluorescence), as well as the feasibility to discriminate
between early and late phases of apoptosis, apoptotic/necrotic cells, based on the difference in
membrane permeability to PI.

45
Effects of a food contaminant on cell cycle - Glycidamide induced S-phase arrest followed by apoptosis in a lymphoblastoid cell line. Master thesis by Elin Bakken Ansok 2009
6.8 Determining the vitality of cells by staining with propidium iodide and Hoechst 33342
A cell that is undergoing apoptosis demonstrates nuclear condensation and DNA
fragmentation, which can be detected by staining with the DNA stain, Hoechst 33342 (H342)
and by using a fluorescence microscope.
Hoechst 33342 (H342) is a rather large molecule (MW 616) but readily crosses intact cell
membranes, and specifically stains DNA (bluish-grey fluorescence). It binds both specifically
and quantitatively to DNA, preferably to AT-rich regions in the small grove of DNA and
fluoresces blue when excited by UV light (Shapiro, 2003). Thus, all nuclei stain blue.
Propidium iodide (PI) is a rather large molecule (MW 668.4) that does not cross intact cell
membranes. However, it is able to pass through compromised plasma membranes. Thus, a red
or pink-stained cell indicates damage to the plasma membrane.
A) Normal, healthy cells (H342 positive) with normal heterochromatic nuclei are stained
blue.
B) Cells with compromised plasma membranes are normally reddish or pinkish blue.
C) Dead cells with compromised plasma membranes are PI positive and the nucleus is
red. Cells are typically swollen.
D) Apoptotic cells that are either PI+ or PI-, are characterized by condensed chromatin
which may appear as small, round homogeneously-stained nuclear fragments.
Procedure:
1. An eppendorf tube with 1 ml of cell suspension (0.5 to 1.0 x 10⁶ cells/ml medium) was
added 10 µl PI and 10 µl H342 (both stock solutions: 0.5 mg/ml distilled water) and
incubated for 15 minutes in the dark at room temperature.
2. Cells were pelleted at 300 x G for 5 minutes and washed once with culture medium.

46
Effects of a food contaminant on cell cycle - Glycidamide induced S-phase arrest followed by apoptosis in a lymphoblastoid cell line. Master thesis by Elin Bakken Ansok 2009
3. Supernatant was removed and pellet was resuspended in 5 µl FCS. Suspending the
cells in serum helps to eliminate salt crystals and helps to maintain cell shape.
4. Two 2 µl drops of the cell suspension were placed on a microscope slide and smeared
out with another slide, drawn behind the leading slide.
5. The slides were left to dry and stored in a dark slide box.
6. Using an oil immersion objective (magnification x400), approximately 400 cells were
counted using Leica DMLB with an Osram Mercury Short ARC HBO® 50W/2 light
source and with an UV-2A excitation filter 330-380 nm, each cell was placed into one
of the four categories defined above.
6.9 Protein detection methods
SDS Polyacrylamide Gel Electrophoresis (SDS-PAGE)
Polyacrylamide Gel Electrophoresis (PAGE) is used to separate macromolecules on the basis
of their molecular weight. The mobility of a molecule in an electric field is inversely
proportional to molecular friction which is the result of its molecular size and shape, and is
directly proportional to the voltage and the charge of the molecule
In PAGE, proteins charged negatively by the binding of the anionic detergent SDS (sodium
dodecyl sulfate) are separated within a matrix of polyacrylamide gel in an electric field
according to their molecular weights. Prior to this process, denaturation of proteins is
performed by heating them in a buffer containing a soluble thiol reducing agent
(mercaptoethanol) and SDS. Mercaptoethanol reduces all disulfide bonds of cysteine residues
to free sulfhydryl groups. SDS is an anionic detergent, and heating in SDS disrupts all intra-
and intermolecular protein interactions and all protein aquire a high negative charge. Sampled
proteins therefore move to the positively charged electrode through the acrylamide mesh of
the gel. Smaller proteins migrate faster through this mesh and the proteins are thus separated
according to size
47
Effects of a food contaminant on cell cycle - Glycidamide induced S-phase arrest followed by apoptosis in a lymphoblastoid cell line. Master thesis by Elin Bakken Ansok 2009
6.9.2 Western Blot
Western blotting is a technique used to identify and locate proteins based on their ability to
bind to specific antibodies. By using gel electrophoresis one can separate proteins by their
size. The most common type of gel electrophoresis is the SDS-PAGE as described above.
In order to make the proteins accessible to antibody detection, they are transferred from the
gel onto a membrane while maintaining their relative position and resolution. This step is
called blotting, and can be done in different ways. Electroblotting uses an electric current to
pull proteins from the gel onto the membrane. This protein binding is based upon hydrophobic
interactions, as well as charged interactions between the membrane and protein. After the
blotting procedure the proteins can be detected on the membrane by adding specific
antibodies after the remaining membrane has been blocked by milk proteins to avoid
unspecific binding of antibodies. During the detection process the membrane is probed with a
primary antibody specific for the protein of interest. The primary (antibody) Ab is then
recognised by a secondary antibody which is conjugated to a reporter enzyme, such as
horseradish peroxidase (HRP). HRP and the reporter enzyme causes a chemiluminescent
reaction is based on the catalyzed oxidation of luminol by peroxide. Oxidized luminol emits
light as it decays to its ground state. The resulting light is detected using an x-ray film which
is developed manually by standard procedures.
6.9.3 Preparation, separation and detection of proteins:
Preparation of cell extract:
Cell extract was prepared in order to run and separate proteins through a polyacrylamide gel.
Treated cells were harvested at different time points, washed in PBS and lysed in SDS buffer
according to the following procedure:
1. The cells were washed twice in ice cold PBS and centrifuged at 500 x G for 10
minutes.
2. Protein extracts were prepared by resuspending the pellet on ice in 200-400 µl
(depending on cell density) of lysis buffer (Table 2) containing freshly added
phosphatase inhibitors such as, 1 mM sodium orthovanadate, 50 mM sodium fluoride
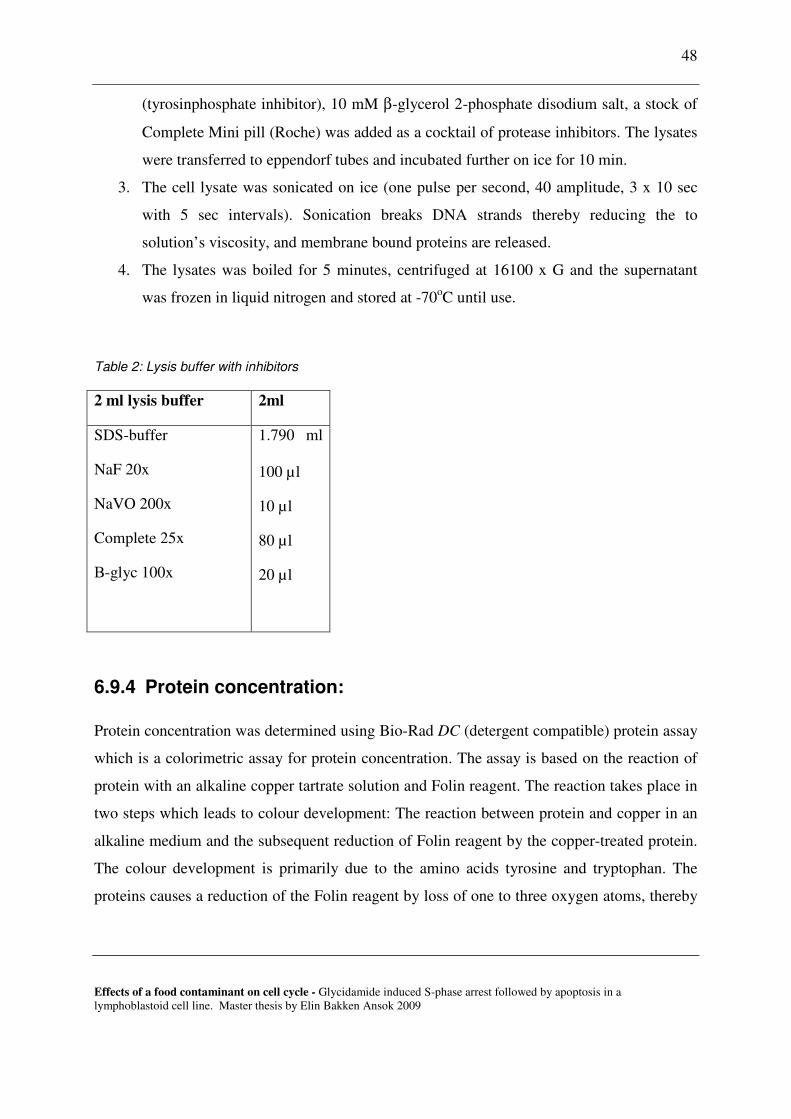
48
Effects of a food contaminant on cell cycle - Glycidamide induced S-phase arrest followed by apoptosis in a lymphoblastoid cell line. Master thesis by Elin Bakken Ansok 2009
(tyrosinphosphate inhibitor), 10 mM β-glycerol 2-phosphate disodium salt, a stock of
Complete Mini pill (Roche) was added as a cocktail of protease inhibitors. The lysates
were transferred to eppendorf tubes and incubated further on ice for 10 min.
3. The cell lysate was sonicated on ice (one pulse per second, 40 amplitude, 3 x 10 sec
with 5 sec intervals). Sonication breaks DNA strands thereby reducing the to
solution’s viscosity, and membrane bound proteins are released.
4. The lysates was boiled for 5 minutes, centrifuged at 16100 x G and the supernatant
was frozen in liquid nitrogen and stored at -70oC until use.
Table 2: Lysis buffer with inhibitors
2 ml lysis buffer 2ml
SDS-buffer
NaF 20x
NaVO 200x
Complete 25x
Β-glyc 100x
1.790 ml 100 µl
10 µl
80 µl
20 µl
6.9.4 Protein concentration:
Protein concentration was determined using Bio-Rad DC (detergent compatible) protein assay
which is a colorimetric assay for protein concentration. The assay is based on the reaction of
protein with an alkaline copper tartrate solution and Folin reagent. The reaction takes place in
two steps which leads to colour development: The reaction between protein and copper in an
alkaline medium and the subsequent reduction of Folin reagent by the copper-treated protein.
The colour development is primarily due to the amino acids tyrosine and tryptophan. The
proteins causes a reduction of the Folin reagent by loss of one to three oxygen atoms, thereby
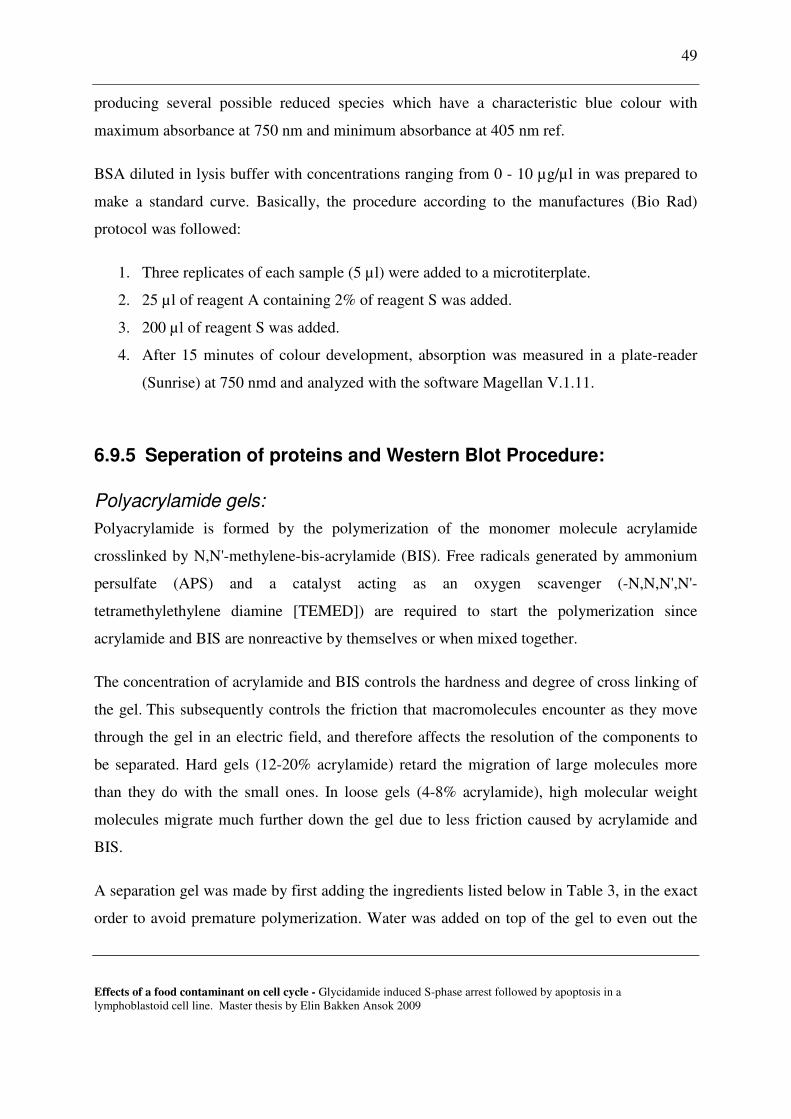
49
Effects of a food contaminant on cell cycle - Glycidamide induced S-phase arrest followed by apoptosis in a lymphoblastoid cell line. Master thesis by Elin Bakken Ansok 2009
producing several possible reduced species which have a characteristic blue colour with
maximum absorbance at 750 nm and minimum absorbance at 405 nm ref.
BSA diluted in lysis buffer with concentrations ranging from 0 - 10 µg/µl in was prepared to
make a standard curve. Basically, the procedure according to the manufactures (Bio Rad)
protocol was followed:
1. Three replicates of each sample (5 µl) were added to a microtiterplate.
2. 25 µl of reagent A containing 2% of reagent S was added.
3. 200 µl of reagent S was added.
4. After 15 minutes of colour development, absorption was measured in a plate-reader
(Sunrise) at 750 nmd and analyzed with the software Magellan V.1.11.
6.9.5 Seperation of proteins and Western Blot Procedure:
Polyacrylamide gels:
Polyacrylamide is formed by the polymerization of the monomer molecule acrylamide
crosslinked by N,N'-methylene-bis-acrylamide (BIS). Free radicals generated by ammonium
persulfate (APS) and a catalyst acting as an oxygen scavenger (-N,N,N',N'-
tetramethylethylene diamine [TEMED]) are required to start the polymerization since
acrylamide and BIS are nonreactive by themselves or when mixed together.
The concentration of acrylamide and BIS controls the hardness and degree of cross linking of
the gel. This subsequently controls the friction that macromolecules encounter as they move
through the gel in an electric field, and therefore affects the resolution of the components to
be separated. Hard gels (12-20% acrylamide) retard the migration of large molecules more
than they do with the small ones. In loose gels (4-8% acrylamide), high molecular weight
molecules migrate much further down the gel due to less friction caused by acrylamide and
BIS.
A separation gel was made by first adding the ingredients listed below in Table 3, in the exact
order to avoid premature polymerization. Water was added on top of the gel to even out the

50
Effects of a food contaminant on cell cycle - Glycidamide induced S-phase arrest followed by apoptosis in a lymphoblastoid cell line. Master thesis by Elin Bakken Ansok 2009
top layer of the gel. The gel was left to polymerize for approx. 30 minutes. Then the stacking
gel was made the same way (Table 4), and added on top of the separation gel.
Table 3: Separation gel ingredients
Separation gel 2 gels, 6 % 2 gels, 8 % 2 gels, 10 % 2 gels, 12 % 2 gels, 15 %
dH20 7,9 ml 6,9 ml 5,9 ml 4,9 ml 3,4 ml
Acrylamide mix – 30%
3,0 ml 4,0 ml 5,0 ml 6,0 ml 7,5 ml
1,5 M Tris (pH 8,8)
3,8 ml 3,8 ml 3,8 ml 3,8 ml 3,8 ml
10 % SDS 150 µl 150 µl 150 µl 150 µl 150 µl
10% APS 150 µl 150 µl 150 µl 150 µl 150 µl
TEMED 12 µl 9 µl 6 µl 6 µl 6 µl
Table 4: Stacking gel ingredients
4 % stacking gel 2 gels
dH20 4,05 ml
Acrylamide mix – 30% 0,85 ml
0,5 M Tris (pH 6,8) 1,65 ml
10 % SDS 67 µl
10% APS 34 µl
TEMED 7 µl
1. All the samples were diluted in lysis buffer in order to obtain equal amounts of protein
loaded to each lane. Bromophenol blue (2.5%) and β-mercaptoethanol (5%) were
added to the samples, and heated at 95-98oC for 5 min to sustain inactivation of
proteases and denaturation of proteins.

51
Effects of a food contaminant on cell cycle - Glycidamide induced S-phase arrest followed by apoptosis in a lymphoblastoid cell line. Master thesis by Elin Bakken Ansok 2009
2. Proteins were separated by SDS-Polyacrylamide gel electrophoresis (PAGE) by using
8-16% preciseTM Protein Gels (Thermo Fischer Scientific) or self made gels with the
appropriate acrylamide concentration ranging from 10-12% acrylamide in the
separation gel and a 4% stacking gel. 10µl Precision Plus ProteinTM Standard,
KaleidoscopeTM were applied to the first well in order to allow direct visualization of
protein mobility during electrophoresis and for precise sizing of proteins. 25-50 µg of
proteins of each sample was applied to the different wells.
3. Electrophoresis was run at 30-40 mA and 120 V in electrophoresis buffer until the
Brophenol blue stain had reached the bottom of the gel. Then the gels were
equilibrated in transferbuffer before blotting.
4. Proteins were transferred onto nitrocellulose membrane using Protran BA 85
nitrocellulose membrane from Whatman®. The Blotting was carried out in
transferbuffer for 1 hour at 100 V, with ice blocks to keep the temperature low.
5. Further, the membrane was blocked for 30 minutes using Starting Block (TBS)
Blocking Buffer at room temperature, in order to cover the remaining membrane with
proteins to avoid unspecific binding of primary or secondary antibodies and to avoid
background noise. Blocking Solution contains milk proteins that bind to the
membrane.
6. Incubation with primary antibody (Ab) was performed over night at 4˚C with shaking.
Subsequently, the membrane was washed 3 x 10 minutes with TBST
7. Next day, the membrane was incubated with an HRP-conjugated secondary Ab for 1.5
hour at room temperature prior to washing for 3 x 10 minutes with TBST and 1x 10
minutes with TBS.
8. Detection of protein was performed by using Supersignal® West Dura Extended
Duration substrate (Bio Rad). By incubating the membrane with a chemiluminescent
substrate that emits light in a reaction with horse radish peroxidase (HRP), the HRP-
conjugated secondary Ab attached to the primary Ab will emit light at the spot where
the protein of interest is positioned on the membrane.
9. Equal amounts of SuperSignal® West Dura Luminol/Enhancer Solution and
SuperSignal® West Dura Stable Peroxide buffer were added to the membrane and
incubated for 5 minutes.

52
Effects of a food contaminant on cell cycle - Glycidamide induced S-phase arrest followed by apoptosis in a lymphoblastoid cell line. Master thesis by Elin Bakken Ansok 2009
10. The development of the proteins was carried out by placing the membrane in a photo
development cassette and placing an X-ray film on top. The X-ray film is exposed by
the light from the chemiluminiscent reaction and after developing and fixation of the
film, dark spots or bands can be seen on the film. These dark bands may in turn be
quantified since their intensity is proportional to the amount of fluorescence and hence
to the protein content.
6.10 Statistical analysis
All statistical analysis of DNA damage, cell cycle distribution was done with the software
programme SPSS v.14.0.
To perform statistical analysis, one would in general want at least three independent
experiments, but due to time limitations, this was not possible for all analyses in this thesis,
e.g. the comet data. The data was analysed statistically to show possible trends and should not
be thought of as conclusive statements. The data from the comet assay were analyzed in a
hierarchical model using univariate nested ANOVA with experimental number as random
factors, and exposure as the fixed factor for the dependent variable %-tail DNA. The nesting
was done by specifying exposure as fixed factor and the nested factor, experiment, as random
factor. The SPSS syntax was altered to allow nesting by applying: /DESIGN = Exposure
experiment(exposure). In the resulting ANOVA table, a significant “nestedfactor(main
factor)” effect means that the dependent variable varies by the nested factor event within the
same level of (controlling for) the main factor.
The normality of the data was evaluated using the Kolmogorov-Smirnov test, and the
homogeneity of variances was evaluated with Levene’s test. Violation of homogeneity will
increase type I errors in the F test (wrongly rejecting the null hypothesis). However the failure
to meet the assumption of homogeneity of variances is not fatal to ANOVA, which is
relatively robust, particularly when groups are of equal sample size as in the comet assay.

53
Effects of a food contaminant on cell cycle - Glycidamide induced S-phase arrest followed by apoptosis in a lymphoblastoid cell line. Master thesis by Elin Bakken Ansok 2009
Pairwise comparison, with Bonferroni confidence interval adjustment, was used to determine
significant differences among the various exposures. This was applied to determine whether
there are significant differences among the groups, as post-hoc comparisons can not be done
with nested ANOVA. A P value of 0.05 was considered significant.
Parametric tests such as ANOVA rely on the assumption of independence, equal variance and
normality (Lovell and Omori, 2008). Comet data usually fail the normality test, which also
applies to Log transformation of the data due to some left skewed data in highly damaged
samples. Less damaged samples skew to the right, which can be taken care of by the Log
transformation. A further limitation of the Log transformation is that it may result in
heterogeneity of variances (Lovell and Omori, 2008). One might use non-parametric test
when the data violate the assumptions of parametric tests, however they are slightly less
powerful than their parametric equivalents. Non-parametric tests such as Kruskal-Wallis and
Mann Whitney tests have a tendency to be oversensitive in detecting small differences
between samples, and is therefore not suitable when detecting genotoxic effects(Duez et al.,
2003).
A univariate ANOVA was also conducted to explore the impact of GA on the different cell
cycle phases, which were analysed separately. Experimental number was used as random
factors, and exposure as the fixed factor for the particular cell cycle.

54
Effects of a food contaminant on cell cycle - Glycidamide induced S-phase arrest followed by apoptosis in a lymphoblastoid cell line. Master thesis by Elin Bakken Ansok 2009
7. Results
In the results to follow, we first report on the ability of AA and GA to induce DNA damage;
this damage was partly characterised by employing the Fpg enzyme which recognises and
cleaves certain types of base alterations. Subsequently, we show cellular repair of such
damage in cultured cells. These experiments were carried out using the comet assay. Specific
effects of GA on cell cycle progression were then investigated using flow cytometry, followed
by changes in the expression of specific and relevant gene products.
7.1 Glycidamide, but not acrylamide, induces DNA damage
recognised by the Fpg-enzyme in lymphoid cells in vitro.
DNA damage induced by AA and its metabolite, GA, was measured by the alkaline comet
assay. This assay detects single strand breaks and alkali labile sites in the DNA. In addition,
when introducing an exogenous repair enzyme, some other lesions not leading to direct strand
breaks are detected; with Fpg these lesions are preferentially oxidized purines (i.e.8-oxo
guanine) but also ring-opened formamidopyrimidine lesions (both denoted as Fpg sensitive
sites) (Krokan et al., 1997).

Effects of a food contaminant on cell cycle
lymphoblastoid cell line. Master thesis by Elin Bakken Ansok 2009
Figure 11. Acrylamide exposure of normal human lymphocytes.Normal human lymphocytes (PBL) were exposed to different AA concentration for 2 hours with (green) or without (blue) S9 fraction. The level of DNA damage was measured by the comet assay (see method section). The lysed cells were incubated in enzyme buffer alone (A), or together with the Fpg -enzyme (B). The level of DNA damage is presented as % tail DNA intensity. One experiment is performed (n=1). 150 comets are scored for each exposure. The line acvalue (50th percentile), the length of the box is the interquartile range (IQR) (25th and 75th percentile, 50% of the cases), the circles represent outliers (> 1.5 x IQR) and points (> x IQR).
The DNA damaging effect of AA exposure of resting human lymphocytes (PBL) with or
without human S9 fractions is shown in
drug-metabolizing enzymes, i.e. CYP2E1 (see methods) and are therefore expected to
contribute to the metabolism of AA to GA. As shown in
significant increase in DNA damage even at high concentrations of AA (4mM). In addition,
the S9 fraction did not facilitate the DNA damaging effect of AA, instead it lead to a small
decrease both in the control and
enzyme treatment step in the comet assay,
detected (Figure 11), however AA did not induce any increased Fpg
cell cycle - Glycidamide induced S-phase arrest followed by apoptosis iMaster thesis by Elin Bakken Ansok 2009
. Acrylamide exposure of normal human lymphocytes. Normal human lymphocytes (PBL) were exposed to different AA concentration for 2 hours with (green) or without (blue) S9 fraction. The level of DNA damage was measured by the comet assay (see
ction). The lysed cells were incubated in enzyme buffer alone (A), or together with the Fpg enzyme (B). The level of DNA damage is presented as % tail DNA intensity. One experiment is
150 comets are scored for each exposure. The line across the box marks the median value (50th percentile), the length of the box is the interquartile range (IQR) (25th and 75th percentile, 50% of the cases), the circles represent outliers (> 1.5 x IQR) and asterisk (*) represent extreme
he DNA damaging effect of AA exposure of resting human lymphocytes (PBL) with or
without human S9 fractions is shown in Figure 11. Human liver S9 fractions contain several
metabolizing enzymes, i.e. CYP2E1 (see methods) and are therefore expected to
contribute to the metabolism of AA to GA. As shown in Figure 11A, AA did not induce any
significant increase in DNA damage even at high concentrations of AA (4mM). In addition,
the S9 fraction did not facilitate the DNA damaging effect of AA, instead it lead to a small
decrease both in the control and in the exposed samples. When including the one
enzyme treatment step in the comet assay, a general increase in Fpg-sensitive sites where
), however AA did not induce any increased Fpg-sensitive sites.
55
llowed by apoptosis in a
Normal human lymphocytes (PBL) were exposed to different AA concentration for 2 hours with (green) or without (blue) S9 fraction. The level of DNA damage was measured by the comet assay (see
ction). The lysed cells were incubated in enzyme buffer alone (A), or together with the Fpg enzyme (B). The level of DNA damage is presented as % tail DNA intensity. One experiment is
ross the box marks the median value (50th percentile), the length of the box is the interquartile range (IQR) (25th and 75th percentile,
(*) represent extreme
he DNA damaging effect of AA exposure of resting human lymphocytes (PBL) with or
ions contain several
metabolizing enzymes, i.e. CYP2E1 (see methods) and are therefore expected to
A, AA did not induce any
significant increase in DNA damage even at high concentrations of AA (4mM). In addition,
the S9 fraction did not facilitate the DNA damaging effect of AA, instead it lead to a small
including the one-hour Fpg
sensitive sites where
sensitive sites.

Effects of a food contaminant on cell cycle
lymphoblastoid cell line. Master thesis by Elin Bakken Ansok 2009
Figure 12: Glycidamide-induced DNA damage in PBLNormal human lymphocytes (PBL) were exposed to different concentrations of GA for 2 h. The level of DNA damage was measured by the comet assay (selysed cells were incubated in enzyme buffer alone (A), or together with the Fpg level of DNA damage is presented as % tail DNA intensity. of DNA damage compared to the controlexperiments combined (n= 2). The line across the box marks the median value (50th percentile), the length of the box is the interquartile range (IQR) (25th and 75th percentile, 50% of the cases), the circles represent outliers (> 1.5 x IQR) and
Due to the lack of DNA damaging effect
GA during short exposure times, even in the presence of S9,
subsequent studies only with its directly
different concentrations of GA for two hours and the resulting DNA damage was analyzed by
the comet assay (Figure 12). As
alkali labile sites were seen at relatively low
when including Fpg, an increase in the DNA
0.05 mM GA exposure, with Fpg
control. At a concentration of
significantly. A nested one-way ANOVA was performed to show that there was a significant
increase in GA-induced DNA
indicated that both 50 µM and 100 µM GA (both F = 273.645, p < 0.001) (n = 2) had
significantly more DNA damage than the control, but not at 20 µM of GA (n = 1).
cell cycle - Glycidamide induced S-phase arrest followed by apoptosis iMaster thesis by Elin Bakken Ansok 2009
induced DNA damage in PBL Normal human lymphocytes (PBL) were exposed to different concentrations of GA for 2 h. The level of DNA damage was measured by the comet assay (see Methods section). The agarose embedded and
cells were incubated in enzyme buffer alone (A), or together with the Fpg -enzyme (B).level of DNA damage is presented as % tail DNA intensity. GA induced a significantly increased level
e compared to the control p < 0.001, F = 179.407). The figure showThe line across the box marks the median value (50th percentile), the
length of the box is the interquartile range (IQR) (25th and 75th percentile, 50% of the cases), the circles represent outliers (> 1.5 x IQR) and asterisk (*) represent extreme points (>
lack of DNA damaging effect of AA, which reflects a limited activation of AA into
GA during short exposure times, even in the presence of S9, we decided to
subsequent studies only with its directly genotoxic metabolite GA. PBL
of GA for two hours and the resulting DNA damage was analyzed by
). As Figure 12A shows, no GA-induced DNA
seen at relatively low concentrations of GA (up to 0.1 mM). However,
an increase in the DNA-damaging effect of GA was noticed. Already at
exposure, with Fpg the tail DNA intensity had increased compared to the
At a concentration of GA of 0.1 mM, the tail DNA intensity had increased
way ANOVA was performed to show that there was a significant
induced DNA with Fpg (p < 0.001, F = 179.407). Pairwise comparison
indicated that both 50 µM and 100 µM GA (both F = 273.645, p < 0.001) (n = 2) had
DNA damage than the control, but not at 20 µM of GA (n = 1).
56
llowed by apoptosis in a
Normal human lymphocytes (PBL) were exposed to different concentrations of GA for 2 h. The level of agarose embedded and
enzyme (B). The GA induced a significantly increased level
The figure shows two independent The line across the box marks the median value (50th percentile), the
length of the box is the interquartile range (IQR) (25th and 75th percentile, 50% of the cases), the (*) represent extreme points (> x IQR).
, which reflects a limited activation of AA into
we decided to perform
PBL was exposed to
of GA for two hours and the resulting DNA damage was analyzed by
induced DNA-stand breaks or
of GA (up to 0.1 mM). However,
damaging effect of GA was noticed. Already at
the tail DNA intensity had increased compared to the
NA intensity had increased
way ANOVA was performed to show that there was a significant
Fpg (p < 0.001, F = 179.407). Pairwise comparison
indicated that both 50 µM and 100 µM GA (both F = 273.645, p < 0.001) (n = 2) had
DNA damage than the control, but not at 20 µM of GA (n = 1).

Effects of a food contaminant on cell cycle
lymphoblastoid cell line. Master thesis by Elin Bakken Ansok 2009
However, the experiments performed in
damage after GA exposure and Fpg treatment
performed by others in our laboratory
cultures and the methodologies used in the present thesis,
performed using X-rays as a positive control (
level was observed. At 0.1mM GA concentration
increased from 7% (control)
Figure 10. The low DNA damage observed in the two first experiments
GA stock that may have lost reactivity or perhaps individual differences in DNA damage
susceptibility between th
Figure 13: GA compared to x-rayNormal human lymphocytes (PBL) were exposed to different concentrations of GA for 2 different concentrations; 0.05mM GA (purple box) and 0.1mM (yellow box). The level of DNA damage was measured by the comet assay (see method section).buffer alone (A), or together with the Fpg 10 Gy (grey box) were included as a positive control.DNA intensity.. The line across the box marks the median value (50th percentile), the length of the box is the interquartile range (IQR) (25th and 75th percentile, 50% of the cases), the circles represent outliers (> 1.5 x IQR) and asterisk
A lymphoblastoid cell line, GM00130, was introduced to study more in depth the mechanisms
of GA-induced DNA damaging effect on lymphoid cells.
cell cycle - Glycidamide induced S-phase arrest followed by apoptosis iMaster thesis by Elin Bakken Ansok 2009
he experiments performed in Figure 12 showed unexpectedly low levels of D
after GA exposure and Fpg treatment, when compared with previous
in our laboratory (Hansen, 2007). To test the overall response of the cell
cultures and the methodologies used in the present thesis, an additional e
as a positive control (Figure 13). This time a higher
0.1mM GA concentration and Fpg treatment, the tail DNA intensity
(control) to 50% DNA, i.e. nearly the double of what was observed in
The low DNA damage observed in the two first experiments may be due to an old
GA stock that may have lost reactivity or perhaps individual differences in DNA damage
susceptibility between the different blood donors.
ray- induced DNA damage Normal human lymphocytes (PBL) were exposed to different concentrations of GA for 2 different concentrations; 0.05mM GA (purple box) and 0.1mM (yellow box). The level of DNA damage was measured by the comet assay (see method section). The lysed cells were incubated in enzyme buffer alone (A), or together with the Fpg -enzyme (B). PBL X-ray irradiated with 3 Gy (green box) and
as a positive control. The level of DNA damage is presented as % tail . The line across the box marks the median value (50th percentile), the length of the box
is the interquartile range (IQR) (25th and 75th percentile, 50% of the cases), the circles represent asterisk (*) represent extreme points (> x IQR).
A lymphoblastoid cell line, GM00130, was introduced to study more in depth the mechanisms
induced DNA damaging effect on lymphoid cells. In particular, unlike lymphocytes
57
llowed by apoptosis in a
showed unexpectedly low levels of DNA
previous experiments
To test the overall response of the cell
an additional experiment was
). This time a higher DNA damage
the tail DNA intensity
, i.e. nearly the double of what was observed in
may be due to an old
GA stock that may have lost reactivity or perhaps individual differences in DNA damage
e different blood donors.
Normal human lymphocytes (PBL) were exposed to different concentrations of GA for 2 hours with different concentrations; 0.05mM GA (purple box) and 0.1mM (yellow box). The level of DNA damage
The lysed cells were incubated in enzyme ray irradiated with 3 Gy (green box) and
The level of DNA damage is presented as % tail . The line across the box marks the median value (50th percentile), the length of the box
is the interquartile range (IQR) (25th and 75th percentile, 50% of the cases), the circles represent
A lymphoblastoid cell line, GM00130, was introduced to study more in depth the mechanisms
In particular, unlike lymphocytes

Effects of a food contaminant on cell cycle
lymphoblastoid cell line. Master thesis by Elin Bakken Ansok 2009
these cells can be incubated for long periods of time, allowing a study of DNA repair.
cells were exposed to various concentration
was analysed with the comet assay with and without Fpg treatment.
that GA exposure for 2 hours with 0.1mM GA
damage, and only a minor increase in DNA
was seen (Figure 14A). However, a
and 0.5 mM GA concentration
period of 24 hours gave a small increase in DNA damage
concentrations but much higher
induced after long-time GA-exposure (after 6 hours) increased dramatically and apparently
saturated the assay as the dose response with 0.1 mM GA levelled off
Figure 14: DNA-damage measured in GM00130 cells after GA exposure over timeGM00130 cells were exposed to 0.1mM (green box) and 0.5 mM GA (yellow box) for several time periods and analyzed by the comet assay (see method section) to measure DNA damage expressed as % tail DNA intensity. After lysis, cells were incubated in enzyme buthe Fpg -enzyme (B). The line across the box marks the median (50th percentile), the length of the box is the interquartile range (IQR) (25th and 75th percentile, 50% of the cases), the circles represent outliers (> 1.5 x IQR) and asteriskindependent experiments combined (n= 2),
cell cycle - Glycidamide induced S-phase arrest followed by apoptosis iMaster thesis by Elin Bakken Ansok 2009
these cells can be incubated for long periods of time, allowing a study of DNA repair.
exposed to various concentrations of GA over time and the DNA
s analysed with the comet assay with and without Fpg treatment. Firstly,
for 2 hours with 0.1mM GA exposure gave no significant increase in DNA
increase in DNA damage with 0.5mM GA exposure
However, a dramatic induction of Fpg-sensitive sites at
mM GA concentration was seen in Figure 14B. Secondly, GA exposure over a time
period of 24 hours gave a small increase in DNA damage, without Fpg, at low GA
but much higher with a GA concentration of 0.5 mM. The Fpg sensitive sites
exposure (after 6 hours) increased dramatically and apparently
saturated the assay as the dose response with 0.1 mM GA levelled off (Figure
damage measured in GM00130 cells after GA exposure over timeGM00130 cells were exposed to 0.1mM (green box) and 0.5 mM GA (yellow box) for several time periods and analyzed by the comet assay (see method section) to measure DNA damage expressed
After lysis, cells were incubated in enzyme buffer alone (A), or together with The line across the box marks the median (50th percentile), the length of the box
is the interquartile range (IQR) (25th and 75th percentile, 50% of the cases), the circles represent asterisk (*) represent extreme points (> x IQR). The figure show two
independent experiments combined (n= 2),
58
llowed by apoptosis in a
these cells can be incubated for long periods of time, allowing a study of DNA repair. The
of GA over time and the DNA-damaging effect
Firstly, the results show
no significant increase in DNA
with 0.5mM GA exposure without Fpg
sensitive sites at both 0.1 mM
B. Secondly, GA exposure over a time
at low GA (0.1 mM)
The Fpg sensitive sites
exposure (after 6 hours) increased dramatically and apparently
Figure 14B)
damage measured in GM00130 cells after GA exposure over time GM00130 cells were exposed to 0.1mM (green box) and 0.5 mM GA (yellow box) for several time periods and analyzed by the comet assay (see method section) to measure DNA damage expressed
ffer alone (A), or together with The line across the box marks the median (50th percentile), the length of the box
is the interquartile range (IQR) (25th and 75th percentile, 50% of the cases), the circles represent (*) represent extreme points (> x IQR). The figure show two

59
Effects of a food contaminant on cell cycle - Glycidamide induced S-phase arrest followed by apoptosis in a lymphoblastoid cell line. Master thesis by Elin Bakken Ansok 2009
A nested univariate ANOVA of the comet data without Fpg treatment showed at all time
points that the GA exposure led to a statistically significant higher %tail DNA intensity than
the control at a p < 0.001 level. F-values at 2 hours is F = 179.407, at 4 hours is F = 643.214,
at 6 hours is F = 1152.049 and at 24 hours F = 680.331. Pairwise comparisons indicated p ≤
0.001 at all concentrations and time points. The Fpg treated cells have all significantly higher
DNA damage than the control, without the need for statistical analysis.
7.2 Repair of GA-induced DNA damage in lymphoid cells.
The repair of GA-induced DNA breaks was evaluated using the alkaline comet assay. GA-
exposed GM00130 cells for 2 or 4 hours were harvested and rinsed prior to seeding the cells
in fresh growth medium. These cells were then incubated at 370C for 2 or 20 hours in order
allow repair of any induced DNA-damage (Figure 15 and Figure 16). The most prominent
result shown in Figure 15 and Figure 16 was the reduction in Fpg-sensitive sites. After 2
hours incubation at 370C, some reduction in DNA damage indicates that the cells are repairing
the Fpg sensitive sites. After 4 hours GA exposure and 20 hours incubation time, at 370C, a
marked reduction in Fpg-sensitive sites was seen (Figure 16). There was also an indication of
repair of SSB or AP sites as seen in Figure 14 without Fpg treatment.
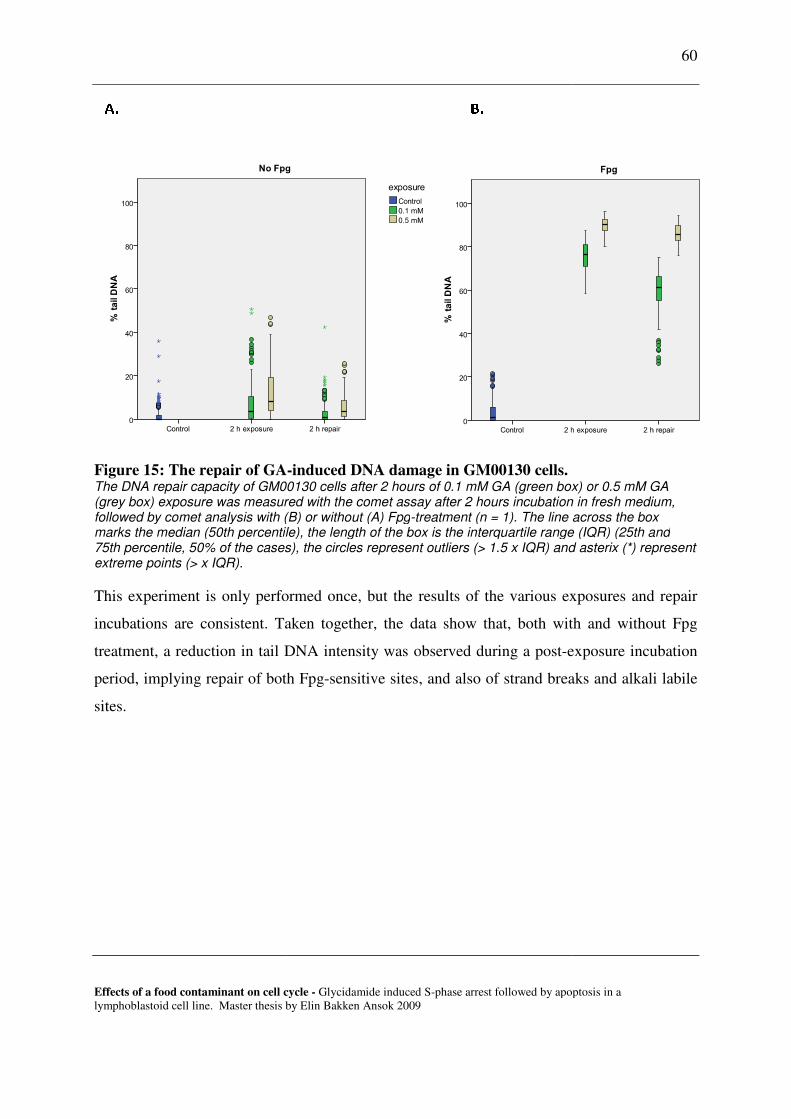
Effects of a food contaminant on cell cycle
lymphoblastoid cell line. Master thesis by Elin Bakken Ansok 2009
Figure 15: The repair of GAThe DNA repair capacity of GM00130 cells after 2 hours of 0.1 mM GA (green box) or 0.5 mM GA (grey box) exposure was measured with followed by comet analysis with (B) or without (A) Fpgmarks the median (50th percentile), the length of the box is the interquartile range (IQR) (25th and75th percentile, 50% of the cases), the circles represent outliers (> 1.5 x IQR) and asterix (*) represent extreme points (> x IQR).
This experiment is only performed once
incubations are consistent. Ta
treatment, a reduction in tail DNA intensity was observed
period, implying repair of both Fpg
sites.
cell cycle - Glycidamide induced S-phase arrest followed by apoptosis iMaster thesis by Elin Bakken Ansok 2009
: The repair of GA-induced DNA damage in GM00130 cells. The DNA repair capacity of GM00130 cells after 2 hours of 0.1 mM GA (green box) or 0.5 mM GA (grey box) exposure was measured with the comet assay after 2 hours incubation in fresh medium, followed by comet analysis with (B) or without (A) Fpg-treatment (n = 1). The line across the box marks the median (50th percentile), the length of the box is the interquartile range (IQR) (25th and75th percentile, 50% of the cases), the circles represent outliers (> 1.5 x IQR) and asterix (*) represent
This experiment is only performed once, but the results of the various exposures and repair
incubations are consistent. Taken together, the data show that, both with and without Fpg
treatment, a reduction in tail DNA intensity was observed during a post-exposure incubation
implying repair of both Fpg-sensitive sites, and also of strand breaks and alkali labile
60
llowed by apoptosis in a
The DNA repair capacity of GM00130 cells after 2 hours of 0.1 mM GA (green box) or 0.5 mM GA
the comet assay after 2 hours incubation in fresh medium, treatment (n = 1). The line across the box
marks the median (50th percentile), the length of the box is the interquartile range (IQR) (25th and 75th percentile, 50% of the cases), the circles represent outliers (> 1.5 x IQR) and asterix (*) represent
of the various exposures and repair
both with and without Fpg
exposure incubation
strand breaks and alkali labile

Effects of a food contaminant on cell cycle
lymphoblastoid cell line. Master thesis by Elin Bakken Ansok 2009
Figure 16. The repair of GA-induced DNA damage in GM00130 cellsThe DNA repair capacity of GM00130 cells after 4 hours of 0.1 mM GA (green box) or 0.5 mM(grey box) exposure was measured with the comet assay after 20 hours incubation in fresh medium , with (B) or without (A) Fpg treatment, (n=1). The line across the box marks the median (50th percentile), the length of the box is the interquartile rangcases), the circles represent outliers (> 1.5 x IQR) and asterisk (*) represent extreme points (> x IQR).
cell cycle - Glycidamide induced S-phase arrest followed by apoptosis iMaster thesis by Elin Bakken Ansok 2009
induced DNA damage in GM00130 cells The DNA repair capacity of GM00130 cells after 4 hours of 0.1 mM GA (green box) or 0.5 mM(grey box) exposure was measured with the comet assay after 20 hours incubation in fresh medium , with (B) or without (A) Fpg treatment, (n=1). The line across the box marks the median (50th percentile), the length of the box is the interquartile range (IQR) (25th and 75th percentile, 50% of the cases), the circles represent outliers (> 1.5 x IQR) and asterisk (*) represent extreme points (> x IQR).
61
llowed by apoptosis in a
The DNA repair capacity of GM00130 cells after 4 hours of 0.1 mM GA (green box) or 0.5 mM GA (grey box) exposure was measured with the comet assay after 20 hours incubation in fresh medium , with (B) or without (A) Fpg treatment, (n=1). The line across the box marks the median (50th
e (IQR) (25th and 75th percentile, 50% of the cases), the circles represent outliers (> 1.5 x IQR) and asterisk (*) represent extreme points (> x IQR).

62
Effects of a food contaminant on cell cycle - Glycidamide induced S-phase arrest followed by apoptosis in a lymphoblastoid cell line. Master thesis by Elin Bakken Ansok 2009
7.3 Cell cycle analysis by PI staining and flow cytometry
The comet assay revealed high levels of DNA damage recognised by Fpg. We were therefore
interested in analysing the cell cycle distribution of GA-exposed cells after prolonged
exposure and thus comparing the cell cycle distribution with the level of DNA damage after a
24 hour exposure period. To test whether long time GA exposure had an effect on cell cycle
progression, flow cytometric analysis with PI staining of asynchronously proliferating GA
exposed GM00130C cells was performed.
Figure 17. Cell cycle distribution following GA-exposure for 8 h. GM00130C cells were treated with 0.1, 0.5, and 1 mM GA, harvested at the respective time points and analysed for cell cycle distribution by PI staining and flow cytometric analysis. The x axis represents the DNA content (PI staining) and the y axis represents number of cells analysed (cell count). The figure shows one representative experiment of three independent (n=3).

63
Effects of a food contaminant on cell cycle - Glycidamide induced S-phase arrest followed by apoptosis in a lymphoblastoid cell line. Master thesis by Elin Bakken Ansok 2009
Figure 18: Cell cycle distribution following GA-exposure for 24 h. GM00130C cells were treated with 0.1, 0.5, and 1 mM GA, and harvested at the respective time points for cell cycle distribution analysis by PI staining and flow cytometry. The x axis represents the DNA content (PI staining) and the y axis represents number of cells (cell count). The figure shows one representative experiment of three independent (n=3).

64
Effects of a food contaminant on cell cycle - Glycidamide induced S-phase arrest followed by apoptosis in a lymphoblastoid cell line. Master thesis by Elin Bakken Ansok 2009
Figure 19: Cell cycle distribution following GA-exposure for 31 h. GM00130C were treated with 0.1, 0.5, and 1 mM GA and harvested at the respective time points and analysed for cell cycle distribution by flow cytometry by PI staining The x axis represents the DNA content (PI staining) and the y axis represents number of cells (cell count). The figure shows one experiment (n=1).
The cell cycle distribution was apparently not affected by GA at 0.1 mM even after long
exposure times, up to 31 hours. However, when exposing the cells to 0.5 mM and 1mM GA
the cells clearly accumulated in S-phase together with a reduction of cells in G1 noted after 24
hours exposure as seen with PI-staining and flow cytometric analysis (Figure 18 and Figure
19)
After 24 hours exposure with 1 mM GA there was an increase in apoptotic/necrotic cells seen
as increased cell debris accumulating to the left of the G1 peak (Figure 18). Also with GA
exposure for up to 31 hours (performed only once), there was an increase in apoptotic/necrotic
cells which was notable at 0.5 mM GA and even more prominent at 1 mM GA (Figure 19).
The percentage of cells in each cell cycle phase indicated in Figure 18 and Figure 19 include
only live cells. Accumulation of apoptotic cells/debris is seen to the left of the G1 population.

65
Effects of a food contaminant on cell cycle - Glycidamide induced S-phase arrest followed by apoptosis in a lymphoblastoid cell line. Master thesis by Elin Bakken Ansok 2009
Figure 20 show a combined histogram of three independent flow cytometry experiments with
PI staining of GM00310C exposed to various concentrations of GA up to 24 hours (Similar to
Figure 17 and Figure 18). A univariate one-way ANOVA was conducted to explore the
impact of GA on the different cell cycle phases. There was a statistically significant change in
G1 and S phase (relative to control, p < 0.05) at 24 hours only, of GA exposure at all
concentrations tested.

66
Effects of a food contaminant on cell cycle - Glycidamide induced S-phase arrest followed by apoptosis in a lymphoblastoid cell line. Master thesis by Elin Bakken Ansok 2009
Figure 20: Cell cycle distribution following GA exposure of GM00130C. GM00130C was treated with 0.1mM (green bar), 0.5mM (grey bar), and 1mM GA (purple bar) and harvested at the respective time points. Cell cycle distribution was analysed by PI staining and flow cytometry as described in the method section. The figure represents three independent experiments (n=3)
The G1 phase: F( 3, 8) = 8.577, p = 0.007. The actual difference in mean scores between the
groups is considerably different. The effects size, calculated using partial eta squared, was
0.763. Post -hoc comparison using the Tukey HSD test indicated that the mean score for the
control (M = 65.42, SD = 4.43) was significantly different from 1 mM GA (M = 42.40, SD =

67
Effects of a food contaminant on cell cycle - Glycidamide induced S-phase arrest followed by apoptosis in a lymphoblastoid cell line. Master thesis by Elin Bakken Ansok 2009
8.27), p = 0.007. And that the mean score for 0.1 mM GA (M = 61.82, SD = 5.10) was
significantly different from 1 mM GA (M = 42.40, SD = 8.27), p = 0.019.
The S phase: F( 3, 8) = 18.828 , p = 0.001. The actual difference in mean scores between the
groups is considerably different. The effects size, calculated using partial eta squared, was
0.876. Post -hoc comparison using the Tukey HSD test indicated that the mean score for the
control (M = 26.15, SD = 2.99) was significantly different from 1 mM GA (M = 44.22, SD
=3.01), p = 0.001, and 0.5 mM GA (M =37.66, SD =3.80), p = 0.011, but not 0.1 mM. The
mean score for 0.1 mM GA (M = 29.14, SD = 3.27) was also significantly different from 1
mM GA (M = 29.14, SD = 3.27), p = 0.002, and borderline significant from 0.5 mM GA (M
=37.66, SD = 3.80), p = 0.052.
Thus, the results show a statistical significantly change in the cell cycle distribution after GA-
exposure with a prominent S-phase accumulation following 0.5 mM and 1 mM GA-exposure
for 24 hours.
7.3.1 Cell cycle analysis with BrdU incorporation
Asynchronously proliferating GM00130C cells were cultured in the absence or presence of
0.5 mM GA, for 2, 4, 12 or 24 hours. Cells were pulse-labeled with BrdU during the last 60
min of treatment before being harvested at the indicated time points. Cells were stained with
FITC-coupled anti-BrdU antibody and PI prior to flow cytometric analysis to determine BrdU
incorporation and cell cycle distribution. The figure shows scatter plots with the log FITC
anti-BrdU staining (FITC-A) versus PI staining (PI-A). From Figure 21, a GA-induced
reduction in BrdU-incorporation was seen as a reduced FITC-staining of S-phase cells
(measured at the y-axis), after 24 hours exposure time only. However, we did not observe a
prominent accumulation of cells in S-phase as expected from the previous PI and flow
cytometry analysis (Figure 18). Due to a low population of single cells detected in the 4 hours
control, it is not an optimal representative figure of untreated cells at that time point.
Unfortunately, due to methodological difficulties, the BrdU experiment could only be carried
out successfully once.
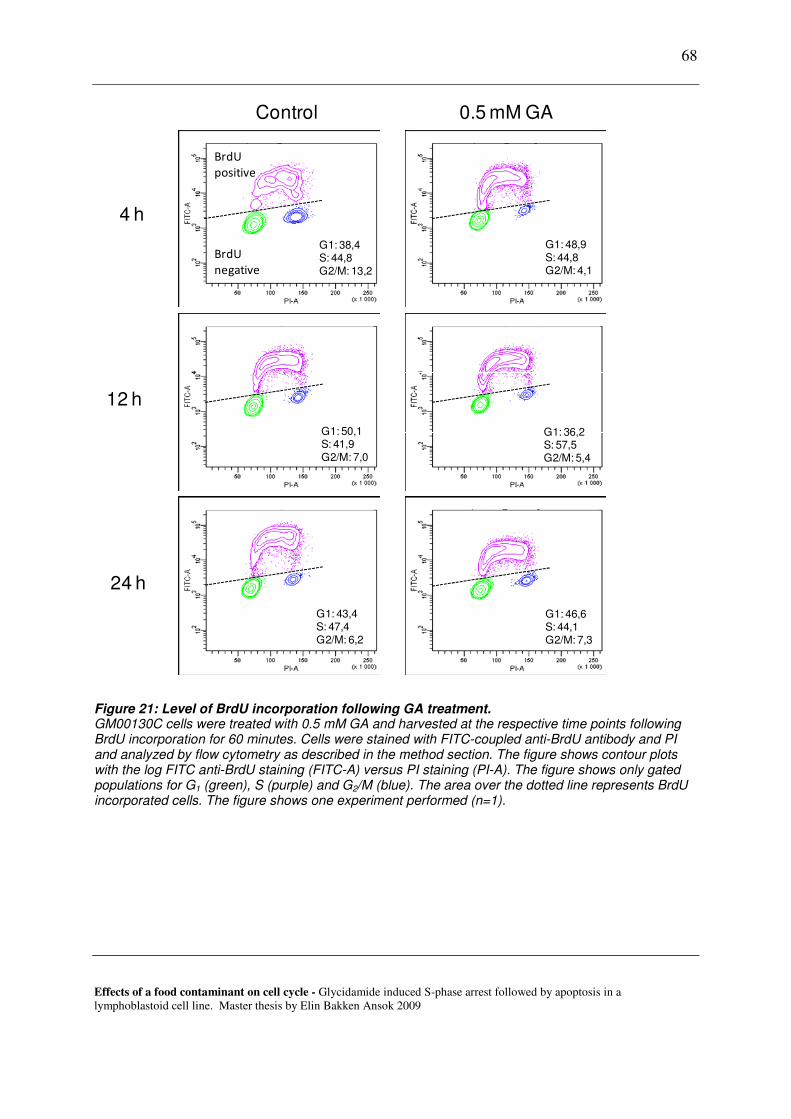
68
Effects of a food contaminant on cell cycle - Glycidamide induced S-phase arrest followed by apoptosis in a lymphoblastoid cell line. Master thesis by Elin Bakken Ansok 2009
Figure 21: Level of BrdU incorporation following GA treatment. GM00130C cells were treated with 0.5 mM GA and harvested at the respective time points following BrdU incorporation for 60 minutes. Cells were stained with FITC-coupled anti-BrdU antibody and PI and analyzed by flow cytometry as described in the method section. The figure shows contour plots with the log FITC anti-BrdU staining (FITC-A) versus PI staining (PI-A). The figure shows only gated populations for G1 (green), S (purple) and G2/M (blue). The area over the dotted line represents BrdU incorporated cells. The figure shows one experiment performed (n=1).
G1: 38,4 S: 44,8 G2/M: 13,2
G1: 48,9 S: 44,8 G2/M: 4,1
G1: 50,1S: 41,9 G2/M: 7,0
G1: 36,2 S: 57,5 G2/M: 5,4
G1: 43,4S: 47,4 G2/M: 6,2
G1: 46,6 S: 44,1 G2/M: 7,3
4 h
24 h
12 h
Control 0.5 mM GA
BrdU
positive
BrdU
negative
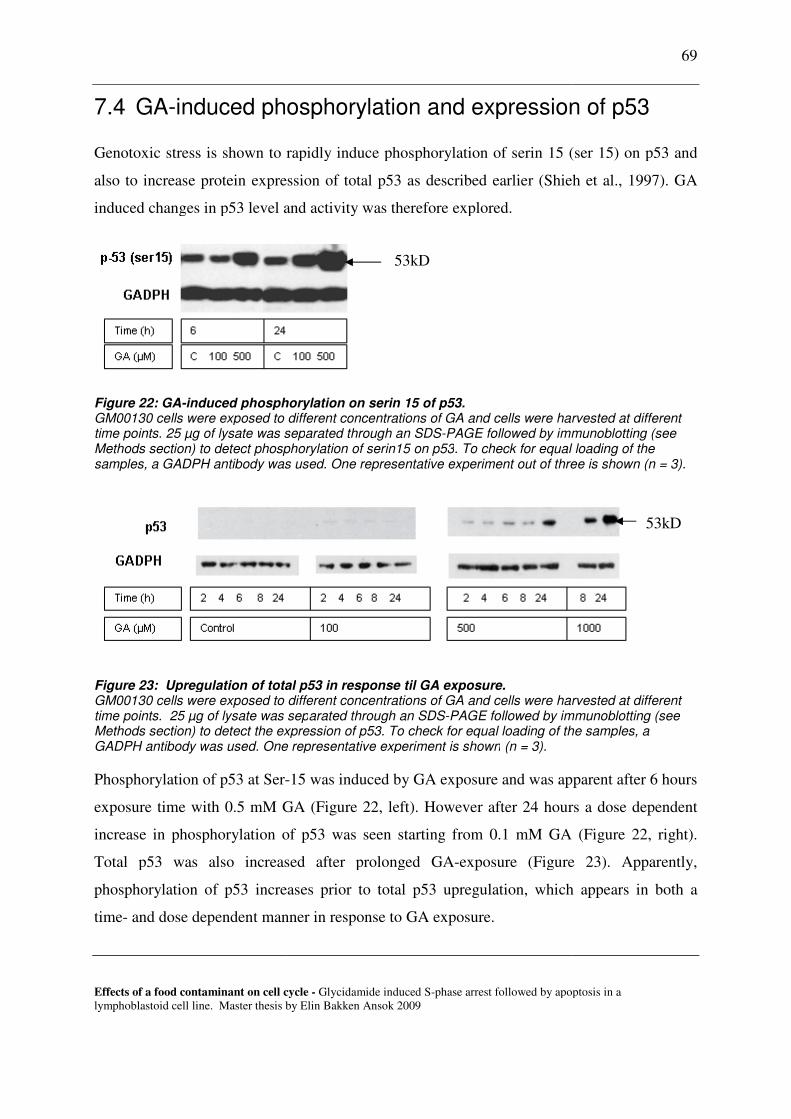
Effects of a food contaminant on cell cycle
lymphoblastoid cell line. Master thesis by Elin Bakken Ansok 2009
7.4 GA-induced phosphorylation and expression of p53
Genotoxic stress is shown to rapidly i
also to increase protein expression of total p53 as described earlier
induced changes in p53 level and activity was therefore explored.
Figure 22: GA-induced phosphorylation on serin 15 of p53.GM00130 cells were exposed to different concentrations of GA and cells were harvested at different time points. 25 µg of lysate was sepMethods section) to detect phosphorylation of serin15 on p53samples, a GADPH antibody was used.
Figure 23: Upregulation of totalGM00130 cells were exposed to different concentrations of GA and cells were harvested at different time points. 25 µg of lysate was sepMethods section) to detect the expression of p53. To check for equal loading of the samples, a GADPH antibody was used. One representative experiment is shown
Phosphorylation of p53 at Ser-
exposure time with 0.5 mM GA (
increase in phosphorylation of p53 was seen starting from 0.1
Total p53 was also increased after prolonged GA
phosphorylation of p53 increases prior to total p53 upregulation
time- and dose dependent manner
cell cycle - Glycidamide induced S-phase arrest followed by apoptosis iMaster thesis by Elin Bakken Ansok 2009
induced phosphorylation and expression of p53
Genotoxic stress is shown to rapidly induce phosphorylation of serin 15 (ser 15) on p53 and
also to increase protein expression of total p53 as described earlier (Shieh et al., 1997)
induced changes in p53 level and activity was therefore explored.
induced phosphorylation on serin 15 of p53. GM00130 cells were exposed to different concentrations of GA and cells were harvested at different
of lysate was separated through an SDS-PAGE followed by immunoblotting (see section) to detect phosphorylation of serin15 on p53. To check for equal loading of
samples, a GADPH antibody was used. One representative experiment out of three
: Upregulation of total p53 in response til GA exposure. GM00130 cells were exposed to different concentrations of GA and cells were harvested at different time points. 25 µg of lysate was separated through an SDS-PAGE followed by immunoblotting (see
the expression of p53. To check for equal loading of the samples, a One representative experiment is shown (n = 3).
-15 was induced by GA exposure and was apparent after 6
mM GA (Figure 22, left). However after 24 hours a dose dependent
increase in phosphorylation of p53 was seen starting from 0.1 mM GA (
Total p53 was also increased after prolonged GA-exposure (Figure
phosphorylation of p53 increases prior to total p53 upregulation, which appear
and dose dependent manner in response to GA exposure.
53kD
69
llowed by apoptosis in a
induced phosphorylation and expression of p53
nduce phosphorylation of serin 15 (ser 15) on p53 and
(Shieh et al., 1997). GA
GM00130 cells were exposed to different concentrations of GA and cells were harvested at different PAGE followed by immunoblotting (see
. To check for equal loading of the out of three is shown (n = 3).
GM00130 cells were exposed to different concentrations of GA and cells were harvested at different PAGE followed by immunoblotting (see
the expression of p53. To check for equal loading of the samples, a
15 was induced by GA exposure and was apparent after 6 hours
, left). However after 24 hours a dose dependent
mM GA (Figure 22, right).
Figure 23). Apparently,
which appears in both a
53kD
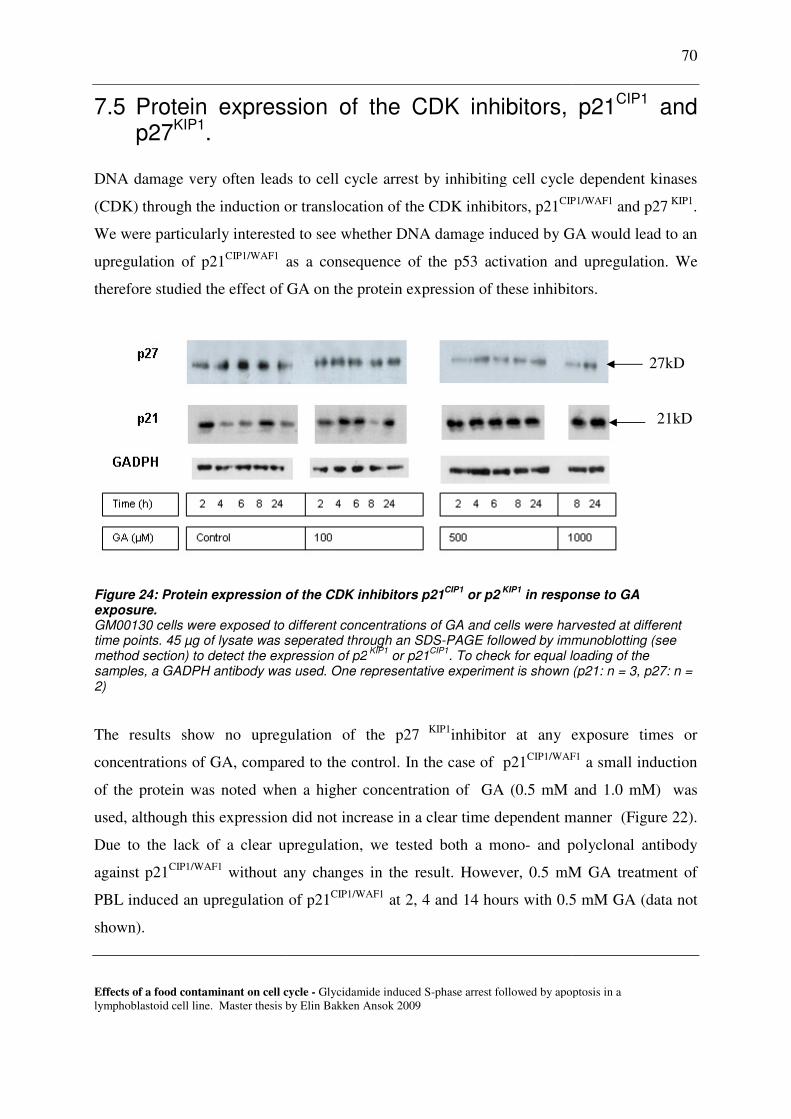
Effects of a food contaminant on cell cycle
lymphoblastoid cell line. Master thesis by Elin Bakken Ansok 2009
7.5 Protein expression of the CDK inhibitors, p21p27KIP1.
DNA damage very often lead
(CDK) through the induction or translocation of the CDK inhibitors, p21
We were particularly interested to see whether DNA damage induced by GA
upregulation of p21CIP1/WAF1 as a consequence of the p53 activation and upregulation.
therefore studied the effect of GA on the protein
Figure 24: Protein expression of the CDK inhibitors p21exposure. GM00130 cells were exposed to different concentrations of GA and cells were harvested at different time points. 45 µg of lysate was seperated through an SDSmethod section) to detect the expression of p2samples, a GADPH antibody was used.2)
The results show no upregulation
concentrations of GA, compared to the control. In the case of p21
of the protein was noted when
used, although this expression di
Due to the lack of a clear upregulation, we tested both a mono
against p21CIP1/WAF1 without any changes in the result. However, 0.5 mM GA treatment of
PBL induced an upregulation of p21
shown).
cell cycle - Glycidamide induced S-phase arrest followed by apoptosis iMaster thesis by Elin Bakken Ansok 2009
Protein expression of the CDK inhibitors, p21
damage very often leads to cell cycle arrest by inhibiting cell cycle dependent kinases
(CDK) through the induction or translocation of the CDK inhibitors, p21CIP1/WAF1
interested to see whether DNA damage induced by GA
as a consequence of the p53 activation and upregulation.
the effect of GA on the protein expression of these inhibitors
pression of the CDK inhibitors p21CIP1
or p2 KIP1
in response to GA
GM00130 cells were exposed to different concentrations of GA and cells were harvested at different time points. 45 µg of lysate was seperated through an SDS-PAGE followed by immumethod section) to detect the expression of p2
KIP1 or p21
CIP1. To check for equal loading of the
samples, a GADPH antibody was used. One representative experiment is shown
upregulation of the p27 KIP1inhibitor at any exposure times or
compared to the control. In the case of p21CIP1/WAF1
of the protein was noted when a higher concentration of GA (0.5 mM and 1.0 mM) was
expression did not increase in a clear time dependent manner
Due to the lack of a clear upregulation, we tested both a mono- and polyclonal antibody
without any changes in the result. However, 0.5 mM GA treatment of
PBL induced an upregulation of p21CIP1/WAF1 at 2, 4 and 14 hours with 0.5 mM GA (data not
70
llowed by apoptosis in a
Protein expression of the CDK inhibitors, p21CIP1 and
to cell cycle arrest by inhibiting cell cycle dependent kinases
CIP1/WAF1 and p27 KIP1.
interested to see whether DNA damage induced by GA would lead to an
as a consequence of the p53 activation and upregulation. We
expression of these inhibitors.
in response to GA
GM00130 cells were exposed to different concentrations of GA and cells were harvested at different PAGE followed by immunoblotting (see . To check for equal loading of the
(p21: n = 3, p27: n =
inhibitor at any exposure times or
CIP1/WAF1 a small induction
of GA (0.5 mM and 1.0 mM) was
time dependent manner (Figure 22).
and polyclonal antibody
without any changes in the result. However, 0.5 mM GA treatment of
at 2, 4 and 14 hours with 0.5 mM GA (data not
27kD
21kD

71
Effects of a food contaminant on cell cycle - Glycidamide induced S-phase arrest followed by apoptosis in a lymphoblastoid cell line. Master thesis by Elin Bakken Ansok 2009
7.5.1 Protein expression of cyclin A after GA-exposure
Cyclin D and E are important for the G1/S transition and cyclin A is especially needed for the
passage through the S-phase (Maddika et al., 2007). Cyclins are the regulatory unit of the
CDK enzymes and are rapidly up- or downregulated in response to mitogens. We therefore
wanted to see whether the genotoxic stress after GA exposure leads to a change in protein
expression of these cyclins. Cyclin A showed no downregulation after GA exposure, rather a
small increase in protein expression occurred with higher concentrations of GA (Figure 25).
However, no clear time dependent response was observed. Cyclin E and cyclin D was also
tested, however the results were difficult to interpret due to high background with the Abs that
we had in hand (data not shown).
Figure 25: Protein expression of cyclin A in reponse to GA exposure. GM00130 cells were exposed to different concentrations of GA and harvested at different time points. 25 µg of lysate was separated using SDS-PAGE followed by immunoblotting (see method section) to detect the expression of cyclin A. One representative experiment is shown (n = 2).
7.5.2 Protein expression of the NER proteins, XPA and XPC,
following GA-exposure
The NER-pathway is one of the most flexible DNA repair pathways, when looking at the
diversity of DNA lesions it may act upon. The XPC protein is needed for DNA damage
recognition in global genome repair of the NER pathway and XPA plays a crucial role in
confirming correct assembly of the NER complex and in incision of the DNA damage.
Previous results in our laboratory indicate a GA-induced upregulation of XPA, and to some
extent XPC transcription by RT-PCR in the testicular germ cell tumor cell line 833K (data not
shown). For this reason, using western blot analysis we examined wether GA induced any
regulation of these repair proteins.
2 4 6 8 24 2 4 6 8 24
Control 100
2 4 6 8 24
500
8 24
1000 GA (µM)
Time (h)
Cyclin A 60 kDa
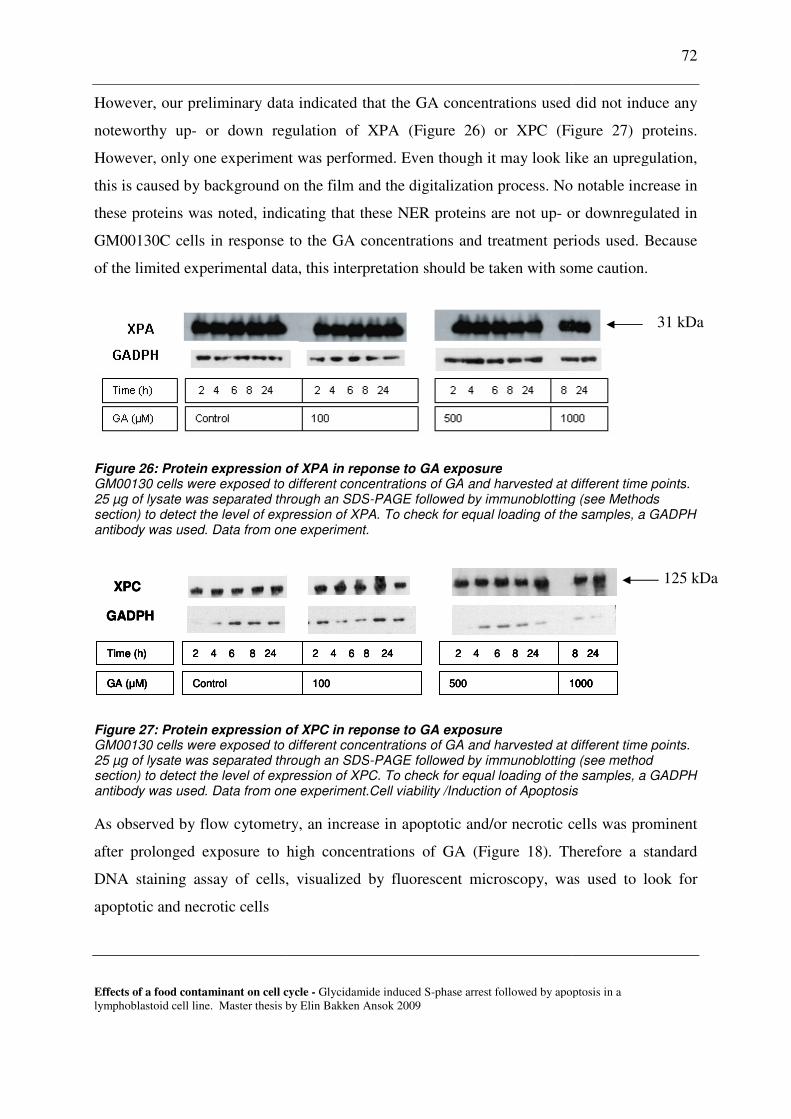
Effects of a food contaminant on cell cycle
lymphoblastoid cell line. Master thesis by Elin Bakken Ansok 2009
However, our preliminary data indicate
noteworthy up- or down regulation of XPA
However, only one experiment was performed.
this is caused by background on the film and the digitalization process. No notabl
these proteins was noted, indicating that
GM00130C cells in response to the GA
of the limited experimental data, this interpretation should be taken
Figure 26: Protein expression of XPA in reponse to GA exposureGM00130 cells were exposed to different concentrations of GA25 µg of lysate was separated through an SDSsection) to detect the level of expression of XPA. To check for equal loading of the samples, a GADPH antibody was used. Data from one experiment.
Figure 27: Protein expression of XPC in reponse to GA exposureGM00130 cells were exposed to different concentrations of GA and harvested at different time points. 25 µg of lysate was separated through an SDSsection) to detect the level of expression of antibody was used. Data from one experiment.
As observed by flow cytometry, an increase in apoptotic
after prolonged exposure to high
DNA staining assay of cells, v
apoptotic and necrotic cells
2 4 6 8 24
ControlGA (µM)
Time (h)
GADPH
XPC
2 4 6 8 24
ControlGA (µM)
Time (h)
GADPH
XPC
2 4 6 8 24
ControlGA (µM)
Time (h)
GA (µM)
Time (h)
GADPH
XPC
cell cycle - Glycidamide induced S-phase arrest followed by apoptosis iMaster thesis by Elin Bakken Ansok 2009
However, our preliminary data indicated that the GA concentrations used did not induce any
or down regulation of XPA (Figure 26) or XPC (Figure
However, only one experiment was performed. Even though it may look like an upregulation,
this is caused by background on the film and the digitalization process. No notabl
noted, indicating that these NER proteins are not up- or downregulated
in response to the GA concentrations and treatment periods
of the limited experimental data, this interpretation should be taken with some caution.
: Protein expression of XPA in reponse to GA exposure GM00130 cells were exposed to different concentrations of GA and harvested at different time points
rated through an SDS-PAGE followed by immunoblotting (see expression of XPA. To check for equal loading of the samples, a GADPH
Data from one experiment.
: Protein expression of XPC in reponse to GA exposure GM00130 cells were exposed to different concentrations of GA and harvested at different time points.
rated through an SDS-PAGE followed by immunoblotting (see method n) to detect the level of expression of XPC. To check for equal loading of the samples, a GADPH
Data from one experiment.Cell viability /Induction of Apoptosis
As observed by flow cytometry, an increase in apoptotic and/or necrotic cells was
after prolonged exposure to high concentrations of GA (Figure 18). Therefore a standard
DNA staining assay of cells, visualized by fluorescent microscopy, was used
2 4 6 8 24
100
2 4 6 8 24
500
8 24
1000
2 4 6 8 24
100
2 4 6 8 24
500
8 24
1000
2 4 6 8 24
100
2 4 6 8 24
500
8 24
1000
8 24
1000
72
llowed by apoptosis in a
used did not induce any
Figure 27) proteins.
Even though it may look like an upregulation,
this is caused by background on the film and the digitalization process. No notable increase in
or downregulated in
treatment periods used. Because
with some caution.
harvested at different time points. PAGE followed by immunoblotting (see Methods
expression of XPA. To check for equal loading of the samples, a GADPH
GM00130 cells were exposed to different concentrations of GA and harvested at different time points. PAGE followed by immunoblotting (see method
XPC. To check for equal loading of the samples, a GADPH Cell viability /Induction of Apoptosis
or necrotic cells was prominent
). Therefore a standard
was used to look for
8 24
1000
8 24
1000
8 24
1000
8 24
1000
31 kDa
125 kDa
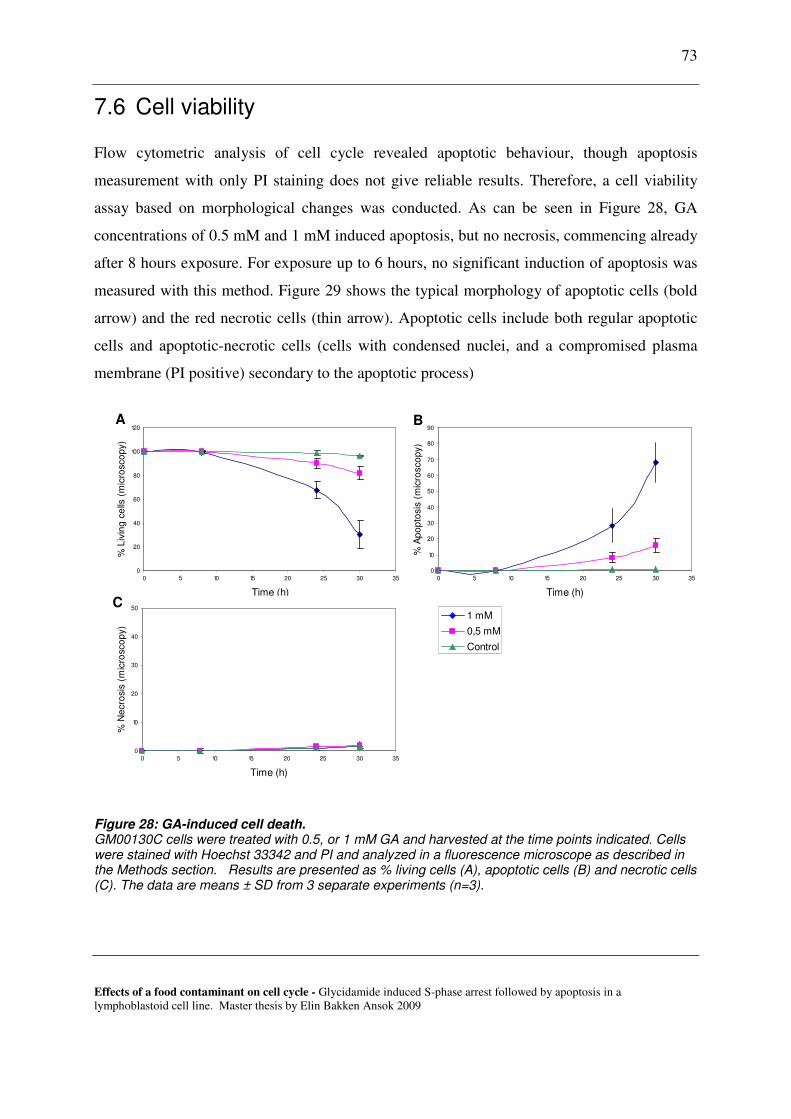
73
Effects of a food contaminant on cell cycle - Glycidamide induced S-phase arrest followed by apoptosis in a lymphoblastoid cell line. Master thesis by Elin Bakken Ansok 2009
7.6 Cell viability
Flow cytometric analysis of cell cycle revealed apoptotic behaviour, though apoptosis
measurement with only PI staining does not give reliable results. Therefore, a cell viability
assay based on morphological changes was conducted. As can be seen in Figure 28, GA
concentrations of 0.5 mM and 1 mM induced apoptosis, but no necrosis, commencing already
after 8 hours exposure. For exposure up to 6 hours, no significant induction of apoptosis was
measured with this method. Figure 29 shows the typical morphology of apoptotic cells (bold
arrow) and the red necrotic cells (thin arrow). Apoptotic cells include both regular apoptotic
cells and apoptotic-necrotic cells (cells with condensed nuclei, and a compromised plasma
membrane (PI positive) secondary to the apoptotic process)
Figure 28: GA-induced cell death. GM00130C cells were treated with 0.5, or 1 mM GA and harvested at the time points indicated. Cells were stained with Hoechst 33342 and PI and analyzed in a fluorescence microscope as described in the Methods section. Results are presented as % living cells (A), apoptotic cells (B) and necrotic cells (C). The data are means ± SD from 3 separate experiments (n=3).
0
10
20
30
40
50
60
70
80
90
0 5 10 15 20 25 30 35
Time (h)
% A
po
pto
sis
(m
icro
sco
py)
0
10
20
30
40
50
0 5 10 15 20 25 30 35
Time (h)
% N
ecro
sis
(m
icro
sco
py)
0
20
40
60
80
100
120
0 5 10 15 20 25 30 35
Time (h)
% L
ivin
g c
ells
(m
icro
sco
py)
0
20
40
60
80
100
120
0 5 10 15 20 25 30 35
Time (h)
% L
ivin
g c
ells
(m
icro
sco
py)
0
20
40
60
80
100
120
0 5 10 15 20 25 30 35
Time (h)
% L
ivin
g c
ells
(m
icro
sco
py)
0
10
20
30
40
50
0 5 10 15 20 25 30 35
Time (h)
% N
ecro
sis
(m
icro
sco
py)
0
10
20
30
40
50
0 5 10 15 20 25 30 35
Time (h)
% N
ecro
sis
(m
icro
sco
py)
C
A B
1 mM
0,5 mM
Control

74
Effects of a food contaminant on cell cycle - Glycidamide induced S-phase arrest followed by apoptosis in a lymphoblastoid cell line. Master thesis by Elin Bakken Ansok 2009
Figure 29: Effects of GA on cell morphology. GM00130C cells treated with 0.5 mM and 1 mM GA for different hours as indicated. The cells are stained with Hoechst 33342 and PI and analyzed by fluroecense microscopy. Bold arrow indicate apoptotic cells, thin arrow indicate apoptotic-necrotic cells. The figure represent one representative experiment (n = 3). Magnification 400x with oil immersion.

75
Effects of a food contaminant on cell cycle - Glycidamide induced S-phase arrest followed by apoptosis in a lymphoblastoid cell line. Master thesis by Elin Bakken Ansok 2009
8. Discussion:
8.1 Methodological considerations
8.1.1 An Epstein–Barr virus (EBV) immortilized B-cell, as a model system for
stimulated normal human peripheral lymphocytes.
Lymphocytes are a convenient and easily available source for genotoxic studies, and as
biomarkers. Though, they do possess limited lifetime, therefore are lymphoid cell lines
convenient to use as a modelsystem. The EBV-transformed lymphoblastoid cell line,
GM00130C, was chosen because of its availablility in the laboratory, and because of its
apparent wild type (wt) features compared to stimulated lymphocytes. A further important
reason for using this cell line was that our laboratory has previous experience with various
types of lymphoblastoid cell lines, i.e. the same cell type but being isolated from patients with
various types of deficiencies in the NER path for excision repair (XPA, XPC, CSB). As
described in 5.5.2, we observed no clear indication that the NER pathway is involved in repair
of GA-induced DNA damage. Furthermore, recently we obtained strong evidence that DNA
glycosylases involved in BER are good candidates for repair of the DNA base changes that
are induced by BER (Hansen, 2009). If this had not been so, and if the time frame of this
thesis had allowed it, then the whole set of lymphoblastoid cell lines would have appeared to
be highly useful for the study of effects of GA on cell-cycle.
Stimulation of PBL is a time consuming procedure and requires large amounts of donated
blood, and the resulting cells can only be cultured for a limited time period. Working with cell
lines has several advantages as described in the Methods section. However, since normal cell
cycle regulation has been altered in immortalised cells, there are several important issues with
this cell line that also need to be addressed and taken into consideration when interpreting the
data. In addition, the cells are asynchronous in all experiments performed. The disadvantages
of using asynchronous cells emerge when looking at discrete cell cycle alterations. Such
alterations would have been more apparent if using synchronous cells, but they become
masked due to the presences of cells in every cell cycle phase; this is particularly the case
when studying weak responses in protein expression. Several of the common methods for cell

76
Effects of a food contaminant on cell cycle - Glycidamide induced S-phase arrest followed by apoptosis in a lymphoblastoid cell line. Master thesis by Elin Bakken Ansok 2009
culture synchronization involve the use of pharmacological agents acting at various points
throughout the cell cycle. This often leads to adverse cellular perturbations that may lead to
false positive or negative results. Other methods for synchronizing cells involve less dramatic
perturbations of the biological system, such as serum deprivation. However, due to time
limitations, attempts to synchronize the cells were not performed.
Although the tumour virus EBV apparently drives cell proliferation by stimulation of B cell
activation and growth programmes, rather than by subverting cell cycle regulatory
mechanisms (Bornkamm and Hammerschmidt, 2001), there is some evidence that EBV latent
proteins, such as EBNA3C and LMP1, can disrupt normal cell cycle control and even normal
responsiveness to some DNA checkpoints, upon exposure to genotoxic drugs(Chen et al.,
1998; Parker et al., 2000; Wade and Allday, 2000).
Apparently, EBNA3C is essential for growth transformation of primary B-lymphocytes in
vitro and regulates a number of viral and cellular genes important for the immortalization
process (Subramanian et al., 2002). The latent proteins have been suggested to facilitate cell
survival by suppressing the apoptotic program in addition to continuous cell division (Chen et
al., 1998). For instance, the EBV nuclear antigen, EBNA3C, has been shown to disrupt both
G1/S and G2/M checkpoints (Allday et al., 1993; Allday and Farrell, 1994; Parker et al.,
2000), enhance the kinase activity of the cyclin A/cdk2 complex, and regulate components of
the SCFSkp2E3 ubiquitin ligase complex (Knight et al., 2005; Knight and Robertson, 2004).
EBNA3C have also been shown to complete the cell cycle in cells lacking mitogen signals
from the external medium in vitro(Parker et al., 2000). Overall, it may indicate that these
cells, to some extent, overcome or ignore normal DNA damage activated checkpoints, and
that this may be the case in our studies as well. When discussing the results obtained from the
GA-treated lymphoblastoid cell line these issues must be taken into consideration.
8.1.2 The Comet assay
The comet assay is a very sensitive and well established assay for genotoxic screening. In
addition, it is an easy assay to run and can be performed at a low cost. However, there are a
few shortcomings that need to be addressed, especially concerning scoring the comets and
analysing the data. Especially one need to be certain that the DNA staining of the comets is
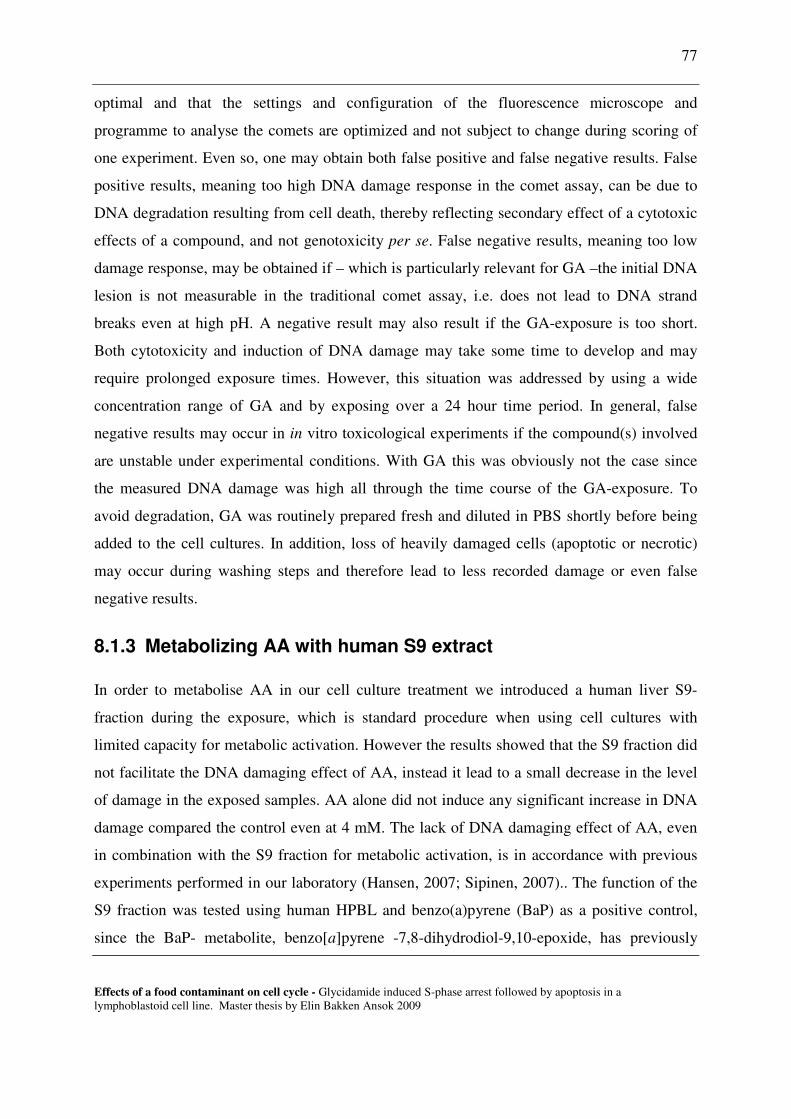
77
Effects of a food contaminant on cell cycle - Glycidamide induced S-phase arrest followed by apoptosis in a lymphoblastoid cell line. Master thesis by Elin Bakken Ansok 2009
optimal and that the settings and configuration of the fluorescence microscope and
programme to analyse the comets are optimized and not subject to change during scoring of
one experiment. Even so, one may obtain both false positive and false negative results. False
positive results, meaning too high DNA damage response in the comet assay, can be due to
DNA degradation resulting from cell death, thereby reflecting secondary effect of a cytotoxic
effects of a compound, and not genotoxicity per se. False negative results, meaning too low
damage response, may be obtained if – which is particularly relevant for GA –the initial DNA
lesion is not measurable in the traditional comet assay, i.e. does not lead to DNA strand
breaks even at high pH. A negative result may also result if the GA-exposure is too short.
Both cytotoxicity and induction of DNA damage may take some time to develop and may
require prolonged exposure times. However, this situation was addressed by using a wide
concentration range of GA and by exposing over a 24 hour time period. In general, false
negative results may occur in in vitro toxicological experiments if the compound(s) involved
are unstable under experimental conditions. With GA this was obviously not the case since
the measured DNA damage was high all through the time course of the GA-exposure. To
avoid degradation, GA was routinely prepared fresh and diluted in PBS shortly before being
added to the cell cultures. In addition, loss of heavily damaged cells (apoptotic or necrotic)
may occur during washing steps and therefore lead to less recorded damage or even false
negative results.
8.1.3 Metabolizing AA with human S9 extract
In order to metabolise AA in our cell culture treatment we introduced a human liver S9-
fraction during the exposure, which is standard procedure when using cell cultures with
limited capacity for metabolic activation. However the results showed that the S9 fraction did
not facilitate the DNA damaging effect of AA, instead it lead to a small decrease in the level
of damage in the exposed samples. AA alone did not induce any significant increase in DNA
damage compared the control even at 4 mM. The lack of DNA damaging effect of AA, even
in combination with the S9 fraction for metabolic activation, is in accordance with previous
experiments performed in our laboratory (Hansen, 2007; Sipinen, 2007).. The function of the
S9 fraction was tested using human HPBL and benzo(a)pyrene (BaP) as a positive control,
since the BaP- metabolite, benzo[a]pyrene -7,8-dihydrodiol-9,10-epoxide, has previously

78
Effects of a food contaminant on cell cycle - Glycidamide induced S-phase arrest followed by apoptosis in a lymphoblastoid cell line. Master thesis by Elin Bakken Ansok 2009
been shown to induce DNA-damage detectable in the comet-assay in the presence of S9
(Speit et al., 1996), however no increased DNA-damaging effect was observed. The CYP2E1
activity is the main oxidative metabolic step of activation of AA into GA; however, the
activity level of CYP2E1 in the commercial S9 preparation was unknown to us. A high GSH
activity in S9 may also contribute to a rapid deactivation of GA.Segerbäck and coworkers
tested AA together with an S-9 mix prepared from rats in the Ames test without any positive
effect, which is in correspondence with our findings. They concluded that the amount of GA
produced in microsomal suspensions with AA is insufficient to produce a statistically
significant response (Segerback et al., 1995). Koyama et al (2006) tested AA together with rat
liver S9 for cytotoxicity and genotoxicity without any influence on cytotoxicity or
genotoxicity of AA, even up to 15 mM. On the other hand, an enhanced activity of N-di-N-
butylnitrosamine (DBN), a positive control chemical, was seen with S9 (Koyama et al., 2006).
In addition no GA-derived DNA adducts were found in cells treated with concentrations of 2-
18 mM of AA and S9, consistent with a lack of metabolic conversion of AA to GA(Mei et al.,
2008).
8.1.4 Cell cycle analysis by Flow cytometry
A major advantage of flow cytometry is that it offers the possibility of mulitparametric
analysis of several cell attributes, including cell cycle position. In this way we were able to
analyse whether GA-treatment lead to an accumulation of cells in a particular phase of the cell
cycle by staining the DNA with PI/Hoechst in addition to a BrdU-staining in order to look at
replicating cells in particular. In general one has to be aware of cell clumping during fixation
of cells since doublets of G1 cells may be falsely detected as a G2/M, and cell aggregates in
general may give high background noise during flow cytometric analysis.
The BrdU-staining procedure is a somewhat stringent procedure with many steps and
incubations. Unfortunately we experienced problems with obtaining enough cells throughout
the procedure. Different spinning procedures was attempted but without improvement. The
source of error was sadly never revealed, therefore we had to continue only using PI staining.
In this study, GA-exposed cells seem to enter apoptosis or necrosis at high concentrations and
long exposure times. The major drawback of flow cytometric methods is that the

79
Effects of a food contaminant on cell cycle - Glycidamide induced S-phase arrest followed by apoptosis in a lymphoblastoid cell line. Master thesis by Elin Bakken Ansok 2009
identification of apoptotic or necrotic cells is not based on morphology and cannot be
correlated with morphological characterization and therefore difficult to detect in a regular PI
staining. Other methods must therefore be applied such as the TUNEL (Terminal
Deoxynucleotide Transferase dUTP Nick End Labeling) assay where the amount of DNA
fragmentation is detected. In addition, flow cytometric analysis of apoptosis, regardless of
method used, is associated with selective loss of apoptotic cells during sample preparation.
Morphological alterations were therefore examined with PI and Hoechst 342 staining in a
fluorescent microscopy, which enables us to distinguish some of the different types of cell
death as described it the method section.
Because of the difference between apoptotic and necrotic cells in plasma membrane integrity
one can preincubate with a mixture of Dnase I and trypsin that results in total loss of necrotic
and late apoptotic cells from the suspension due to lack of the ability to exclude these
enzymes. Live and early apoptotic cells exclude these enzymes and remain in the suspension.
Such treatment prior flow cytometry analysis ensures that only early apoptotic and live cells
are analyzed (Darzynkiewicz et al., 1992). Hence, explaining whether the accumulation of
cells in the S-phase area with 1 mM GA treatment for 24 or 31 hours is due to an arrest or
perhaps an increase of apoptotic and even necrotic cells from late S or G2/M.
8.1.5 Cell viability/Cell death
Many pathways leading to apoptosis exists, and DNA fragmentation and loss of DNA
fragments is not a universal finding in apoptotic death. Necrotic cells may also display some
degree of DNA degradation that may result in hypodiploid nuclei. The sub- G1 peak can also
represent nuclear fragments, chromosome clumps, micronuclei or nuclei with normal DNA
(i.e., cells undergoing differentiation) (Darzynkiewicz et al., 2001). Therefore morphological
analysis by microscopic observation of apoptotic bodies was performed. However, this
method can be time consuming, lacking objectivity and reproducibility, and making it
difficult to identify subtle changes in large populations. Thus, additional applications to detect
apoptosis such as biochemical analysis by DNA ladder in agarose gel, or specific
demonstration of DNA breaks such as in the TUNEL assay should be used to confirm
apoptosis. One should also remember that apoptosis is a dynamic process and there is a short
80
Effects of a food contaminant on cell cycle - Glycidamide induced S-phase arrest followed by apoptosis in a lymphoblastoid cell line. Master thesis by Elin Bakken Ansok 2009
”time window” during which apoptotic cells display their characteristic features. Therefore,
different methods can produce different results depending on the time of the apoptotic
process.
8.1.6 Western
Problems which may arise when detecting proteins on western blot include; fuzzy bands ,low
signal, high background, spots on film, too many bands on the blot and weak signal.
We mainly experienced problems with too many non-specific bands on the film, making it
difficult to analyse the protein of interest. This may be caused by old or poor primary
antibody quality, or insufficient blocking. This can be optimised by testing different blocking
procedures since dry non-fat milk or BSA may give different results, depending on the
primary antibody. In addition to increase or decrease both incubation time and concentration
of milk/BSA. Also, the recommended primary antibody concentration given by the datasheet
is usually higher than necessary, resulting in unspecific binding, and therefore optimisation
experiments need to be performed in order to determine the proper antibody dilutions.
Nonspecific signals due to weak antibody binding may be removed by increasing washing
times and volumes. Using a stronger detergent in the washingbuffer than TBST may provide
more stringent wash and reduce background. Though, only if the band is strong since washing
also removes some of the band of interest.
Different protein/antibodies require different exposure time. Without experience with the
protein of interest, and cell type one might overlook results due to lack of long enough
exposure, since exposure time can be from seconds and up to a day (especially phosphor
proteins). Low or weak signal may also be due to insufficient protein loaded on the gel, which
often applies to small proteins. In order to concentrate the protein of interest, one might
perform immunoprecipitation which concentrate a particular protein from the sample
containing many different proteins.

81
Effects of a food contaminant on cell cycle - Glycidamide induced S-phase arrest followed by apoptosis in a lymphoblastoid cell line. Master thesis by Elin Bakken Ansok 2009
8.2 Statistical analysis
All comet assay experiments were performed twice. To be able to perform proper statistical
analysis, at least three independent experimental runs are necessary. Due to time constraints,
this was not possible. Nonetheless, the data obtained in the two experimental runs are
analyzed statistically to look for trends.
Comet data failed normality test and homogeneity of variance, which suggest the use of non-
parametric tests. Duez et al. (2003) looked at the use of non-parametric test and found the
tests to be overly sensitive, detecting significant, but objectively unimportant, differences.
However this might be due to the erroneous use of the single comet to be the experimental
unit which result in a very large n. Non-parametric tests of the comet data was attempted but,
due to only two independent experiments statistical significance of obvious differences were
not detected (data not shown). The 95% confidence intervals of the mean values were also
examined and showed no overlap in the statistical significant exposures analyzed by ANOVA.
The experimental design is nested which can not be used in non-parametric tests. A possibility
would have been to analyse the data with a parametric analysis of median values obtained in
each gel, but this would lead to loss of information, as experiment and gel number can not be
factors in this analysis. The power of this analysis would also be low. The distribution of the
data is quite different in control and treatment groups with Fpg treatment and long exposure
times and high concentrations of GA (0.5 mM) due to highly damaged cells which are left
skewed while some damaged cells are right skewed. Non-parametric tests do not require
normality, but similar distributions in all groups. Transformation of data using Log
transformation could work on right skewed, but not left skewed, and might result in
heterogeneity of variances (Lovell and Omori, 2008). ANOVA is thought to be robust enough
to conduct with some differences in the variances, and with a minor violation of the normality
(Lovell and Omori, 2008).
Effects size, using partial eta squared obtained from SPSS were evaluated with each ANOVA
analysis, and gave a value above 0.8 at all cases. Partial eta squared effect size indicate the
proportion of variance of the dependent variable that is explained by the independent variable,
with values ranging from 0 to 1. Though, with a large enough sample, quite small differences

82
Effects of a food contaminant on cell cycle - Glycidamide induced S-phase arrest followed by apoptosis in a lymphoblastoid cell line. Master thesis by Elin Bakken Ansok 2009
can become statistically significant, even if the difference between the groups is of little
practical significance. The use of raw data in the comet analysis may have affected this value.
8.3 GA-induced DNA damage
We showed that AA exposure alone or together with the S9 extract did not lead to any
increased DNA-damage even at high AA concentrations in the lymphoblastoid cell line as
well as in normal human peripheral lymphocytes, when exposed for 2 hours. Apparently, Fpg-
treatment did not detect any additional lesions either, indicating no induction of oxidative
damage or ring opened structures recognised by Fpg after 2 hours AA exposure in vitro. The
lack of damage response with AA in the comet assay is in contrast to studies by Blasiak and
coworkers and Jiang and his group, who observed induced DNA damage with lower
concentrations of AA in human lymphocytes and hepatoma cells, respectively (Blasiak et al.,
2004; Jiang et al., 2007). Nevertheless, our results are in accordance with other studies where
no or low observed DNA damaging effect of AA was observed (Baum et al., 2005; Koyama
et al., 2006; Puppel et al., 2005). Therefore, AA seems to be only slightly genotoxic in vitro
when analysed in the comet assay.
In addition, GA did not induce any significant increase in SSB or AP-sites at concentrations
up to 0.5 mM GA following two hours exposure time as no increase in DNA damage was
observed. Nevertheless, longer exposure periods with GA lead to an increase in GA-induced
SSB and AP-sites. On the other hand, Fpg treatment induced high levels of DNA-damage
even at very low GA concentrations (down to 0.05 mM GA) indicating either a high level of
oxidative damage or ring opened structures, recognised by Fpg. Previous reports have shown
that GA forms adducts directly with DNA and protein, making GA highly genotoxic (Gamboa
da Costa et al., 2003; Ghanayem et al., 2005a; Segerback et al., 1995) Our results are in
favour of previous in vitro observations that GA is the directly DNA reacting compound and
that AA is rather inactive towards DNA (Baum et al., 2005; Koyama et al., 2006; Puppel et
al., 2005).

83
Effects of a food contaminant on cell cycle - Glycidamide induced S-phase arrest followed by apoptosis in a lymphoblastoid cell line. Master thesis by Elin Bakken Ansok 2009
8.3.1 GA induced DNA damage recognized by Fpg
Using Fpg highly increased the detection of GA-induced lesions as detected in the comet
assay, both with the normal human lymphocytes and with the lymphoblastoid cell line. Fpg
recognizes a variety of substrates, and excises preferentially 8-oxoG but also FaPy-G, FaPyA
and methylated FaPyG (Me-FaPyG) (Asagoshi et al., 2000; Boiteux et al., 1984; Boiteux et
al., 1992). This wide substrate affinity is in contrast to the more specific hOGG1 enzyme
which has a high affinity for 8-oxoG although FaPy-G is also recognised (Asagoshi et al.,
2000; Graves et al., 1992). Preliminary and very recent experiments in our laboratory
comparing the Fpg enzyme with a commercial hOGG1-enzyme showed that hOGG1 gave
nearly no GA-induced damage detection compared to Fpg (Hansen, 2009). This suggests that
the Fpg-sensitive sites caused by GA exposure are not likely to represent oxidative damage. In
these experiments, a photoactive compound (Ro 12-9786 plus visible light, inducing
predominantly oxidated purines) was used as a positive control for the activity of the hOGG1
enzyme to recognise and cleave 8-oxoG. Nevertheless, based on the chemical properties of
GA, it is not likely to cause significant levels of oxidative damage of the DNA. However,
exposure to GA at high concentrations and for extended periods may lead to GSH depletion
(Kurebayashi and Ohno, 2006)which in turn may lead to increased ROS formation and
secondary oxidative effects.
Apparently, when exposing the cells to GA, the lysing procedure in the comet assay may
affect the results when treating with the Fpg-enzyme. The standard procedure has previously
been to lyse the cells for a minimum of 1.5 hours, to overnight. However, according to
preliminary results in our laboratory when lysing GA-exposed cells overnight, a striking
increase in Fpg-sensitive sites was noted (Hansen, 2009). This is believed to be caused by
alkali catalyzed ring-opening of GA-adducts during lysis, (favoured during alkaline
conditions, relative to depurination) (Gates et al., 2004) thereby increasing the number of
ring-opened GA-lesions recognised by Fpg.
Since GA preferably forms N7-GA-Gua adducts (Gamboa da Costa et al., 2003) there may be
a number of ring opened structures identified by Fpg. To address this problem, in each
experiment the lysis conditions should be carefully controlled with respect to temperature,
84
Effects of a food contaminant on cell cycle - Glycidamide induced S-phase arrest followed by apoptosis in a lymphoblastoid cell line. Master thesis by Elin Bakken Ansok 2009
duration and pH. Previous studies have also shown that Fpg detects DNA damage from other
classical alkylated agents (Smith et al., 2006; Speit et al., 2004). Additionally, in vivo
experiments with wild-type and the Ogg1-knockout mice showed minor differences in their
repair capability of GA-induced damage (Hansen, 2009), further strengthening the hypothesis
that the GA-induced DNA lesions are not oxidative. Rather, it seems that the DNA-damage
caused by GA in vitro is mainly due to alkylated adducts and not oxidative lesions.
8.3.2 GA induced DNA adducts
It has been shown that the in vitro reaction of GA with DNA results in the formation of
different adducts in the following order: N7-GA-Gua > N1-GA-dA > N3-GA-dA (Gamboa da
Costa et al., 2003). Depurination of N7-alkyl-Gua and N3-alkyl-Ade, and the imidazole ring
opening of N7-alkyl-Gua yielding Alkyl-Fapy-G are acid- and alkali-catalysed, respectively,
but occur even at physiological conditions. Depurination is usually the predominant reaction
observed for N7-alkylguanine residues in double stranded DNA under physiological
conditions (Gates et al., 2004). Therefore, GA adducts may spontaneously depurinate in cells
and form AP-sites which are converted into strand breaks. This may be the case when GA
(0.5 mM) exposure was performed for 24 hours and high levels of DNA-damage without Fpg-
treatment were observed. Otherwise they may transform into ring-opened GA-lesions, GA-
FaPy-G during the alkaline lysis in the comet assay. Both AP sites and ring-opened lesions
are recognised by the Fpg-enzyme and excised as previously described (Boiteux et al., 1984;
Boiteux et al., 1987; Graves et al., 1992).
Both N7-GA-Gua and N3-GA-dA are promutagenic due to the spontaneous depurination
(Gamboa da Costa et al., 2003; Segerback et al., 1995). The N7G and N3A adducts formed by
binding of GA to DNA are not involved in the hydrogen bond basepairing region and
therefore do not mispair during replication (as reviewed in Jenkins et al., 2005), but are prone
to spontaneously formed AP sites (Besaratinia and Pfeifer, 2004). But the N3 atom is
important in stabilising contact between the polymerase and the template (Engelward et al.,
1998). N1-GA-dA adducts are also highly promutagenic because of the impaired base pairing
potential (Gamboa da Costa et al., 2003; Segerback et al., 1995). The N3-alkylated adenine
adducts are considerably more labile than those of the N7-guanines (Koskinen and Plna,

85
Effects of a food contaminant on cell cycle - Glycidamide induced S-phase arrest followed by apoptosis in a lymphoblastoid cell line. Master thesis by Elin Bakken Ansok 2009
2000) Since AP sites and Alkyl-Fapy-G can persist in DNA for extended periods, they may
have biological implications since these lesions are both mutagenic and cytotoxic (Chetsanga
et al., 1982; Koskinen and Plna, 2000; O'Connor et al., 1988; Tudek, 2003).
The resulting GA-adduct density may influence the stability of adducts in dsDNA. Distortion
of the DNA duplex in heavily adducted DNA may be responsible for the decreased stability as
seen in the case of the Aflatoxin lesion (Gates et al., 2004). Thus in our case, the continuous
exposure to GA over time (Figure 14), may lead to heavily adducted DNA which may further
decrease the stability, since a large number of structures are excised by Fpg. For this reason,
cells exposed to 1 mM GA for up to 31 hours are prone to exhibit apoptotic or necrotic
behaviour as our results show.
The rate at which different N7-alkylguanine lesions undergo depurination from dsDNA varies
widely, and is dependent of the structure of the substituent in the N7 position of guanine. The
half-life of N7-GA-Gua in salmon testis DNA incubated with GA at 37˚C was determined to
be 42 h, while the half-life of N3-GA-Ade was measured as 14 h, and increasing with lower
temperatures (Gamboa da Costa et al., 2003). Even though N3-Ade adducts typically undergo
spontaneous depurination of DNA at higher rates than N7-Gua adducts (Koskinen and Plna,
2000) they can also block transcription which can lead to sister chromatid exchange and S-
phase arrest (Engelward et al., 1998). Therefore, a possible depurination of N3-Ade adducts
due to the continuous GA-exposure may occur in great numbers and contribute to the
apparent S-phase accumulation observed with 0.5 mM and 1 mM GA and 24 hours exposure
time.
8.4 Repair of GA-induced DNA-damage
The GA-induced DNA damage detected by Fpg was apparently subjective to repair. The high
level of damage obtained with Fpg treatment in the comet assay saturated the system and
made it more difficult to measure and calculate the repair-kinetics of Fpg sensitive sites.
However there was a marked reduction over time both with and without Fpg treatment
implying a repair of strand breaks, ALS and the Fpg-sensitive sites in lymphoid cells. The
repair of GA-lesions has according to Johansson et al 2005 been associated with the small
86
Effects of a food contaminant on cell cycle - Glycidamide induced S-phase arrest followed by apoptosis in a lymphoblastoid cell line. Master thesis by Elin Bakken Ansok 2009
patch BER pathway (Johansson et al., 2005), although this has never been disproven or
confirmed by others. However, the fact that Fpg recognises the GA-induced lesions supports
this notion. Further, DNA glycosylases in the BER pathway, such as Fpg, are involved in
repairing alkylated DNA by the removal and replacement of alkylated bases (Frosina et al.,
1996; Petermann et al., 2003). This is especially important for the N7G and N3A adducts
(Jenkins et al., 2005).
Previous results in our laboratory indicated a GA-induced upregulation of XPA, and to some
extent XPC transcription by RT-PCR in the testicular germ cell tumor cell line 833K (data
not shown). For this reason we examined whether GA induced any changes in the expression
of these repair proteins by western blot analysis. However, neither XPA nor XPC, two of the
enzymes responsible for damage detection and initiation of DNA damage repair in NER,
showed any protein upregulation. This does not exclude the possibility that NER is involved
in repair of GA-induced DNA damage. However, based on the Fpg-comet observations, we
interprete our preliminary results as suggesting little or no contribution of NER in the repair
of GA-induced DNA lesions. Taken together, our results support the involvement of a short
patch BER-pathway in the repair of GA-induced DNA lesions. On the other hand, we can not
exclude the possibility that other repair pathways are induced additionally, especially when
higher GA-concentrations are used. For instance, HR may be involved when high numbers of
SSB are induced by exposing to high GA-concentrations over time, which my lead to DSB.
Once BER is initiated, damage-specific glycosylases give rise to accumulation intermediates
that can cause a partial or complete block to replication fork progression possibly inducing
fork regression(Sobol et al., 2003). We observed an accumulation of cells in S-phase (high
exposure <8 hours) and a seemingly reduced DNA-replication, and the former mechanism
may be an explanation to these observations. Further, if the BER pathway is initiated during
continuous GA-exposure, this might lead to an accumulation of BER intermediates that in
combination with the adducts, AP sites and potentially Fapy lesions leads to cell death with
high GA-exposures as observed.

87
Effects of a food contaminant on cell cycle - Glycidamide induced S-phase arrest followed by apoptosis in a lymphoblastoid cell line. Master thesis by Elin Bakken Ansok 2009
8.5 Biological consequences of GA-induced lesions
Proliferating cells in G1 or G2 phases may respond to genotoxic stress by activating
checkpoints that impose shorter or lasting arrest in G1 or G2 before they enter S phase or M
phase, respectively. In contrast, cells that experience genotoxic stress during DNA replication
will only delay their progression through S phase in a transient manner, and if damage is not
repaired during this delay they exit S phase and should arrest later when reaching the G2
checkpoint (Bartek et al., 2004). The mammalian S phase checkpoints are thought to only
have a minor role, compared to the more robust G1 and G2 checkpoints. The S phase is the
most vulnerable period of the cell cycle, and protecting the integrity of the genome during this
critical phase is important. Though DNA damaging insult during this period have more repair
opportunities than in the G1-phase (Bartek et al., 2004).
It has been published that AA and GA can inhibit the microtubule-depolymerizing kinesin
leading to failure of the migration of chromosomes from the metaphase plate and reduced
mitotic activity (Adler et al., 1993; Gassner and Adler, 1996). However, our results did not
indicate any accumulation in the G2/M phase by GA which one might expect. We did not test
AA effect on cell cycle, such an experiment might have revealed some more insight on this
matter. It is probable that inhibition of kinesin involved in the mitotic/meotic spindle is related
to blocks in cell division by AA and/or GA (Sickles et al., 2007) However we did not
investigate direct effects on kinesins, but we observed transient arrest in S-phase rather than
G2/M and may only speculate if this effect might have be caused by kinesin-effects in our
experiments.
8.5.1 GA-induced S-phase arrest and apoptosis
N1-GA-Ade and N3-GA-Ade may serve as a block to DNA synthesis (Boiteux et al., 1984;
Engelward et al., 1998; Singer, 1975). Inhibition of DNA synthesis by Fapy-7MeG is stronger
than that of 8-oxoG, but weaker than that of AP site (Tudek, 2003). The extensison step
constitutes a major kinetic barrier to DNA synthesis, and thus DNA polymerase incorporates
nucleotide opposite Fapy-7MeG and stops. FapyA and Fapy-7MeA also possesses miscoding
potential. Though, Fapy lesions are actively eliminated by repair glycosylases, specific for
oxidized purines and pyrimidines (Tudek, 2003). GA adducts and secondary lesions therefore

88
Effects of a food contaminant on cell cycle - Glycidamide induced S-phase arrest followed by apoptosis in a lymphoblastoid cell line. Master thesis by Elin Bakken Ansok 2009
possess the potential to inhibit DNA replication, however we do not know the amount of
adduct, Fapy lesions or AP sites that may be present. However, Fapy lesions are not likely the
most prominent lesion since it is preferentially formed under alkali conditions. 8-oxo-G is
also not likely to be present in high amounts due to low levels of oxidative damage detected
with hOGG1 enzyme in the comet assay (Hansen, 2009). Therefore, due to the fact that it has
been shown that the in vitro reaction of GA with DNA forms adduct in the following order:
N7-GA-Gua > N1-GA-dA > N3-GA-dA (Gamboa da Costa et al., 2003) there might be a
large number of adducts with long exposure duration, that has DNA synthesis block property
due to possibly depurination of N7-GA-Gua and replication block by N1-GA-Gua and N3-
GA-Gua. In addition to possible BER intermediates, leading to replication block that with
high exposure becomes overwhelming for the cell and leads to apoptosis.
0.1 mM GA did not seem to induce any typical arrest behaviour at any of the cell cycle phases
for up to 24 hours exposure time when analyzed with PI staining and flow cytometry. Though,
preliminary results indicated a small accumulation between G1 and early S phase with GA
exposure of 0.3 mM after 72 hours (results not shown). Further, with BrdU incorporation, the
major S-phase population of cells after GA-exposure indicated a reduction in both PI- and
FITC-staining, shown in Figure 21. Thus, the reduced BrdU-incorporation at 24 hours and
maybe even at 12 hours, indicates a lower replication rate induced by GA. The number of
cells residing in S-phase increased prominently after 24 hours exposure time, while the
number of cells in G1 decreased, implying that the cells are arrested in early S- phase.
However it is important to point out that this assumption is only based on one experiment, and
variations may apply. Unfortunately we experienced difficulties with the BrdU-incorporation
method, which is a more sensitive method to visualize more discrete alterations in the
different cell cycle phases, especially the S-phase. Therefore, transient arrests may have
occurred, which was not detectable with the PI-staining method used. Therefore, BrdU-
incorporation with both low and high GA-concentrations and with different exposure times up
to 24 hours would maybe reveal new insight into the actions of GA on cell cycle.
However, at 24 hours the 0.5 mM and 1 mM GA exposure with PI staining had induced
significant amounts of apoptosis. This was markedly increased after 31 hours exposure time,
implying that the DNA damage caused by GA at these concentrations is lethal. No time points

89
Effects of a food contaminant on cell cycle - Glycidamide induced S-phase arrest followed by apoptosis in a lymphoblastoid cell line. Master thesis by Elin Bakken Ansok 2009
between 8 and 24 hours in the cell viability assay were tested (Figure 28), making it difficult
to state the onset of apoptosis in our assay. However, after 30 hours, a large amount of
apoptotic-necrotic cells appeared when high GA concentrations were used, implying that a
large number of cells become apoptotic at an earlier stage. It is noteworthy that we did not see
a more prominent arrest in any of the cell cycle phases after cells were exposed to low GA
concentrations, in order to attempt DNA repair. For instance, no arrest in the G1-phase after
GA-exposure was detected. Rather, the cells were able to continue cell cycle even with high
numbers of Fpg-sensitive lesions. The cells may be able to rapidly repair these lesions without
disturbing the cell cycle, for instance with short-patch BER. In addition, since the cell line
used may have malfunctional checkpoints and may override the GA-induced lesions, the next
step would therefore be to test GA-exposure on normal stimulated human lymphocytes.
The comet assay shows a sustained saturation in Fpg sensitive sites when exposing the
lymphoid cells to 0.1 mM GA starting at 6 hours exposure time. This does not seem to affect
cell cycle regulation but induces phosphorylation of p53 at serine 15, and an up-regulation of
total p53. Activation of p53 is normally associated with DNA repair, cell cycle arrest and
apoptosis (Vazquez et al., 2008). The lack of cell cycle responses to the high levels of Fpg-
sensitive sites seen at lower GA concentrations may imply that these lesions are repaired
without the need for cell cycle arrest or ignored by the cell system used, as already mentioned.
The high levels of DNA damage seen with 0.5 mM GA after 24 hours exposure time without
Fpg-treatment implies high levels of SSB and AP-sites. These high levels of Fpg-independent
lesions may be responsible for the apoptosis observed. It has been shown that chromosomal
SSBs can, if not repaired rapidly, block DNA replication forks during the S-phase of the cell
cycle, possibly leading to the formation of DSB (Kuzminov, 2001). Even though this type of
DSB is rapidly repaired by homologous recombination (HR), an acute increase in cellular
SSB levels might saturate this pathway, leading to genetic instability and/or cell death
(Kuzminov, 2001).
8.5.2 Regulation of cyclin A following GA-exposure
Since cyclin A is especially needed for the passage through S-phase (S. Maddika et al., 2007)
we would expect a decrease in cyclin A level after GA-exposure and the observed S-phase

90
Effects of a food contaminant on cell cycle - Glycidamide induced S-phase arrest followed by apoptosis in a lymphoblastoid cell line. Master thesis by Elin Bakken Ansok 2009
arrest. Nevertheless, cyclin A showed no down regulation after GA exposure at any time
points, rather a small increase in protein expression with higher concentrations of GA. We can
of course not exclude the fact that the kinase activity of the cyclinA/cdk2 complex was
reduced by i.e. binding of a CDK inhibitor, or modified by
phosphorylation/dephosphorylation events. The slight induction of p21CIP1 observed after GA-
treatment might be sufficient to inhibit CDK2/cyclin A activity. In addition, p21CIP1 may be
translocated from the cytoplasm to the nucleus and thereby able to inhibit CDK2 without any
observed up regulation of the inhibitor protein, p21CIP1, on the western blot. A CDK2/cyclin A
kinase activity assay or a co-precipitation experiment with p21CIP1 -CDK2/cyclinA would be
an appropriate assay to perform to evaluate this. On the other hand, the overexpression of the
EBV-protein EBNA3C may result in constitutive cyclin A-overexpression and kinase activity
(Knight and Robertson, 2004) which may mask any effect of GA on cyclin A and might
explain why we do not see any down regulation. Cyclin E and cyclin D was also tested,
however the results were difficult to interpret due to high background on the immunoblot with
the Abs that we had in hand (data not shown).
8.5.3 Regulation of p53 and p21CIP1 following GA-exposure
While cell-cycle arrest depends on the ability of p53 to induce the transcription of target genes
such as the CDK inhibitor p21CIP1 (W. S. El-Deiry et al., 1993), apoptosis depends on
induction of a distinct class of target genes.
We observed that GA induced a stress response leading to a phosphorylation on serine15 of
p53. The ser15-phosphorylation increased in a both time and dose dependent manner. This
phosphorylation stabilizes p53 (Lavin and Gueven, 2006). When detecting the protein level of
total p53 an increase following phosphorylation was observed which is in accordance with the
literature. Increased p53 levels have several downstream effects such as cell cycle arrest,
repair or apoptosis. In our case, increased p53 as a result of GA-exposure may have resulted
in the induction of p21CIP1 protein expression. This pathway has been described in several
other genotoxic studies (M. Mahyar-Roemer et al., 2001,D. L. Persons et al., 2000). A small
induction of p21CIP1 protein in GM00130C was noted with higher concentrations of GA (0.5
mM and 1.0 mM) used. We expected a much more prominent induction of p21CIP1 and also a
91
Effects of a food contaminant on cell cycle - Glycidamide induced S-phase arrest followed by apoptosis in a lymphoblastoid cell line. Master thesis by Elin Bakken Ansok 2009
time dependent induction of p21CIP1 following p53-phosphorylation and expression. In
general, upon DNA damage induction, the protein ATM is recruited to DSBs, and
phosphorylate proteins such as p53 leading to the stabilization of p53 and further p21CIP1
induction (as reviewed in Kurz and Lees-Miller, 2004). Due to the lack of a clear upregulation
of p21CIP1, we tested both a mono- and polyclonal antibody against p21CIP1 without any
changes in the result. However, preliminary results using normal PBL showed that 0.5 mM
GA exposure induced a more pronounced upregulation of p21CIP1 already at 2, 4 and 14 hours
(data not shown). The different p21CIP1 responses in PBL and GM00130C may be caused by
actions of latent EBV in GM00130 which have been reported to inhibit p21CIP1 accumulation
(J. O'Nions et al., 2003,L. S. Young et al., 2003). Further, several studies have established that
EBNA3C have potential inhibitory effects on p53 functional activities (Yi et al., 2009).
According to the authors, this include repression of p53 mediated transactivation, due to
binding of EBNA3C to p53 (Yi et al., 2009). This could, for example, have an effect on
p21CIP1 expression since we do not see any clear upregulation of p21CIP1 or a G1 arrest in
GM00130C.
The genotoxic drug cisplatin, which generates DNA adducts and triggers the ATM-p53-
p21CIP1 response (S. L. Colton et al., 2006), was used to trigger checkpoints on proliferating
B-blast infected with EBV. Latent EBV did not appear to affect the activity of p53 but rather
downstream of p53 and interfered with the regulation p21CIP1. By preventing the
accumulation of p21CIP1 it appears to prevent the inactivation of CDK2, and therefore DNA
replication continued instead of being inhibited (O'Nions and Allday, 2003). p53 does not
seem to be affected by EBV in our case either, but a downstream effect is highly likely since
p21CIP1 and p27KIP1does not appear to be significantly regulated despite the high level of GA-
induced DNA damage. How EBV actually may prevent the accumulation of p21CIP1 is not
fully clear. Never the less, since there is an observed increase in the level of p21CIP1 mRNAs,
it is possible that there is a block to its translation (O'Nions and Allday, 2003). Another
explanation to the lack of accumulation could be that EBV direct the degradation of this
newly synthesized by acting on either p21CIP1 or CDK2 in a way that prevents p21CIP1 from
forming complexes with CDK2 and therefore exposing it for degradation by the proteasome.
Alternatively, EBV may increase the access to or affinity of p21CIP1 for proteasomes (J.
O'Nions et al., 2003,L. S. Young et al., 2003) which leads to degradation. Cells with

92
Effects of a food contaminant on cell cycle - Glycidamide induced S-phase arrest followed by apoptosis in a lymphoblastoid cell line. Master thesis by Elin Bakken Ansok 2009
insufficient p21ClP1 to exert an antiproliferative effect are highly prone to apoptosis when their
genome is severely damaged. This could be related to altered repair capacity, since p21CIP1
have been reported to be involved in different forms of repair (Gartel and Tyner, 2002).
A dose and time dependent apoptotic response was observed, but no G1 arrest. However we
did see an accumulation in S-phase together with apoptosis when cells were exposed to high
concentrations of GA over time. Reports have shown that p21CIP1 can inhibit as well as induce
apoptosis. The anti- or pro-apoptotic character of p21CIP1 partly depends on its subcellular
localization (Gartel and Tyner, 2002). Nuclear localized p21CIP1 have shown to be pro-
apoptotic, whereas cytosolic localized p21CIP1 has anti-apoptotic properties (Coqueret, 2003).
p21CIP1 may therefore have performed apoptotic actions which are not visible to us without
checking the subcellular localization of p21CIP1 i.e. using immuno fluorescence microscopy
techniques. Another possibility may be EBV latent genes affecting p21CIP1. These genes, if
affecting p21CIP1 actions, may disrupt the G1 checkpoint that otherwise might have been
triggered by GA, which make the cells prone for apoptosis. This could have been examined
by exposing our cells to genotoxic drugs known to initiate a G1 arrest, but was not performed
due to time limitations.
8.5.4 Regulation of p27 following GA exposure
As already mentioned in the introduction, anti-mitogenic signals result in an increased
p27KIP1level (J. Vervoorts et al., 2008,Z. Wang et al., 2003) and that p27KIP1 is involved in
the induction of apoptosis when overexpressed (Vervoorts and Luscher, 2008). However, no
upregulation in the protein content of p27KIP1 was observed at any exposure times or
concentrations of GA used, when compared to the control. This may again be due to the EBV
latent gene EBNA3C shown to inhibit accumulation of p27KIP1 similar to p21CIP1 inhibition
(Knight and Robertson, 2004). This inhibition might be achieved through the reqruitment of
SCFSkp2 E3 ligase complex activity to cyclin A complexes by EBNA3C which results in
ubiquitination and SCFSkp2 dependent degradation of p27KIP1or destabilisation (as reviewed in
J. S. Knight et al., 2004,J. S. Knight et al., 2005). Also, EBNA3C have shown to overcome
the restriction checkpoint that causes cells to arrest in G1 of the cell cycle in reduced serum.
This failure to respond to normal anti-proliferative signals is consistent with the
93
Effects of a food contaminant on cell cycle - Glycidamide induced S-phase arrest followed by apoptosis in a lymphoblastoid cell line. Master thesis by Elin Bakken Ansok 2009
demonstration of failed p27KIP1accumulation when mitogens are withdrawn (G. A. Parker et
al., 2000).
To exert its CDK inhibitory functions, p27KIP1 is required to be localized to the nucleus by
phosorylation events of its nuclear localization signal (NLS) (as reviewed in Denicourt and
Dowdy, 2004). In quiescent normal cells, p27KIP1 is nuclear. Then in early G1, p27KIP1 export
may be required to support assembly and nuclear import of newly translated D-type cyclins
and Cdks. Both p27 KIP1 and p21CIP1 facilitate assembly of D-type cyclin complexes in vitro
and in vivo and direct nuclear import (Chu et al., 2008). Since the activated form of CDK2 is
located in the nucleus (Dietrich et al., 1997), only the nuclear forms of Cip/Kip proteins could
be considered as CDK inhibitors. However p21CIP1 and p27KIP1 are also located in the
cytoplasm where they even activate D-type complexes through an enhanced association and
nuclear accumulation (as reviewed in Coqueret, 2003). Therefore, a study of the sub cellular
localization of p21WAF1 and p27KIP1in accordance with cell cycle arrest and apoptosis would
be of great interest in order to clarify their roles in cell cycle arrest, repair and apoptosis. In
addition we could maybe exclude or verify if in fact the EBV latent genes have affected a
normal response of p21WAF1 and p27KIP1 to GA exposure of GM00130.

94
Effects of a food contaminant on cell cycle - Glycidamide induced S-phase arrest followed by apoptosis in a lymphoblastoid cell line. Master thesis by Elin Bakken Ansok 2009
9. Conclusions and future work
In summary, we found GA to be highly genotoxic at relatively low levels. However, although
we were able to measure high levels of Fpg-sensitive sites after exposure to low concentration
of GA in vitro, no effect on the cell cycle of the lymphoblastoid cell line was observed.
Nevertheless, genotoxic stress response such as phosphorylation of p53 and a small induction
of p21CIP1 was observed. On the other hand, higher concentration of GA (0.5 mM – 1 mM)
resulted in a putative halt in the DNA-replication and an accumulation of cells in S-phase
together with an increased apoptotic progression. Therefore, it seems that the EBV-
transformed cells are able to overcome or ignore the initial Fpg-recognised lesions induced by
GA. When higher levels of strand breaks are introduced with increasing GA-concentrations,
the cells eventually undergo apoptosis.
Since several studies indicate an EBV-mediated interference with regular stress responses as
already discussed, it may be that the latent EBV in our cell system affects the B-blasts from
GA-induced stress responses. Therefore, further studies using stimulated normal PBL are
highly relevant in order to confirm or compare the responses observed with GA-induced
genotoxic stress on GM00130C cell cycle. In this way we may able to explore whether the
EBV latent viral genes are affecting important DNA damage checkpoints in our system. In
addition, it will be important to establish how normal lymphoid cell cycle responds to low
levels of GA. If lymphoid cells in general are able to ignore low levels of GA-induced lesions
without triggering a sufficient repair process, it may eventually lead to an accumulation of
mutations in the cell and eventually lead to cancerous development over time.
In addition, further studies to reveal what type of lesions GA induces will be important to
explore in order to understand the mechanisms by which these lesions are repaired and dealt
with by the cell. There are already good indications in our laboratory that the hOGG1 does not
recognise GA-induced lesions and thus no induced oxidative damage such as 8-oxo-G.
Therefore, further analysis to reveal the amount of the different GA-adducts introduced will
be important, especially in connection with cell cycle arrest.

95
Effects of a food contaminant on cell cycle - Glycidamide induced S-phase arrest followed by apoptosis in a lymphoblastoid cell line. Master thesis by Elin Bakken Ansok 2009
Additionally we may take advantage of the different NER defective cell lines available in our
laboratory in order to reveal whether this repair pathway is involved or not. If GA-induced
lesions are repaired less efficient in these defective cell lines, the NER-pathway may well be
involved and vice versa.
The GA concentrations used in this thesis is much higher than what an average person is
exposed to on a daily basis. The general belief regarding toxicity of AA dietary intake is not
alarmingly, though there is an increasing awareness regarding genotoxic compounds in food,
which in the case of AA, is quite popular; coffee, chicken, crisp bread and chips. GA-induced
adducts has shown to have a relative long half-life, and may therefore lead to accumulation
with continuous dietary exposure. With the observed cell DNA damage, cycle alterations and
the induction of p53 there is potentially risk of carcinogenesis and therefore more knowledge
is important.

96
Effects of a food contaminant on cell cycle - Glycidamide induced S-phase arrest followed by apoptosis in a lymphoblastoid cell line. Master thesis by Elin Bakken Ansok 2009
References
Adler, I.D., Zouh, R., and Schmid, E. (1993). Perturbation of cell division by acrylamide in vitro and in vivo. Mutat. Res 301, 249-254.
Allday, M.J., Crawford, D.H., and Thomas, J.A. (1993). Epstein-Barr virus (EBV) nuclear antigen 6 induces expression of the EBV latent membrane protein and an activated phenotype in Raji cells. J Gen. Virol. 74 ( Pt 3), 361-369.
Allday, M.J., and Farrell, P.J. (1994). Epstein-Barr virus nuclear antigen EBNA3C/6 expression maintains the level of latent membrane protein 1 in G1-arrested cells. J Virol. 68, 3491-3498.
Asagoshi, K., Yamada, T., Terato, H., Ohyama, Y., Monden, Y., Arai, T., Nishimura, S., Aburatani, H., Lindahl, T., and Ide, H. (2000). Distinct repair activities of human 7,8-dihydro-8-oxoguanine DNA glycosylase and formamidopyrimidine DNA glycosylase for formamidopyrimidine and 7,8-dihydro-8-oxoguanine. J Biol Chem. 275, 4956-4964.
Azqueta, A., Shaposhnikov, S., and Collins, A.R. (2008). DNA oxidation: Investigating its key role in environmental mutagenesis with the comet assay. Mutat. Res.
Bartek, J., Lukas, C., and Lukas, J. (2004). Checking on DNA damage in S phase. Nat Rev. Mol. Cell Biol 5, 792-804.
Baum, M., Fauth, E., Fritzen, S., Herrmann, A., Mertes, P., Merz, K., Rudolphi, M., Zankl, H., and Eisenbrand, G. (2005). Acrylamide and glycidamide: genotoxic effects in V79-cells and human blood. Mutat. Res 580, 61-69.
Besaratinia, A., and Pfeifer, G.P. (2004). Genotoxicity of acrylamide and glycidamide. J Natl. Cancer Inst. 96, 1023-1029.
Blasiak, J., Gloc, E., Wozniak, K., and Czechowska, A. (2004). Genotoxicity of acrylamide in human lymphocytes. Chem. Biol Interact. 149, 137-149.
Boiteux, S., Belleney, J., Roques, B.P., and Laval, J. (1984). Two rotameric forms of open ring 7-methylguanine are present in alkylated polynucleotides. Nucleic Acids Res 12, 5429-5439.
Boiteux, S., Gajewski, E., Laval, J., and Dizdaroglu, M. (1992). Substrate specificity of the Escherichia coli Fpg protein (formamidopyrimidine-DNA glycosylase): excision of purine lesions in DNA produced by ionizing radiation or photosensitization. Biochemistry 31, 106-110.

97
Effects of a food contaminant on cell cycle - Glycidamide induced S-phase arrest followed by apoptosis in a lymphoblastoid cell line. Master thesis by Elin Bakken Ansok 2009
Boiteux, S., O'Connor, T.R., and Laval, J. (1987). Formamidopyrimidine-DNA glycosylase of Escherichia coli: cloning and sequencing of the fpg structural gene and overproduction of the protein. EMBO J 6, 3177-3183.
Bornkamm, G.W., and Hammerschmidt, W. (2001). Molecular virology of Epstein-Barr virus. Philos. Trans. R. Soc. Lond B Biol Sci. 356, 437-459.
Cann, K.L., and Hicks, G.G. (2007). Regulation of the cellular DNA double-strand break response. Biochem. Cell Biol. 85, 663-674.
Cavalieri, E., Frenkel, K., Liehr, J.G., Rogan, E., and Roy, D. (2000). Estrogens as endogenous genotoxic agents--DNA adducts and mutations. J Natl. Cancer Inst. Monogr, 75-93.
Chen, W., Huang, S., and Cooper, N.R. (1998). Levels of p53 in Epstein-Barr virus-infected cells determine cell fate: apoptosis, cell cycle arrest at the G1/S boundary without apoptosis, cell cycle arrest at the G2/M boundary without apoptosis, or unrestricted proliferation. Virology 251, 217-226.
Chetsanga, C.J., Bearie, B., and Makaroff, C. (1982). Alkaline opening of imidazole ring of 7-methylguanosine. 1. Analysis of the resulting pyrimidine derivatives. Chem. Biol Interact. 41, 217-233.
Chu, I.M., Hengst, L., and Slingerland, J.M. (2008). The Cdk inhibitor p27 in human cancer: prognostic potential and relevance to anticancer therapy. Nat Rev. Cancer 8, 253-267.
Coller, H.A., Grandori, C., Tamayo, P., Colbert, T., Lander, E.S., Eisenman, R.N., and Golub, T.R. (2000). Expression analysis with oligonucleotide microarrays reveals that MYC regulates genes involved in growth, cell cycle, signaling, and adhesion. Proc. Natl. Acad. Sci. U. S. A 97, 3260-3265.
Collins, A.R., Dobson, V.L., Dusinska, M., Kennedy, G., and Stetina, R. (1997). The comet assay: what can it really tell us? Mutat. Res 375, 183-193.
Collins, A.R., Duthie, S.J., and Dobson, V.L. (1993). Direct enzymic detection of endogenous oxidative base damage in human lymphocyte DNA. Carcinogenesis 14, 1733-1735.
Collins, J.J., Swaen, G.M., Marsh, G.M., Utidjian, H.M., Caporossi, J.C., and Lucas, L.J. (1989). Mortality patterns among workers exposed to acrylamide. J. Occup. Med. 31, 614-617.
Coqueret, O. (2003). New roles for p21 and p27 cell-cycle inhibitors: a function for each cell compartment? Trends Cell Biol 13, 65-70.
Darzynkiewicz, Z., Bedner, E., and Smolewski, P. (2001). Flow cytometry in analysis of cell cycle and apoptosis. Semin. Hematol. 38, 179-193.

98
Effects of a food contaminant on cell cycle - Glycidamide induced S-phase arrest followed by apoptosis in a lymphoblastoid cell line. Master thesis by Elin Bakken Ansok 2009
Darzynkiewicz, Z., Bruno, S., Del, B.G., Gorczyca, W., Hotz, M.A., Lassota, P., and Traganos, F. (1992). Features of apoptotic cells measured by flow cytometry. Cytometry 13, 795-808.
Deng, C., Zhang, P., Harper, J.W., Elledge, S.J., and Leder, P. (1995). Mice lacking p21CIP1/WAF1 undergo normal development, but are defective in G1 checkpoint control. Cell 82, 675-684.
Deng, H., He, F., Zhang, S., Calleman, C.J., and Costa, L.G. (1993). Quantitative measurements of vibration threshold in healthy adults and acrylamide workers. Int. Arch. Occup. Environ. Health 65, 53-56.
Denicourt, C., and Dowdy, S.F. (2004). Cip/Kip proteins: more than just CDKs inhibitors. Genes Dev. 18, 851-855.
Dietrich, C., Wallenfang, K., Oesch, F., and Wieser, R. (1997). Translocation of cdk2 to the nucleus during G1-phase in PDGF-stimulated human fibroblasts. Exp Cell Res 232, 72-78.
Duez, P., Dehon, G., Kumps, A., and Dubois, J. (2003). Statistics of the Comet assay: a key to discriminate between genotoxic effects. Mutagenesis 18, 159-166.
Dulic, V., Kaufmann, W.K., Wilson, S.J., Tlsty, T.D., Lees, E., Harper, J.W., Elledge, S.J., and Reed, S.I. (1994). p53-dependent inhibition of cyclin-dependent kinase activities in human fibroblasts during radiation-induced G1 arrest. Cell 76, 1013-1023.
Engelward, B.P., Allan, J.M., Dreslin, A.J., Kelly, J.D., Wu, M.M., Gold, B., and Samson, L.D. (1998). A chemical and genetic approach together define the biological consequences of 3-methyladenine lesions in the mammalian genome. J Biol Chem. 273, 5412-5418.
Fennell, T.R., Sumner, S.C., Snyder, R.W., Burgess, J., Spicer, R., Bridson, W.E., and Friedman, M.A. (2005). Metabolism and hemoglobin adduct formation of acrylamide in humans. Toxicol. Sci. 85, 447-459.
Fousteri, M., and Mullenders, L.H. (2008). Transcription-coupled nucleotide excision repair in mammalian cells: molecular mechanisms and biological effects. Cell Res 18, 73-84.
Friedberg, E.C. (2001). How nucleotide excision repair protects against cancer. Nat. Rev. Cancer 1, 22-33.
Friedman, M.A., Dulak, L.H., and Stedham, M.A. (1995). A lifetime oncogenicity study in rats with acrylamide. Fundam. Appl. Toxicol. 27, 95-105.
99
Effects of a food contaminant on cell cycle - Glycidamide induced S-phase arrest followed by apoptosis in a lymphoblastoid cell line. Master thesis by Elin Bakken Ansok 2009
Frosina, G., Fortini, P., Rossi, O., Carrozzino, F., Raspaglio, G., Cox, L.S., Lane, D.P., Abbondandolo, A., and Dogliotti, E. (1996). Two pathways for base excision repair in mammalian cells. J Biol Chem. 271, 9573-9578.
Gamboa da Costa, G., Churchwell, M.I., Hamilton, L.P., Von Tungeln, L.S., Beland, F.A., Marques, M.M., and Doerge, D.R. (2003). DNA adduct formation from acrylamide via conversion to glycidamide in adult and neonatal mice. Chem. Res Toxicol. 16, 1328-1337.
Gartel, A.L., and Tyner, A.L. (2002). The role of the cyclin-dependent kinase inhibitor p21 in apoptosis. Mol. Cancer Ther. 1, 639-649.
Gassner, P., and Adler, I.D. (1996). Induction of hypoploidy and cell cycle delay by acrylamide in somatic and germinal cells of male mice. Mutat. Res 367, 195-202.
Gates, K.S., Nooner, T., and Dutta, S. (2004). Biologically relevant chemical reactions of N7-alkylguanine residues in DNA. Chem. Res Toxicol. 17, 839-856.
Ghanayem, B.I., McDaniel, L.P., Churchwell, M.I., Twaddle, N.C., Snyder, R., Fennell, T.R., and Doerge, D.R. (2005a). Role of CYP2E1 in the epoxidation of acrylamide to glycidamide and formation of DNA and hemoglobin adducts. Toxicol. Sci. 88, 311-318.
Ghanayem, B.I., Wang, H., and Sumner, S. (2000). Using cytochrome P-450 gene knock-out mice to study chemical metabolism, toxicity, and carcinogenicity. Toxicol. Pathol. 28, 839-850.
Ghanayem, B.I., Witt, K.L., Kissling, G.E., Tice, R.R., and Recio, L. (2005b). Absence of acrylamide-induced genotoxicity in CYP2E1-null mice: evidence consistent with a glycidamide-mediated effect. Mutat. Res 578, 284-297.
Gorczyca, W. (1999). Cytometric analyses to distinguish death processes. Endocr. Relat Cancer 6, 17-19.
Graves, R., Laval, J., and Pegg, A.E. (1992). Sequence specificity of DNA repair by Escherichia coli Fpg protein. Carcinogenesis 13, 1455-1459.
Guttinger, S., Laurell, E., and Kutay, U. (2009). Orchestrating nuclear envelope disassembly and reassembly during mitosis. Nat Rev. Mol. Cell Biol 10, 178-191.
Hansen, S.H. (01.08.2007 ). The Norwegian Institute of Public health.
Hansen, S.H. (01.05.2009). The Norwegian Institute of Public health.
He, F.S., Zhang, S.L., Wang, H.L., Li, G., Zhang, Z.M., Li, F.L., Dong, X.M., and Hu, F.R. (1989). Neurological and electroneuromyographic assessment of the

100
Effects of a food contaminant on cell cycle - Glycidamide induced S-phase arrest followed by apoptosis in a lymphoblastoid cell line. Master thesis by Elin Bakken Ansok 2009
adverse effects of acrylamide on occupationally exposed workers. Scand. J. Work Environ. Health 15, 125-129.
Hegde, M.L., Hazra, T.K., and Mitra, S. (2008). Early steps in the DNA base excision/single-strand interruption repair pathway in mammalian cells. Cell Res 18, 27-47.
Hoeijmakers, J.H. (2001). Genome maintenance mechanisms for preventing cancer. Nature 411, 366-374.
IARC. (1994). IARC working group on the evaluation of carcinogenic risks to humans: some industrial chemicals. Lyon, 15-22 February 1994. IARC Monogr Eval. Carcinog. Risks Hum. 60, 1-560.
Jeffrey, P.D., Tong, L., and Pavletich, N.P. (2000). Structural basis of inhibition of CDK-cyclin complexes by INK4 inhibitors. Genes Dev. 14, 3115-3125.
Jeggo, P.A., and Lobrich, M. (2006). Contribution of DNA repair and cell cycle checkpoint arrest to the maintenance of genomic stability. DNA Repair (Amst) 5, 1192-1198.
Jenkins, G.J., Doak, S.H., Johnson, G.E., Quick, E., Waters, E.M., and Parry, J.M. (2005). Do dose response thresholds exist for genotoxic alkylating agents? Mutagenesis 20, 389-398.
Jiang, L., Cao, J., An, Y., Geng, C., Qu, S., Jiang, L., and Zhong, L. (2007). Genotoxicity of acrylamide in human hepatoma G2 (HepG2) cells. Toxicol. In Vitro 21, 1486-1492.
Johansson, F., Lundell, T., Rydberg, P., Erixon, K., and Jenssen, D. (2005). Mutagenicity and DNA repair of glycidamide-induced adducts in mammalian cells. Mutat. Res 580, 81-89.
Johnson, K.A., Gorzinski, S.J., Bodner, K.M., Campbell, R.A., Wolf, C.H., Friedman, M.A., and Mast, R.W. (1986). Chronic toxicity and oncogenicity study on acrylamide incorporated in the drinking water of Fischer 344 rats. Toxicol. Appl. Pharmacol. 85, 154-168.
Knaap, A.G., Kramers, P.G., Voogd, C.E., Bergkamp, W.G., Groot, M.G., Langebroek, P.G., Mout, H.C., van der Stel, J.J., and Verharen, H.W. (1988). Mutagenic activity of acrylamide in eukaryotic systems but not in bacteria. Mutagenesis 3, 263-268.
Knight, J.S., and Robertson, E.S. (2004). Epstein-Barr virus nuclear antigen 3C regulates cyclin A/p27 complexes and enhances cyclin A-dependent kinase activity. J Virol. 78, 1981-1991.

101
Effects of a food contaminant on cell cycle - Glycidamide induced S-phase arrest followed by apoptosis in a lymphoblastoid cell line. Master thesis by Elin Bakken Ansok 2009
Knight, J.S., Sharma, N., and Robertson, E.S. (2005). SCFSkp2 complex targeted by Epstein-Barr virus essential nuclear antigen. Mol. Cell Biol 25, 1749-1763.
Koskinen, M., and Plna, K. (2000). Specific DNA adducts induced by some mono-substituted epoxides in vitro and in vivo. Chem. Biol Interact. 129, 209-229.
Koyama, N., Sakamoto, H., Sakuraba, M., Koizumi, T., Takashima, Y., Hayashi, M., Matsufuji, H., Yamagata, K., Masuda, S., Kinae, N., and Honma, M. (2006). Genotoxicity of acrylamide and glycidamide in human lymphoblastoid TK6 cells. Mutat. Res 603, 151-158.
Krishnamurthy, N., Haraguchi, K., Greenberg, M.M., and David, S.S. (2008). Efficient removal of formamidopyrimidines by 8-oxoguanine glycosylases. Biochemistry 47, 1043-1050.
Kroemer, G., Galluzzi, L., Vandenabeele, P., Abrams, J., Alnemri, E.S., Baehrecke, E.H., Blagosklonny, M.V., El-Deiry, W.S., Golstein, P., Green, D.R., Hengartner, M., Knight, R.A., Kumar, S., Lipton, S.A., Malorni, W., Nunez, G., Peter, M.E., Tschopp, J., Yuan, J., Piacentini, M., Zhivotovsky, B., and Melino, G. (2009). Classification of cell death: recommendations of the Nomenclature Committee on Cell Death 2009. Cell Death Differ. 16, 3-11.
Krokan, H.E., Standal, R., and Slupphaug, G. (1997). DNA glycosylases in the base excision repair of DNA. Biochem. J. 325 ( Pt 1), 1-16.
Kurebayashi, H., and Ohno, Y. (2006). Metabolism of acrylamide to glycidamide and their cytotoxicity in isolated rat hepatocytes: protective effects of GSH precursors. Arch. Toxicol. 80, 820-828.
Kurz, E.U., and Lees-Miller, S.P. (2004). DNA damage-induced activation of ATM and ATM-dependent signaling pathways. DNA Repair (Amst) 3, 889-900.
Kuzminov, A. (2001). Single-strand interruptions in replicating chromosomes cause double-strand breaks. Proc. Natl. Acad. Sci. U. S. A 98, 8241-8246.
Lavin, M.F., and Gueven, N. (2006). The complexity of p53 stabilization and activation. Cell Death. Differ. 13, 941-950.
Leibeling, D., Laspe, P., and Emmert, S. (2006). Nucleotide excision repair and cancer. J Mol. Histol. 37, 225-238.
Loeb, L.A., and Preston, B.D. (1986). Mutagenesis by apurinic/apyrimidinic sites. Annu. Rev. Genet. 20, 201-230.
LoPachin, R.M. (2004). The changing view of acrylamide neurotoxicity. Neurotoxicology 25, 617-630.

102
Effects of a food contaminant on cell cycle - Glycidamide induced S-phase arrest followed by apoptosis in a lymphoblastoid cell line. Master thesis by Elin Bakken Ansok 2009
Lovell, D.P., and Omori, T. (2008). Statistical issues in the use of the comet assay. Mutagenesis 23, 171-182.
Lukas, J., Lukas, C., and Bartek, J. (2004). Mammalian cell cycle checkpoints: signalling pathways and their organization in space and time. DNA Repair (Amst) 3, 997-1007.
Maddika, S., Ande, S.R., Panigrahi, S., Paranjothy, T., Weglarczyk, K., Zuse, A., Eshraghi, M., Manda, K.D., Wiechec, E., and Los, M. (2007). Cell survival, cell death and cell cycle pathways are interconnected: implications for cancer therapy. Drug Resist. Updat. 10, 13-29.
Maniere, I., Godard, T., Doerge, D.R., Churchwell, M.I., Guffroy, M., Laurentie, M., and Poul, J.M. (2005). DNA damage and DNA adduct formation in rat tissues following oral administration of acrylamide. Mutat. Res 580, 119-129.
Marsh, G.M., Lucas, L.J., Youk, A.O., and Schall, L.C. (1999). Mortality patterns among workers exposed to acrylamide: 1994 follow up. Occup. Environ. Med. 56, 181-190.
Martins, C., Oliveira, N.G., Pingarilho, M., Gamboa da, C.G., Martins, V., Marques, M.M., Beland, F.A., Churchwell, M.I., Doerge, D.R., Rueff, J., and Gaspar, J.F. (2007). Cytogenetic damage induced by acrylamide and glycidamide in mammalian cells: correlation with specific glycidamide-DNA adducts. Toxicol. Sci. 95, 383-390.
Matsumoto, Y., Kim, K., and Bogenhagen, D.F. (1994). Proliferating cell nuclear antigen-dependent abasic site repair in Xenopus laevis oocytes: an alternative pathway of base excision DNA repair. Mol. Cell Biol 14, 6187-6197.
Mei, N., Hu, J., Churchwell, M.I., Guo, L., Moore, M.M., Doerge, D.R., and Chen, T. (2008). Genotoxic effects of acrylamide and glycidamide in mouse lymphoma cells. Food Chem. Toxicol. 46, 628-636.
Mottram, D.S., Wedzicha, B.L., and Dodson, A.T. (2002). Acrylamide is formed in the Maillard reaction. Nature 419, 448-449.
Nunez, R. (2001). DNA measurement and cell cycle analysis by flow cytometry. Curr. Issues Mol. Biol 3, 67-70.
O'Connor, T.R., Boiteux, S., and Laval, J. (1988). Ring-opened 7-methylguanine residues in DNA are a block to in vitro DNA synthesis. Nucleic Acids Res 16, 5879-5894.
O'Nions, J., and Allday, M.J. (2003). Epstein-Barr virus can inhibit genotoxin-induced G1 arrest downstream of p53 by preventing the inactivation of CDK2. Oncogene 22, 7181-7191.

103
Effects of a food contaminant on cell cycle - Glycidamide induced S-phase arrest followed by apoptosis in a lymphoblastoid cell line. Master thesis by Elin Bakken Ansok 2009
Parker, G.A., Touitou, R., and Allday, M.J. (2000). Epstein-Barr virus EBNA3C can disrupt multiple cell cycle checkpoints and induce nuclear division divorced from cytokinesis. Oncogene 19, 700-709.
Petermann, E., Ziegler, M., and Oei, S.L. (2003). ATP-dependent selection between single nucleotide and long patch base excision repair. DNA Repair (Amst) 2, 1101-1114.
Puppel, N., Tjaden, Z., Fueller, F., and Marko, D. (2005). DNA strand breaking capacity of acrylamide and glycidamide in mammalian cells. Mutat. Res 580, 71-80.
Riccardi, C., and Nicoletti, I. (2006). Analysis of apoptosis by propidium iodide staining and flow cytometry. Nat Protoc. 1, 1458-1461.
Roos, W.P., and Kaina, B. (2006a). DNA damage-induced cell death by apoptosis. Trends Mol. Med 12, 440-450.
Roos, W.P., and Kaina, B. (2006b). DNA damage-induced cell death by apoptosis. Trends Mol. Med. 12, 440-450.
Sanchez-Beato, M., Saez, A.I., Martinez-Montero, J.C., Sol, M.M., Sanchez-Verde, L., Villuendas, R., Troncone, G., and Piris, M.A. (1997). Cyclin-dependent kinase inhibitor p27KIP1 in lymphoid tissue: p27KIP1 expression is inversely proportional to the proliferative index. Am. J Pathol. 151, 151-160.
Schwartz, G.K., and Shah, M.A. (2005). Targeting the cell cycle: a new approach to cancer therapy. J. Clin. Oncol. 23, 9408-9421.
Sedgwick, B. (1997). Nitrosated peptides and polyamines as endogenous mutagens in O6-alkylguanine-DNA alkyltransferase deficient cells. Carcinogenesis 18, 1561-1567.
Segerback, D., Calleman, C.J., Schroeder, J.L., Costa, L.G., and Faustman, E.M. (1995). Formation of N-7-(2-carbamoyl-2-hydroxyethyl)guanine in DNA of the mouse and the rat following intraperitoneal administration of [14C]acrylamide. Carcinogenesis 16, 1161-1165.
Settels, E., Bernauer, U., Palavinskas, R., Klaffke, H.S., Gundert-Remy, U., and Appel, K.E. (2008). Human CYP2E1 mediates the formation of glycidamide from acrylamide. Arch. Toxicol. 82, 717-727.
Shapiro, H.M. (2003). Practical Flow Cytometry ().
Shieh, S.Y., Ikeda, M., Taya, Y., and Prives, C. (1997). DNA damage-induced phosphorylation of p53 alleviates inhibition by MDM2. Cell 91, 325-334.

104
Effects of a food contaminant on cell cycle - Glycidamide induced S-phase arrest followed by apoptosis in a lymphoblastoid cell line. Master thesis by Elin Bakken Ansok 2009
Shimada, M., and Nakanishi, M. (2006). DNA damage checkpoints and cancer. J. Mol. Histol. 37, 253-260.
Shuck, S.C., Short, E.A., and Turchi, J.J. (2008). Eukaryotic nucleotide excision repair: from understanding mechanisms to influencing biology. Cell Res 18, 64-72.
Sickles, D.W., Brady, S.T., Testino, A., Friedman, M.A., and Wrenn, R.W. (1996). Direct effect of the neurotoxicant acrylamide on kinesin-based microtubule motility. J Neurosci. Res 46, 7-17.
Sickles, D.W., Sperry, A.O., Testino, A., and Friedman, M. (2007). Acrylamide effects on kinesin-related proteins of the mitotic/meiotic spindle. Toxicol. Appl. Pharmacol. 222, 111-121.
Singer, B. (1975). The chemical effects of nucleic acid alkylation and their relation to mutagenesis and carcinogenesis. Prog. Nucleic Acid Res Mol. Biol 15, 219-284.
Sipinen, V.E. (01.08.2007 ). The Norwegian Institute of Public health.
Smith, C.C., O'Donovan, M.R., and Martin, E.A. (2006). hOGG1 recognizes oxidative damage using the comet assay with greater specificity than FPG or ENDOIII. Mutagenesis 21, 185-190.
Smith, M.L., and Seo, Y.R. (2002). p53 regulation of DNA excision repair pathways. Mutagenesis 17, 149-156.
Smith, S.A., and Engelward, B.P. (2000). In vivo repair of methylation damage in Aag 3-methyladenine DNA glycosylase null mouse cells. Nucleic Acids Res. 28, 3294-3300.
Sobel, W., Bond, G.G., Parsons, T.W., and Brenner, F.E. (1986). Acrylamide cohort mortality study. Br. J Ind. Med 43, 785-788.
Sobol, R.W., Kartalou, M., Almeida, K.H., Joyce, D.F., Engelward, B.P., Horton, J.K., Prasad, R., Samson, L.D., and Wilson, S.H. (2003). Base excision repair intermediates induce p53-independent cytotoxic and genotoxic responses. J. Biol. Chem. 278, 39951-39959.
Solomon, J.J., Fedyk, J., Mukai, F., and Segal, A. (1985). Direct alkylation of 2'-deoxynucleosides and DNA following in vitro reaction with acrylamide. Cancer Res 45, 3465-3470.
Somasundaram, K., Zhang, H., Zeng, Y.X., Houvras, Y., Peng, Y., Zhang, H., Wu, G.S., Licht, J.D., Weber, B.L., and El-Deiry, W.S. (1997). Arrest of the cell cycle by the tumour-suppressor BRCA1 requires the CDK-inhibitor p21WAF1/CiP1. Nature 389, 187-190.
105
Effects of a food contaminant on cell cycle - Glycidamide induced S-phase arrest followed by apoptosis in a lymphoblastoid cell line. Master thesis by Elin Bakken Ansok 2009
Speit, G., Hanelt, S., Helbig, R., Seidel, A., and Hartmann, A. (1996). Detection of DNA effects in human cells with the comet assay and their relevance for mutagenesis. Toxicol. Lett. 88, 91-98.
Speit, G., Schutz, P., Bonzheim, I., Trenz, K., and Hoffmann, H. (2004). Sensitivity of the FPG protein towards alkylation damage in the comet assay. Toxicol. Lett. 146, 151-158.
Stadler, R.H., Blank, I., Varga, N., Robert, F., Hau, J., Guy, P.A., Robert, M.C., and Riediker, S. (2002). Acrylamide from Maillard reaction products. Nature 419, 449-450.
Strickland, P.T., and Groopman, J.D. (1995). Biomarkers for assessing environmental exposure to carcinogens in the diet. Am. J. Clin. Nutr. 61, 710S-720S.
Su, T.T. (2006). Cellular responses to DNA damage: one signal, multiple choices. Annu. Rev. Genet. 40, 187-208.
Subramanian, C., Knight, J.S., and Robertson, E.S. (2002). The Epstein Barr nuclear antigen EBNA3C regulates transcription, cell transformation and cell migration. Front Biosci. 7, d704-d716.
Sumner, S.C., MacNeela, J.P., and Fennell, T.R. (1992). Characterization and quantitation of urinary metabolites of [1,2,3-13C]acrylamide in rats and mice using 13C nuclear magnetic resonance spectroscopy. Chem. Res Toxicol. 5, 81-89.
Svensson, K., Abramsson, L., Becker, W., Glynn, A., Hellenas, K.E., Lind, Y., and Rosen, J. (2003). Dietary intake of acrylamide in Sweden. Food Chem. Toxicol. 41, 1581-1586.
Tareke, E., Rydberg, P., Karlsson, P., Eriksson, S., and Tornqvist, M. (2000). Acrylamide: a cooking carcinogen? Chem. Res Toxicol. 13, 517-522.
Tsuda, H., Shimizu, C.S., Taketomi, M.K., Hasegawa, M.M., Hamada, A., Kawata, K.M., and Inui, N. (1993). Acrylamide; induction of DNA damage, chromosomal aberrations and cell transformation without gene mutations. Mutagenesis 8, 23-29.
Tsuiki, H., Nitta, M., Tada, M., Inagaki, M., Ushio, Y., and Saya, H. (2001). Mechanism of hyperploid cell formation induced by microtubule inhibiting drug in glioma cell lines. Oncogene 20, 420-429.
Tudek, B. (2003). Imidazole ring-opened DNA purines and their biological significance. J Biochem. Mol. Biol 36, 12-19.
Vazquez, A., Bond, E.E., Levine, A.J., and Bond, G.L. (2008). The genetics of the p53 pathway, apoptosis and cancer therapy. Nat. Rev. Drug Discov. 7, 979-987.

106
Effects of a food contaminant on cell cycle - Glycidamide induced S-phase arrest followed by apoptosis in a lymphoblastoid cell line. Master thesis by Elin Bakken Ansok 2009
Vervoorts, J., and Luscher, B. (2008). Post-translational regulation of the tumor suppressor p27(KIP1). Cell Mol. Life Sci. 65, 3255-3264.
Vogel, C., Kienitz, A., Hofmann, I., Muller, R., and Bastians, H. (2004). Crosstalk of the mitotic spindle assembly checkpoint with p53 to prevent polyploidy. Oncogene 23, 6845-6853.
Wade, M., and Allday, M.J. (2000). Epstein-Barr virus suppresses a G(2)/M checkpoint activated by genotoxins. Mol. Cell Biol 20, 1344-1360.
Wyatt, M.D., and Pittman, D.L. (2006). Methylating agents and DNA repair responses: Methylated bases and sources of strand breaks. Chem. Res. Toxicol. 19, 1580-1594.
Yi, F., Saha, A., Murakami, M., Kumar, P., Knight, J.S., Cai, Q., Choudhuri, T., and Robertson, E.S. (2009). Epstein-Barr virus nuclear antigen 3C targets p53 and modulates its transcriptional and apoptotic activities. Virology 388, 236-247.
Yousef, M.I., and El-Demerdash, F.M. (2006). Acrylamide-induced oxidative stress and biochemical perturbations in rats. Toxicology 219, 133-141.
Zhang, H., Xiong, Y., and Beach, D. (1993). Proliferating cell nuclear antigen and p21 are components of multiple cell cycle kinase complexes. Mol. Biol Cell 4, 897-906.
Zhou, B.P., Liao, Y., Xia, W., Spohn, B., Lee, M.H., and Hung, M.C. (2001). Cytoplasmic localization of p21Cip1/WAF1 by Akt-induced phosphorylation in HER-2/neu-overexpressing cells. Nat Cell Biol 3, 245-252.
Zurer, I., Hofseth, L.J., Cohen, Y., Xu-Welliver, M., Hussain, S.P., Harris, C.C., and Rotter, V. (2004). The role of p53 in base excision repair following genotoxic stress. Carcinogenesis 25, 11-19.

107
Effects of a food contaminant on cell cycle - Glycidamide induced S-phase arrest followed by apoptosis in a lymphoblastoid cell line. Master thesis by Elin Bakken Ansok 2009
10. Appendix
Chemicals Producer
8-16% Precise Protein Gels (15-well) Thermo Fischer Scientific
β-Mercaptoethanol Sigma-Aldrich
Absolute alcohol prima Arcus Kjemi, Norway
Anti-mouse HRP-conjugate Jackson Laboratories
Anti-rabbit HRP-conjugate Jackson Laboratories
Bio-Rad CD Protein Assay Kit BioRad
BrdU Sigma-Aldrich
Bromophenol Blue Sigma-Aldrich
Bovine serum, albumin (BSA) Sigma, USA
Bio Whittaker® RPMI 1640 medium with and L-Gluthamine Lonza, Belgium
Bio-Rad DC (detergent compatible) protein assay Bio-Rad, USA
Complete Roche
Cyclin A (rabbit) BD Bioscience, USA
Developer (LX 24) Kodak
Dubeccos`s Phosphate Buffer solution (PBS) Locally produced
Dimetyhylsulfoxide (DMSO) Merck, Germany
EDTA Sigma-Aldrich
Ethanol (Absolute) Arcus Kjemi, Norway
Ethylenediaminetetraacetic acid disodium salt dihydrate (EDTA) Sigma, USA
Fetal calve serum (FCS) Gibco, NY, USA
Fpg crude enzyme extract Locally produced
FITC antibody BD Bioscience, USA
Fixer (AL 4) Kodak
GAPDH ab (mouse) Biogenesis
GelBond® Film Cambrex, USA
Glycerol Sigma-Aldrich , USA
Glycine Sigma-Aldrich , USA

108
Effects of a food contaminant on cell cycle - Glycidamide induced S-phase arrest followed by apoptosis in a lymphoblastoid cell line. Master thesis by Elin Bakken Ansok 2009
Hydrogen chloride (HCl) Merck, Germany
Hepes Sigma, USA
Hoechst 33342 Calbiochem
Lymphoprep Tube Axis-Shield, Norway
Medical X-ray film, Super RX FUJI
Methanol Merck
NuSieve GTG Low melting agarose Cambrex, USA
P21 (mouse) Santa Cruz, USA
P27 (mouse) Santa Cruz, USA
p-53 serin 15 (mouse) Cell Signalling, USA
p-53 (rabbit) Cell Signalling, USA
Potassium hydroxide (KOH) Merck, Germany
Potassium chloride (KCl) Merck, Germany
Penicillin/Streptomycin (P/S) Sigma, Norway
PBS Dulbecco
Pierce Supersignal West Dura Extended Duration substrate Thermo Fisher Scientific
Precision Plus ProteinTM Standards, Kaleidoscope BioRad
Protran BA 85 Nitrocellulose Whatman
S9-mix In Vitro Technologies
Sodium chloride (NaCl) Merck, Germany
Sodium Hydroxide (NaOH) Merck, Germany
Sodium lauryl sarcocinate Sigma, UK
SYBR Gold Invitrogen, USA
Starting block™ blocking buffer Thermo Fisher Scientifc
Trizma® base (Tris (hydroxymethyl)-aminomethane, Tris-base) Sigma, USA
Triton-X Sigma, USA
Thimerosal Sigma, USA
Trypan Blue Stain Cambrex, USA
Tween 20 BioRad, USA
XPC (mouse) Pharmingen
XPA (rabbit) Santa Cruz, USA

109
Effects of a food contaminant on cell cycle - Glycidamide induced S-phase arrest followed by apoptosis in a lymphoblastoid cell line. Master thesis by Elin Bakken Ansok 2009
10.1 Solutions and media
Medium:
RPMI 1640 added 10% FCS and 1% P/S
Lysis stock solution: 2,5 M NaCl, 100 mM EDTA, 10mM Trizma base, 12g/l NaOH. Adjust pH to 10. Add 1% Sodium lauryl sarcocinate.
Lysis solution: Dilute stock solution 10 times, add 10% DMSO and 1% Triton-X
Fpg-enzyme reaction buffer: 40mM Hepes, 0,1 M KCl, 0,5mM EDTA. pH adjusted to 7,6.
Unwinding and electrophoresis stock solution: 10N NaOH, 200mM EDTA
Unwinding and electrophoresis buffer: Dilute electrophoresis stock solution 10 times, adjust pH to 13,2
Neutralization solution: 0,4 M Trizma base, pH adjusted to 7,5.
TE-buffer: 1mM EDTA, 10mM Tris HCl, pH adjusted to 8,0.
1X Loading buffer (for preparation of protein extract):
SDS-buffer:
60 mM Tris-HCL (50 ml 0.5 M Tris-HCL pH 6.8)
10 % glycerol (40 ml 100 % glycerol)
2 % SDS (80 ml 10 % SDS)
1 mM EDTA (4 ml 0.1 M EDTA)
pH is adjusted to 6.8 with NaOH and dH2O is added up to 400ml.

110
Effects of a food contaminant on cell cycle - Glycidamide induced S-phase arrest followed by apoptosis in a lymphoblastoid cell line. Master thesis by Elin Bakken Ansok 2009
2 ml of loading buffer were made using:
SDS-buffer: 1.79 ml
Protease inhibitor, Complete (25X): 80 µl
Phosphatase inhibitors: Sodium fluoride (NaF) (50 mM stock): 100 µl
Β-glycerolphosphate (Stock 100X): 20 µl Na3VO4 (stock 200mM): 10 µl
10X Running buffer
2000 ml:
60g TRIS Base (Tris-hydroxsymethyl-aminomethane)
88g Glycine
20g SDS (Sodium Dodecyl Sulphate)
Distilled water up to 2000 ml
1X Running buffer
1000 ml:
100 ml of 10X Electrophoresis buffer
900 ml distilled water
10X Transfer buffer
2000 ml:
TRIS base 60 g
288 g Glycine
Distilled water up to 2000 ml
1X Transfer buffer
1000 ml:
100 ml of 10X Transfer buffer
700 ml distilled water 200 ml methanol
The methanol was added just before use to avoid evaporation.
10X TBS-T (Tris buffer with Tween 20) – wash buffer:
5000 ml:
10 mM Trizma base (60,5g)
137 mM NaCl (400g)
0.1%Tween 20 (50ml)
350 ml of 1M HCl

111
Effects of a food contaminant on cell cycle - Glycidamide induced S-phase arrest followed by apoptosis in a lymphoblastoid cell line. Master thesis by Elin Bakken Ansok 2009
Distilled water was added up to 5000 ml and pH adjusted to 7.6.
The solution was then diluted 1:10 before use.
10X TBS (Tris buffer):
5000 ml:
10 mM Trizma base (60,5g)
137 mM NaCl (400g)
350 ml of 1M HCl
Distilled water was added up to 5000 ml and pH adjusted to 7.6.
The solution was then diluted 1 : 10 before use.
IFA buffer:
10 mM HEPES [pH 7.4]
25 mM NaCl
4% fetal calf serum