effects of a combined supercritical …
TRANSCRIPT

EFFECTS OF A COMBINED SUPERCRITICAL
EXTRACTION/THERMAL CYCLE ON BINDER REMOVAL
CYCLE TIME, YIELD, RESIDUAL CARBON, AND DEFECT
FORMATION IN MULTILAYER CERAMIC CAPACITORS
_______________________________________
A Thesis
Presented to
The Faculty of the Graduate School
at the University of Missouri-Columbia
_______________________________________________________
In Partial Fulfillment
of the Requirements for the Degree
Master of Science
_____________________________________________________
by
Brandon D. Abeln
Dr. Stephen J. Lombardo, Thesis Supervisor
December 2010
The undersigned, appointed by the Dean of the Graduate School, have examined the thesis
entitled
EFFECTS OF A COMBINED SUPERCRITICAL EXTRACTION/THERMAL CYCLE
ON BINDER REMOVAL CYCLE TIME, YIELD, RESIDUAL CARBON, AND DEFECT
FORMATION IN MULTILAYER CERAMIC CAPACITORS
Presented by
Brandon D. Abeln
A candidate for the degree of
Master of Science
And hereby certify that in their opinion, it is worthy of acceptance.
Dr. Stephen J. Lombardo ____________________________________________
Dr. William Jacoby ____________________________________________
Dr. Qingsong Yu ____________________________________________

ii
ACKNOWLEDGEMENTS
I would like to take this opportunity to first thank my advisor Dr. Stephen J.
Lombardo for his support and guidance through my graduate studies at the University of
Missouri. His high level of expectations has greatly strengthened my technical writing
and communication abilities beyond my expectations. Furthermore, he has shown me the
benefits of thinking logically and thoroughly through every aspect of a process before
starting. I would also like to thank him for the enormous patience he has shown me
throughout the course of my graduate studies.
I would like to sincerely thank Dr. Qingsong Yu and Dr. William Jacoby for
kindly joining my thesis committee and offering valuable reviews on both my written and
oral presentations.
I would like to thank all my colleagues who helped me throughout my graduate
studies. First, I would like to thank Matt Schurwanz for all his kindness in showing me
around the lab. Next, I would like to thank Rajiv Sachanandani, Kumar Krishnamurthy,
and Simit Patel for their continuous help and support. Finally, I would like to give a
special thanks to my family whose constant support and encouragement helped me
successfully complete my graduate studies.

iii
TABLE OF CONTENTS
AKNOWLEDGEMENTS………………………………………………………………...ii
LIST OF TABLES…………………………………………………………………..…....vi
LIST OF FIGURES……………………………………………………………………...vii
ABSTRACT……………………………………………………………………………....xi
CHAPTERS
1. GENERAL INTRODUCTION…………………….……………………………….1
1.0 INTRODUCTION……………………………...……………………………..2
1.1 REFERENCES………………………………………………………………..8
2. GENERAL EXPERIMENTAL……..………………………………..…………...14
2.0 FABRICATION OF GREEN TAPES……………..………………………...15
2.1 SCREEN PRINTIG OF ELECTRODES….……..…………………………..16
2.2 LAMINATION OF TAPES………...……..…………………………………18
2.3 CUTTING AND PHOTOGRAPHING MULTILAYER CERAMIC CAPACITORS…………………………………………………………………...23
2.4 GAS PERMEABILITY MEASUREMENTS……………………...………..25
2.5 POROSITY MEASUREMENTS……………………………………………29
2.6 ADHESION STRENGTH MEASUREMENTS…………………………….30
2.7 RESIDUAL CARBON MEASUREMENTS………….…………………….32
2.8 SUPERCRITICAL EXTRACTION EXPERIMENTS……………………...34
2.9 REFERENCES……………………………………………..………………..41

iv
3. EFFECTS OF A COMBINED SUPERCRITICAL EXTRACTION/THERMAL
CYCLE ON BINDER REMOVAL CYCLE TIME AND YIELD IN MULTILAYER
CERAMIC CAPACITORS………………………………...………………..............42
3.0 INTRODUCTION…………………………………………………………...43
3.1 EXPERIMENTAL…………………………………………………………...45
3.2 RESULTS AND DISCUSSION……………………………………………..48
3.3 CONCLUSIONS…………………………………………………………….55
3.4 REFERENCES………………………………………………………………56
4. EFFECTS OF A COMBINED SUPERCRITICAL EXTRACTION/THERMAL
CYCLE ON RESIDUAL CARBON IN MULTILAYER CERAMIC
CAPACITORS…………………………………………………………………….....60
4.0 INTRODUCTION…………………………………………………………...61
4.1 EXPERIMENTAL…………………………………………………………...63
4.2 RESULTS AND DISCUSSION……………………………………………..66
4.3 CONCLUSIONS…………………………………………………………….71
4.4 REFERENCES………………………………………………………………72
5. EFFECTS OF A COMBINED SUPERCRITICAL EXTRACTION AND
THERMAL DECOMPOSITION OF BINDER ON DEFECT FORMATION IN
GREEN CERAMIC BODIES……………………………………………………….75
5.0 INTRODUCTION…………………………………………………………...76
5.1 EXPERIMENTAL…………………………………………………………...78
5.2 RESULTS AND DISCUSSION……………………………………………..81
5.3 CONCLUSIONS…………………………………………………………….90
5.4 REFERENCES………………………………………………………………91
v
6. CONCLUSIONS AND FUTURE WORK………………………………………..94
6.0 CONCLUSIONS…………………………………………………………….95
6.1 FUTURE WORK…………………………………………………………….97

vi
LIST OF TABLES
TABLE
2.1 Parameters used to heat a 500 ml vessel in air to various set-point temperatures (Tset)…………………………………………………….…………….………….38
2.2 Parameters used to thermally pressurize a 500 ml vessel to 30 MPa with carbon dioxide at various set-point temperatures (Tset)…………………………...……..39 3.1 Summary of defect formation in MLCs after exposure to a thermal cycle (TC) alone or a combined supercritical extraction cycle/thermal cycle (SCE/TC) versus lamination temperature and heating rate of the TC……………...……….52 3.2 Porosity, permeability, adhesion strength, and weight loss for ceramic tapes as 4- layer substrates after lamination, after SCE, and after a combined SCE/TC…....53 4.1 Average percent weight loss for PVB-based and acrylic-based MLCs after
exposure to different supercritical extraction and/or thermal cycles. The maximum operating temperature during the TC for the PVB-based and acrylic- based MLCs was 270 °C and 800 °C, respectively…..……………………..…....67
5.1 Details of the four cycles evaluated……………………………………………...80 5.2 Effect of depressurization time on the formation of defects……………………..85 5.3 Summary of extraction results from acrylic-based MLC samples at various operating conditions……………………………………………………………...88 5.4 Weight loss as a function of the size of acrylic-based MLCs after being subjected to supercritical CO2 at conditions of 90 °C and 30 MPa for 1 h followed by a 7.5 h depressurization…………………………………………………………….…….89

vii
LIST OF FIGURES
FIGURE 1.1 Image of a multilayer ceramic capacitor containing ceramic dielectric and
Pt/Pd/Au metal electrodes………………………………………………………....2 1.2 Steps involved in the processing of multilayer ceramic capacitors. Both a thermal
cycle alone and a combined supercritical extraction/thermal cycle are outlined for the binder removal step……………………………………………………………3
2.1 Schematic of a ceramic tape cast………………………………………………...15 2.2 Image of a screen printer…………………………………………………………17
2.3 Image of (a) a screen printing apparatus and (b) a ceramic tape containing nickel
metal electrodes……..…………………………………………………………...17 2.4 Image of a 25 ton Carver press…………………………………………………..18 2.5 Image of the digital temperature controllers on a 25 ton Carver press…………..19 2.6 Image of a stack of layered ceramic tapes prior to lamination…………………..20 2.7 Schematic representing the possible flow of a MLC during lamination………...21 2.8 Schematic of how two green ceramic substrates are laminated together to form a
T-shaped peel sample where the filled-in arrows indicate the direction of the applied load…………...………………………………………………………….22
2.9 Schematic for cutting Multilayer Ceramic Capacitors (MLCs)………………….24 2.10 Image of a drop pin gauge. The crosses on the sample represent the location of
each measurement………………………………………………………………..25 2.11 Image which outlines the flow of N2 through various components within the
permeability apparatus………...…………………………………………………26

viii
2.12 Image of a 50 ml flow meter used to measure the volumetric flow rate of flowing nitrogen…………………………………………………………………………..28
2.13 Schematic of a peel sample placed into the grips of a tensile tester which pulled
the sample apart as the top crosshead moved vertically away from the base……31 2.14 Image of a residual carbon analyzer and other components required for measuring
the residual carbon content of MLCs………………..…………………………...33 2.15 Image of the supercritical extraction vessel lid…………………………………..34 2.16 Schematic of a MLC loaded into a vessel………………………………………..35 2.17 Schematic of a MLC loaded into a vessel containing 400 ml of hexane……...…36 2.18 Image of the split compression ring used to attach the vessel lid to the vessel….37 2.19 Flow diagram of the supercritical extraction apparatus………………………….38 3.1 The supercritical extraction cycle and the thermal cycle used for determining
yield and cycle time of MLCs. For comparison, part of a typical cycle from industry is also shown……………...…………………………………………….47
3.2 Side and top images of MLCs laminated at 85 °C, 5 MPa for 10 minutes. a)
Sample after a TC conducted with a 7.5 K minute-1 ramp to 600 °C with a 1 h hold. b) Sample after a combined SCE/TC after exposure first to supercritical CO2 at 90 °C, 29 MPa for 1 h followed by a 6 h depressurization. The MLC was then exposed to a thermal cycle identical to (a)…………………….……………48
3.3 Side and top images of MLCs laminated at 85 °C, 5 MPa for 10 minutes. a)
Sample after a TC conducted with a 10 K minute-1 ramp to 600 °C with a 1 h hold. b) Sample after a combined SCE/TC after exposure first to supercritical CO2 at 90 °C, 29 MPa for 1 h followed by a 6 h depressurization. The MLC was then exposed to a thermal cycle identical to (a). The arrows indicate delamination.....49

ix
3.4 Side and top mages of MLCs laminated at 95 °C, 5 MPa for 10 minutes. a) Sample after a TC with a 7.5 K minute-1 ramp to 600 °C with a 1 h hold. b) Sample after a combined SCE/TC after exposure first to supercritical CO2 at 90 °C, 29 MPa for 1 h followed by a 6 h depressurization. The MLC was then exposed to a thermal cycle identical to (a)……………………………………….50
3.5 Side and top images of MLCs laminated at 95 °C, 5 MPa for 10 minutes. a)
Sample after a TC with a 10 K minute-1 ramp to 600 °C with a 1 h hold. b) Sample after a combined SCE/TC after exposure first to supercritical CO2 at 90 °C, 29 MPa for 1 h followed by a 6 h depressurization. The MLC was then exposed to a thermal cycle identical to (a)……………………………………….51
4.1 The extraction cycle with supercritical carbon dioxide, and the thermal cycles
used for determining residual carbon content of MLCs…………..……………..64 4.2 Percent residual carbon with 90% confidence intervals for MLC samples with and
without nickel electrodes subjected to SCECO2/TC (SCE/TC); SCECO2/SCEC6H14
/TC (SCE/SCE/TC); and TC (TC) alone. Each subscript denotes the type of supercritical fluid used……………………………….……….……...68
4.3 Percent residual carbon with 90% confidence intervals for an acrylic-based MLC
containing Pt/Pd/Au electrodes subjected to SCECO2/TC (SCE/TC) and TC (TC) alone. The subscript denotes the type of supercritical fluid used.…………..…..70
5.1 Schematic for cutting acrylic-based multilayer ceramic capacitors…………...…78 5.2 Weight loss of PPC-based tapes subjected to different operating conditions. The
asterisk (*) denotes that the sample exhibited defects………………...……….....82 5.3 Weight loss of PVB-based tapes subjected to different operating conditions…...83 5.4 Weight loss comparison for acrylic-based tapes subjected different operating
conditions. The asterisk (*) denotes that the sample exhibited defects.………….84 5.5 a) Image of an acrylic-based sample (2.2×2.0×1.0 cm) after depressurization over
19 h after SCE in CO2 at 30 MPa at 90°C for 1 h [which resulted in defects]. b) Image of a PVB-based sample (2.1×1.5×0.17 cm) after depressurization over 6 h after SCE in CO2 at 40 MPa at 90°C for 1 h [which exhibited no defects] [15]...87

x
5.6 Images of two different sized acrylic-based MLC samples before and after
subjection to supercritical carbon dioxide at 90 °C and 30 MPa for 1 hour. The dimensions of each sample were (a) 2.2×2.0×0.24 cm and (b) 1.12×0.97×0.096 cm…………………………………………………………......89

xi
EFFECTS OF A COMBINED SUPERCRITICAL
EXTRACTION/THERMAL CYCLE ON BINDER REMOVAL
CYCLE TIME, YIELD, RESIDUAL CARBON, AND DEFECT
FORMATION IN MULTILAYER CERAMIC CAPACITORS
Brandon D. Abeln
Dr. Stephen J. Lombardo Thesis Supervisor
ABSTRACT
In the fabrication of multi-layer ceramic capacitors (MLCs), organic blends of
binder and plasticizer are often utilized to aid in the forming and handling of ceramic
green bodies. However, these organic constituents must be removed before the green
body may be sintered into a dense component. Typically the binder is thermally
decomposed in air, but as the size and binder loading of the MLC increases, the time
required for binder removal may last up to several days in order to avoid introducing
defects into the green body. Furthermore, thermal decomposition may leave a carbon
residue within the dielectric which can modify the electrical properties and sintering
behavior of the MLC.
In this work, a combined cycle consisting of a supercritical extraction cycle (SCE)
followed by a thermal cycle (TC), was used to remove binder from green multilayer
ceramic capacitors. The dielectric was barium titanate and the binder consisted of
poly(vinyl butyral) plasticized with phthalates. Supercritical extraction of approximately

xii
one-third of the binder leads to an increase in the porosity and gas permeability of
samples and to a decrease in the adhesion strength between layers. The partial removal
of the binder also resulted in a decrease in cycle time and defects following the combined
SCE/TC. Samples subjected to the combined SCE/TC also had 25-30% less residual
carbon as compared to samples subjected to a thermal cycle alone.
Supercritical extraction of binder in carbon dioxide has been shown to
successfully remove large amounts of low molecular weight (MW) organic species but
becomes less effective as the molecular weight of the organic components increases. A
potential strategy to enhance the removal of the high MW components is to partially
decompose the species during the extraction process. This work also presents the binder
removal efficiencies from tape cast films fabricated with titanate-based dielectrics. The
organic systems evaluated are plasticized acrylic, poly(propylene carbonate), and
poly(vinyl butyral) binders. The effect of temperature on binder removal and defect
formation is assessed.

1
CHAPTER 1
GENERAL INTRODUCTION

2
1.0 INTRODUCTION
Multilayer ceramic capacitors (MLCs) are widely manufactured for use in a
number of electronic devices such as TVs, cellular phones, and personal computers [1-3].
MLCs are extensively used in electronic circuitry because of their low cost and high
volumetric efficiency (capacitance per unit volume) [1,4-6]. From 2009 to 2011, the
number of MLCs manufactured is expected to increase from 1.5 trillion to over 2 trillion
[1]. Figure 1.1 is an image of a typical multilayer ceramic capacitor manufactured in
industry with ceramic dielectric and Pt/Pd/Au metal electrodes.
Figure 1.1: Image of a multilayer ceramic capacitor containing ceramic dielectric and
Pt/Pd/Au metal electrodes.
The manufacture of noble-metal and base-metal multilayer ceramic capacitors is
usually comprised of the steps outlined in Fig. 1.2. First, organic additives such as
binder, plasticizer, and dispersant are milled together with an appropriate proportion of
solvent and dielectric powder to aid in the subsequent processing steps. The type and
quantity of binder used has an influence on the specific properties of the final MLC such
Pt/Pd/Au Electrodes
2.0 cm
Ceramic Dielectric

3
as the green strength, the adhesion strength between layers, and the permeability to gas
flow. After milling, the slurry is tape cast into a thin film, which forms into a green
ceramic tape upon drying. The term “green” refers to the samples at any point prior to
the sintering step. Once the ceramic tape is dried, cut into individual pieces, and screen
printed with metal electrodes, the individual pieces are stacked and laminated into MLCs.
The conditions of the lamination process via the lamination time, temperature, and
pressure can also affect the aforementioned properties of the MLCs [7-9]. Following
lamination, the organic fraction must ultimately be removed in the binder removal
process before the ceramic green body can be sintered into a dense component [10,11].
In this work, the specific characterization techniques and machinery used to fabricate,
analyze, and process ceramic green bodies are further described in Chapter 2.
Figure 1.2: Steps involved in the processing of multilayer ceramic capacitors. Both a
thermal cycle alone and a combined supercritical extraction/thermal cycle are outlined for
the binder removal step.
Cast Tapes Screen-Print Electrodes Laminate
Binder RemovalSupercritical Extraction
SinteringPackaging
Mill•Dielectric
Powder•Solvent•Binder•Plasticizer•Dispersant
Thermal Cycle

4
For the binder removal step, the organic fraction is traditionally eliminated in
furnacing operations in which the organic constituents of the binder are either vaporized,
oxidized, or pyrolyzed into gas phase species. The evolution of these species into the
pore space of the green body thus leads to an increase in pressure, which in turn causes
stress [12-14] within the component that ultimately may lead to defects such as fracture
or delamination [15-20]. To avoid failure of green components during binder removal
—and thus increase yield—several strategies are available. Most often, once a binder
system has been developed, heating schedules are specified in which multiple ramp rates,
hold temperatures, and hold times are selected so that the rate of binder decomposition is
sufficiently retarded in order to minimize the pressure and hence stress within the green
body. The heating schedules become longer and more complex as the permeability of the
green body decreases, which occurs when (a) the size of the capacitor increases, (b) the
binder loading within the green body increases, or (c) the particle size of the dielectric
powder decreases. Thus, in practice, specification of an ideal heating schedule becomes a
compromise between achieving a short cycle time and a high product yield.
To avoid the aforementioned drawbacks associated with the thermal removal of
binder, supercritical extraction (SCE) has been proposed and demonstrated as an
alternative processing route [21-31]. Under supercritical conditions, organic species
dissolve into the supercritical fluid and then diffuse out of the green body, thus effecting
binder removal without additionally increasing the pressure in the pore space. It is well
known that supercritical carbon dioxide is most effective in removing organic species of
lower molecular weight such as short chain waxes [17-19] or plasticizers [25-28,30,31].

5
Higher molecular weight organic species such as polystyrene (MW = 150,000) have been
known to dissolve in supercritical hexane [32]; however by operating at the critical
temperature of hexane (234.5 °C) the rate at which binder inside the MLC is decomposed
will be so rapid, that damage will probably occur [25]. For the case of MLCs, the
preferential extraction of plasticizers may lead to 40-60% removal of the organic fraction
[25,26], depending on the components in the binder blend, and substantial partial
extraction of binder can lead to increases in both the porosity and gas permeability of the
green body. Even though SCE may not be capable of fully removing all of the organic
constituents, a subsequent thermal cycle (TC) may be used to remove any remaining
organic species. This thermal cycle may be realized as a separate furnace operation or as
part of the sintering cycle, and may be conducted under oxidizing, reducing, or inert
conditions.
In summary, although supercritical extraction can remove binder, either partially
or nearly completely from green bodies, its efficacy as an alternative processing strategy
in terms of benefits to cycle time and yield—the same issues which pertain to thermal
debinding—have not been specifically addressed in the literature. It is thus one aim of
Chapter 3 to demonstrate that a combined supercritical extraction/thermal cycle
(SCE/TC) can be used to decrease overall processing time while avoiding defects but still
maintaining high yield. This combined cycle may be rapid because supercritical
extractions times can be short, often on the order of hours, and the aforementioned
increases in porosity and gas permeability of the green body may consequently facilitate
a subsequent rapid thermal cycle. In addition to this objective, we have also observed in

6
earlier work that changing the conditions of an upstream process step in the manufacture
of MLCs, namely in the lamination conditions, can also influence the yield during binder
removal [9], and thus we report and discuss on this aspect of processing for the combined
SCE/TC as well.
In Chapter 4, we note that another shortcoming of thermal debinding is that
carbonaceous residues may remain in the green body and these may either inhibit
sintering or degrade the electrical properties of the final components. The role of carbon
contamination on device performance is especially important in the processing of MLCs
with base metal electrodes in which non-oxidative conditions during binder removal are
typically used at temperatures above 270 °C in order to avoid oxidation of the base-metal
electrode material [33-37]. We therefore additionally demonstrate that a combined
SCE/TC can also impact the residual carbon present in base-metal MLCs, which is a
current processing trend for MLCs.
Although supercritical extraction has been shown to effectively remove 40-
60 wt% of the organic fraction [25,26], defects such as cracks and delamination have
been occasionally observed in MLCs [38]. Such defects were observed predominantly in
MLCs that exhibited little loss of binder during the extraction cycle, and therefore had
low permeability to gas flow. It was then postulated that failure occurred during
depressurization due to pressure gradients that arise because of the low gas permeability.
A mathematical model consequently was developed to quantify the magnitude of the
pressure gradients [38]. The occurrence of defects in samples exhibiting low weight loss
suggested the exploration of more aggressive extraction conditions by operating at higher

7
temperatures. Under these circumstances, binder degradation may also be contributing to
the observed weight loss, and possibly to the occurrence of defect formation in the
samples as well.
In Chapter 5, the origin of defect formation in green ceramic bodies is thus
examined for samples fabricated with three binder systems: poly(propylene carbonate)-
based, acrylic-based, and poly(vinyl butyral)-based. Three potential mechanisms for
defect formation are additionally considered: failure during depressurization, failure from
enhanced binder degradation due to the presence of residual air in the vessel, and failure
due to mechanical vibrations from gas compression when going to high pressure.
Experiments were conducted on both individual tapes and MLCs.
Finally in Chapter 6, we summarize the effects of operating with a combined
supercritical extraction and thermal cycle on cycle time, yield, carbon content, and defect
formation in multilayer ceramic capacitors. The chapter then addresses potential areas
for further investigation to improve the manufacture and yield of MLCs.

8
1.1 REFERENCES
1. M.-J. Pan, C. A. Randall, “A Brief Introduction to Ceramic Capacitors,” IEEE
Electrical Insulation Mag., 26 [3] 44-50 (2010).
2. H. Kishi, Y. Mizuno, and H. Chazono, “Base-Metal Electrode-Multilayer
Ceramic Capacitors: Past, Present and Future Perspectives,” Jpn. J. Appl. Phys.,
42, 1-15 (2003).
3. C. C. Lin, W. C. J. Wei, C. Y. Su, C. H. Hsueh, “Oxidation of Ni electrode in
BaTiO3 based multilayer ceramic capacitors (MLCC),” J. of Alloys and Comp.,
485 653-659 (2009).
4. K. Handa, T. Wantanabe, Y. Yamashita, M. Harata, “High Volume Efficiency
Multilayer Ceramic Capacitor,” IEEE Trans. On Consumer Elect., CE-30 [3]
342-347 (1984).
5. A. Lagrange, “Conception of Electronic Ceramics in Relation to their Functional
Reliability: Applications to Multilayer Ceramic Capacitors and Semiconductor
Ceramics,” Mat. Sci. and Eng., A109 113-119 (1989).
6. H. Takamizawa, K. Utsumi, M. Yonezawa, T. Ohno, “Large Capacitance
Multilayer Ceramic Capacitor,” IEEE Trans. On Comp., Hybirds, and Manuf.
Tech., CHMT-4 [4] (1981).
7. R. A. Gardner and R. W. Nufer, “Properties of Multilayer Ceramic Green Sheets,”
Solid State Technol., 17 [5] 38-43 (1974).

9
8. J. W. Yun, P. J. Scheuer, D. S. Krueger, and S. J. Lombardo, “Effect of
Lamination Conditions on Gas Permeability and Adhesion Strength of Green
Ceramic Tapes,” Adv. in Applied Ceram., 107 [4] 190-198 (2008).
9. J. W. Yun, P. Scheuer, D. Krueger, and S. J. Lombardo, “Effect of Lamination
Conditions for Green Ceramic Tapes on Adhesion Strength, Gas Permeability,
and Yield During Binder Removal,” Adv. in Applied Ceram., 108 [8] 488-493
(2009).
10. R. M. German, “Theory of Thermal Debinding,” Int. J. Powder Metall., 23 [4]
237-245 (1987).
11. J. A. Lewis, “Binder Removal from Ceramics,” Annual Rev. Mater. Sci., 27, 147-
173 (1997).
12. G. C. Stangle and I. A. Aksay, “Simultaneous Momentum, Heat and Mass
Transfer With Chemical Reaction in a Disordered Porous Medium: Application to
Binder removal from a Ceramic Green Body,” Chem. Eng. Sci., 45 [7] 1719-1731
(1990).
13. D.-S. Tsai, “Pressure Buildup and Internal Stresses During Binder Burnout:
Numberical Analysis,” AIChE J., 37 [4] 547-554 (1991).
14. Z. C. Feng, B. He, and S. J. Lombardo, “Stress Distribution in Porous Ceramic
Bodies Druing Binder Burnout,” J. Appl. Mech., 69 [4] 497-501 (2002).
15. J. G. Zhang, M. J. Edirisinghe, and J. R. G. Evans, “A Catalogue of Ceramic
Injection Molding Defects and Their Causes,” Ind. Ceram. 9, 72-82 (1989).

10
16. J. Woodthorpe, M. J. Edirisinghe, and J. R. G. Evans, “Properties of Ceramic
Injection Moulding Formulations: Part III. Polymer Removal,” J. Mater. Sci. 24,
1038-1048 (1989).
17. J. R. G. Evans and M. J. Edirisinghe, “Interfacial Factors Affecting the Incidence
of Defects in Ceramic Mouldings,” J. Mater. Sci. 26, 2081-2088 (1991).
18. S. A. Matar, M. J. Edirisinghe, J. R. G. Evans, E. H. Twizell, and J. H. Song,
“Modeling the Removal of Organic Vehicle from Ceramic or Metal Moldings:
The Effect of Gas Permeation on the Incidence of Defects,” J. Mater. Sci., 30,
3805-3810 (1995).
19. P. S. Allan, M. J. Bevis, M. J. Edirisinghe, J. R. G. Evans, and P. R. Hornsby,
“Avoidance of Defects in Injection Moulded Technical Ceramics,” J. Mater. Sci.
Letters, 6 165-166 (1987).
20. J. W. Yun, D. S. Krueger, P. Scheuer, and S. J. Lombardo, “Effect of
Decomposition Kinetics and Failure Criteria on Binder Removal cycles from
Three-Dimensional Porous Green Bodies,” J. Am. Ceram. Soc., 89 [1] 176-183
(2006).
21. D. W. Matson and R. D. Smith, “Supercritical Fluid Technologies for Ceramic-
Processing Applications,” J. Am. Ceram. Soc., 72 [6] 871-881 (1989).
22. T. Chartier, M. Ferrato, J. F. Baumard, “Supercritical Debinding of Injection
Molded Ceramics,” J. Am. Ceram. Soc., 78 [7] 1787-1792 (1995).

11
23. T. Chartier, E. Delhomme, J. F. Baumard, “Mechanisms of Binder Removal
Involved in Supercritical Debinding of Injection Moulded Ceramics,” J. Phys. III,
7 [2] 291-302 (1997).
24. T. Chartier, E. Delhomme, J. F. Baumard, “Solubility, in Supercritical Carbon
Dioxide, of Paraffin Waxes Used as Binders for Low-Pressure Injection
Molding,” Ind. Eng. Chem. Res., 38 [5] 1904-1910 (1999).
25. R. V. Shende, D. S. Krueger, S. J. Lombardo, “Supercritical Extraction of Binder
Containing Poly(vinyl butyral) and Dioctyl phthalate from Barium Titanate-
Platinum Multilayer Ceramic Capactiors,” J. Mater. Sci.: Mater. Electron., 12,
637-643 (2001).
26. R. V. Shende, S. J. Lombardo, “Supercritical Extraction with Carbon Dioxide and
Ethylene of Poly(vinyl butyral) and Dioctyl phthalate from Multilayer Ceramic
Capacitors,” J. Supercrit. Fluids, 23 [2] 153-162 (2002).
27. M. Ude, M. A.-Khorassani, L. T. Taylor, “Supercritical Fluid Extraction of
Plasticizers in Poly(vinyl butyral) (PVB) and Analysis by Supercritical Fluid
Chromatography,” Chromatographia, 55, 743-748 (2002).
28. F. Bordet, T. Chartier, J. F. Baumard, “The Use of Co-Solvents in Supercritical
Debinding of Ceramics,” J. European Ceram. Soc., 22 [7] 1067-1072 (2002).
29. T. Chartier, F. Bordet, E. Delhomme, J. F. Baumard, “Extraction of Binders from
Green Ceramic Bodies by Supercritical Fluid: Influence of the Porosity,” J.
European Ceram. Soc., 22 [9] 1403-1409 (2002).

12
30. K. Morita, H. Okinaka, G. Itakura, K. Ohnaka, “A Plasticizer Removal Method in
Electroceramic Green Bodies Using Supercritical CO2,” J. Electrochem. Soc., 150
[9] G548-G552 (2003).
31. K. Morita, “Generation Mechanism of Defects on Electroceramic Green Bodies
During Supercritical Plasticizer Removal,” J. Electrochem. Soc., 150 [9] G543-
G547 (2003).
32. Hwang G.-C., Choi J.-H., Bae S.-Y., Kumazawa H., “Degradation of Polystyrene
in Supercritical n-Hexane,” Korean J. Chem. Eng., 18 [6] 854-861 (2001).
33. J. Weiss, “Oxidizing Heat Treatment of Nickel Embedded in a Barium Titanate
Ceramic: Kinetics and Mechanisms of the Metal Oxidation,” J. Mater. Sci., 23
2195-2204 (1988).
34. H. Shoji, Y. Nakano, H. Matsushita, A. Onoe, H. Kanai, and Y. Yamashita,
“Effect of Heat Treatment on Dielectric Properties of X7R Designated MLCs
with Ni Internal Electrodes,” J. Mater. Syn. and Process., 6 [6] 415-418 (1998).
35. C. C. Lin, W. C. J. Wei, C. Y. Su, and C. H. Hsueh, “Oxidation of Ni electrode in
BaTiO3 Based Multilayer Ceramic Capacitor (MLCC),” J. Alloys and Compounds
485 [1-2] 653-659 (2009).
36. Q. Feng, C. J. McConville, D. D. Edwards, D. E. McCauley, and M. Chu, “Effect
of Oxygen Partial Pressure on the Dielectric Properties and Microstructures of
Cofired Base-Metal-Electrode Multilayer Ceramic Capacitors,” J. Am. Ceram.
Soc., 89 [3] 894-901 (2006).

13
37. M. R Opitz, K. Albertsen, J. J. Beeson, D. F. Hennings, J. L. Routbort, and C.
A. Randall, “Kinetic Process of Reoxidation of Base Metal Technology BaTiO3-
based Multilayer Capacitors,” J. Am. Ceram. Soc., 86 [11] 1879-1884 (2003).
38. K. Krishnamurthy and S. J. Lombardo, “Pressure Distribution and Defect
Formation in Green Ceramic Bodies During Supercritical Extraction of Binder,”
J. Am Ceram. Soc., 92 [2] 365-370 (2008).

14
CHAPTER 2
GENERAL EXPERIMENTAL

15
2.0 FABRICATION OF GREEN TAPES
In this work, ceramic tapes were prepared by first combining dielectric powder,
solvent, binder, plasticizer, and dispersant in appropriate proportions to create a slurry.
After the contents were milled together, the slurry was poured onto a sheet of mylar
which rested on the bed of a tape caster. The tape caster, shown in Figure 2.1, contained
a doctor blade which spanned the width of the bed and was slightly elevated above the
mylar. The doctor blade was then used to pull the bulk of the slurry across the length of
the bed leaving behind a thin film, which formed into a green ceramic tape after drying.
Figure 2.1: Schematic of a ceramic tape cast.
Doctor Blade
Tape Caster
Mylar Sheet
Ceramic Tape Slurry

16
2.1 SCREEN PRINTING OF ELECTRODES
Nickel paste was prepared by first combining dielectric powder, nickel powder,
solvent, binder, and dispersant in various proportions to create a slurry. After the slurry
was milled, the resulting nickel paste was poured onto a custom designed 400 calendared
SS mesh screen (UTZ LLC, Clifton, NJ). Nickel metal electrodes were then printed 2-
3 μm thick onto 1×1 inch pieces of ceramic tape. For printing, the nickel electrodes were
applied to the tapes with either a screen printer (Model 645, Affiliated Manufacturers
Inc., North Branch, NJ), shown in Figure 2.2, or a hand squeegee (80 durometer, Saati,
Milan, Italy). When using a screen printer, the ceramic tape, with the mylar backing, was
first placed onto a perforated loading platform and then held stationary with vacuum.
During printing, the mobilized loading platform was automatically positioned under the
screen where a squeegee then transferred metal electrodes onto the ceramic tape as the
nickel paste was pulled across the screen.
When screen printing with a hand squeegee, the mylar backing of the ceramic
tape was first attached to a piece of overlapped adhesive tape (Duck, Henkel Consumer
Adhesives Inc., Avon, OH) and then pressed to a flat surface. After the screen was
manually aligned over the ceramic tape, the nickel paste was pulled across the screen
with the hand squeegee, as shown in Figure 2.3a. Figure 2.3b is an image of a ceramic
tape after screen printing nickel metal electrodes.

17
Figure 2.2: Image of a screen printer.
a) b)
Figure 2.3: Image of (a) a screen printing apparatus and (b) a ceramic tape
containing nickel metal electrodes.
Hand Squeegee
Screen
Tape
0.5 cm
2.54 cm
Hood
Loading Platform
Screen
Squeegee
Vacuum Switch
Start Button
Nickel Paste

18
2.2 LAMINATION OF TAPES
A 25 ton press (Model 2518, Carver Inc., Wabash, IN) shown in Figure 2.4, was
used to laminate individual green tapes into MLC samples. Two pressure gauges,
designed specifically for the Carver press, were calibrated to measure both the pressure
inside the hydraulic chamber in units of pound-force per square inch, as well as the
applied load, in units of pound-force and metric tons. One pressure gauge was designed
to measure small loads that ranged from 0-5,000 lbf, while the other pressure gauge
measured larger loads up to 50,000 lbf. The control valve separating the two pressure
gauges was closed prior to pressing if the calculated load was near or exceeded 5,000 lbf.
Figure 2.4: Image of a 25 ton Carver press.
A B
I
J
D
E
F
G
H
K
A- Temperature Controller for Platen 1
B- Temperature Controller for Platen 2
C- Power Switch D- 5,000 lbf Gauge E- 50,000 lbf Gauge F- Control Valve G- Pressure Release Valve H- Lever I- Platen 1 J- Platen 2
C

19
For lamination, the temperature of each platen was adjusted with corresponding
electronic temperature controllers (Model 6100, West, The Hyde Business Park Brighton,
United Kingdom) which displayed both the actual platen temperature and the set-point
platen temperature in units of degrees Fahrenheit as shown in Figure 2.5. The set-point
temperature on each controller was adjusted by pressing the function button, which
opened a settings menu where the directional arrows were pressed to increase or decrease
the set-point value. The controller was then returned to the main display where the set-
point temperature reflected the changed value after the function button was pressed once
again.
Figure 2.5: Image of the digital temperature controllers on a 25 ton Carver press.
Prior to lamination, the ceramic tape was first cut into individual layers and the
mylar backing was removed. The layers were then stacked in a “bottom to top”
Actual Temperature
Set-Point Temperature
Function Button
Directional Arrows

20
orientation with the “bottom” representing the side which was initially attached to the
mylar backing. Next, the non-stick side of a new piece of mylar was determined by
pressing some adhesive tape to each side and physically feeling the obvious difference in
resistance while pulling the tape off. The side with the least resistance contained the non-
stick coating. Mylar was then placed between the stack and the platens with the “non-
stick” side of the mylar in contact with the ceramic tape as shown in Figure 2.6.
Figure 2.6: Image of a stack of layered ceramic tapes prior to lamination.
After the stack of tapes, surrounded by mylar, was placed on the center of the
lower platen, the load required for lamination was calculated by multiplying the desired
lamination pressure by the surface area of an individual layer. Once the platens were at
the set-point temperature, the stack was manually laminated with the lever at a constant
load. After pressing, the resulting MLC was removed from the press and cooled at room
temperature for at least five minutes before the mylar was removed. The distorted shape
of the MLC following lamination, referred to as “flow,” was then evaluated based on the
expansion of the stack relative to the original size, as depicted in Figure 2.7.
Layered Tapes
Mylar
Mylar

21
Figure 2.7: Schematic representing the possible flow of a MLC during lamination.
Samples were fabricated for permeability and porosity measurements by first
cutting ceramic tape into individual layers of 3.0×3.0×0.015 cm. Next, four layers were
stacked in a “bottom to top” orientation and laminated at 5 MPa for 10 minutes at either
85 or 95 °C. After lamination, the samples were cut with a surgical blade (# 11, Feather
Safety Razor Co., Osaka, Japan) into disk geometry with an approximate diameter of
2.5 cm.
Samples were fabricated for peel test measurements by first laminating two green
tapes of 4.0 cm length × 1.0 cm width together at 5 MPa for 10 minutes at either 85 or
95 °C to form a substrate. After forming an additional substrate, the two substrates were
layered and then partially separated by mylar (see Fig. 2.8). For lamination, two 0.3 cm
thick aluminum plates were placed on Platen 2 and heated to the lamination temperature
of the press. After the temperature stabilized, as measured by a type K thermocouple
attached to a digital multi-meter (Omega Engineering Inc, Stamford, CT), part of the
layered substrate, not separated by mylar, was placed between the aluminum plates, as
Original MLC Size
Flow

22
shown in Figure 2.8. The two substrates were then laminated together at the above
conditions to form a T-shaped peel sample.
Figure 2.8: Schematic of how two green ceramic substrates are laminated together to
form a T-shaped peel sample where the filled-in arrows indicate the direction of the
applied load.
2 layered substrate II
Lower aluminum plate
2 layered substrate I
Upper aluminum plate
Not Laminated Laminated
Mylar

23
2.3 CUTTING AND PHOTOGRAPHING MULTILAYER
CERAMIC CAPACITORS
After the mylar surrounding the laminated MLC was removed (see section 2.3),
the MLC samples were cut. To avoid delamination while cutting the MLCs, a metal ruler
(Model# R590-12, Alvin & Company Inc., Bloomfield, CT) was placed on top of the
sample and then pressed by hand. Next, the MLC was cut by running a surgical blade
(Feather Safety Razor Co.) along the edge of the metal ruler as shown in Figure 2.9.
After cutting, each edge of the MLC was observed at 40× magnification under a light
microscope (Edmund Scientific, Barrington, NJ) to check for delamination.
Following observation and/or experiments, the MLC samples were photographed
using a 6 megapixel digital camera (Canon EOS 10D, Lake Success, New York) attached
to a 100 mm macroscopic lens and a 1:1× matched macro adaptor (Promaster, Japan).
Photographs were taken under fluorescent lighting only while using a tripod (Bogen
Model 3011, Manfrotto Nord, Bassano del Grappa (VI) – Italy) with the camera set to
manual mode having a shutter release and f/stop setting of 1.0 second and 13
respectively.

24
Figure 2.9: Schematic for cutting Multilayer Ceramic Capacitors (MLCs).
Mild Pressing Surg
ical B
lade
by Hand

25
2.4 GAS PERMEABILITY MEASUREMENTS
Permeability measurements were performed by measuring the molar flux of N2
across four laminated tapes of disc geometry after lamination, after SCE, and after the
combined SCE/TC. Following lamination, the thickness of each sample was measured
with a drop pin gauge accurate to within 0.001 inches, as shown in Figure 2.10; the
thickness was recorded as an average of five measurements at different locations. Next,
the sample was loaded into a holder (Millipore, Billerica, MA) which had an open area of
1.56 cm diameter. The holder was then mounted into the permeability apparatus shown
in Figure 2.11, which consisted of a pressure regulator (Valve 1, not shown) attached to a
nitrogen tank, a pressure gauge (P1), a sample holder, a second pressure gauge (P2), a
control valve (Valve 2), and a flow meter (50 ml, Kimble Chase Life Science, Vineland,
NJ) connected in sequential order.
Figure 2.10: Image of a drop pin gauge. The crosses on the sample represent the
location of each measurement.

26
Figure 2.11: Image which outlines the flow of N2 through various components within
the permeability apparatus.
After the sample holder was mounted into the permeability apparatus, Valve 2
was completely closed and Valve 1 was slowly opened so that nitrogen could flow into
the system. If P2 remained at atmospheric pressure as P1 approached 80 psi, then Valve 1
was closed and permeability of the sample was considered negligible. If a pressure
increase was observed in P2, then Valves 1 and 2 were adjusted so that P1 and P2 initially
measured 20 psi and 5 psi, respectively, as nitrogen flowed from the tank to the flow
meter.
Pressure In
(P1)
Pressure Out (P2)
Control Valve for P2
(Valve 2)
Flow In from N2 Tank
Flow Meter
Sample Holder
Flow Out

27
The volumetric flow rate of nitrogen through the sample holder was determined
with a flow meter, which consisted of a 50 ml tube and a rubber squeeze bulb filled with
a mixture of soap and water. After the rubber squeeze bulb was compressed, the time
required for the N2 gas to push the resulting bubble up the flow meter from 40 ml to
10 ml was measured, as shown in Figure 2.12. Several bubbles were formed prior to
each measurement to reduce friction at the wall of the 50 ml tube. The volumetric flow
rate, V, was determined as an average of three measurements for a given P1 and P2 and
then converted to a molar flow rate, n, from
n =PfVf
RTf (2.1)
where R is the gas constant, T is the temperature, P is the pressure, and the subscript f
denotes the conditions at the flow meter. The molar flux was then determined by
dividing the molar flow rate by the area, A, of the substrate as given by:
Nm = nA
(2.2)
Once the volumetric flow rate and the change in pressure from P1 to P2 across a sample
of thickness, L, were known, the permeability, κ, was calculated from the measured flux
data as
κ = -2RTNmµL
P22 - P1
2 (2.3)
where µ is the viscosity of the gas. The permeability of the sample was recorded as the
average of four measurements from four different flow rates of N2.

28
Figure 2.12: Image of a 50 ml flow meter used to measure the volumetric flow rate of
flowing nitrogen.
N2 Flow In
Bubble Fluid Level Before Compression
Bub
ble
Flow
Compress Bulb to Form Bubble
Bubble Fluid Level After Compression

29
2.5 POROSITY MEASUREMENTS
After determining the permeability, the dry, suspended, and saturated weights of
the sample were measured with a scale (Model R160P, Sartorius Co., Bohemia, NY) and
then the porosity, ε, was calculated using Archimedes’ method. After recording the dry
weight, a 600 ml beaker (Model 14000, Kimble Chase Life Science) was filled with
deionized water and placed on an inverted zirconia setter which rested on a hotplate
(Fisher Scientific, Pittsburgh, PA). Once the temperature of the water reached 55 °C, as
measured with a mercury thermometer (Model 14-985B, Fisher Sci., Pittsburgh, PA), the
sample was placed on a 1.5 inch diameter 304 SS perforated disk (P.O. AC-30654660,
Purolator EFP, Huston TX) which was then suspended in the water for 24 hours.
To measure the suspended weight, the sample was first removed from the 600 ml
beaker and placed onto another perforated disk (P.O. AC-30654660, Purolator EFP)
which was suspended from the bottom of the scale. Next, the disk was submerged into a
different container which contained deionized water and approximately 3 ml of a wetting
agent (Triton X-100, Ricca Chemical Co., Arlington, TX) at room temperature. After
determining the suspended weight, excess water droplets on the surface of the sample
were removed with a damp paper towel by lightly patting the sample so the saturated
weight could be measured. Once the dry (D), suspended (S), and saturated (W) weights
of the sample were known, the percent porosity, P, was calculated with:
P, % = W - DW - S ×100 (2.4)

30
2.6 ADHESION STRENGTH MEASUREMENTS
The adhesion strength between tape layers was determined by performing peel
tests [1-4] on the T-shaped peel sample described in section 2.3. Following lamination,
the peel sample would either be subjected directly to the peel test or first to a particular
cycle, e.g., SCE, and then to the peel test. For the peel test, the two unlaminated parts of
the T shaped sample were placed in the grips of a tensile tester (TA TX Plus Texture
Analyzer, Stable Micro Systems Ltd, Surrey, UK) and then pulled apart as shown in
Figure 2.13. During testing, the load applied to the sample was measured as a function of
displacement as the top crosshead moved vertically at a speed of 0.4 cm s-1. Since the
elongation of sample due to strain was considered negligible during testing, the adhesion
strength, σ, was given by
σ = F1
b (2.5)
where F1 is the force applied to the sample and b is the sample width.

31
Figure 2.13: Schematic of a peel sample placed into the grips of a tensile tester which
pulled the sample apart as the top crosshead moved vertically away from the base.
Crosshead
Peel Sample

32
2.7 RESIDUAL CARBON MEASUREMENTS
Following thermal oxidation, the residual carbon (RC) content of samples was
determined with a residual carbon analyzer (Model C-144, LECO, St. Joseph, MI) shown
in Figure 2.14. For each style of MLC evaluated, 5 MLCs were prepared and the average
percent residual carbon (%RC) was calculated. Because less than 100 measurements
were taken at each condition, 90% confidence intervals (C.I.) were evaluated using
statistical analysis software (SAS) according to:
C.I. = ā ± t* σ√n
(2.6)
where ā is the sample mean, 𝜎 is the standard deviation, n is the number of samples, t* is
a value obtained from the t-distribution tables, and [ t* σ√n
] is the standard error of the
mean.
For RC analysis, the MLC was first chopped with a razor blade (PO# 11140, ACE
Hardware Corp., Oak Brook, IL) into a powder yielding an average particle diameter of
1 mm. The weight of the MLC was then determined within 0.1 mg by placing the sample
into a zirconium silicate boat (Part# 529-204, LECO, St. Joseph, MI) which rested on a
scale (Model LA 120S, Sartorius Co., Bohemia, NY). Next, the chamber inside the RC
analyzer was purged with flowing O2 for 5 seconds at 3.5 LPM after which the chamber
door was opened and a rod was used to push the boat into the furnace against the heating
element, which was maintained at 927 °C. During analysis, O2 flowed through the
analyzer at a constant 2.5 LPM and the evolved carbon dioxide was measured with an
infrared detector. If the volume of a single MLC exceeded the capacity of the boat, then

33
one third of the pulverized MLC was analyzed per run, and the %RC was recorded as an
average of 3 runs.
Figure 2.14: Image of a residual carbon analyzer and other components required for
measuring the residual carbon content of MLCs.
To determine the precision and accuracy of the RC measurements, three runs,
each containing 250 to 400 mg of a 1% carbon standard, were evaluated prior to
analyzing the first MLC. If the accuracy was less than 0.015%, then the RC analyzer was
recalibrated with software which performed a linear regression over the previous three
measurements. Next, three additional runs were evaluated and the calibration process
continued until results within 0.015% were achieved.
Scale
Oxygen Tank
Residual Carbon
Analyzer
Push Rod
Measuring Boat
1% Carbon
Standard

34
2.8 SUPERCRITICAL EXTRACTION EXPERIMENTS
The supercritical extraction (SCE) experiments were conducted in a SS 316
6.25 cm diameter 500 ml high pressure non-stirred vessel (P.O. 1834HC2, Parr Inst. Co.,
Moline, IL). The lid of the extraction vessel, shown in Figure 2.15, was equipped with a
thermocouple well (P.O. A1453HC, Parr Inst. Co.), a gauge block assembly (P.O.
4317PK, Parr Inst. Co.), two different needle valves (P.O. NA176VB, Parr Inst. Co.);
(P.O. 30VM-4071, Autoclave Engineers, Erie, PA), and a gasket mount. The original
rupture disk included with the gauge block assembly was discontinued, so a replacement
disk (P.O. 526HCPH, Parr Inst. Co.) which ruptures at 5000 psi was used. Depending on
whether the experiment was conducted in supercritical carbon dioxide or supercritical
hexane, either a polyteflon (PTFE) (P.O. 457HC2, Parr Inst. Co.) or carbon fiber (grafoil)
gasket (P.O. 457HC3KL, Parr Inst. Co.) was installed, respectively.
Figure 2.15: Image of the supercritical extraction vessel lid.
PTFE Gasket
Thermocouple Well
Needle Valves Gauge
Block

35
The phase of the extraction fluid at ambient conditions determined how the
samples were loaded into the extraction vessel. When utilizing carbon dioxide as the
supercritical fluid, the sample was placed onto a perforated pedestal which was then
lowered into the vessel as shown in Figure 2.16. When utilizing hexane as the
supercritical fluid, the vessel was first charged with 400 ± 4 ml of liquid hexane (HPLC
grade ≥ 95% purity , Sigma-Aldrich) and then the MLC was placed in a sample holder
made from a SS 304 perforated metal sheet. Next, the sample holder was wired to the top
of the thermocouple well so the sample rested above the liquid hexane, as shown in
Figure 2.17.
Figure 2.16: Schematic of a MLC loaded into a vessel.
The split compression ring (P.O. A246HC2, Parr Inst. Co.) shown in Figure 2.18
was used to seal the vessel cover to the vessel by tightening one compression bolt from
each ring at a time with the second bolt located 180 degrees from the first. The amount
of torque applied to each compression bolt varied with the type of gasket installed. For
the PTFE and grafoil gasket, each compression bolt was tightened at 30 ft-lbs and
MLC
TC Well
500 ml Parr Vessel
Pedestal

36
55 ft-lbs, respectively. After placing a SS sleeve (P.O. A247HC, Parr Inst. Co.) around
the split compression ring, the assembled vessel was lifted by the inlet and outlet tubing
stems and inserted into the furnace (“Heater Assembly” P.O. 4920, Parr Inst. Co.) of the
supercritical extraction apparatus.
Figure 2.17: Schematic of a MLC loaded into a vessel containing 400 ml of hexane.
The supercritical extraction apparatus was comprised of a furnace, a controller
(Model 4836, Parr Inst. Co.), a type J thermocouple (P.O. A472E2, Parr Inst. Co.), a flow
meter (Model VFB, Dwyer Inst. Inc., Michigan City, IN), a compressor (Model AG-152,
Haskel Eng. and Supply Co., Salisbury, Australia), a computer (Model M6300, Dell Inc.,
Round Rock, TX), and high pressure gas cylinders. Figure 2.19 is a diagram which
outlines the direction of gas and electrical current flow through each component of the
SCE apparatus used for all the experiments in this investigation. Because the flow meter
was calibrated for air, the actual flow of gas was obtained with
MLC
TC Well
400 ml of Liquid Hexane
500 ml Parr VesselSample Holder

37
Q2 = Q1 × �1
S.G. (2.4)
where Q2 is the actual flow corrected for the specific gravity (S.G.) of the gas used, and
Q1 is the measured flow.
Figure 2.18: Image of the split compression ring used to attach the vessel lid to the
vessel.
A unique procedure was required to heat the vessel when the set-point
temperature (Tset) was below 200 °C. Table 2.1 lists values for Tset along with the
corresponding parameters necessary to heat and maintain the vessel temperature in air.
For heating, the integral and derivative settings on the controller were always set to 60
and 0, respectively, while the primary proportionality band (P1) and percent power level
(PL.1) settings varied with Tset. The remaining control parameters were left at the values
Split Compression Ring

38
set by the manufacturer. For each experiment, the amount of power used to heat the
vessel to Tset (PL.1ramp) was different than the amount needed to maintain the temperature
at Tset (PL.1dwell). To heat the vessel, a constant amount of power at PL.1ramp was
supplied to the furnace for a length of time (tramp), which depended on both the value of
Tset and the atmosphere inside the vessel. After the temperature reached Tset, the value of
PL.1ramp was manually changed to PL.1dwell.
Figure 2.19: Flow diagram of the supercritical extraction apparatus.
Table 2.1. Parameters used to heat a 500 ml vessel in air to various set-point
temperatures (Tset).
Tset (°C)
PL.1ramp
(%) tramp (min)
P1 (band)
PL.1dwell
(%) 90 40 23.0 1 10 120 70 19.0 5 15 150 70 25.5 5 15
Air exit
CO2Tank
ArTank
Air Valve on fume hood
Compressor
VesselFurnace
TC
Controller
Gas
Current
Computer
Vent
Flow MeterElectrical
Temperature

39
For most of the SCE experiments, the SCE cycle was comprised of a purge step, a
pressurization step, a dwelling step, and a depressurization step. When operating with
carbon dioxide as the supercritical fluid, the purge consisted of a three minute exposure
to flowing gas at approximately 0.8 LPM at room temperature and pressure to remove air
from the extraction vessel. During the purge, the controller settings were set to the same
values required to heat the vessel in air to a given Tset, as described earlier. Next, the
vessel pressure was equilibrated with the pressure in the CO2 cylinder, and then a
compressor was used to increase the pressure to an initial value (Pinitial) listed in
Table 2.2. Upon closing the inlet valve to the vessel, however, Pinitial decreased by
~2 MPa. The final pressure of 30 MPa was attained by supplying power at PL.1ramp (see
Table 2.1) to the furnace for the amount of time, tramp, listed in Table 2.2. If the pressure
reached 30 MPa at a temperature below Tset, then the supercritical CO2 was vented at the
vessel outlet so that the pressure remained constant. After dwelling at Tset for 1 hour, the
vessel was depressurized isothermally to atmospheric conditions. After depressurization,
the extraction efficiency was determined from the weight loss of the samples, normalized
by the total amount of organic phase initially present.
Table 2.2. Parameters used to thermally pressurize a 500 ml vessel to 30 MPa with
carbon dioxide at various set-point temperatures (Tset).
Tset (°C)
Pinitial (MPa)
tramp (min)
90 12 25 120 10.5 21 150 9 27

40
When the dwell step consisted of multiple exposures of supercritical CO2 instead
of a single exposure, the temperature and pressure were first held constant for 1 hour after
which the vessel was depressurized in a non-isothermal manner at a constant rate of
8.0 LPM to 10 MPa. Next, the compressor re-pressurized the vessel to 30 MPa at Tset
with fresh CO2. After re-pressurization, if necessary, the proportional band was slightly
modified from the values indicated in Table 2.1 so the temperature remained within
±2 °C of Tset. This sequence of steps —pressurization, 1 h dwell, depressurization— was
then repeated for 2 additional cycles before the vessel was depressurized isothermally to
atmospheric conditions.
When operating with hexane as the supercritical fluid, the vessel was first purged
with argon gas at 0.85 LPM for 5 minutes to completely remove oxygen. During the
purge, insulation (P.O. 9328K42, McMaster-Carr, Elmhurst, IL) was placed on top of the
heating assembly, and the P1, P2, I, D, and PL.1ramp settings on the controller were
changed to 47, 47, 41, 158, and 100, respectively, with P2 representing the secondary
proportionality band. The remaining control parameters were left at the values set by the
manufacturer. Next, the temperature of the vessel was increased from room temperature
to 270 °C, which pressurized the vessel from 0.1 MPa to 26 MPa as the phase of the
hexane changed from liquid to supercritical. After dwelling for 2 hours, the vessel was
depressurized thermally to ~0.1 MPa and 30 °C, after which the MLC was removed and
dried in an oven at 80 °C for 24 hours. These steps —charging, pressurization, dwell,
depressurization, drying— were then repeated for 1 additional cycle.

41
2.9 REFERENCES 1. J. W. Yun, P. J. Scheuer, D. S. Krueger, and S. J. Lombardo, “Effect of
Lamination Conditions on Gas Permeability and Adhesion Strength of Green
Ceramic Tapes,” Adv. in Applied Ceram., 107 [4] 190-198 (2008).
2. J. W. Yun, P. Scheuer, D. Krueger, and S. J. Lombardo, “Effect of Lamination
Conditions for Green Ceramic Tapes on Adhesion Strength, Gas Permeability,
and Yield During Binder Removal,” Adv. in Applied Ceram., 108 [8] 488-493
(2009).
3. Standard Test Method for Peel Resistance of Adhesives (T-Peel Test), ASTM
Designation: D1876-01, Philadelphia, PA, USA.
4. D. E. Packham: in ‘Handbook of Adhesion’, (ed. D. E. Packham), 301; 1992,
New York, Longman Scientific & Technical (Wiley).

42
CHAPTER 3
EFFECTS OF A COMBINED SUPERCRITICAL
EXTRACTION/THERMAL CYCLE ON BINDER
REMOVAL CYCLE TIME AND YIELD IN MULTILAYER
CERAMIC CAPACITORS

43
3.0 INTRODUCTION
In the fabrication of multilayer ceramic capacitors (MLCs), organic blends of
binder and plasticizer are used to aid in the casting and lamination of ceramic tapes.
Following lamination, the organic fraction must be removed before the ceramic green
body can be sintered into a dense component. The most common method for binder
removal is thermal decomposition of the organic constituents into gas phase species. The
evolution of these species into the pore space of the green body, however, leads to an
increase in pressure, which in turn causes stress [1-3] within the component that
ultimately may lead to defects such as fracture or delamination [4-9]. To avoid failure of
green components during thermal binder removal, the rate of binder decomposition is
sufficiently retarded in order to minimize the pressure and hence stress within the green
body. Thus, in practice, thermal cycles (TC) alone become a compromise between
achieving a short cycle time and a high product yield.
To avoid the aforementioned drawback associated with the thermal removal of
binder, supercritical extraction (SCE) has been proposed and demonstrated as an
alternative processing route [10-20]. Even though SCE may not be capable of fully
removing the entire organic fraction, the resulting increase in porosity within the green
body may permit a rapid removal of the remaining organic species during a TC. Thus,
the objective of this study is to demonstrate that a combined supercritical
extraction/thermal cycle (SCE/TC) can reduce the overall processing time while avoiding
defects and still maintaining high yield. In addition to this objective, we have also
observed in previous work that altering the lamination conditions during the manufacture

44
of MLCs has an impact on the processing yield during binder removal [21], and thus we
report and discuss on this aspect of processing for the combined SCE/TC as well.

45
3.1 EXPERIMENTAL
In this study, green tape samples were prepared which consisted of 86.6 wt%
barium titanate powder (Ferro X7R422H, Ferro, Niagara Falls, NY), 6.7 wt% poly(vinyl
butyral) (PVB) resin (Butvar B98, Richard E. Mistler, Inc., Yardley, PA), 5.1 wt% butyl
benzyl phthalate (Santicizer 160, Richard E. Mistler, Inc.), and 1.7 wt% Menhaden fish
oil (Richard E. Mistler, Inc.). A 25 ton press (Model 2518, Carver Inc., Wabash, IN) was
used to laminate 17 individual green tapes, each approximately 150 µm thick, at 5 MPa
for 10 min at either 85 °C or 95 °C into MLCs; the dimensions after lamination were
2.0×1.5×0.25 cm and 2.0×1.5×0.23 cm, respectively.
The porosity and permeability of four laminated tapes were measured after
lamination, after SCE, and after the combined SCE/TC. The porosity, ε, was determined
using Archimedes’ method. The permeability measurements, which have been described
in more detail elsewhere [22,23], were performed by measuring the molar flux, Nm, of N2
gas through tapes of disc shape. For a pressure drop from P1 to P2 across a sample of
thickness, L, the permeability, κ, can be determined from the flux data with
κ = -2RTNmµL
P22 - P1
2 (3.1)
where R is the gas constant, T is the temperature, and µ is the viscosity of the gas.
The adhesion strength between layers was determined by performing peel tests,
which have been described in more detail elsewhere [21,24-26]. For the peel test, the two
unlaminated parts of the T shape were placed in the grips of a tensile tester (TA TX Plus
Texture Analyzer, Stable Micro Systems Ltd, Surrey, UK). During testing, the load was
measured as a function of displacement as the top crosshead moved at a speed of

46
0.4 cm s-1. When the extension due to strain is negligible, the adhesion strength, σ, is
given by
σ = F1
b (3.2)
where F1 is the applied force and b is the sample width. The adhesion strength is
reported as the average of three samples.
The supercritical extraction experiments were conducted in a SS 316 (6.25 cm
diameter, 500 ml) Parr high pressure non-stirred vessel equipped with a thermocouple
well located in the vessel cover. The vessel was placed in a controlled-temperature
furnace which maintained the temperature within ±2 °C. Extraction experiments were
conducted in a semi-continuous mode of operation using CO2 as the supercritical fluid.
The SCE cycle was comprised of a purge step, a pressurization step, a dwelling step, and
a depressurization step. The purge consisted of a three minute exposure to flowing CO2
at room temperature and pressure to remove air from the extraction vessel. The vessel
was next pressurized with carbon dioxide from 0.1 MPa to 10 MPa with a compressor
over 3-4 minutes at room temperature. The vessel was then thermally pressurized to
30±1 MPa as the temperature was increased to 90 °C. The dwell lasted for 1 h as
pressure and temperature were held constant. The vessel was then depressurized
isothermally over a 6 h period to atmospheric conditions. After depressurization, the
extraction efficiency was determined from the weight loss of the MLCs, normalized by
the total amount of organic phase initially present.
Thermal oxidation of the binder in the MLCs was conducted in air in a box
furnace. The TC consisted of a ramp at either 7.5 or 10 K minute-1 to 600 °C, a 1 h soak
47
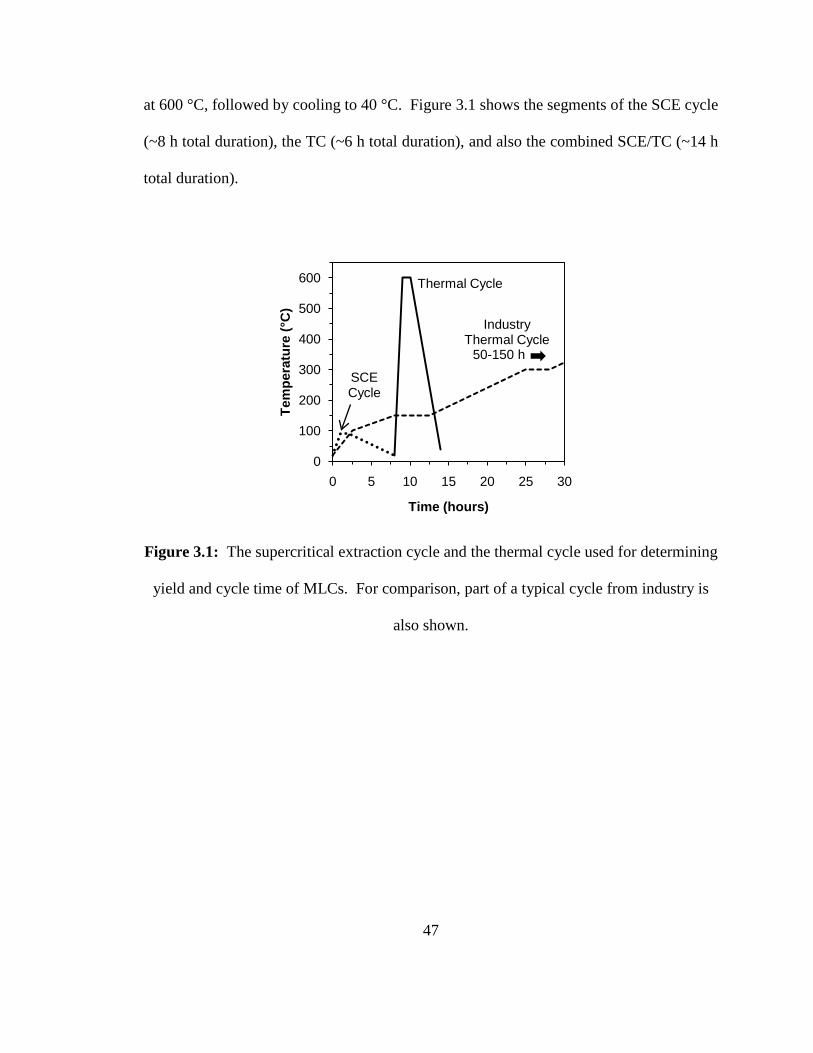
at 600 °C, followed by cooling to 40 °C. Figure 3.1 shows the segments of the SCE cycle
(~8 h total duration), the TC (~6 h total duration), and also the combined SCE/TC (~14 h
total duration).
Figure 3.1: The supercritical extraction cycle and the thermal cycle used for determining
yield and cycle time of MLCs. For comparison, part of a typical cycle from industry is
also shown.
0
100
200
300
400
500
600
0 5 10 15 20 25 30
Tem
pera
ture
(°C
)
Time (hours)
Thermal Cycle
Industry Thermal Cycle
50-150 h
SCECycle

48
3.2 RESULTS AND DISCUSSION
For the first experiment, an MLC, laminated at 85 °C and 5 MPa for 10 min, was
subjected to a TC alone with a heating rate of 7.5 K minute-1. As seen in the images in
Fig. 3.2a, the top surface in the central portion of the substrate experienced a large defect
during the TC; no damage was evident on the sides of the sample. Another MLC,
laminated at the same conditions, was then subjected first to supercritical extraction; the
sample lost 36 weight% during this step and displayed no defects afterwards. This
sample was then subjected to the TC portion of the cycle, where the binder was
completely removed, e.g., the total weight loss was 100%. Figure 3.2b shows that after
the combined SCE/TC, no defects were evident in the sample.
Figure 3.2: Side and top images of MLCs laminated at 85 °C, 5 MPa for 10 minutes.
a) Sample after a TC conducted with a 7.5 K minute-1 ramp to 600 °C with a 1 h hold.
b) Sample after a combined SCE/TC after exposure first to supercritical CO2 at 90 °C, 29
MPa for 1 h followed by a 6 h depressurization. The MLC was then exposed to a thermal
cycle identical to (a).
a) TC b) SCE/TC
2.0 cm 2.0 cm

49
In the second experiment, the above procedure, for the same lamination
conditions, was repeated, but this time during the TC the samples were heated at a higher
rate of 10 K minute-1. Figure 3.3 shows that for the TC, the MLC once again experienced
defects in the top surface and also large delaminations on the edge of the sample. For the
MLC subjected to the combined SCE/TC, the top surface exhibited no defects but the
edge now showed two small regions of delamination. Thus, an increase in the heating
rate during the TC has lead to defects in samples subjected to both processes, although
the severity is much worse for the TC alone. This suggests that the evolution of pressure,
and hence stress, during the TC exceeded the strength of the green body in both cases.
a) TC b) SCE/TC
2.0 cm 2.0 cm Figure 3.3: Side and top images of MLCs laminated at 85 °C, 5 MPa for 10 minutes.
a) Sample after a TC conducted with a 10 K minute-1 ramp to 600 °C with a 1 h hold.
b) Sample after a combined SCE/TC after exposure first to supercritical CO2 at 90 °C, 29
MPa for 1 h followed by a 6 h depressurization. The MLC was then exposed to a thermal
cycle identical to (a). The arrows indicate delaminations.

50
Additional experiments were conducted, but now the lamination temperature was
increased from 85 °C to 95 °C. Figure 3.4a shows that for the TC alone, in which the
heating rate was 7.5 K minute-1, defects occur in the green body; these defects, however,
are not located on the surface but instead are restricted to the edges of the sample in the
form of large regions of delamination. Figure 3.4b shows that after the combined
SCE/TC, no defects were evident in the sample.
a) TC b) SCE/TC
2.0 cm 2.0 cm Figure 3.4: Side and top mages of MLCs laminated at 95 °C, 5 MPa for 10 minutes.
a) Sample after a TC with a 7.5 K minute-1 ramp to 600 °C with a 1 h hold.
b) Sample after a combined SCE/TC after exposure first to supercritical CO2 at 90 °C, 29
MPa for 1 h followed by a 6 h depressurization. The MLC was then exposed to a thermal
cycle identical to (a).
In the final set of experiments, MLCs laminated at 95 °C were subjected to a TC
alone, but now at the higher heating rate of 10 K minute-1. For this heating rate, Fig. 3.5a

51
shows that the sample subjected to the TC alone exhibited defects on both the top and
edges. The MLC subjected to the SCE/TC, however, exhibited no defects after the
combined cycle, although defects were observed at this heating rate for a sample
laminated at 85 °C.
a) TC b) SCE/TC
2.0 cm 2.0 cm Figure 3.5: Side and top images of MLCs laminated at 95 °C, 5 MPa for 10 minutes.
a) Sample after a TC with a 10 K minute-1 ramp to 600 °C with a 1 h hold.
b) Sample after a combined SCE/TC after exposure first to supercritical CO2 at 90 °C, 29
MPa for 1 h followed by a 6 h depressurization. The MLC was then exposed to a thermal
cycle identical to (a).
The MLC yield relationships presented above between a TC alone versus a
combined SCE/TC as a function of TC heating rate and lamination temperature are
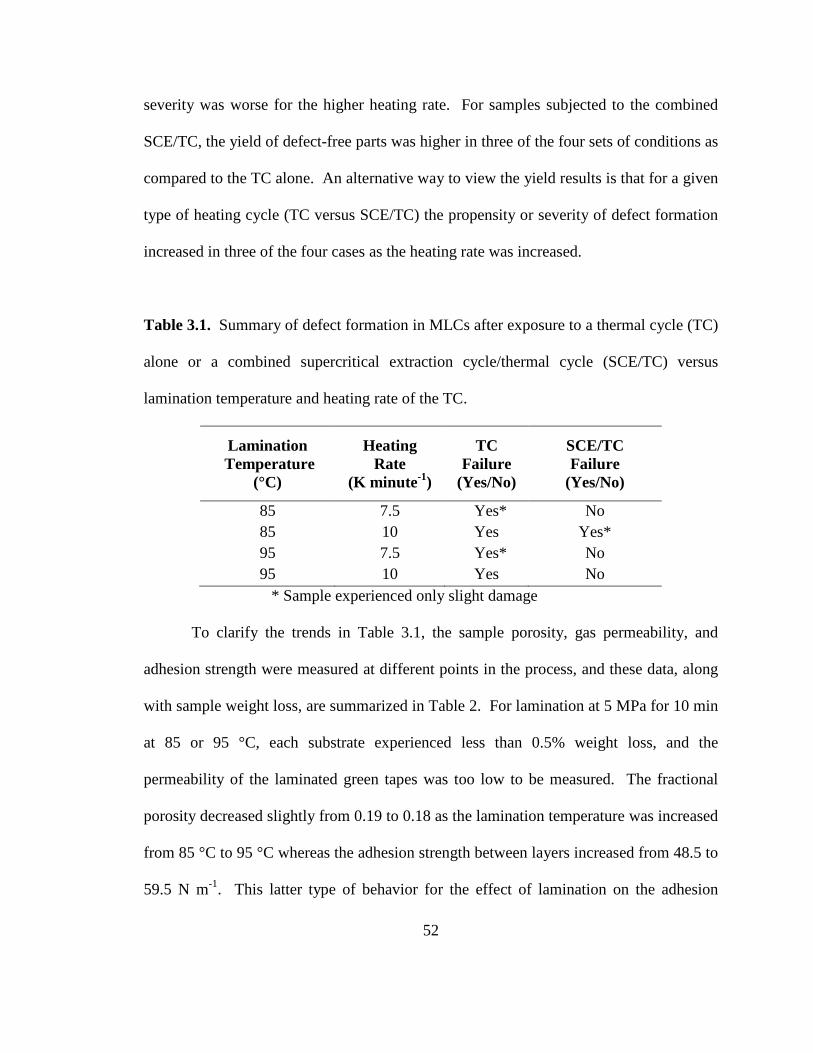
summarized in Table 3.1. All samples subjected to the TC alone, regardless of the
lamination temperature and heating rate in the TC, experienced defects, although the
52
severity was worse for the higher heating rate. For samples subjected to the combined
SCE/TC, the yield of defect-free parts was higher in three of the four sets of conditions as
compared to the TC alone. An alternative way to view the yield results is that for a given
type of heating cycle (TC versus SCE/TC) the propensity or severity of defect formation
increased in three of the four cases as the heating rate was increased.
Table 3.1. Summary of defect formation in MLCs after exposure to a thermal cycle (TC)
alone or a combined supercritical extraction cycle/thermal cycle (SCE/TC) versus
lamination temperature and heating rate of the TC.
Lamination Temperature
(°C)
Heating Rate
(K minute-1)
TC Failure
(Yes/No)
SCE/TC Failure
(Yes/No)
85 7.5 Yes* No 85 10 Yes Yes* 95 7.5 Yes* No 95 10 Yes No
* Sample experienced only slight damage
To clarify the trends in Table 3.1, the sample porosity, gas permeability, and
adhesion strength were measured at different points in the process, and these data, along
with sample weight loss, are summarized in Table 2. For lamination at 5 MPa for 10 min
at 85 or 95 °C, each substrate experienced less than 0.5% weight loss, and the
permeability of the laminated green tapes was too low to be measured. The fractional
porosity decreased slightly from 0.19 to 0.18 as the lamination temperature was increased
from 85 °C to 95 °C whereas the adhesion strength between layers increased from 48.5 to
59.5 N m-1. This latter type of behavior for the effect of lamination on the adhesion
53
strength is consistent with previous work [21,24] whereby at higher lamination
temperature, the viscosity of the sample, via the binder, decreases, and thus the
interpenetration or flow of the tapes during lamination is enhanced, thereby increasing
the adhesion strength.
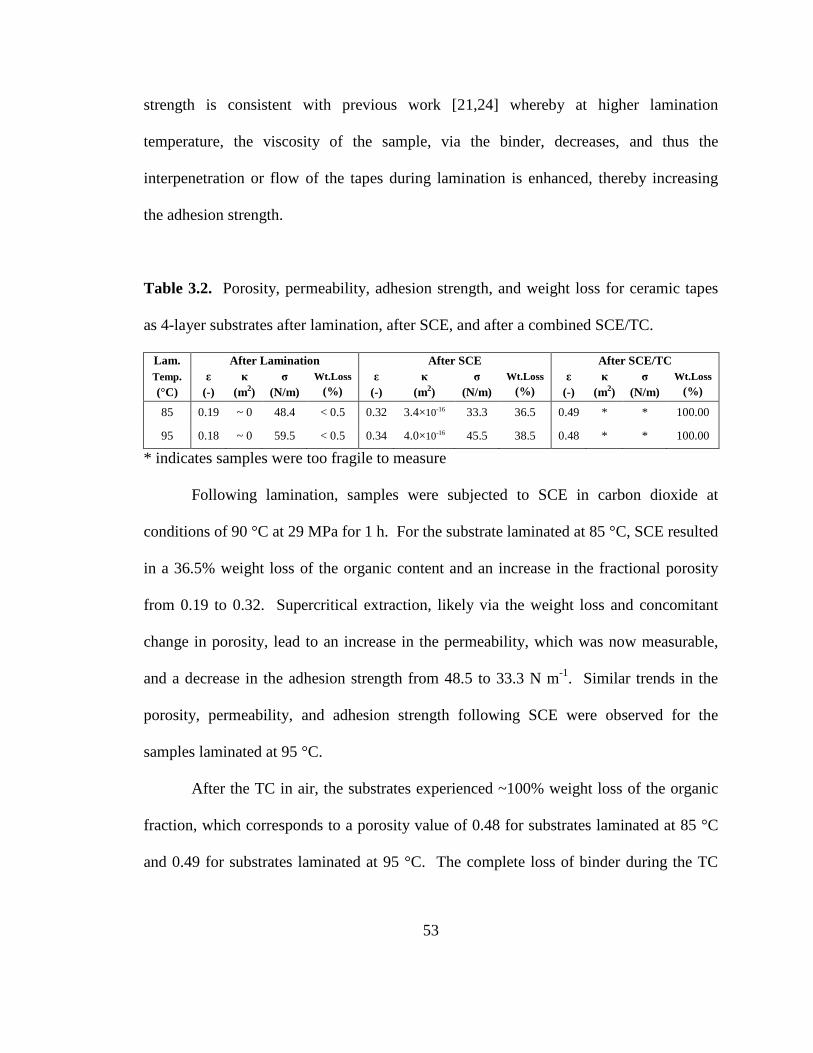
Table 3.2. Porosity, permeability, adhesion strength, and weight loss for ceramic tapes
as 4-layer substrates after lamination, after SCE, and after a combined SCE/TC.
Lam. After Lamination After SCE After SCE/TC Temp. (°C)
ε (-)
κ (m2)
σ (N/m)
Wt.Loss (%)
ε (-)
κ (m2)
σ (N/m)
Wt.Loss (%)
ε (-)
κ (m2)
σ (N/m)
Wt.Loss (%)
85 0.19 ~ 0 48.4 < 0.5 0.32 3.4×10⁻¹⁶ 33.3 36.5 0.49 * * 100.00
95 0.18 ~ 0 59.5 < 0.5 0.34 4.0×10⁻¹⁶ 45.5 38.5 0.48 * * 100.00
* indicates samples were too fragile to measure
Following lamination, samples were subjected to SCE in carbon dioxide at
conditions of 90 °C at 29 MPa for 1 h. For the substrate laminated at 85 °C, SCE resulted
in a 36.5% weight loss of the organic content and an increase in the fractional porosity
from 0.19 to 0.32. Supercritical extraction, likely via the weight loss and concomitant
change in porosity, lead to an increase in the permeability, which was now measurable,
and a decrease in the adhesion strength from 48.5 to 33.3 N m-1. Similar trends in the
porosity, permeability, and adhesion strength following SCE were observed for the
samples laminated at 95 °C.
After the TC in air, the substrates experienced ~100% weight loss of the organic
fraction, which corresponds to a porosity value of 0.48 for substrates laminated at 85 °C
and 0.49 for substrates laminated at 95 °C. The complete loss of binder during the TC

54
rendered the samples too fragile for handling and testing; this behavior likely reflects a
further decrease in the adhesion strength and masks an increase in the gas permeability.
To summarize this section, the combined SCE/TC leads to rapid binder removal
cycles with high yield as compared to cycles practiced in industry for samples of similar
dimensions, compositions, and physical properties (See Fig. 3.1). This likely arises
because of the partial removal of binder during SCE, which increases the porosity and
permeability of the samples, which in turn facilities gas flow and thus mitigates the
buildup of pressure and hence stress within the green body.

55
3.3 CONCLUSIONS
In this work, we have demonstrated that a combined supercritical extraction and
thermal cycle can be used to remove binder from green MLCs, and this process affects
both cycle time and yield. Supercritical extraction of a fraction of the binder results in an
increase in the gas permeability and a decrease in the adhesion strength of the MLCs.
Following the SCE segment, the MLCs then survive a rapid TC that they did not survive
without prior SCE, which indicates that the trade-off in the increase in gas permeability
following SCE has a more pronounced effect than the reduction in adhesion strength.
This rapid cycle is much shorter than typical cycles of 50-150 h used in industry for
samples of similar size and physical properties. The yield of the MLCs was also seen to
depend on other upstream processing variables such as the conditions of lamination,
whereby increasing the lamination temperature leads to a large increase in the adhesion
strength, which persists even following partial binder removal via SCE.

56
3.4 REFERENCES
1. G. C. Stangle and I. A. Aksay, “Simultaneous Momentum, Heat and Mass
Transfer With Chemical Reaction in a Disordered Porous Medium: Application to
Binder removal from a Ceramic Green Body,” Chem. Eng. Sci., 45 [7] 1719-1731
(1990).
2. D.-S. Tsai, “Pressure Buildup and Internal Stresses During Binder Burnout:
Numberical Analysis,” AIChE J., 37 [4] 547-554 (1991).
3. Z. C. Feng, B. He, and S. J. Lombardo, “Stress Distribution in Porous Ceramic
Bodies Druing Binder Burnout,” J. Appl. Mech., 69 [4] 497-501 (2002).
4. J. G. Zhang, M. J. Edirisinghe, and J. R. G. Evans, “A Catalogue of Ceramic
Injection Molding Defects and Their Causes,” Ind. Ceram. 9, 72-82 (1989).
5. J. Woodthorpe, M. J. Edirisinghe, and J. R. G. Evans, “Properties of Ceramic
Injection Moulding Formulations: Part III. Polymer Removal,” J. Mater. Sci. 24,
1038-1048 (1989).
6. J. R. G. Evans and M. J. Edirisinghe, “Interfacial Factors Affecting the Incidence
of Defects in Ceramic Mouldings,” J. Mater. Sci. 26, 2081-2088 (1991).
7. S. A. Matar, M. J. Edirisinghe, J. R. G. Evans, E. H. Twizell, and J. H. Song,
“Modeling the Removal of Organic Vehicle from Ceramic or Metal Moldings:
The Effect of Gas Permeation on the Incidence of Defects,” J. Mater. Sci., 30,
3805-3810 (1995).
57
8. P. S. Allan, M. J. Bevis, M. J. Edirisinghe, J. R. G. Evans, and P. R. Hornsby,
“Avoidance of Defects in Injection Moulded Technical Ceramics,” J. Mater. Sci.
Letters, 6 165-166 (1987).
9. J. W. Yun, D. S. Krueger, P. Scheuer, and S. J. Lombardo, “Effect of
Decomposition Kinetics and Failure Criteria on Binder Removal cycles from
Three-Dimensional Porous Green Bodies,” J. Am. Ceram. Soc., 89 [1] 176-183
(2006).
10. D. W. Matson and R. D. Smith, “Supercritical Fluid Technologies for Ceramic-
Processing Applications,” J. Am. Ceram. Soc., 72 [6] 871-881 (1989).
11. T. Chartier, M. Ferrato, J. F. Baumard, “Supercritical Debinding of Injection
Molded Ceramics,” J. Am. Ceram. Soc., 78 [7] 1787-1792 (1995).
12. T. Chartier, E. Delhomme, J. F. Baumard, “Mechanisms of Binder Removal
Involved in Supercritical Debinding of Injection Moulded Ceramics,” J. Phys. III,
7 [2] 291-302 (1997).
13. T. Chartier, E. Delhomme, J. F. Baumard, “Solubility, in Supercritical Carbon
Dioxide, of Paraffin Waxes Used as Binders for Low-Pressure Injection
Molding,” Ind. Eng. Chem. Res., 38 [5] 1904-1910 (1999).
14. R. V. Shende, D. S. Krueger, S. J. Lombardo, “Supercritical Extraction of Binder
Containing Poly(vinyl butyral) and Dioctyl phthalate from Barium Titanate-
Platinum Multilayer Ceramic Capactiors,” J. Mater. Sci.: Mater. Electron., 12,
637-643 (2001).

58
15. R. V. Shende, S. J. Lombardo, “Supercritical Extraction with Carbon Dioxide and
Ethylene of Poly(vinyl butyral) and Dioctyl phthalate from Multilayer Ceramic
Capacitors,” J. Supercrit. Fluids, 23 [2] 153-162 (2002).
16. M. Ude, M. A.-Khorassani, L. T. Taylor, “Supercritical Fluid Extraction of
Plasticizers in Poly(vinyl butyral) (PVB) and Analysis by Supercritical Fluid
Chromatography,” Chromatographia, 55, 743-748 (2002).
17. F. Bordet, T. Chartier, J. F. Baumard, “The Use of Co-Solvents in Supercritical
Debinding of Ceramics,” J. European Ceram. Soc., 22 [7] 1067-1072 (2002).
18. T. Chartier, F. Bordet, E. Delhomme, J. F. Baumard, “Extraction of Binders from
Green Ceramic Bodies by Supercritical Fluid: Influence of the Porosity,” J.
European Ceram. Soc., 22 [9] 1403-1409 (2002).
19. K. Morita, H. Okinaka, G. Itakura, K. Ohnaka, “A Plasticizer Removal Method in
Electroceramic Green Bodies Using Supercritical CO2,” J. Electrochem. Soc., 150
[9] G548-G552 (2003).
20. K. Morita, “Generation Mechanism of Defects on Electroceramic Green Bodies
During Supercritical Plasticizer Removal,” J. Electrochem. Soc., 150 [9] G543-
G547 (2003).
21. J. W. Yun, P. Scheuer, D. Krueger, and S. J. Lombardo, “Effect of Lamination
Conditions for Green Ceramic Tapes on Adhesion Strength, Gas Permeability,
and Yield During Binder Removal,” Adv. in Applied Ceram., 108 [8] 488-493
(2009).
59
22. J. W. Yun and S. J. Lombardo, “Permeability of Green Ceramic Tapes as a
Function of Binder Loading,” J. Am. Ceram. Soc., 90 [2] 456-61 (2007).
23. J. W. Yun and S. J. Lombardo, “Permeability of Laminated Green Ceramic Tapes
as a Function of Binder Loading,” J. Am. Ceram. Soc., 91 [5] 1553-8 (2008).
24. J. W. Yun, P. J. Scheuer, D. S. Krueger, and S. J. Lombardo, “Effect of
Lamination Conditions on Gas Permeability and Adhesion Strength of Green
Ceramic Tapes,” Adv. in Applied Ceram., 107 [4] 190-198 (2008).
25. Standard Test Method for Peel Resistance of Adhesives (T-Peel Test), ASTM
Designation: D1876-01, Philadelphia, PA, USA.
26. D. E. Packham: in ‘Handbook of Adhesion’, (ed. D. E. Packham), 301; 1992,
New York, Longman Scientific & Technical (Wiley).

60
CHAPTER 4
EFFECTS OF A COMBINED SUPERCRITICAL
EXTRACTION/THERMAL CYCLE ON RESIDUAL
CARBON IN MULTILAYER CERAMIC CAPACITORS

61
4.0 INTRODUCTION
In the fabrication of multilayer ceramic capacitors (MLCs), organic additives such
as a high molecular weight binder and a low molecular weight plasticizer are often used
to impart strength to the ceramic green body. Before the MLCs can be sintered, however,
all of the organic species must be removed from the green body. Traditionally, the
organic fraction is removed by thermal degradation methods [1-3], but as the organic
polymer becomes vaporized, oxidized, or pyrolyzed into carbonaceous gases, a carbon
residue may remain inside the green body. These residues may either influence the
sintering behavior or degrade the electrical properties of the final components. To avoid
carbon contamination during processing of MLCs with base metal electrodes, the organic
fraction is typically removed in non-oxidative atmospheres at temperatures above 270 °C
in order to circumvent oxidation of the base-metal electrode material [4-8].
An alternative processing route to thermal degradation of the organic fraction is
supercritical extraction [9-19]. Studies have shown that supercritical carbon dioxide can
easily remove organic species of lower molecular weight such as short chain waxes [10-
12] or plasticizers [10-12,15,16], but becomes less effective as the chain length increases.
Supercritical hexane has been known to remove higher molecular weight organic species
like polystyrene (MW = 150,000) [20]; but its application towards binder removal in
MLCs is not well known in literature. For the case of MLCs, the preferential extraction
of the low molecular weight plasticizers with supercritical carbon dioxide may lead to 40-
60% removal of the organic fraction [13,14], depending on the components in the binder
blend. By extracting a large fraction of the organic material, which does not lead to

62
carbonaceous products, less residual carbon may be left in the dielectric after the thermal
binder removal step. In this work, we demonstrate the impact of a combined supercritical
extraction and thermal cycle (SCE/TC) on the residual carbon present in base-metal and
noble-metal electrode MLCs.
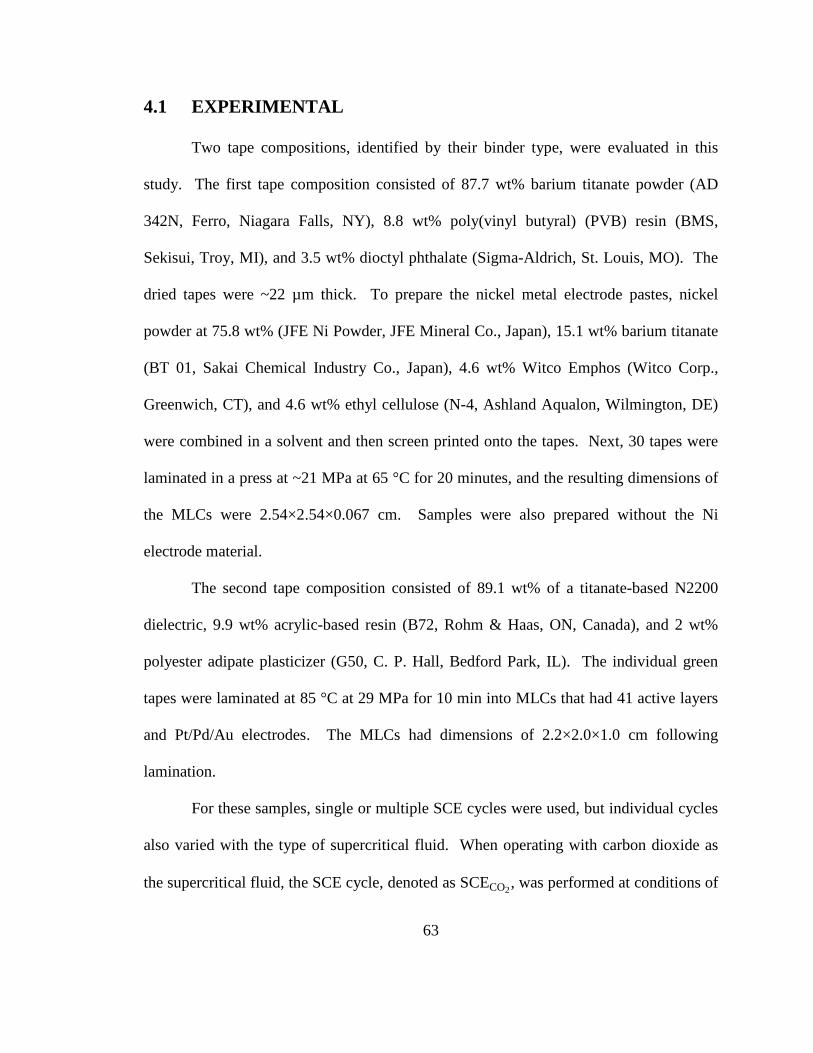
63
4.1 EXPERIMENTAL
Two tape compositions, identified by their binder type, were evaluated in this
study. The first tape composition consisted of 87.7 wt% barium titanate powder (AD
342N, Ferro, Niagara Falls, NY), 8.8 wt% poly(vinyl butyral) (PVB) resin (BMS,
Sekisui, Troy, MI), and 3.5 wt% dioctyl phthalate (Sigma-Aldrich, St. Louis, MO). The
dried tapes were ~22 µm thick. To prepare the nickel metal electrode pastes, nickel
powder at 75.8 wt% (JFE Ni Powder, JFE Mineral Co., Japan), 15.1 wt% barium titanate
(BT 01, Sakai Chemical Industry Co., Japan), 4.6 wt% Witco Emphos (Witco Corp.,
Greenwich, CT), and 4.6 wt% ethyl cellulose (N-4, Ashland Aqualon, Wilmington, DE)
were combined in a solvent and then screen printed onto the tapes. Next, 30 tapes were
laminated in a press at ~21 MPa at 65 °C for 20 minutes, and the resulting dimensions of
the MLCs were 2.54×2.54×0.067 cm. Samples were also prepared without the Ni
electrode material.
The second tape composition consisted of 89.1 wt% of a titanate-based N2200
dielectric, 9.9 wt% acrylic-based resin (B72, Rohm & Haas, ON, Canada), and 2 wt%
polyester adipate plasticizer (G50, C. P. Hall, Bedford Park, IL). The individual green
tapes were laminated at 85 °C at 29 MPa for 10 min into MLCs that had 41 active layers
and Pt/Pd/Au electrodes. The MLCs had dimensions of 2.2×2.0×1.0 cm following
lamination.
For these samples, single or multiple SCE cycles were used, but individual cycles
also varied with the type of supercritical fluid. When operating with carbon dioxide as
the supercritical fluid, the SCE cycle, denoted as SCECO2, was performed at conditions of

64
90 °C and 30 MPa for three 1-h exposures. Following SCECO2, the TC varied with the
type of MLC. For the PVB-based MLCs, the TC consisted of a ramp in air at
1 K minute-1 to 270 °C followed by a 12 h dwell period and then cooling to 40 °C. For
the acrylic-based MLCs, the TC cycle consisted of a ramp in air at 2.0 K minute-1 to
800 °C, a 12 h soak at 800 °C, followed by cooling to 40 °C. Figure 4.1 shows the
segments of the SCECO2, the TC, and also the combined SCECO2/TC for both the PVB-
based and acrylic-based MLCs.
Figure 4.1: The extraction cycle with supercritical carbon dioxide, and the thermal
cycles used for determining residual carbon content of MLCs.
When operating with hexane as the supercritical fluid, the vessel was first purged
with argon gas for 5 minutes to completely remove oxygen. Next, the temperature of the
SCE Cycle
0
100
200
300
400
500
600
700
800
0 5 10 15 20 25 30
Tem
pera
ture
(°C
)
Time (hours)
TC for PVB-based MLCs
TC for Acrylic-based MLCs

65
vessel was increased from room temperature to 270 °C, which pressurized the vessel
from 0.1 MPa to 26 MPa as the phase of the hexane changed from liquid to supercritical.
The SCE cycle, denoted as SCEC6H14, was comprised of two 2 h cycles during which the
pressure was held constant and the temperature was maintained within ±0.5 °C. After the
vessel was thermally depressurized over a period of 12 hours to 0.1 MPa and 30 °C, the
MLC was removed and dried in an oven for 24 hours at 80 °C. After SCE, the oxidation
cycle consisted of a ramp in air at 1 K minute-1 to 270 °C followed by a 12 h dwell period
and then cooling to 40 °C.
The carbon content was measured with a residual carbon analyzer (Model C-144,
LECO, St. Joseph, MI) by pulverizing the MLCs into a powder yielding an average
particle diameter of approximately 1 mm. For each type of sample, the average percent
residual carbon (%RC) and 90% confidence intervals were calculated from 5 samples at
each condition. To determine the precision and accuracy of the RC measurements, a 1%
carbon standard was evaluated prior to analyzing the samples.
66
4.2 RESULTS AND DISCUSSION
Table 4.1 summarizes the average percent weight loss for MLC samples subjected
to various binder removal cycles. For the PVB-based MLC samples with and without
nickel metal electrodes, both types of samples experienced 29-30% weight loss after
being subjected to supercritical carbon dioxide at 90 °C, 30 MPa, for three 1 h cycles.
For the acrylic-based MLCs, however, only a 3% weight loss occurred after extraction at
the same conditions, which is consistent with the lower solubility of the acrylic/adipate
binder [21]. The weight loss of the PVB-based MLC samples was further increased to
93% after exposure to supercritical hexane at 270 °C, 26 MPa for two 2 h cycles. After
the following cycles (a) SCECO2/TC, (b) SCECO2/SCEC6H14/TC, and (c) TC alone, each
sample lost up to 97-100% of the organic fraction, irrespective of sample type or prior
processing conditions. The results above suggest that weight loss alone determined
gravimetrically is insufficient to conclude which process is superior for binder removal.
To differentiate between the different processing routes, residual carbon analysis
was conducted. Figure 4.2 shows the %RC for the PVB-based MLC samples with and
without nickel electrodes. For both types of samples, the combined SCECO2/TC leads to
25-30% less carbon as compared to the TC alone. In addition, the use of a combined
cycle leads to substantially less variability in the residual carbon content, as indicated by
the 90% confidence intervals. Because of the overlap of confidence intervals in Figure
4.2, the sample means were compared for equality using a 90% confidence interval, one-
sided test. This test indicates that for the MLC samples subjected to the SCECO2/TC and
TC process, the differences in the means are statistically significant, which indicates the

67
SCECO2/TC process is effective in lowering the %RC as compared to the TC alone. For
the MLC samples with nickel metal electrodes subjected to the SCECO2/SCEC6H14/TC
process, the mean %RC was only reduced by 0.60% as compared to the SCECO2/TC
results. However, the MLC samples without nickel metal electrodes showed an 8.65%
reduction in the mean %RC and contained no overlap between the 90% confidence
intervals which means the SCECO2/SCEC6H14/TC process was statistically a slight
improvement over the SCECO2/TC.
Table 4.1. Average percent weight loss for PVB-based and acrylic-based MLCs after
exposure to different supercritical extraction and/or thermal cycles. The maximum
operating temperature during the TC for the PVB-based and acrylic-based MLCs was
270 °C and 800 °C, respectively.
Cycle Type
PVB-based With Ni
Weight Loss (%)
PVB-based Without Ni Weight Loss
(%)
Acrylic-based With Pt/Pd/Au
Weight Loss (%)
SCE+ 29 30 3.3
SCE+/SCE++ 93 93 N/A SCE+/TC 97 ~100 99
SCE+/SCE++/TC 98 98 N/A TC 97 99 99
+ CO2 was used as the supercritical fluid at conditions of 90 °C and 30 MPa. ++ Hexane was used as the supercritical fluid at conditions of 270 °C and 26 MPa.
The origin of the lower %RC for SCECO2/TC as compared to the TC alone may be
attributed to the fact that during the SCECO2 process, the binder, namely the low

68
molecular weight plasticizer component, is removed by dissolution into the supercritical
carbon dioxide and then diffusion out of the body and not by thermal degradation. Thus,
removing one-fourth to one-third of the binder by this process leads to less organic
material being present which can subsequently crack to carbonaceous residue during the
TC. Alternatively, the removal of the plasticizer, with the resultant creation of porosity,
may allow for more facile oxidation of the remaining organic fraction during the TC
without concomitant carbon deposition.
Figure 4.2: Percent residual carbon with 90% confidence intervals for MLC samples
with and without nickel electrodes subjected to SCECO2/TC (SCE/TC);
SCECO2/SCEC6H14/TC (SCE/SCE/TC); and TC (TC) alone. Each subscript denotes the
type of supercritical fluid used.
0.0
0.1
0.2
0.3
0.4
With Ni Without Ni
Res
idua
l Car
bon
(%)
MLC Type
TCSCE/TCSCE/SCE/TC

69
The logic mentioned above suggested that the addition of a SCEC6H14 cycle to
remove the high molecular weight binder component prior to the TC would further
reduce the %RC in the MLC samples as compared to the SCECO2/TC process. Though
the supercritical hexane greatly increased the quantity of organic material removed, a less
proportional effect was seen on the %RC remaining in the MLC samples following the
TC. These results may be attributed to some residual hexane possibly remaining in the
MLC samples following the TC.
Figure 4.3 shows the %RC for the acrylic-based MLC samples containing
Pt/Pd/Au metal electrodes. For these samples, the %RC for both the TC and SCECO2/TC
is within 0.001% of each other. The 90% confidence intervals shown in Figure 4.3
indicate that a TC alone in air to 800 °C had less variability in the residual carbon
content, as compared to the SCECO2/TC process, which is inconsistent with the
aforementioned PVB-based MLC samples. Because the mean %RC of the acrylic-based
MLCs was so close to the sensitivity of the instrument, it may be considered
inappropriate to unambiguously conclude the validly of these results. For this reason, no
attempts were made to further reduce the %RC in the acrylic-based MLC samples with
the addition of a SCEC6H14 cycle.

70
Figure 4.3: Percent residual carbon with 90% confidence intervals for an acrylic-based
MLC containing Pt/Pd/Au electrodes subjected to SCECO2/TC (SCE/TC) and TC (TC)
alone. The subscript denotes the type of supercritical fluid used.
0.000
0.004
0.008
0.012
0.016
With Pt/Pd/Au
Res
idua
l Car
bon
(%)
MLC Type
TCSCE/TC

71
4.3 CONCLUSIONS
In this work, we have demonstrated that a combined supercritical extraction and
thermal cycle has an effect on the residual carbon content in MLCs. For the PVB-based
MLC samples, utilization of the SCECO2/TC leads to 25-30% less carbon as compared to
a TC alone and to much less sample-to-sample variation. This reduction in carbon
content and variation was observed in MLC samples prepared both with and without
nickel electrodes. Exposing the PVB-based MLC samples to supercritical hexane
effectively removed up to 93% of the organic fraction, regardless of whether nickel was
present. However, this cycle showed essentially no further reduction in the mean %RC
for the samples with nickel and an 8.65% reduction for the samples without nickel as
compared to the SCECO2/TC results. For the acrylic-based MLC samples, the %RC is
nearly identical between the TC and SCECO2/TC, and in fact was very close to the
sensitivity of the instrument. This nearly complete removal of the organic fraction is
attributed to a more complete oxidation of the MLC at higher temperature.

72
4.4 REFERENCES 1. J.A. Lewis, “Binder Removal from Ceramics,” Ann. Rev. Mater. Sci., 27, 147-173
(1997).
2. I. E. Pinmill, M. J. Edirisinghe, M. J. Bevis, “Development of Temperature
Heating Rate Diagrams for the Pyrolytic Removal of Binder Used for Powder
Injection Moulding,” J. Mater. Sci., 27 4381-4388 (1992).
3. B. Peters, S. J. Lombardo, “Optimization of Multi-layer Ceramic Capacitor
Geometry for Maximum Yield During Binder Burnout,” J. Mater. Sci: Mater.
Electron., 12 403-409 (2001).
4. J. Weiss, “Oxidizing Heat Treatment of Nickel Embedded in a Barium Titanate
Ceramic: Kinetics and Mechanisms of the Metal Oxidation,” J. Mater. Sci., 23
2195-2204 (1988).
5. H. Shoji, Y. Nakano, H. Matsushita, A. Onoe, H. Kanai, and Y. Yamashita,
“Effect of Heat Treatment on Dielectric Properties of X7R Designated MLCs
with Ni Internal Electrodes,” J. Mater. Syn. and Process., 6 [6] 415-418 (1998).
6. C. C. Lin, W. C. J. Wei, C. Y. Su, and C. H. Hsueh, “Oxidation of Ni electrode in
BaTiO3 Based Multilayer Ceramic Capacitor (MLCC),” J. Alloys and Compounds
485 [1-2] 653-659 (2009).
7. Q. Feng, C. J. McConville, D. D. Edwards, D. E. McCauley, and M. Chu, “Effect
of Oxygen Partial Pressure on the Dielectric Properties and Microstructures of
Cofired Base-Metal-Electrode Multilayer Ceramic Capacitors,” J. Am. Ceram.
Soc., 89 [3] 894-901 (2006).

73
8. M. R Opitz, K. Albertsen, J. J. Beeson, D. F. Hennings, J. L. Routbort, and C.
A. Randall, “Kinetic Process of Reoxidation of Base Metal Technology BaTiO3-
based Multilayer Capacitors,” J. Am. Ceram. Soc., 86 [11] 1879-1884 (2003).
9. D. W. Matson and R. D. Smith, “Supercritical Fluid Technologies for Ceramic-
Processing Applications,” J. Am. Ceram. Soc., 72 [6] 871-881 (1989).
10. T. Chartier, M. Ferrato, J. F. Baumard, “Supercritical Debinding of Injection
Molded Ceramics,” J. Am. Ceram. Soc., 78 [7] 1787-1792 (1995).
11. T. Chartier, E. Delhomme, J. F. Baumard, “Mechanisms of Binder Removal
Involved in Supercritical Debinding of Injection Moulded Ceramics,” J. Phys. III,
7 [2] 291-302 (1997).
12. T. Chartier, E. Delhomme, J. F. Baumard, “Solubility, in Supercritical Carbon
Dioxide, of Paraffin Waxes Used as Binders for Low-Pressure Injection
Molding,” Ind. Eng. Chem. Res., 38 [5] 1904-1910 (1999).
13. R. V. Shende, D. S. Krueger, S. J. Lombardo, “Supercritical Extraction of Binder
Containing Poly(vinyl butyral) and Dioctyl phthalate from Barium Titanate-
Platinum Multilayer Ceramic Capactiors,” J. Mater. Sci.: Mater. Electron., 12,
637-643 (2001).
14. R. V. Shende, S. J. Lombardo, “Supercritical Extraction with Carbon Dioxide and
Ethylene of Poly(vinyl butyral) and Dioctyl phthalate from Multilayer Ceramic
Capacitors,” J. Supercrit. Fluids, 23 [2] 153-162 (2002).

74
15. M. Ude, M. A.-Khorassani, L. T. Taylor, “Supercritical Fluid Extraction of
Plasticizers in Poly(vinyl butyral) (PVB) and Analysis by Supercritical Fluid
Chromatography,” Chromatographia, 55, 743-748 (2002).
16. F. Bordet, T. Chartier, J. F. Baumard, “The Use of Co-Solvents in Supercritical
Debinding of Ceramics,” J. European Ceram. Soc., 22 [7] 1067-1072 (2002).
17. T. Chartier, F. Bordet, E. Delhomme, J. F. Baumard, “Extraction of Binders from
Green Ceramic Bodies by Supercritical Fluid: Influence of the Porosity,” J.
European Ceram. Soc., 22 [9] 1403-1409 (2002).
18. K. Morita, H. Okinaka, G. Itakura, K. Ohnaka, “A Plasticizer Removal Method in
Electroceramic Green Bodies Using Supercritical CO2,” J. Electrochem. Soc., 150
[9] G548-G552 (2003).
19. K. Morita, “Generation Mechanism of Defects on Electroceramic Green Bodies
During Supercritical Plasticizer Removal,” J. Electrochem. Soc., 150 [9] G543-
G547 (2003).
20. Hwang G.-C., Choi J.-H., Bae S.-Y., Kumazawa H., “Degradation of Polystyrene
in Supercritical n-Hexane,” Korean J. Chem. Eng., 18 [6] 854-861 (2001).
21. K. Krishnamurthy and S. J. Lombardo, “Pressure Distribution and Defect
Formation in Green Ceramic Bodies During Supercritical Extraction of Binder,”
J. Am Ceram. Soc., 92 [2] 365-370 (2008).
75
CHAPTER 5
EFFECTS OF A COMBINED SUPERCRITICAL
EXTRACTION AND THERMAL DECOMPOSITION OF
BINDER ON DEFECT FORMATION IN GREEN CERAMIC
BODIES

76
5.0 INTRODUCTION
In the fabrication of multilayer ceramic capacitors (MLCs), organic blends of
binder and plasticizer are used to impart strength to the ceramic green body. However,
all of the organic species must be removed from the green body before the MLCs can be
sintered. Traditionally, thermal degradation methods are used for removal of the organic
fraction [1-3], but as the binder loading of the MLC increases, the amount of time
allocated to removing the organic fraction also increases to prevent defects from forming
within the green body. Extraction of the organic material with supercritical fluids has
been proposed and demonstrated as an alternative processing route [4-16].
In earlier work, defects such as cracks and delamination have been occasionally
observed in MLCs subjected to supercritical extraction [15]. Such defects were mostly
observed in MLCs that experienced little loss of binder during the extraction cycle which,
in turn, resulted in a low permeability to gas flow. It was then postulated that the low gas
permeability caused pressure gradients to form during depressurization from supercritical
conditions which, in turn, led to the formation of defects. Defect formation in samples
exhibiting low weight loss suggested the exploration of more aggressive extraction
conditions by operating at higher temperatures. Under these conditions, degradation of
the organic fraction may be contributing to the observed weight loss, and possibly to the
occurrence of defects in the MLCs.
In this work, the origin of defects in samples is further explored for MLCs
fabricated from a (a) poly(propylene carbonate)-based, (b) acrylic-based, and (c)
poly(vinyl butyral)-based binder system. Three potential mechanisms contributing to the

77
formation of defects are additionally considered: failure during depressurization, failure
from enhanced binder degradation due to the presence of residual air in the vessel, and
failure due to mechanical vibrations from gas compression when going to high pressure.

78
5.1 EXPERIMENTAL
Three tape compositions, identified by their binder type, were evaluated in this
work. The acrylic-based MLC samples nominally consisted of 89.1 wt% of a titanate-
based N2200 dielectric, 9.9 wt% acrylic-based resin (B72, Rohm & Haas, ON, Canada),
and 2 wt% polyester adipate plasticizer (G50, C. P. Hall, Bedford Park, IL). The
individual green tapes were laminated at 29 MPa at 85 °C for 10 min into MLC samples
that had 41 active layers and Pt/Pd/Au electrodes. The dimensions of the MLC after
lamination were 2.2×2.0×1.0 cm. The acrylic-based MLCs were also cut using a vice
and a razor blade (PO# 11140, ACE Hardware Corp., Oak Brook, IL) into 1/2, 1/4, and
1/8 fractions of the original thickness. After aligning the razor blade in parallel with the
metal electrodes inside the MLC as depicted in Figure 5.1, the blade was pushed through
the sample as the grips of the vice closed. The 1/8 MLC sample was then quartered
perpendicular to the metal electrodes, producing a MLC that was 1/32 of the original size.
Figure 5.1: Schematic for cutting acrylic-based multilayer ceramic capacitors.

79
The poly(vinyl butyral) (PVB) based MLC samples nominally consisted of
87.2 wt% BaTiO3 (X7R 422H, Ferro, Niagara Falls, NY), 6.5 wt% poly(vinyl butyral)
resin, (PVB BL-1, Sekisui, Troy, MI) and 5.3 wt% dioctyl phthalate (DOP). The
individual green tapes were laminated at 7 MPa at 85 °C for 10 min into a MLC sample
which contained 45 active layers. The dimensions of the MLC sample after lamination
were 2.1×1.5×0.17 cm.
The poly(propylene carbonate) (PPC) based tape nominally consisted of 86.6 wt%
BaTiO3 (X7R 422H, Ferro, Niagara Falls, NY), 9.4 wt% polypropylene carbonate resin,
(PPC Q40-01, Empower Materials, Newark, DE), and 2.5 wt% DOP. The individual
green taps were too brittle for lamination into MLC samples. The size of each individual
tape was ~2.1×1.5×0.013 cm.
Experiments were conducted with carbon dioxide in a SS 316 (6.25 cm diameter,
500 ml) Parr high pressure non-stirred vessel. Four cycles, described in Table 5.1, were
evaluated which differ in the final pressure and whether air, and especially oxygen, was
removed from the vessel with a purge cycle. Individual tapes were exposed to either CO2
at low pressure (0.1 MPa) or to supercritical CO2 at high pressure (30±1 MPa). For the
high pressure cycle with a purge step, carbon dioxide was added to the vessel at an initial
temperature of 22 °C until the pressure reached an initial value of 7-10 MPa. The final
pressure of 30 MPa was attained by heating the vessel to the dwell temperature, causing
the carbon dioxide to thermally pressurize. For the high pressure cycle with no purge
step, the vessel containing air was pressurized with carbon dioxide at the dwell
temperature. At the end of each cycle, the amount of organic removal was determined

80
from the weight loss of the samples, normalized by the total amount of organic content
initially present.
Table 5.1 Details of the four cycles evaluated.
Low Pressure Cycle (0.1 MPa)
High Pressure Cycle (30 MPa)
Purge (O2 removed)
a) 3 min CO2 purge at 22 °C b) Sample exposed to flowing CO2
during heating ramp c) Dwell 1 h in flowing CO2 at
high temp. d) Remove sample at dwell temp.
in air
a) 3 min CO2 purge at 22 °C b) Pressurization with CO2 to 7-10
MPa at 22 °C followed by thermal pressurization during the heating ramp to 30 MPa
c) Dwell 1 h at high temp. d) Depressurize at dwell temp. in
30±5 min, then remove sample in air
No Purge (O2 present)
a) No purge at 22 °C b) Sample exposed to stagnant air
during heating ramp c) Dwell 1 h in flowing CO2 at
high temp. d) Remove sample at dwell temp.
in air
a) No purge at 22 °C b) Sample exposed to stagnant air
during heating ramp c) Pressurization with CO2 to 30
MPa at dwell temp. d) Dwell 1 h at high temp. e) Depressurize at dwell temp. in
30±5 min, then remove sample in air

81
5.2 RESULTS AND DISCUSSION
Figure 5.2 shows the percentage of binder removed from the PPC-based samples
after being subjected to each of the four cycles listed in Table 5.1. For each cycle, the
degree of binder removal generally increased with increasing temperature. At low
temperature, each sample experienced a higher percentage of weight loss when operating
at 30 MPa instead of 0.1 MPa, regardless of whether a purge was used. When operating
with a purge cycle, the maximum amount of binder removed was 74 wt% and occurred at
150 °C and 0.1 MPa. The weight loss of the samples may be attributed to an equilibrium
that exists between propylene oxide (PO), carbon dioxide (CO2), and PPC according to
the reversible chemical reaction:
PPC CO2 + PO (5.1)
From the data given in Figure 5.2, it is possible that the presence of carbon dioxide at
high temperatures and low pressures may cause the chemical reaction equilibrium to shift
to the right, which in turn leads to more weight loss. For these samples, no defects were
observed at any temperature.
When operating with no purge cycle, the presence of residual air showed a strong
effect on the degree of binder removal at temperatures and pressures ranging from 120-
150 °C and 0.1-30 MPa. When operating with no purge at 150 °C, regardless of pressure,
the organic content of the samples was removed almost completely. This high degree of
binder removal may be attributed to the oxidative degradation of the PPC binder. For the
high pressure cycle, defect formation in the samples was observed at each temperature,

82
but for the low pressure cycle defects were only seen at 150 °C. These defects may be
contributed to the fragile nature of the green body as a result of oxidative degradation.
Figure 5.2: Weight loss of PPC-based tapes subjected to different operating conditions.
The asterisk (*) denotes that the sample exhibited defects.
The amount of binder removed from the PVB-based samples using each of the
four cycles listed in Table 5.1 is shown in Figure 5.3. For these tapes, defect formation
was never introduced into the green body under any set of conditions. Also, no
significant advantage in the percent weight loss was evident between operating with or
without a purge cycle. When operating at 90 °C, the degree of binder removal varied
from 5 wt% to 41 wt% depending on whether a pressure of 0.1 MPa or 30 MPa was used,
respectively. The high percentage of weight loss while operating at 30 MPa can be
attributed to the extraction of the low molecular weight DOP constituent, which is known
in the literature to be highly soluble in supercritical carbon dioxide [8-10,15]. For the
30 MPa
*
0.1 MPa
*
*
30 MPa*
0.1 MPa
0
20
40
60
80
100
80 100 120 140 160
Wei
ght L
oss
(%)
Temperature (°C)
Purge with Thermal PressurizationNo Purge with Pressurization at Dwell

83
cycles conducted at 120-150 °C, the percent weight loss of each sample remained within
39-44%, regardless of the type of cycle used.
Figure 5.3: Weight loss of PVB-based tapes subjected to different operating conditions.
Figure 5.4 shows the percentage of binder removed from the acrylic-based
samples after being subjected to each of the four cycles listed in Table 5.1. As compared
to the results in Figures 5.2 and 5.3, the total amount of organic material extracted from
each sample was substantially less. For this binder system, a higher percentage of weight
loss was observed at each condition while operating at 30 MPa as opposed to 0.1 MPa.
The maximum amount of binder removed was 8.6 wt% and occurred while operating at
90 °C and 30 MPa with a purge cycle. The low percentage of weight loss is consistent
with the lower solubility of the acrylic/adipate binder in supercritical carbon dioxide [15].
Defect formation was observed in two of the acrylic-based samples while operating
30 MPa
0.1 MPa
0.1 MPa
30 MPa
0
10
20
30
40
50
80 100 120 140 160
Wei
ght L
oss
(%)
Temperature (°C)
Purge with Thermal Pressurization No Purge with Pressurization at Dwell
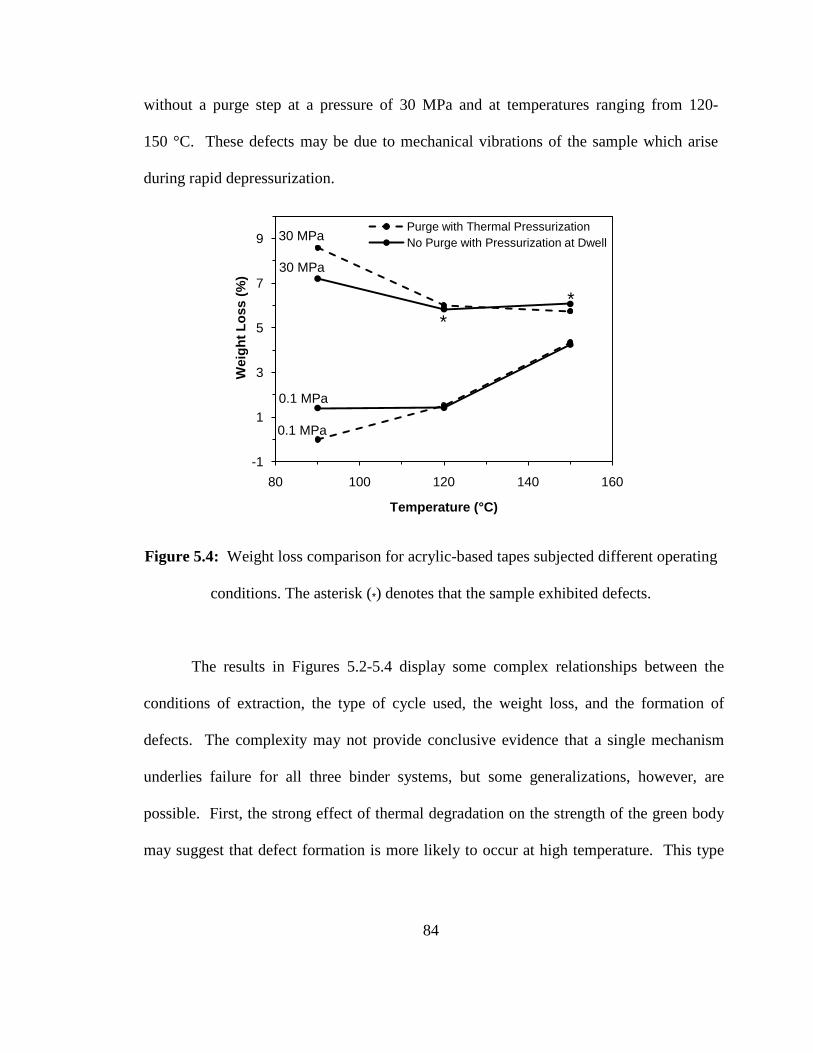
84
without a purge step at a pressure of 30 MPa and at temperatures ranging from 120-
150 °C. These defects may be due to mechanical vibrations of the sample which arise
during rapid depressurization.
Figure 5.4: Weight loss comparison for acrylic-based tapes subjected different operating
conditions. The asterisk (*) denotes that the sample exhibited defects.
The results in Figures 5.2-5.4 display some complex relationships between the
conditions of extraction, the type of cycle used, the weight loss, and the formation of
defects. The complexity may not provide conclusive evidence that a single mechanism
underlies failure for all three binder systems, but some generalizations, however, are
possible. First, the strong effect of thermal degradation on the strength of the green body
may suggest that defect formation is more likely to occur at high temperature. This type
30 MPa
*
30 MPa
0.1 MPa
*
0.1 MPa
-1
1
3
5
7
9
80 100 120 140 160
Wei
ght L
oss
(%)
Temperature (°C)
Purge with Thermal Pressurization No Purge with Pressurization at Dwell

85
of defect was evident in the PPC-based and acrylic-based samples when operating with no
purge, i.e., in the presence of oxygen.
Based on the results contained in Figures 5.2-5.4, additional experiments were
conducted at the high pressure operating conditions under which defects were introduced
into the green ceramic tapes. For these experiments, the vessel was depressurized from
30 MPa to 0.1 MPa over a period of 90-120 minutes instead of 30 minutes. Table 5.2
shows that the formation of defects in green ceramic tapes was avoided by using longer
depressurization times.
Table 5.2. Effect of depressurization time on the formation of defects.
PPC-Based Single Tapes Temperature
(°C) Pressure (MPa)
Depress Time (h)
Weight Loss (%)
Defects (yes/no)
90 30 0.5 24.7 yes 1.5 24.4 no
120 30 0.5 65.0* yes 2.0 52.5 no
150 30 0.5 267.6* yes 2.0 97.5 no
Acrylic-Based Single Tapes
Temperature (°C)
Pressure (MPa)
Depress Time (h)
Weight Loss (%) Defects
120 30 0.5 5.8 yes 2.0 4.4 no
150 30 0.5 36.0 yes 2.0 6.1 no
* Not all of the sample could be collected.

86
The results in Figures 5.2-5.4 and Table 5.2 indicate or suggest some best modes
of operation to avoid defect formation within ceramic green bodies while extracting
binder, i.e., when operating at high pressure. First, a purge cycle should be employed,
which may avoid oxidative degradation of the sample. Also, longer depressurization
times should be used, which may minimize both pressure gradients within the sample and
the effects of vibration accompanied with depressurization. In addition, thermal
expansion of the CO2 during the ramp may be a preferable mode of operation to achieve
high pressure, as compared to pressurizing the vessel at the dwell temperature.
The best modes of operation described above were then applied to a previous
study, see Figure 5.5, which indicated that defects were always exhibited in acrylic-based
MLC samples, regardless of the extraction conditions used. Table 5.3 lists all of the
extraction conditions evaluated in the study as well as the appearance of the MLC after
depressurization. In general, the occurrence of defects in the acrylic-based samples
usually appeared as cracks or delamination located near the mid-plane of the MLC. The
occurrences of these defects in the acrylic-based MLC were credited to the insufficient
quantity of binder removed, which led to the formation of pressure gradients during
depressurization from supercritical conditions, and then to failure of the green body.
Because a much larger quantity of organic material was removed from the PVB-based
MLC, defects were observed much less frequently.
Because the acrylic-based and PVB-based MLC samples depicted in Figure 5.5
differ in composition, porosity, permeability, and size, it is not straightforward to
unambiguously determine the origin of defect formation. To assess the effect of size, the

87
acrylic-based MLC samples were cut into smaller pieces and then exposed to a cycle
which was nearly consistent with the high pressure cycle containing a purge step listed in
Table 5.1, except the vessel was depressurized over 7.5 hours instead of 30 minutes.
Figure 5.6a shows images of an acrylic-based MLC sample before and after being
subjected to supercritical carbon dioxide at 90 °C and 30 MPa for 1 hour; dimensions of
the MLC sample were equivalent to 1/4 of the original size. After SCE, which removed
4.5 wt% of the organic content, a large defect along the edge of the sample was exhibited.
This defect may be attributed to the formation of pressure gradients which arise during
depressurization from supercritical conditions.
a) b)
Figure 5.5: a) Image of an acrylic-based sample (2.2×2.0×1.0 cm) after depressurization
over 19 h after SCE in CO2 at 30 MPa at 90°C for 1 h [which resulted in defects]. b)
Image of a PVB-based sample (2.1×1.5×0.17 cm) after depressurization over 6 h after
SCE in CO2 at 40 MPa at 90°C for 1 h [which exhibited no defects] [15].

88
Table 5.3. Summary of extraction results from acrylic-based MLC samples at various
operating conditions.
Temperature (°C)
Pressure (MPa) Appearance
90 40 multiple cracks/delamination
55 10 vertical crack
90 30 multiple cracks/delamination
90 10 Delamination/other crack
In the next experiment, the above procedure was then repeated for the same type
of sample, but this time, the MLC was cut to a dimension of 1/32 of the original size.
Figure 5.6b shows images of the MLC before and after exposure to supercritical carbon
dioxide. After SCE, which removed 4.8 wt% of the organic fraction, a small
delamination was evident along the edge of the sample. Thus, even the smaller sized
acrylic-based MLC samples experience failure upon depressurization from supercritical
conditions. These results suggest that the formation of defects in the acrylic-based MLCs
cannot be avoided using the best mode of operation. Furthermore, the enhanced porosity
of the green body prior to depressurization from supercritical conditions remains the key
factor for avoidance of defect formation in MLCs, as described previously [15].
While evaluating the effect of MLC size on defect formation, a noticeable change
in weight loss became evident. Table 5.4 shows that the percent weight loss of the MLC
tends to increase as the size of the sample decreases. The higher percentage of weight
loss may be attributed to the increased surface area to volume ratio of the smaller sized
MLCs which, in turn, may have led to shorter diffusion paths. Furthermore, by reducing

89
the MLC size, less organic material is initially present upon exposure to supercritical
carbon dioxide.
Figure 5.6: Images of two different sized acrylic-based MLC samples before and after
subjection to supercritical carbon dioxide at 90 °C and 30 MPa for 1 hour. The
dimensions of each sample were (a) 2.2×2.0×0.24 cm and (b) 1.12×0.97×0.096 cm.
Table 5.4. Weight loss as a function of the size of acrylic-based MLCs after being
subjected to supercritical CO2 at conditions of 90 °C and 30 MPa for 1 h followed by a
7.5 h depressurization.
Fractional Size of MLC
Weight Loss (%)
Damaged (yes/no)
1 3.0 yes 1/4 4.5 yes 1/32 4.8 yes
2.2 × 2.0 × 0.24 cm 1.12 × 0.97 × 0.096 cm
Before After Before After(a) (b)

90
5.3 CONCLUSIONS
In the presence of oxygen, more defects occur in green tapes, which were
especially pronounced for the PPC-based and acrylic-based samples. For an enhanced
extraction and/or minimization of defects in green structures, the best mode of operation
employs (a) a purge cycle to remove and so as to avoid oxidization, (b) thermal expansion
of the CO2 during the ramp, and (c) longer depressurization times. The acrylic-based
MLCs always exhibited defects following SCE, regardless of the samples size or operating
conditions. This suggest that the formation of defects in the acrylic-based MLCs cannot
be avoided using the best mode of operation. Furthermore, the occurrences of defects may
be attributed to the lack of porosity within the green body prior to depressurization
supercritical conditions.

91
5.4 REFERENCES
1. J.A. Lewis, “Binder Removal from Ceramics,” Ann. Rev. Mater. Sci., 27, 147-173
(1997).
2. I. E. Pinmill, M. J. Edirisinghe, M. J. Bevis, “Development of Temperature
Heating Rate Diagrams for the Pyrolytic Removal of Binder Used for Powder
Injection Moulding,” J. Mater. Sci., 27 4381-4388 (1992).
3. B. Peters, S. J. Lombardo, “Optimization of Multi-layer Ceramic Capacitor
Geometry for Maximum Yield During Binder Burnout,” J. Mater. Sci: Mater.
Electron., 12 403-409 (2001).
4. D. W. Matson and R. D. Smith, “Supercritical Fluid Technologies for Ceramic-
Processing Applications,” J. Am. Ceram. Soc., 72 [6] 871-881 (1989).
5. T. Chartier, M. Ferrato, J. F. Baumard, “Supercritical Debinding of Injection
Molded Ceramics,” J. Am. Ceram. Soc., 78 [7] 1787-1792 (1995).
6. T. Chartier, E. Delhomme, J. F. Baumard, “Mechanisms of Binder Removal
Involved in Supercritical Debinding of Injection Moulded Ceramics,” J. Phys. III,
7 [2] 291-302 (1997).
7. T. Chartier, E. Delhomme, J. F. Baumard, “Solubility, in Supercritical Carbon
Dioxide, of Paraffin Waxes Used as Binders for Low-Pressure Injection
Molding,” Ind. Eng. Chem. Res., 38 [5] 1904-1910 (1999).

92
8. R. V. Shende, D. S. Krueger, S. J. Lombardo, “Supercritical Extraction of Binder
Containing Poly(vinyl butyral) and Dioctyl phthalate from Barium Titanate-
Platinum Multilayer Ceramic Capactiors,” J. Mater. Sci.: Mater. Electron., 12,
637-643 (2001).
9. R. V. Shende, S. J. Lombardo, “Supercritical Extraction with Carbon Dioxide and
Ethylene of Poly(vinyl butyral) and Dioctyl phthalate from Multilayer Ceramic
Capacitors,” J. Supercrit. Fluids, 23 [2] 153-162 (2002).
10. R. V. Shende, M. Kline, S. J. Lombardo, “Effects of Supercritical Extraction on
the Plasticization of Poly(vinyl butyral) and Dioctyl phthalate films,” J. Supercrit.
Fluids, 28, 113-120 (2004).
11. M. Ude, M. A.-Khorassani, L. T. Taylor, “Supercritical Fluid Extraction of
Plasticizers in Poly(vinyl butyral) (PVB) and Analysis by Supercritical Fluid
Chromatography,” Chromatographia, 55, 743-748 (2002).
12. F. Bordet, T. Chartier, J. F. Baumard, “The Use of Co-Solvents in Supercritical
Debinding of Ceramics,” J. European Ceram. Soc., 22 [7] 1067-1072 (2002).
13. K. Morita, H. Okinaka, G. Itakura, K. Ohnaka, “A Plasticizer Removal Method in
Electroceramic Green Bodies Using Supercritical CO2,” J. Electrochem. Soc., 150
[9] G548-G552 (2003).
14. K. Morita, “Generation Mechanism of Defects on Electroceramic Green Bodies
During Supercritical Plasticizer Removal,” J. Electrochem. Soc., 150 [9] G543-
G547 (2003).

93
15. K. Krishnamurthy and S. J. Lombardo, “Pressure Distribution and Defect
Formation in Green Ceramic Bodies During Supercritical Extraction of Binder,”
J. Am Ceram. Soc., 92 [2] 365-370 (2008).
16. T. Chartier, F. Bordet, E. Delhomme, J. F. Baumard, “Extraction of Binders from
Green Ceramic Bodies by Supercritical Fluid: Influence of the Porosity,” J.
European Ceram. Soc., 22 [9] 1403-1409 (2002).

94
CHAPTER 6
CONCLUSIONS AND FUTURE WORK

95
6.0 CONCLUSIONS
A combined supercritical extraction and thermal cycle has been developed to
remove binder from green MLCs. This process has shown a positive effect on both cycle
time and yield. A partial removal of the binder content in MLCs with supercritical
carbon dioxide lead to an increase in the gas permeability and a decrease in the adhesion
strength of the green body. Because the MLCs exposed to SCE could survive the
subsequent rapid TC, the increase in the gas permeability had a more pronounced effect
than did the reduction in adhesion strength. Furthermore, the upstream processing
conditions showed a direct impact on MLC yield. For MLCs of comparable size and
physical properties, a typical cycle used in industry would have lasted 50-150 hours,
which is much longer than the rapid cycle of ~14 hours developed in this work.
The residual carbon content in MLCs was affected by removing the organic
constituents with a combined SCECO2/TC instead of a TC alone. For the PVB-based
MLC samples with and without nickel metal electrodes, the combined cycle led to a 25-
30% reduction in the residual carbon content and to much less sample-to-sample
variation, as compared to a TC alone. Though a 93% weight loss was obtained after
exposing the PVB-based MLC samples to supercritical hexane, the mean %RC was only
reduced an additional 8.65% for the MLCs without nickel electrodes and 0.65% for the
MLCs with nickel electrodes, as compared to the SCECO2/TC results. For the acrylic-
based MLC samples, the mean %RC was nearly identical for the TC and SCECO2/TC
processes, and in fact was very close to the sensitivity of the instrument. This was

96
attributed to nearly complete oxidation, as the thermal cycle for these samples was
conducted in air.
The defects formed in the PPC-based and acrylic-based ceramic tapes occurred
much more frequently while removing the organic content in the presence of oxygen. A
best mode of operation was identified to enhance the quantity of organic material
extracted and to minimize the occurrence of defect formation in green ceramic structures.
This best mode employed the use of (a) a purge cycle to avoid oxidization, (b) thermal
expansion of the carbon dioxide during the ramp, and (c) longer depressurization times to
reduce mechanical vibrations. The acrylic-based MLCs always exhibited defects
following SCE, regardless of the operating conditions. Also, the percent weight loss of
the acrylic-based MLCs had a tendency to increase with decreasing sample size.

97
6.1 FUTURE WORK
The successful development of a combined supercritical extraction and thermal
cycle has indicated that the increased porosity within a MLC sample following SCE was
the major factor contributing to the survival of samples during a rapid thermal cycle.
This may suggest that as the porosity within a ceramic green body is increased, the rate of
thermal oxidization can also be increased. Thus, a valid follow-up study would be to
assess the development of a short thermal cycle where the rate of oxidation is initially
slow and then becomes more rapid as the porosity within the green body of the MLC
increases.
The effects of a combined supercritical extraction and thermal cycle resulted in a
25-30% reduction in the residual carbon content. This was attributed to a 32% weight
loss of the organic fraction after exposure to supercritical carbon dioxide at 90 °C,
30 MPa for three 1 hour cycles. After removing 93 wt% of the organic fraction with
supercritical hexane, however, little to no change was exhibited in the %RC. Though
these results were attributed to residual hexane possibly remaining in the sample, the
exact mechanism controlling the %RC left in samples following a thermal cycle was
never identified and needs to be further explored.
Finally, the formation of defects in the acrylic-based MLCs was always evident
after exposure to supercritical carbon dioxide. The defects within the MLCs were
attributed to the insignificant quantity of organic material removed prior to
depressurization from supercritical conditions. Therefore, it may be beneficial to further

98
explore the solubility of the acrylic/adipate binder system in different types of
supercritical fluids or at other supercritical conditions.