combined biogeophysical and biogeochemical effects of
TRANSCRIPT

Biogeosciences, 7, 1383–1399, 2010www.biogeosciences.net/7/1383/2010/doi:10.5194/bg-7-1383-2010© Author(s) 2010. CC Attribution 3.0 License.
Biogeosciences
Combined biogeophysical and biogeochemical effects of large-scaleforest cover changes in the MPI earth system model
S. Bathiany1,2, M. Claussen1,3, V. Brovkin 1, T. Raddatz1, and V. Gayler1
1Max Planck Institute for Meteorology, KlimaCampus, Hamburg, Germany2School of Integrated Climate System Sciences, KlimaCampus, University of Hamburg, Hamburg, Germany3Meteorological Institute, KlimaCampus, University of Hamburg, Hamburg, Germany
Received: 27 November 2009 – Published in Biogeosciences Discuss.: 18 January 2010Revised: 14 April 2010 – Accepted: 19 April 2010 – Published: 4 May 2010
Abstract. Afforestation and reforestation have become pop-ular instruments of climate mitigation policy, as forests areknown to store large quantities of carbon. However, theyalso modify the fluxes of energy, water and momentum at theland surface. Previous studies have shown that these biogeo-physical effects can counteract the carbon drawdown and, inboreal latitudes, even overcompensate it due to large albedodifferences between forest canopy and snow. This study in-vestigates the role forest cover plays for global climate byconducting deforestation and afforestation experiments withthe earth system model of the Max Planck Institute for Me-teorology (MPI-ESM). Complete deforestation of the trop-ics (18.75◦ S–15◦ N) exerts a global warming of 0.4◦C dueto an increase in CO2 concentration by initially 60 ppm anda decrease in evapotranspiration in the deforested areas. Inthe northern latitudes (45◦ N–90◦ N), complete deforestationexerts a global cooling of 0.25◦C after 100 years, while af-forestation leads to an equally large warming, despite thecounteracting changes in CO2 concentration. Earlier modelstudies are qualitatively confirmed by these findings. As theresponse of temperature as well as terrestrial carbon poolsis not of equal sign at every land cell, considering forests ascooling in the tropics and warming in high latitudes seems tobe true only for the spatial mean, but not on a local scale.
1 Introduction
As greenhouse gas concentrations are increasing rapidly, itis often discussed how carbon sinks can be generated in ad-dition to emission reductions. In this regard, the terrestrialbiosphere plays an important role. It is estimated to have
Correspondence to:S. Bathiany([email protected])
stored about 166 GtC (about 34% of total anthropogenic car-bon) during the last two centuries, while total emissions of200 GtC are attributed to deforestation in this period (House,2002). The Kyoto Protocol takes afforestation into accountby considering such changes in carbon pools. As Pielke etal. (2002) point out, carbon has thus become the currencyto assess the human influence on global climate. However,the vegetation cover also affects important parameters of theland surface such as albedo, roughness length and hydro-logical properties (Nobre et al., 2004; Pielke et al., 1998).With few exceptions, the albedo of forest canopies is lowerthan the albedo of other vegetation or bare soil (Alton, 2009).Therefore, the net radiation at the surface tends to be largerwhich acts to increase near ground temperatures. In boreallatitudes, albedo differences are particularly large when snowis present, as the snow cover may be partly masked by treesbut not by herbaceous vegetation. In the tropics, the influ-ence of forests on the water cycle is also important: tropi-cal forests are characterised by large evapotranspiration (ET)which acts to cool the surface. Due to deep roots, soil mois-ture can be returned to the atmosphere more efficiently (No-bre et al., 2004). In addition, trees increase the surface rough-ness, which leads to larger diffusive fluxes. Without furtherfeedbacks, this would also lead to a cooling because the lossof energy has to be compensated by the surface net radiation.On the other hand, changes in wind speed and direction canlead to circulation changes (Sud et al., 1996), whose impacton temperature is less definite. Which mechanism prevails isa result of many nonlinear interactions and thus critically de-pends on the imposed changes and the original climate (Pit-man et al., 2004). Moreover, these biogeophysical effectsare linked to changes in the carbon cycle (biogeochemicaleffects) by several processes such as the dependence of tran-spiration on productivity and the dependence of plant physi-ology and structure on atmospheric CO2 concentration (Bettset al., 1997).
Published by Copernicus Publications on behalf of the European Geosciences Union.

1384 S. Bathiany et al.: Biogeophysical and biogeochemical effects of large-scale forest cover changes
Studies of the net effect of historical land cover changeon global temperature have shown that biogeophysical andbiogeochemical mechanisms are of the same order of magni-tude (Matthews et al., 2004; Brovkin et al., 2006). Therefore,in order to quantifiy the impacts of large scale land coverchanges appropriately, both effects should also be included.Claussen et al. (2001) used the intermediate complexitymodel CLIMBER-2 to implement a complete afforestationand deforestation in different latitude bands. A factor sepa-ration yielded a cooling biogeochemical, but a warming bio-geophysical contribution of increased forest cover in eachlatitude. With combined effects they found a temperaturedecrease (increase) resulting from afforestation (deforesta-tion) in the tropics but the opposite effect in high northernlatitudes. This result was confirmed by Bala et al. (2007),who applied a GCM with a coupled carbon cycle (INCCA).Betts (2000) used the radiative transfer model of HadAM3to estimate the radiative forcing due to afforestation withconifer plantations in boreal latitudes. His geographically ex-plicit calculation indicates that the masking of snow may notbe the dominant mechanism everywhere, although on aver-age a mean positive forcing was obtained. Other studies evenchallenge the warming influence of boreal forests for largerscales: Schaeffer et al. (2006) analysed the possibilities ofextratropical afforestation based on socio-economically real-istic scenarios for the 21st century. Their study demonstratesthat the different time scales of biogeophysical and biogeo-chemical effects have to be considered. While the decrease inalbedo dominates the temperature response in the first half ofthe century, global mean surface air temperature is reducedin 2100. Bird et al. (2008) developed a conceptual stand-based model and obtain a net cooling from year 40 on whenthe model is applied to several sites in Canada. As the mainreason they identify the high cloud cover in spring which di-minishes the surface forcing despite large albedo differences.Further objection is presented by Spracklen et al. (2008),who argue that the emission of cloud condensation nucleifrom trees can cause a negative radiative forcing of severalW/m2 due to direct and indirect aerosol effects. Montenegroet al. (2009) used satellite observations to infer the potentialnet effect of small scale afforestation projects. They cameto the conclusion that in all latitudes CO2-sequestration isthe dominating mechanism with a mean efficiency of 50%.Furthermore, no clear dependency on latitude was found.Considering these results, it seems definite that albedo dif-ferences counteract the carbon drawdown of afforestation inboreal latitudes and that biogeophysical effects should alsonot be neglected in other regions. However, the sign andamplitude of the global mean temperature response remainssubject to many uncertainties.
In the following, the earth system model of the MaxPlanck Institute for Meteorology, MPI-ESM, is used to studythe sensitivity of the coupled system to large scale changes inforest cover. Apart from Bala et al. (2007), such an analysishas not yet been performed with a fully coupled AOGCM.
In addition to the model differences, the longer integrationtime and the comparison to an anthropogenically undisturbedclimate, this study differs from Bala et al. (2007) by con-sidering afforestation as well as deforestation experiments,whereas biogeophysical and biogeochemical contributionsare not calculated separately. Section 2 gives a short descrip-tion of the model and the implementation of the experiments.The resulting changes in global mean temperature and thecarbon cycle are presented in Sect. 3.1, while regional bio-geophysical mechanisms and their feedbacks on the carboncycle are presented in Sect. 3.2. In Sect. 4 these results arediscussed with regard to previous studies of large-scale landcover changes, while final conclusions are drawn in Sect. 5.
2 Model and experiment setup
MPI-ESM consists of the atmosphere general circulationmodel ECHAM5 (Roeckner et al., 2003), the land surfacemodel JSBACH (Raddatz et al., 2007), the ocean modelMPIOM (Jungclaus et al., 2006) and the ocean biogeo-chemistry model HAMOCC5 (Maier-Reimer et al., 2005).ECHAM5 was run in T31 resolution (3.75◦) with 19 verti-cal levels, MPIOM with approx. 3◦ and 40 vertical levels.JSBACH includes a dynamic vegetation module (Brovkin etal., 2009) which is based on a tiling approach. Within thevegetated fraction of each grid box eight different plant func-tional types (PFTs) are considered: tropical and extratropi-cal trees (both deciduous and evergreen), raingreen and coldshrubs, and C3- and C4-grasses. Seven pools of land carbonare distinguished in the model: a green pool, a reserve pooland a woody pool (the sum of these is referred to as livingbiomass), two litter pools and two soil pools. The photosyn-thesis scheme is based on Farquhar (1980) and for C4-grasson Collatz (1992). Soil respiration is calculated accordingto a Q10-model and is linearly dependent on soil moisture,which is represented by a “bucket” approach. Physical landsurface parameters such as albedo and roughness length arecalculated from the individual properties of the PFTs andbare ground, weighted with their cover fractions for eachland grid cell.
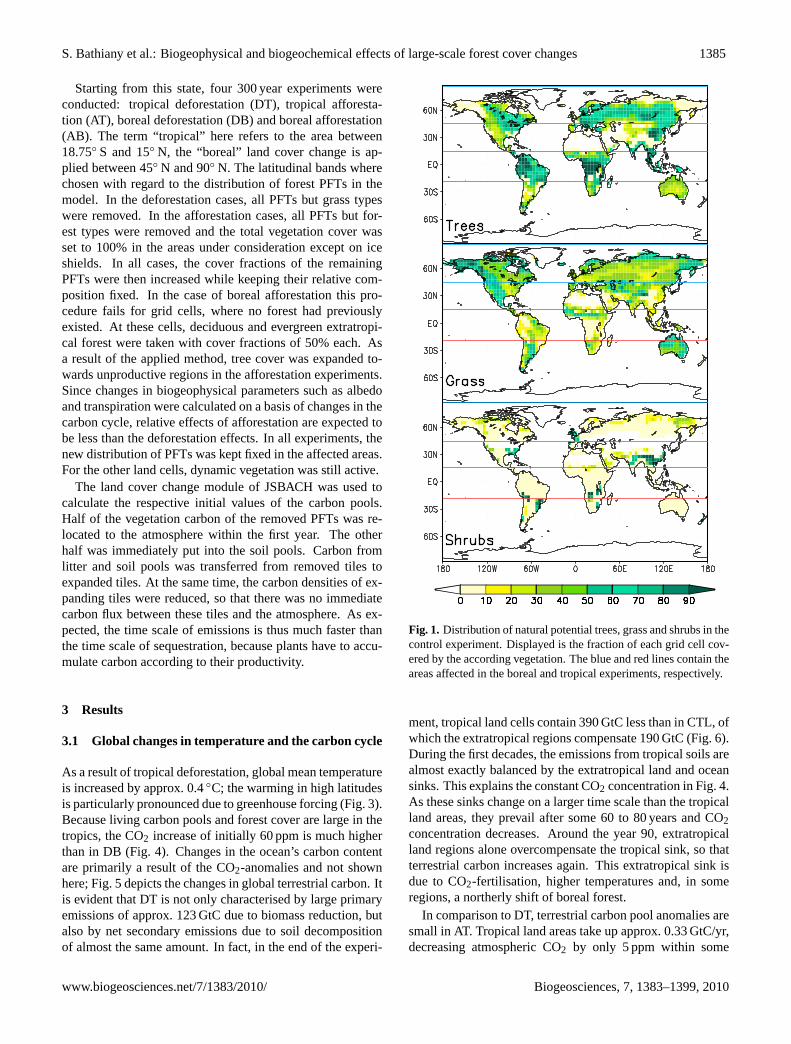
The equilibrium CO2 concentration in the control run(CTL) amounts to 275 ppm. Orbital parameters were keptfixed at present day values and no anthropogenic land usewas prescribed. Compared to observations, forest cover(Fig. 1) is distributed reasonably well in most parts of theglobe (Brovkin, 2009). However, the equilibrium carbonstorage (Fig. 2) differs from observations: In comparisonwith Prentice et al. (2001), the model underestimates carbonpools of plants and litter in boreal latitudes (2–6 kg/m2 in-stead of a mean of 4–6 kg/m2), while soil carbon is too largein central and eastern Asia. In the tropics, vegetation car-bon seems to be better represented, while soil carbon poolsof 20–40 kg/m2 exceed observations by a factor of 2.
Biogeosciences, 7, 1383–1399, 2010 www.biogeosciences.net/7/1383/2010/
S. Bathiany et al.: Biogeophysical and biogeochemical effects of large-scale forest cover changes 1385
Starting from this state, four 300 year experiments wereconducted: tropical deforestation (DT), tropical afforesta-tion (AT), boreal deforestation (DB) and boreal afforestation(AB). The term “tropical” here refers to the area between18.75◦ S and 15◦ N, the “boreal” land cover change is ap-plied between 45◦ N and 90◦ N. The latitudinal bands wherechosen with regard to the distribution of forest PFTs in themodel. In the deforestation cases, all PFTs but grass typeswere removed. In the afforestation cases, all PFTs but for-est types were removed and the total vegetation cover wasset to 100% in the areas under consideration except on iceshields. In all cases, the cover fractions of the remainingPFTs were then increased while keeping their relative com-position fixed. In the case of boreal afforestation this pro-cedure fails for grid cells, where no forest had previouslyexisted. At these cells, deciduous and evergreen extratropi-cal forest were taken with cover fractions of 50% each. Asa result of the applied method, tree cover was expanded to-wards unproductive regions in the afforestation experiments.Since changes in biogeophysical parameters such as albedoand transpiration were calculated on a basis of changes in thecarbon cycle, relative effects of afforestation are expected tobe less than the deforestation effects. In all experiments, thenew distribution of PFTs was kept fixed in the affected areas.For the other land cells, dynamic vegetation was still active.
The land cover change module of JSBACH was used tocalculate the respective initial values of the carbon pools.Half of the vegetation carbon of the removed PFTs was re-located to the atmosphere within the first year. The otherhalf was immediately put into the soil pools. Carbon fromlitter and soil pools was transferred from removed tiles toexpanded tiles. At the same time, the carbon densities of ex-panding tiles were reduced, so that there was no immediatecarbon flux between these tiles and the atmosphere. As ex-pected, the time scale of emissions is thus much faster thanthe time scale of sequestration, because plants have to accu-mulate carbon according to their productivity.
3 Results
3.1 Global changes in temperature and the carbon cycle
As a result of tropical deforestation, global mean temperatureis increased by approx. 0.4◦C; the warming in high latitudesis particularly pronounced due to greenhouse forcing (Fig. 3).Because living carbon pools and forest cover are large in thetropics, the CO2 increase of initially 60 ppm is much higherthan in DB (Fig. 4). Changes in the ocean’s carbon contentare primarily a result of the CO2-anomalies and not shownhere; Fig. 5 depicts the changes in global terrestrial carbon. Itis evident that DT is not only characterised by large primaryemissions of approx. 123 GtC due to biomass reduction, butalso by net secondary emissions due to soil decompositionof almost the same amount. In fact, in the end of the experi-
Fig. 1. Distribution of natural potential trees, grass and shrubs in thecontrol experiment. Displayed is the fraction of each grid cell cov-ered by the according vegetation. The blue and red lines contain theareas affected in the boreal and tropical experiments, respectively.
ment, tropical land cells contain 390 GtC less than in CTL, ofwhich the extratropical regions compensate 190 GtC (Fig. 6).During the first decades, the emissions from tropical soils arealmost exactly balanced by the extratropical land and oceansinks. This explains the constant CO2 concentration in Fig. 4.As these sinks change on a larger time scale than the tropicalland areas, they prevail after some 60 to 80 years and CO2concentration decreases. Around the year 90, extratropicalland regions alone overcompensate the tropical sink, so thatterrestrial carbon increases again. This extratropical sink isdue to CO2-fertilisation, higher temperatures and, in someregions, a northerly shift of boreal forest.
In comparison to DT, terrestrial carbon pool anomalies aresmall in AT. Tropical land areas take up approx. 0.33 GtC/yr,decreasing atmospheric CO2 by only 5 ppm within some
www.biogeosciences.net/7/1383/2010/ Biogeosciences, 7, 1383–1399, 2010

1386 S. Bathiany et al.: Biogeophysical and biogeochemical effects of large-scale forest cover changes
Fig. 2. Carbon storages in kg/m2 for different pools of the control run.
Fig. 3. Anomalies in 2 m-temperature averaged over the final 200 years for each experiment. White areas show no significant changesaccording to a t-test with 95% significance.
decades. Thereafter, net emissions by the ocean and the ex-tratropical biosphere are large enough to balance the tropicalanomaly which approaches an equilibrium in the final cen-tury. Global mean temperature decreases by only 0.06◦C.Changes in AT are much smaller than in DT, because theconverted area is smaller. Besides, climatic limitations playa role, as will be discussed in Sect. 3.3.
Things look quite different in the boreal experiments. InDB only approx. 20 GtC are emitted instantaneously due tothe lower carbon storage of living biomass in boreal latitudes.The trend in global terrestrial carbon is close to zero because
soil respiration in the cold regions is slow enough to be com-pensated by an enhanced productivity in the tropics. There-fore, the ocean uptake alone is responsible for the reductionof the CO2-anomaly from 10 ppm to 3.7 ppm within the first60 years. An additional reason for the slow response in thecarbon pools of the deforested region is the large proportionof litter. Due to the experiment setup, litter is redistributed toexpanding tiles and not put into the soil pools immediately.Because of the increased litter flux during the first decades,soil carbon is first increased before it returns to its originalanomaly of +20 GtC at the end of the experiment.
Biogeosciences, 7, 1383–1399, 2010 www.biogeosciences.net/7/1383/2010/

S. Bathiany et al.: Biogeophysical and biogeochemical effects of large-scale forest cover changes 1387
Fig. 4. Evolution of atmospheric CO2 in each experiment.
In the case of AB, extratropical as well as tropical re-gions exchange much more carbon than in AT. Large areasare available especially in the northern regions, where mostadditional terrestrial carbon is stored at the end of the experi-ment (Fig. 6). In the first 15 years 20 GtC are taken up by thebiosphere and CO2-concentration is reduced by 5 ppm in thisperiod. Thereafter the tropical and oceanic sources almostcompensate the sequestration. While pools of living biomassand litter become saturated at +35 GtC and +30 GtC in thelast decades, soil carbon increases almost linearly in the final200 years and already contains 40 GtC more than in CTL inthe year 300. As the time scale of tropical soils is shorter,they compensate a considerable part of the boreal sink (morethan 60 GtC by the year 300), about twice as much as theocean. Despite the CO2 forcing, global mean temperatureincreases in AB (and decreases in DB) by approx. 0.25◦C. Itis thus evident that biogeophysical mechanisms dominate theglobal mean temperature response in the boreal experiments.
Although global mean terrestrial carbon anomalies arenegative after deforestation and positive after afforestation,it is apparent in Fig. 6 that there are regions with a reversedsign. This is due to two reasons: first, plant productivity isaltered by the exchange of PFTs and changes in CO2 concen-tration. Second, the climatic changes feed back on the localcarbon pools. By rescaling the carbon pools of the indivi-dual tiles in CTL according to their altered cover fractions,the contributions of the PFT exchange alone can be obtainedfor each experiment. The difference to the actual changes isthen due to climate and CO2 feedbacks (neglecting all syner-gies). These feedbacks can be further separated by inferringchanges in NPP and soil respiration with the same method.
The spatial averages of carbon pools in and outside theareas of land cover change are presented in Table 1. Forsoil carbon, the feedback calculation explained above wasapplied. The separated impact of the redistribution of coverfractions is refered to as uncoupled. In DT, all contribu-tions act to decrease the tropical carbon pools which explains
Fig. 5. Evolution of anomalies in global terrestrial carbon in eachexperiment.
the large secondary emissions in this experiment. Climate-carbon cycle feedbacks reduce the sequestration in AT andAB (as will be further discussed in Sect. 3.2), while in DBthe larger productivity of grass would even lead to a meangain in boreal soil carbon. Indeed, soil carbon has not atall contributed to secondary emissions by the year 300, incontrast to the litter pools. It has to be considered though,that soil carbon pools have not reached an equilibrium by theyear 300 in DB and AB. The absolute feedback contributionwould therefore further decrease, because it is only inferredas a residual.
As an afforestation project in reality will be most efficientin terms of carbon storage where a converted area has thestrongest possible carbon uptake, the changes in carbon stor-age are also calculated with reference to the absolute changesin forest area only (Table 2). In the tropics, deforestation stillhas a much larger impact on carbon storage than afforesta-tion because of the climatic limitations in the dry regions. Inboreal areas, living biomass and litter are also less affected inAB than in DB. However, additional carbon is stored in thesoil. It is evident that in AT and DB, where changes in soilcarbon counteract the changes in biomass, the soil anomaliesare smaller than in the corresponding experiments DT andAB. The difference between afforestation and deforestationillustrates that for the whole area afforestation still leads toa gain and deforestation to a loss in soil carbon. Moreover,Table 2 documents that in all experiments the global meananomalies are of the same sign as the immediate change inbiomass, despite all productivity differences and feedbacks.
3.2 Regional mechanisms and feedbacks
3.2.1 The tropical energy balance
Local temperature changes can be understood by analysingthe surface energy balance as presented in Table 3: in DTa warming occurs despite of the increase in surface albedo
www.biogeosciences.net/7/1383/2010/ Biogeosciences, 7, 1383–1399, 2010

1388 S. Bathiany et al.: Biogeophysical and biogeochemical effects of large-scale forest cover changes
Fig. 6. Total land carbon anomalies in kg/m2 for each experiment, averaged over the final 10 years.
Table 1. Terrestrial carbon storage anomalies in kg/m2, averaged over the manipulated land cells and the final 10 years of each experiment(ice sheets not included).
Area Pools DT AT DB AB
Directly affected latitudes Total –11.71 +1.41 –1.43 +2.71Living biomass and litter –8.60 +1.75 –1.88 +1.70Soil (uncoupled) –2.46 +1.24 +0.33 +1.38Soil (feedbacks only) –0.64 –1.58 +0.12 –0.37
Other land areas Total +1.74 –0.20 +0.42 –0.68Living biomass and litter +0.27 –0.01 +0.12 –0.07Soil +1.47 –0.19 +0.30 –0.61
Global Total –1.51 +0.19 –0.15 +0.37Living biomass and litter –1.87 +0.42 –0.50 +0.48Soil (uncoupled) –0.60 +0.30 +0.10 +0.43Soil (feedbacks only) +0.96 –0.53 +0.24 –0.54
Table 2. Terrestrial carbon storage anomalies in kg/m2, averaged over the areas of changed forest cover and the final 10 years of eachexperiment (ice sheets not included).
Pools DT AT AT-DT DB AB AB-DB
Total –16.66 4.39 21.05 –3.06 4.46 7.52Living biomass and litter –12.23 5.45 17.68 –4.02 2.80 6.82Soil (uncoupled) –3.5 3.86 7.36 0.71 2.27 1.56Soil (feedbacks only) –0.91 –4.92 –4.01 0.06 –0.61 –0.67Soil, total –4.41 –1.06 3.35 0.77 1.66 0.89
Biogeosciences, 7, 1383–1399, 2010 www.biogeosciences.net/7/1383/2010/

S. Bathiany et al.: Biogeophysical and biogeochemical effects of large-scale forest cover changes 1389
Table 3. The surface energy balance averaged over tropical and boreal land cells. Values for the experiments are given as deviations fromthe control climate. All fluxes are in W/m2, surface temperature in◦C. For DT, the time periods 11–60 and 271–300 have been consideredseparately, all other runs are averaged over the years 11–300.αsurf= surface albedo,αTOA = planetary albedo, SW = short-wave, LW = long-wave,Rn = net radiation, SH = sensible heat flux, LH = latent heat flux,Tsurf= surface temperature.
Tropics (18.75◦ S–15◦ N) Boreal (45◦ N–90◦ N) Boreal, MAM
CTL 1 DT 1 DT 1 AT CTL 1 DB 1 AB CTL 1 DB 1 AB
yr 11–60 yr 271–300
αsurf 0.159 +0.042 +0.042 –0.017 0.269 +0.070 –0.075 0.350 +0.107 –0.128αTOA 0.316 +0.004 +0.007 –0.003 0.471 +0.017 –0.018 0.493 +0.023 –0.023SW↓ 215.5 +8.1 +6.7 –2.7 96.9 +3.4 –2.9 134.4 +11.2 –11.5SW↑ 34.2 +10.8 +10.4 –4.1 26.1 +8.0 –7.8 47.0 +19.4 –19.7net SW 181.3 –2.6 –3.7 +1.4 70.8 –4.6 +4.9 87.4 –8.2 +8.2LW ↓ 390.4 +3.0 +1.9 +0.4 267.0 –4.1 +4.4 261.7 –7.6 +6.5LW ↑ 453.3 +7.5 +5.5 –0.7 305.1 –4.8 +5.2 299.7 –7.9 +6.9net LW –62.9 –4.5 –3.6 +1.1 –38.1 +0.6 –0.9 –38.0 +0.3 –0.4Rn 118.4 –7.1 –7.3 +2.5 32.7 –3.9 +4.0 49.4 –7.9 +7.8SH 39.3 +2.7 +1.4 +0.4 8.2 –1.7 +1.6 15.7 –2.6 +3.1LH 79.1 –9.8 –8.7 +2.0 22.6 –2.3 +2.4 23.6 –4.9 +4.4Tsurf 25.8 +1.2 +0.9 –0.1 –3.7 –1.1 +1.2 –4.5 –1.9 +1.7
Fig. 7. Anomalies in surface albedo (top) and planetary albedo (bottom) in %, averaged over the final 200 years for tropical deforestation(left) and tropical afforestation (right).
(Fig. 7). Without any feedbacks, this albedo increase wouldcause a reduction in net short-wave radiation by approx.10 W/m2. Instead, anomalies lie between –8 and +8 W/m2
because cloud cover is reduced by up to 0.06, with a meanof 0.028 over tropical land cells. Hence, the albedo changesat the top of the atmosphere in Fig. 7 are much less uniform.
www.biogeosciences.net/7/1383/2010/ Biogeosciences, 7, 1383–1399, 2010
1390 S. Bathiany et al.: Biogeophysical and biogeochemical effects of large-scale forest cover changes
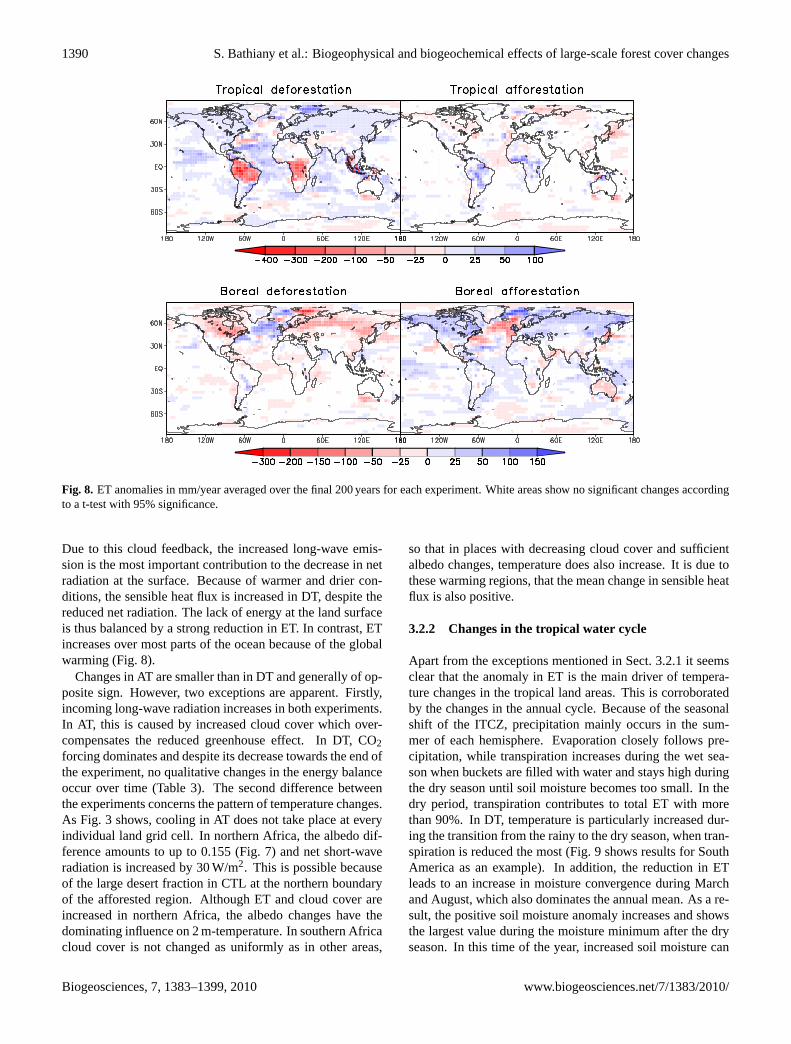
Fig. 8. ET anomalies in mm/year averaged over the final 200 years for each experiment. White areas show no significant changes accordingto a t-test with 95% significance.
Due to this cloud feedback, the increased long-wave emis-sion is the most important contribution to the decrease in netradiation at the surface. Because of warmer and drier con-ditions, the sensible heat flux is increased in DT, despite thereduced net radiation. The lack of energy at the land surfaceis thus balanced by a strong reduction in ET. In contrast, ETincreases over most parts of the ocean because of the globalwarming (Fig. 8).
Changes in AT are smaller than in DT and generally of op-posite sign. However, two exceptions are apparent. Firstly,incoming long-wave radiation increases in both experiments.In AT, this is caused by increased cloud cover which over-compensates the reduced greenhouse effect. In DT, CO2forcing dominates and despite its decrease towards the end ofthe experiment, no qualitative changes in the energy balanceoccur over time (Table 3). The second difference betweenthe experiments concerns the pattern of temperature changes.As Fig. 3 shows, cooling in AT does not take place at everyindividual land grid cell. In northern Africa, the albedo dif-ference amounts to up to 0.155 (Fig. 7) and net short-waveradiation is increased by 30 W/m2. This is possible becauseof the large desert fraction in CTL at the northern boundaryof the afforested region. Although ET and cloud cover areincreased in northern Africa, the albedo changes have thedominating influence on 2 m-temperature. In southern Africacloud cover is not changed as uniformly as in other areas,
so that in places with decreasing cloud cover and sufficientalbedo changes, temperature does also increase. It is due tothese warming regions, that the mean change in sensible heatflux is also positive.
3.2.2 Changes in the tropical water cycle
Apart from the exceptions mentioned in Sect. 3.2.1 it seemsclear that the anomaly in ET is the main driver of tempera-ture changes in the tropical land areas. This is corroboratedby the changes in the annual cycle. Because of the seasonalshift of the ITCZ, precipitation mainly occurs in the sum-mer of each hemisphere. Evaporation closely follows pre-cipitation, while transpiration increases during the wet sea-son when buckets are filled with water and stays high duringthe dry season until soil moisture becomes too small. In thedry period, transpiration contributes to total ET with morethan 90%. In DT, temperature is particularly increased dur-ing the transition from the rainy to the dry season, when tran-spiration is reduced the most (Fig. 9 shows results for SouthAmerica as an example). In addition, the reduction in ETleads to an increase in moisture convergence during Marchand August, which also dominates the annual mean. As a re-sult, the positive soil moisture anomaly increases and showsthe largest value during the moisture minimum after the dryseason. In this time of the year, increased soil moisture can
Biogeosciences, 7, 1383–1399, 2010 www.biogeosciences.net/7/1383/2010/

S. Bathiany et al.: Biogeophysical and biogeochemical effects of large-scale forest cover changes 1391
Table 4. Changes in surface temperature (T ), precipitation (P ), evapotranspiration (ET) and moisture convergence (P -ET) in the Amazon(Am), central Amazon (Am-cent), tropical Africa (Af), South-Eastern Asia (SEA) and the whole tropics (Trop) in the years 11–300. Am-centconsists of 8 grid cells with the boundaries 73◦ W, 58◦ W, 7.5◦ S and the equator.
Area and 1T 1P 1ET 1(P -ET)Experiment
[◦C] [mm/yr] [mm/yr] [mm/yr]
Am (DT) +1.6 –138 (9.2%) –160 (13.3%) +22 (7.5%)Am (AT) –0.2 +44 (3.0%) +29 (2.5%) +15 (5.1%)Am-cent (DT) +3.4 –467 (25.1%) –342 (22.5%) –124 (37.1%)Am-cent (AT) –0.4 +79 (4.3%) +32 (2.1%) +47 (14.0%)Af (DT) +1.0 –75 (8.2%) –87 (10.9%) +12 (10.4%)Af (AT) –0.1 +27 (3.0%) +24 (3.0%) +3 (2.9%)SEA (DT) +1.0 –107 (8.5%) –135 (12.2%) +28 (17.7%)SEA (AT) –0.1 +20 (1.6%) +23 (2.1%) –3 (1.8%)Trop (DT) +1.2 –104 (8.7%) –122 (12.2%) +18 (9.5%)Trop (AT) –0.1 +33 (2.8%) +26 (2.6%) +7 (3.7%)
Fig. 9. Annual cycles averaged over the years 11–300 between18.75◦ S and the equator in South America. Temperature is in◦C,soil moisture in m, all fluxes in mm/day. Black: control climate,red: tropical deforestation, green: tropical afforestation.
outweigh the reduced productivity of grass so that transpi-ration is equal or in some regions even higher than in CTL.The temperature increase is then probably only due to theelevated CO2 concentration.
Table 4 summarises the annual mean changes in precipita-tion, ET and moisture convergence for different regions. InDT, the decrease in relative humidity and increase in surfacealbedo act to supress convection which explains the reducedprecipitation. A large-scale sinking motion is induced in themid-troposphere over most tropical land cells, while a risinganomaly occurs over the surrounding tropical oceans withexception of the South Atlantic. In AT, opposite changes areobtained. Table 4 also documents that changes in the cen-tre of Amazonia are different from those in other regions.In central Amazonia, the reduction in precipitation is largeenough to exceed that of ET, so that mean moisture conver-gence and soil moisture decrease. The precipitation decreaseduring the dry season (Fig. 9) is mostly attributable to thisarea. Also, ET is decreased in the second half of the year, sothat the warming is even stronger during this time, with up to4◦C in September. The strong annual mean warming in cen-tral Amazonia which is evident in Fig. 3 is the result of thesedifferences in the seasonal cycle. In contrast, the surroundingareas show an increase in soil moisture and moisture conver-gence as is shown in Fig. 10. While they dominate the spatialmean in DT, this is not the case in AT. Therefore, tempera-ture in AT is mainly decreased (and soil moisture increased)in August and September. Because of the smaller size andthe dryer climate of the afforested areas, changes in AT aremuch smaller than in DT.
The distribution of soil moisture and its changes are alsoreflected in the tropical land carbon pool anomalies in Fig. 6,Tables 1 and 2. In the dry regions of Northern Australia andNorthern Africa, as well as in the north-east of South Amer-ica, grass is simulated to be more productive than forest, sothat deforestation leads to an increase and afforestation to aloss in soil carbon. In addition, the decreased moisture con-vergence in AT is accompanied by reduced soil moisture. Asa result, total tropical soil carbon in AT decreases, despite
www.biogeosciences.net/7/1383/2010/ Biogeosciences, 7, 1383–1399, 2010

1392 S. Bathiany et al.: Biogeophysical and biogeochemical effects of large-scale forest cover changes
Fig. 10. Changes in annual mean moisture convergence in mm/yr,averaged over the years 11–300 for tropical deforestation (top) andtropical afforestation (bottom). White areas show no significantchanges according to a t-test with 95% significance.
the fact that more wood carbon tends to increase the turnovertime. In the moist tropics, the increase (decrease) in soilmoisture in DT (AT) acts to increase NPP with the excep-tion of central Amazonia. Changes in soil moisture also havethe largest impact on soil respiration in both experiments, sothat respiration changes generally counteract the climatic ef-fects on NPP. For example, in DT central Amazonia shows anincreased turnover time even though the strongest warmingoccurs in this region.
3.2.3 The boreal energy balance
In the boreal experiments, temperature is mainly affected byalbedo changes due to snow masking (Fig. 11). The effectis strongest in spring when solar insolation is already largewhile snow cover is still high. As a result, land surface tem-perature anomalies are at a maximum during this season andreach 3◦C on zonal average. In DB, snow melt is delayedbecause of a lower spring temperature, while in AB it occursearlier than in CTL (Fig. 12). The mean albedo anomaly islarger in AB than in DB, as snow cover and converted area inthe northern parts are larger. It is due to the lower insolationthat temperature does not change more than in the deforesta-tion case. However, the temperature anomaly in AB stayslarge until summer, because snow melt occurs later in thenorth.
Due to the albedo changes the upwelling short-wave ra-diation is the largest contribution to the changes in net ra-diation (Table 3). In contrast to the tropics, the long-wavefluxes almost cancel each other. Annual mean changes incloud cover are also low: DB shows a decrease by 0.003,AB an increase by only 0.001, which is both about one orderof magnitude below the changes in the tropical experiments.Therefore, the changes in planetary albedo resemble those insurface albedo (Fig. 13). However, annual mean short-waveinsolation does change because of the seasonal and spatialdifferences in cloud cover. In winter and spring, cloud coveris decreased by deforestation in winter (particularly at thesouthern edge of the affected area, so that it still exerts a ra-diative effect) and increased in summer.
The cloud cover changes are in line with changes in thelatent heat flux. In DB, the growing season is delayed sothat transpiration is reduced by approx. 0.15 mm/day in May.Evaporation is reduced by more than 0.1 mm/day in earlyspring because of lower temperatures. In summer and au-tumn, an increase in moisture convergence leads to highersoil moisture, so that ET hardly deviates from the control cli-mate. This is in analogy to the situation at the end of thedry period in DT. Similar changes apply for AB but with op-posite sign. Annually averaged sensible heat flux anomaliesare smaller but of the same sign as the changes in latent heatflux. Outside the latitudes where land cover change was im-posed, zonal mean changes in radiative and diffusive fluxesare small.
As in the tropics, the climatic changes contribute to thechanges in carbon pools. In contrast to DT and AT however,the impact of temperature on NPP outweighs the CO2 fertil-ization and the effect of soil moisture, except at the southernedge of the affected area in central Asia. Changes in soilrespiration do not contribute significantly to the carbon poolanomalies with the exception of some land cells in easternAsia and western North America where soil moisture is al-tered the most.
3.2.4 Sea ice and circulation feedbacks in boreallatitudes
The locally induced temperature changes are subject to feed-backs on a larger scale which concern sea-ice cover as wellas the oceanic and atmospheric circulation. Although thechanges in sea ice cover found here show large fluctuations,differences between the experiments are apparent: In DB,even in the Arctic Ocean the relative increase of sea ice coveris only 0.6% and not significant in most places in the years101–300, although ice volume increases by 10.7% in this pe-riod. In the afforestation experiment, annual mean sea icecover in the Arctic Ocean is decreased by 2.4% in the years101–300 (1.65% in 151–300). The slightly stronger responsein AB is most probably due to the fact that the largest albedochanges over land are located in more northern areas than in
Biogeosciences, 7, 1383–1399, 2010 www.biogeosciences.net/7/1383/2010/

S. Bathiany et al.: Biogeophysical and biogeochemical effects of large-scale forest cover changes 1393
Fig. 11. Anomalies in surface albedo (top) and planetary albedo (bottom) in %, averaged over the final 200 years for boreal deforestation(left) and boreal afforestation (right).
DB. The difference between DB and AB is most discernablein autumn (Fig. 13): although the cooling over the ArcticOcean in DB is stronger than over the adjacent land in mostareas, the geographical pattern of the largest temperatureanomalies resembles the short-wave forcing. This is not thecase in AB, where the strongest warming occurs in proximityto the Arctic Ocean.
Changes in meridional overturning circulation (MOC) aremore pronounced than those in sea ice cover. As Fig. 3 illus-trates, the temperature response is weak and in some placeseven reversed in the north-western Atlantic in both experi-ments. In DB, the mass flux below 1000 m is increased by1.5 Sv from 15.7 to 17.2 Sv at 30◦ N on average over the fi-nal 200 years; in AB it is reduced by 1.5 Sv. At 60◦ N how-ever, overturning is strongly enhanced in DB (from 5.7 Svto 6.5 Sv), but hardly affected in AB (–0.1 Sv). This may berelated to the decrease in ice cover in AB, so that larger buoy-ancy fluxes than in CTL are obtained. Both, sea ice cover andoceanic circulation changes are reflected in the ET anomalies(Fig. 8), which are of the same order of magnitude as on land.
The boreal land cover changes also influence the atmo-spheric circulation. In DB the vertically extended coolingleads to an increase in baroclinity and thus in wind speeds intemperate northern latitudes, especially in spring. In 200 hPa,a zonal mean increase of up to 1 m/s is obtained. In con-trast, high level wind speed in the subtropics is decreased inthis season over the Atlantic and the Mediterranean. In AB,
Fig. 12. Surface temperature anomalies in◦C, albedo and snowcover in %, zonally averaged over all land cells during the final200 years for boreal deforestation (left) and boreal afforestation(right).
www.biogeosciences.net/7/1383/2010/ Biogeosciences, 7, 1383–1399, 2010

1394 S. Bathiany et al.: Biogeophysical and biogeochemical effects of large-scale forest cover changes
Fig. 13. Anomalies in 2 m-temperature in◦C and net short-wave radiation in W/m2 at the surface for boreal autumn averaged over the final200 years of the boreal deforestation (left) and boreal afforestation experiment (right).
corresponding zonal mean anomalies are found. How-ever, characteristic deviations from these zonal averages oc-cur. The spatial heterogenity of the surface flux anomaliesleads to barotropic Rossby wave patterns which show sea-sonal variations. In particular, an anticyclonic (cyclonic)anomaly occurs over south-eastern Europe in DB (AB) inspring which shifts to the east during the year. This shift indi-cates an interaction with a natural pattern: in CTL an anticy-clone is simulated over the North Atlantic in spring (Azoreshigh) which shows a similar shift and therefore seems to beextended to the east in DB and contracted in AB.
4 Discussion
4.1 Tropical experiments
Many GCM studies on the biogeophysical impact of large-scale deforestation in tropical regions have been conducted;a selection is presented in Table 5. Most of these stud-ies show an increase in temperature and a decrease in ETand precipitation, which is in line with the results presentedabove. In addition, the large-scale sinking in response tothe decrease in net energy at the surface is in accordancewith expectations (Mylne and Rowntree, 1992; Dirmeyer andShukla, 1994). The characteristic changes in surface energybalance and cloud cover also agree with CLIMBER-2 re-sults (Ganopolski et al., 2001), with the exception that down-welling long-wave radiation is increased in DT due to CO2emissions. Changes in moisture convergence and the annualcycle of precipitation are less definite. For example, Nobreet al. (1991), Henderson-Sellers et al. (1993), McGuffie etal. (1995) and Sud et al. (1996) find the largest decrease inAmazonian precipitation during the rainy season, whereas inDT the dry period is intensified in central Amazonia. The
comparison with the studies listed in Table 5 is subject tomany uncertainties which are introduced by the choice orcalculation of surface parameter values (Mylne and Rown-tree, 1992; Pitman et al., 1993; Dirmeyer and Shukla, 1994),the treatment of the ocean, different integration times and thedefinition of areas (McGuffie et al., 1995), as well as the ap-plied model. In addition, no change in CO2 concentrationwas accounted for in any of these experiments.
However, these differences may not explain why thechanges in central Amazonia are much larger than elsewhere.By also using MPI-ESM, but without taking carbon cycleeffects into account, Brovkin et al. (2009) find a similarlypronounced warming in Amazonia after global deforestation.Thus, these regional differences might rather be related to re-gional characteristics such as the amount of water recycling,which is known to be large in Amazonia (Nobre et al., 2004).For example, Pitman et al. (1993), McGuffie et al. (1995) andZhang et al. (1996) also find the largest reduction of moistureconvergence and the strongest (or only) temperature increasein Amazonia (Table 5). Sud et al. (1996) find a large warm-ing and an exceptional decrease in moisture convergence inAmazonia as compared to the tropical mean. Also, Claussenet al. (2001) obtain the strongest warming in South Americawith CLIMBER-2.
In South East Asia, the water balance is less influenced bylocal recycling but rather by the monsoon circulation (Zhanget al., 1996). Changes in precipitation and ET are smallerthan in Amazonia and the largest relative increase in moistureconvergence after deforestation is obtained. In comparison totropical Africa, absolute ET reduction in DT is larger whilethe temperature change is similar. The studies listed in Ta-ble 5 even report a cooling due to deforestation. Delire etal. (2001) obtained a reduction of SSTs due to increased
Biogeosciences, 7, 1383–1399, 2010 www.biogeosciences.net/7/1383/2010/

S. Bathiany et al.: Biogeophysical and biogeochemical effects of large-scale forest cover changes 1395
Table 5. Changes in surface temperature (T ), precipitation (P ), evapotranspiration (ET) and moisture convergence (P -ET) in Amazonia(Am), tropical Africa (Af), Indonesia (In), South-Eastern Asia (SEA) and the whole tropics (Trop) in previous (biogeophysical) modelstudies of large-scale deforestation. Zhang et al. (1996) refer to surface air temperature instead of ground surface temperature. In Pitman etal. (1993) this information is not definite.
Publication Area Remarks 1T 1P 1ET 1(P -ET)[◦C] [mm/yr] [mm/yr] [mm/yr]
Nobre et al. (1991) Am fixed SST +2.5 –643 –496 –147Mylne and Rowntree (1992) Am z0 unchanged, –0.11 –340 –179 –161
fixed SSTHenderson-Sellers et al. (1993)/ Am mixed-layer ocean +0.6 –588 –232 –356Pitman et al. (1993)Polcher and Laval (1994a) Am z0 unchanged, +3.8 +394 –985 +1379
fixed SSTPolcher and Laval (1994b) Am fixed SST +0.14 –186 –128 –58McGuffie et al. (1995) Am mixed-layer ocean +0.3 –437 –231 –206Sud et al. (1996) Am fixed SST +2.0 –540 –445 –95Zhang et al. (1996) Am mixed-layer ocean +0.3 –402 –222 –180Lean and Rowntree (1997) Am fixed SST +2.3 –157 –296 +139Polcher and Laval (1994a) Af z0 unchanged, +2.56 +88 –533 +621
fixed SSTPolcher and Laval (1994b) Af fixed SST +0.03 –99 –95 –4McGuffie et al. (1995) Af mixed-layer ocean –0.09 –108 –89 –19Zhang et al. (1996) Af mixed-layer ocean –0.02 –63 –74 +11Delire et al. (2001) In uncoupled n.s. –201 –201 0Polcher and Laval (1994b) In fixed SST –0.05 –281 –51 –230Pitman et al. (1993) SEA mixed-layer ocean –0.5 –19 –113 +94McGuffie et al. (1995) SEA mixed-layer ocean –0.69 –48 –128 +80Zhang et al. (1996) SEA mixed-layer ocean –0.2 –251 –138 –113Sud et al. (1996) Trop fixed SST +1.3 –266 –350 +84
upwelling. As CO2 concentration is increased in DT, thiscannot be expected here. However, a westward anomaly inocean surface speed occurs during boreal spring and summerdue to strengthened trade winds. The increase in SST is rel-atively low to the west of Indonesian land cells during thisperiod.
In addition to these regional differences, the deforestedcontinents may not be independent of each other. In Amazo-nia, the anomalies in moisture convergence (Fig. 10) hardlyextend to the Pacific because of the Andes, as is also dis-cussed by Lean and Rowntree (1997). In this regard it seemsplausible that in Africa the anomalies can affect the nearbyocean more easily. In Fig. 10 a dipole structure is evidentover the tropical Atlantic with more moisture convergencenorth and less moisture convergence south of the equator.This pattern is inherited by precipitation changes betweenJuly and October, which reflect a northerly shift of the ITCZ.Anomalies at the eastern boundary of South America couldthen propagate inland and add to the locally induced changes.However, to determine the extent to which the Amazonianclimate is influenced by land cover changes in Africa furtherstudies are needed.
4.2 Boreal experiments
With regard to the albedo induced cooling in spring andearly summer, other GCM-studies of large scale boreal defor-estation are qualitatively corroborated. Thomas and Rown-tree (1992) as well as Chalita and LeTreut (1994) analysedthe impact of albedo differences between closed snow coverand snow-covered forest. The temperature changes in MPI-ESM are similar to their results. Douville and Royer (1997)used the ARPEGE climate model and additionally consid-ered the change in roughness length. They found a tem-perature maximum of more than 3◦C in April and May be-tween 50◦ N and 60◦ N, similar to MPI-ESM. However, theduration of the cooling is much less than reported by Dou-ville and Royer: while they found a cooling of more than2◦C between December and June in the same latitudes, acomparable anomaly only persists for 3 months in MPI-ESM(Fig. 12). One reason might be the delayed snow melt inARPEGE.
It must be considered though, that in all three studies therewas no coupling between atmosphere and ocean. Bonanet al. (1992) and Ganopolski (2001) showed that if takingthe ocean into account, the cooling is stronger, more evenly
www.biogeosciences.net/7/1383/2010/ Biogeosciences, 7, 1383–1399, 2010

1396 S. Bathiany et al.: Biogeophysical and biogeochemical effects of large-scale forest cover changes
distributed over the year and geographically more extended.Bonan et al. (1992) found a cooling of locally up to 5◦Cin July and 12◦C in April. Snyder et al. (2004) obtaineda cooling of 2.8◦C (6.2◦C in MAM) even with fixed SSTsbecause of a strong increase in low level cloudiness. As MPI-ESM includes the interaction with the ocean, the simulatedtemperature decrease in DB is much less than anticipated bycomparison with other studies. The choice of replacementvegetation, changes in ET and the additional CO2 of 5 ppmcan not account for this difference. In contrast, large dis-crepancies to other models are apparent in the short-wavefluxes. Douville and Royer (1997) find a reduction of netshort-wave radiation at the surface of more than 20 W/m2 be-tween 50◦ N and 65◦ N in March and April. In MPI-ESMthe maximum value amounts to only 15 W/m2. Bonan etal. (1995) and Thomas and Rowntree (1992) report an annualmean decrease in net radiation of 20–40 W/m2, the latter 30–50 W/m2 in April and May. Snyder et al. (2004) also founda decrease of 30 W/m2 in MAM. As these values are gener-ally averaged over different areas and time periods and rep-resent different components of the surface radiative balance,the comparison cannot be perfectly consistent. However, itseems obvious that the sensitivity of the short-wave radiativebalance to land cover change in high latitudes is compara-tively weak in MPI-ESM. The reason seems to be related tothe parameterisation of surface albedo: In comparison to ob-servations from the BOREAS study, presented in Betts andBall (1997), the albedo of snow-covered forests is too highin MPI-ESM. This is especially the case for deciduous forest,for which Betts and Ball find an albedo of 0.21, while in themodel the values lie in the range of 0.4–0.7. For boreal ever-green forest, Betts and Ball state a mean of 0.13; in the modela range of 0.2–0.45 is found. Even in the boreal afforestationcase, where maximal forest cover is assumed, albedo val-ues are between 0.2 and 0.25. Also, measurements indicatethat snow masking by deciduous and evergreen forest is sim-ilar (Betts and Ball, 1997; Robinson and Kukla, 1984). Thisis apparently not the case in MPI-ESM, although stems andbranches are accounted for by a stem area index.
It seems plausible that the small change in sea ice coverin the boreal experiments is at least partly due to the weaktemperature response in MPI-ESM. Ganopolski et al. (2001)found a 20% increase in global sea ice cover due to borealdeforestation in CLIMBER-2. They also came to the con-clusion that the thermal lag of the ocean and the ice-albedofeedback are the main reasons for a cooling in summer. Thisseems to be true for the autumn in AB, but not DB (Fig. 13).Results are not as distinct for the summer months. In con-trast, the MOC increase of 1.5 Sv in DB agrees well with the2 Sv obtained by Ganopolski et al. (2001). However, the di-versity of model differences makes a causal assessment diffi-cult. This also applies for atmospheric circulation changes. Itis striking, that Douville and Royer (1997) also found a dis-turbance of the formation of the Azores High due to borealdeforestation. However, the similarities to their results are
very limited, as Douville and Royer (1997) found a delayedrather than an earlier high. Also, they report weakened west-erlies over northern Europe and Russia, a southward shift ofthe North Atlantic westerly jet, increased surface pressurein high latitudes and reduced surface pressure over the mid-latitude Atlantic. All these features are of opposite sign inthis study. A similarity can be found in the weakening of theIndian summer monsoon winds in DB, although this is notaccompanied by a reduction in precipitation as in Douvilleand Royer (1997).
4.3 Global sensitivities
In order to assess the impact of forest cover changes inde-pendently of the area’s size, Table 6 presents the sensitivityof global mean temperature and CO2 content to changes inforest area. These can be compared to Claussen et al. (2001)who present a similar analysis for CLIMBER-2 in Fig. 1of their study. The areas 10◦ N–20◦ N and 40◦ N–50◦ N inClaussen et al. (2001) are weighted only half here in order toaccount for the different choices of latitude bands.
Although CLIMBER-2 and MPI-ESM differ in many re-spects, the results are qualitatively similar. Nonetheless, withthe exception of tropical deforestation, CO2 sensitivities aresmaller in MPI-ESM. In AT, the unproductive climate of dryregions prevents a larger CO2 uptake, a feature that may notbe as important in CLIMBER-2 because of the low resolu-tion. In the case of boreal afforestation it must be consideredthat the carbon cycle had not yet reached a new equilibriumdue to the shorter integration time. The low CO2-sensitivityof MPI-ESM to boreal deforestation is due to the low car-bon storages of above ground biomass. However, this defi-ciency seems to be cancelled by the weak snow masking sothat temperature sensitivities in high latitudes are similar inboth studies. In the tropics, the differences in the sensitivityof temperature seem to reflect those in CO2 content. As CO2concentration in DT is still decreasing in the year 300, sensi-tivities for this experiment are probably not well comparable.
In comparison to Bala et al. (2007), temperature changesare small in both deforestation experiments. The globalwarming of 0.7◦C in the year 100 after tropical deforestationin Bala et al. (2007) may be related to larger carbon pools inINCCA. The corresponding CO2 anomaly of 199 ppm is ap-prox. 4 times larger than in MPI-ESM. In response to borealdeforestation, CO2 anomalies are similar in both models, butalbedo changes and thus global cooling are much more pro-nounced in INCCA. Nonetheless, the signs of global meantemperature changes obtained here are in line with the re-sults of Bala et al. (2007), and for boreal latitudes also withBetts (2000).
With regard to the discrepancies between the terrestrialcarbon pools in MPI-ESM and observations the questionarises how realistic the temperature sensitivities in Table 6are. As MPI-ESM’s climate sensitivity is approx. 3◦C(Friedlingstein et al., 2006), the CO2 increase by some ppm
Biogeosciences, 7, 1383–1399, 2010 www.biogeosciences.net/7/1383/2010/

S. Bathiany et al.: Biogeophysical and biogeochemical effects of large-scale forest cover changes 1397
Table 6. Sensitivities of temperature and CO2 in comparison with Claussen et al. (2001), averaged over the final 150 years. In the case oftropical deforestation, the CO2 anomaly was averaged over the final 30 years.
Experiment DT AT DB AB
Converted area in million km2 –23.07 +10.52 –18.55 +26.72CO2 anomaly in ppm +26.8 –4.0 +3.7 –6.5CO2 sensitivity in ppm/million km2 –1.16 –0.38 –0.20 –0.24CO2 sensitivity in Claussen et al. (2001) –0.83 –0.97 –0.60 –0.40Temperature anomaly in◦ +0.4 –0.06 –0.25 +0.26Temperature sensitivity in◦C/million km2 –0.017 –0.006 +0.013 +0.010Temperature sensitivity in Claussen et al. (2001) –0.010 –0.010 +0.015 +0.010
in DB should translate into only some hundredth◦C onglobal average, so the biogeophysical effects prevail by al-most one order of magnitude. If boreal vegetation carbonpools are assumed to be as large as the observations, borealdeforestation would still lead to a cooling. The same argu-ment applies for boreal afforestation. The assumption of lin-earity seems to be justified, as in Claussen et al. (2001) andBala et al. (2007) synergies between biogeophysical and bio-geochemical effects are found to be small. As mentionedin Sect. 2, observations also indicate less tropical soil car-bon than is obtained in MPI-ESM. After deforestation, thesecondary emissions from tropical soils amount to approx.150 GtC, if the contribution of the living biomass, which hasbeen partly put into the soil pools, is subtracted. If a reduc-tion in equilibrium soil carbon by a factor of 2 is assumed,the secondary emissions would be reduced by 75 GtC. Thiswould translate into a reduction in atmospheric CO2 concen-tration by about 10 ppm, as the airborn fraction of tropicalemissions is between 45% and 15% during the experiment.This relatively small difference in CO2 cannot significantlyalter the obtained global warming. As tropical soil carbonis also decreased after afforestation, a reduction in equilib-rium soil pools and thus CO2 emissions would tend to coolthe planet even more in AT. It can therefore be concluded thatthe sign of the obtained temperature changes is robust in spiteof the significant uncertainties in terrestrial carbon pools.
However, uncertainties also remain concerning the role ofindividual processes. Claussen et al. (2001) as well as Bala etal. (2007) find a cooling biogeophysical contribution of trop-ical deforestation. The latter suggest that the albedo changedominates over the reduced ET in its impact on temperaturebecause the ET of grass in INCCA is comparatively high.As the changes in tropical surface temperature and the en-ergy balance demonstrate, this is not the case in MPI-ESM.Claussen et al. (2001) also obtain a warming at tropical landcells, even though it is counteracted on a global scale by thediminished greenhouse effect, resulting from reduced ET. Inagreement with this, Ganopolski et al. (2001) report a warm-ing over tropical land and a cooling over the oceans. As onlycoupled experiments have been conducted here, it cannot bedetermined whether this holds true for MPI-ESM.
5 Summary and conclusions
The experiments presented here show that in MPI-ESMforests tend to warm the surface in high northern latitudes butact to cool the surface in the tropics. Earlier model studiesare corroborated by this result. A global temperature changeof +0.4◦C and a CO2 anomaly of initially 60 ppm is ob-tained after tropical deforestation because of large primaryand secondary carbon emissions. In addition, the strong re-duction in evapotranspiration leads to a pronounced warmingin tropical land areas. While this is in line with the majorityof biogeophysical GCM-studies, changes in the annual cy-cle and moisture convergence remain uncertain. For tropicalafforestation, results are opposite to the deforestation exper-iment, but of much smaller magnitude, because productivityremains low in dry areas. CO2 as well as global mean tem-perature are therefore hardly affected. In high latitudes thesnow masking of trees in spring dominates the temperatureresponse, although this effect is weaker than in other mod-els. Changes in sea ice cover, meridional overturning in theocean as well as atmospheric circulation modify the tempera-ture anomalies, but the contribution of these feedbacks is alsomodel dependent. Primary and secondary emissions are lowin DB compared to DT because biomass pools and produc-tivity differences between grass and trees are small. In thecase of boreal afforestation, the large carbon sink is quicklycancelled by the ocean and tropical forests. CO2 anomaliestherefore do not exceed some ppm in both boreal experi-ments. Despite many model differences, the order of mag-nitude of global temperature and CO2 sensitivities is similarto CLIMBER-2 results from Claussen et al. (2001).
For some land cells, a negative relation between forestcover and carbon storage is obtained, although they do notdominate the spatial mean in any experiment. Also, localtemperature changes opposite to the global mean occur dueto local differences in surface properties or feedbacks. Thisis mostly the case in Africa, where afforestation resulted ina warming in places with high surface albedo. Because ofthe dry conditions there, an afforestation would certainly notbe feasible in reality. Nonetheless, as realistic afforestationor reforestation projects must always be confined to much
www.biogeosciences.net/7/1383/2010/ Biogeosciences, 7, 1383–1399, 2010

1398 S. Bathiany et al.: Biogeophysical and biogeochemical effects of large-scale forest cover changes
smaller areas than considered here, the spatial mean sensi-tivities do not apply in such cases. The magnitude and eventhe sign of biogeophysical and biogeochemical effects maythen depend on the location. Therefore, studies such as Birdet al. (2008) and Montenegro et al. (2009), who challengethe idea of a warming boreal forest might be valid on a localscale and different from large-scale experiments.
In addition, many model limitations exist. In high lati-tudes, these primarily consist in the albedo of snow-coveredforest. The representation of soil moisture as a single bucketneglects many important aspects such as the root depth ofdifferent plants. This may be particularly inadequate in thetropics, where changes in the water cycle are essential. Assoil moisture has shown a large impact on productivity andsoil respiration in the experiments, these uncertainties alsoaffect the carbon cycle. In addition, neither the actual size ofsoil carbon pools nor the dependencies of NPP on tempera-ture, soil moisture and atmospheric CO2 as well as the de-pendency of soil respiration on temperature and moisture areconstrained well and thus differ among models (Friedling-stein et al., 2006). As these mechanisms can act in oppositedirections, the net effect on carbon pools may thus also bemodel dependent. In order to assess the impacts of forestcover changes in a more appropriate way, a better quantifica-tion of these effects from observations is therefore essential.
Acknowledgements.We would like to thank our anonymousreviewers as well as Hauke Schmidt for their useful comments.Robert Schoetter is gratefully acknowledged for his lunchtimelessons.
The service charges for this open access publicationhave been covered by the Max Planck Society.
Edited by: T. Laurila
References
Alton, P.: A simple retrieval of ground albedo and vegetation ab-sorptance from MODIS satellite data for parameterisation ofglobal land-surface models, Agr. Forest Meteorol., 149, 1769–1775, 2009.
Bala, G., Caldeira, K., Wickett, M., Phillips, T. J., Lobell, D. B.,Delire, C., and Mirin, A: Combined climate and carbon-cycleeffects of large-scale deforestation, P. Natl. Acad. Sci. USA, 104,6550–6555, 2007.
Betts, A. K. and Ball, J. H.: Albedo over the boreal forest, J. Geo-phys. Res., 102, 28901–28909, 1997.
Betts, R. A., Cox, P. M., Lee, S. E., and Woodward, F. I.: Contrast-ing physiological and structural vegetation feedbacks in climatechange simulations, Nature, 387, 796–799, 1997.
Betts, R. A.: Offset of the potential carbon sink from boreal foresta-tion by decreases in surface albedo, Nature, 408, 187–190, 2000.
Bird, D. N., Kunda, M., Mayer, A., Schlamadinger, B., Canella, L.,and Johnston, M.: Incorporating changes in albedo in estimating
the climate mitigation benefits of land use change projects, Bio-geosciences Discuss., 5, 1511–1543, 2008,http://www.biogeosciences-discuss.net/5/1511/2008/.
Bonan, G. B., Pollard, D., and Thompson, S. L.: Effects of borealforest vegetation on global climate, Nature, 359, 716–718, 1992.
Bonan, G. B., Chapin III, F. S., and Thompson, S. L.: Boreal for-est and tundra ecosystems as components of the climate system,Climatic Change, 29, 145–167, 1995
Brovkin, V., Claussen, M., Driesschaert, E., Fichefet, T., Kick-lighter, D., Loutre, M. F., Matthews, H. D., Ramankutty, N.,Schaeffer, M., and Sokolov, A.: Biogeophysical effects of his-torical land cover changes simulated by six earth system modelsof intermediate complexity, Clim. Dynam., 26, 587–600, 2006.
Brovkin, V., Raddatz, T., Reick, C. H., Claussen, M., and Gayler, V.:Global biogeophysical interactions between forest and climate,Geophys. Res. Lett., 36, L07405, doi:10.1029/2009GL037543,2009.
Chalita, S. and Le Treut, H.: The albedo of temperate and borealforest and the northern hemisphere climate: a sensitivity experi-ment using the LMD GCM, Clim. Dynam., 10, 231–240, 1994.
Claussen, M., Brovkin, V., and Ganopolski, A.: Biogeophysi-cal versus biogeochemical feedbacks of large-scale land coverchange, Geophys. Res. Lett., 28, 1011–1014, 2001.
Collatz, G. J., Ribas-Carbo, M., and Berry, J. A.: Coupledphotosynthesis-stomatal conductance model for leaves of C4plants, Aust. J. Plant Physiol., 19, 519–538, 1992.
Delire, C., Behling, P., Coe, M. T., Foley, J. A., Jacob, R.,Kutzbach, J., Liu, Z., and Vavrus, S.: Simulated response ofthe atmosphere-ocean system to deforestation in the IndonesianArchipelago, Geophys. Res. Lett., 28, 2081–2084, 2001.
Dirmeyer, P. A. and Shukla, J.: Albedo as a modulator of climateresponse to tropical deforestation, J. Geophys. Res., 99, 20863–20877, 1994.
Douville, H. and Royer, J.-F.: Influence of the temperate and borealforests on the northern hemisphere climate in the Meteo-Franceclimate model, Clim. Dynam., 13, 57–74, 1997.
Farquhar, G. D., von Caemmerer, S., and Berry, J. A.: A Biochem-ical Model of Photosynthetic CO2 Assimilation in Leaves of C3Species, Planta, 149, 78–90, 1980.
Friedlingstein, P., Cox, P., Betts, R., Bopp, L., von Bloh, W.,Brovkin, V., Cadule, P., Doney, S., Eby, M., Fung, I., Bala, G.,John, J., Jones, C., Joss, F., Kato, T., Kawamiya, M., Knorr, W.,Lindsay, K., Matthews, H. D., Raddatz, T., Rayner, P., Reick,C., Roeckner, E., Schnitzler, K.-G., Schnur, R., Strassmann, K.,Weaver, A. J., Yoshikawa, C., and Zeng, N.: Climate-CarbonCycle Feedback Analysis: Results from the C4MIP Model Inter-comparison, J. Climate, 19, 3337–3353, 2006.
Ganopolski, A., Petoukhov, V., Rahmstorf, S., Brovkin, V.,Claussen, M, Eliseev, A., and Kubatzki, C.: CLIMBER-2: a cli-mate system model of intermediate complexity. Part II: modelsensitivity, Clim. Dynam., 17, 735–751, 2001.
Henderson-Sellers, A., Dickinson, R. E., Durbidge, T. B., Kennedy,P. J., McGuffie, K., and Pitman, A. J.: Tropical deforestation:Modeling local- to regional-scale climate change, J. Geophys.Res., 98, 7289–7315, 1993.
House, J. I., Prentice, I. C., and Le Quere, C.: Maximum impacts offuture reforestation or deforestation on atmospheric CO2, Glob.Change Biol., 8, 1047–1052, 2002.
Biogeosciences, 7, 1383–1399, 2010 www.biogeosciences.net/7/1383/2010/

S. Bathiany et al.: Biogeophysical and biogeochemical effects of large-scale forest cover changes 1399
Jungclaus, J. H., Keenlyside, N., Botzet, M., Haak, H., Luo, J.-J.,Latif, M., Marotzke, J., Mikolajewicz, U., and Roeckner, E.:Ocean circulation and tropical variability in the coupled modelECHAM5/MPI-OM, J. Climate, 19, 3952–3972, 2006.
Lean, J. and Rowntree, P. R.: Understanding the sensitivity of aGCM simulation of Amazonian deforestation to the specificationof vegetation and soil characteristics, J. Climate, 10, 1216–1235,1997.
Maier-Reimer, E., Kriest, I., Segschneider, J., and Wetzel, P.: TheHAMburg Ocean Carbon Cycle model HAMOCC 5.1 – Tech-nical description, Release 1.1, Technical report 14/2005, Max-Planck Institute for Meteorology, Hamburg, 2005.
Matthews, H. D., Weaver, A. J., Meissner, K. J., Gillet, N. P., andEby, M.: Natural and anthropogenic climate change: incorpo-rating historical land cover change, vegetation dynamics and theglobal carbon cycle, Clim. Dynam., 22, 461–479, 2004.
McGuffie, K., Henderson-Sellers, A., Zhang, H., Durbridge, T. B.,and Pitman, A. J.: Global climate sensitivity to tropical defor-estation, Global Planet. Change, 10, 97–128, 1995. v Montene-gro, A., Eby, M., Mu, Q., Mulligan, M., Weaver, A. J., Wiebe,E. C., and Zhao, M.: The net carbon drawdown of small scaleafforestation from satellite observations, Global Planet. Change,69, 195–204, 2009.
Mylne, M. F. and Rowntree, P. R.: Modelling the effects of albedochange associated with tropical deforestation, Climatic Change,21, 317–343, 1992.
Nobre, C. A., Sellers, P. J., and Shukla, J.: Amazonian deforestationand regional climate change, J. Climate, 4, 957–988, 1991.
Nobre, C. A., Silva Dias, M. A., Culf, A. D., Polcher, J., Gash, J. H.C., Marengo, J. A., and Avissar, R.: The Amazonian climate, in:Vegetation, Water, Humans and the Climate: A New Perspectiveon an Interactive System, Springer, Berlin, Heidelberg, 79–92,2004.
Pielke Sr., R. A., Avissar, R., Raupach, M., Dolman, A. J., Zeng,X., and Denning, A. S.: Interactions between the atmosphere andterrestrial ecosystems: influence on weather and climate, Glob.Change Biol., 4, 461–475, 1998.
Pielke Sr., R. A., Marland, G., Betts, R. A., Chase, T. N., Eastman,J. L., Niles, J. O., Niyogi, D. S., and Running, S. W.: The influ-ence of land-use change and landscape dynamics on the climatesystem: relevance to climate-change policy beyond the radiativeeffect of greenhouse gases, Philos. T. R. Soc. Lond., 360, 1705–1719, 2002.
Pitman, A. J., Durbridge, T. B., Henderson-Sellers, A., andMcGuffie, K.: Assessing climate model sensitivity to prescribeddeforested landscapes, Int. J. Climatol., 13, 879–898, 1993.
Pitman, A. J., Dolman, H., Kruijt, B., Valentini, R., and Baldoc-chini, D.: The climate near the ground, in: Vegetation, Water,Humans and the Climate: A New Perspective on an InteractiveSystem, Springer, Berlin, Heidelberg, 9–19, 2004.
Polcher, J. and Laval, K.: The impact of African and Amazonian de-forestation on tropical climate, J. Hydrol., 155, 389–405, 1994a.
Polcher, J. and Laval, K.: A statistical study of the regional impactof deforestation on climate in the LMD GCM, Clim. Dynam., 10,205–219, 1994b.
Prentice, I., Farquhar, G., Fasham, M., Goulden, M., Heimann, M.,Jaramillo, V., Kheshgi, H., Le Quere, C., Scholes, R., and Wal-lace, D.: The carbon cycle and atmospheric carbon dioxide. In:Climate change 2001: The scienti?c basis. Contribution of Work-ing Group I to the Third Assessment Report of the Intergovern-mental Panel on Climate Change, edited by: Houghton, J. T.,Ding, Y., Griggs, D. J., Noguer, M., van der Linden, P., Dai,X., Maskell, K., and Johnson, C. I., Cambridge University Press,Cambridge, 183–237, 2001.
Raddatz, T. J., Reick, C. H., Knorr, W., Kattge, J., Roeckner, E.,Schnur, R., Schnitzler, K.-G., Wetzel, P., and Jungclaus, J.: Willthe tropical land biosphere dominate the climate-carbon cyclefeedback during the twenty-first century?, Clim. Dynam., 29,565–574, 2007.
Robinson, D. A. and Kukla, G.: Albedo of a dissipating snow cover,J. Clim. Appl. Meteorol., 23, 1626–1634, 1984.
Roeckner, E., Baeuml, G., Bonaventura, L., Brokopf, R., Esch,M., Giorgetta, M., Hagemann, S., Kirchner, I., Kornblueh,L., Manzini, E., Rhodin, A., Schlese, U., Schulzweida, U.,and Tompkins, A.: The atmospheric general circulation modelECHAM5. Part I: Model description, Max-Planck Institute forMeteorology, Report 349, 2003.
Schaeffer, M., Eickhout, B., Hoogwijk, M., Strengers, B.,van Vuuren, D., Leemans, R., and Opsteegh, T.: CO2and albedo climate impacts of extratropical carbon andbiomass plantations, Global Biogeochem. Cy., 20, GB2020,doi:10.1029/2005GB002581, 2006.
Snyder, P. K., Delire, C., and Foley, J. A.: Evaluating the influenceof different vegetation biomes on the global climate, Clim. Dy-nam., 23, 279-302, 2004.
Spracklen, D. V., Bonn, B., and Carslaw, K. S.: Boreal forests,aerosols and the impacts on clouds and climate, Philos. T. R.Soc. A, 366, 4613—4626, 2008.
Sud, Y. C., Walker, G. K., Kim, J.-H., Liston, G. E., Sellers, P. J.,and Lau, W. K.-M.: Biogeophysical consequences of a tropicaldeforestation scenario: a GCM simulation study, J. Climate, 9,3225–3247, 1996.
Thomas, G. and Rowntree, P. R.: The boreal forests and climate, Q.J. Roy. Meteor. Soc., 118, 469–497, 1992.
Zhang, H., Henderson-Sellers, A., and McGuffie, K.: Impacts oftropical deforestation. Part I: Process analysis of local climaticchange, J. Climate, 9, 1497–1517, 1996.
www.biogeosciences.net/7/1383/2010/ Biogeosciences, 7, 1383–1399, 2010