effectiveness of transverse road markings on reducing
TRANSCRIPT
Andrew Martindale - Transport Engineer
Effectiveness of Transverse Road Markings on Reducing Vehicle Speeds
NZTA research report 423

Traditional Speed Mitigation Measures
• Road signs & markings are the most widely used, cost effective ways to influence driver speed behaviour on rural hazard approaches.
Source: nzta.govt.nz

Issues with Signs
• The over-use of signs has limited their effectiveness as a speed mitigation device, particularly on hazard approaches.
Source: (Left) http://www.dailymail.co.uk/news/article-513953 (Right) PIN/ www.funonthenet.in

Alternative Devices
• Alternative devices that can inform a driver sub-consciously of the upcoming road environment, are now being considered i.e. transverse road markings.
Source: (Top) “Speed change management for New Zealand roads” (Charlton S and P Bass, 2006) (Bottom) Opus Road Safety PIN
Definitions: Transverse Road Markings
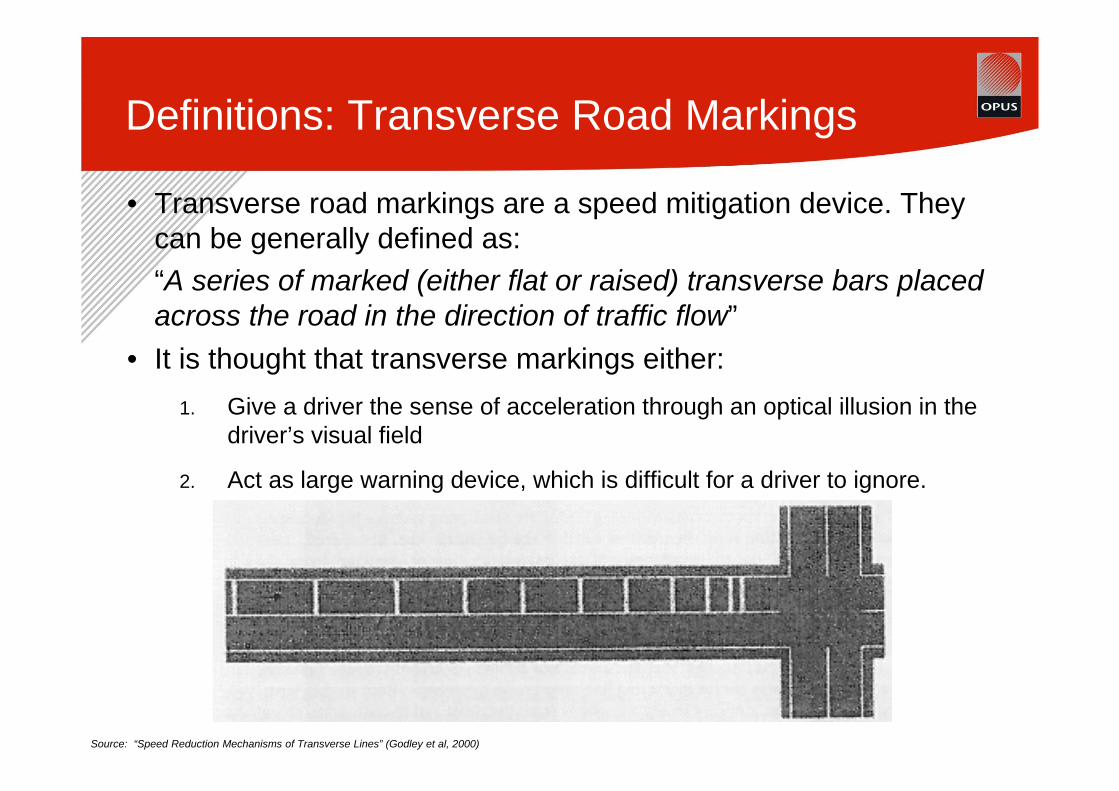
• Transverse road markings are a speed mitigation device. They can be generally defined as: “A series of marked (either flat or raised) transverse bars placed across the road in the direction of traffic flow”
• It is thought that transverse markings either:1. Give a driver the sense of acceleration through an optical illusion in the
driver’s visual field
2. Act as large warning device, which is difficult for a driver to ignore.
Source: “Speed Reduction Mechanisms of Transverse Lines” (Godley et al, 2000)

Scope of NZTA Research
• to report on the effectiveness and application of previous transverse road marking trials both nationally and internationally
• to develop an appropriate layout and methodology for field testing in a New Zealand environment
• to conduct field trials at two locations on New Zealand roads• to provide evidenced-based material that could aid the
development of best practice guidelines and recommendations for the industry.
Literature Review - NZ
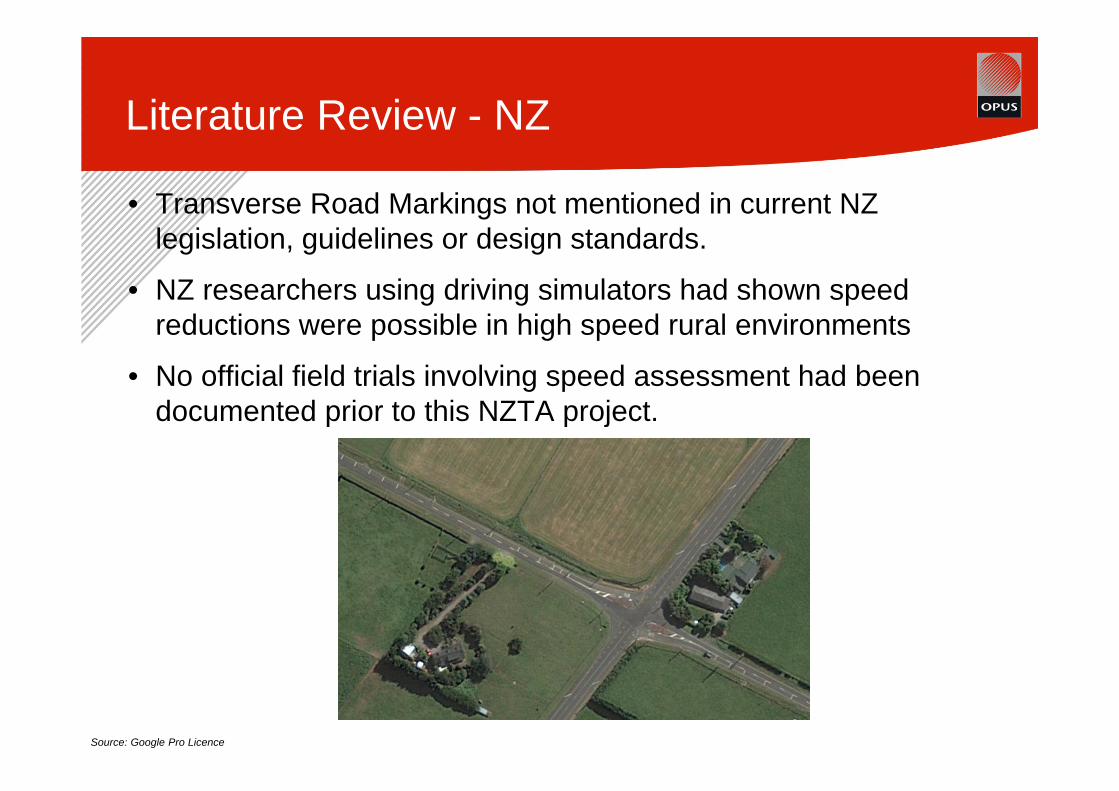
• Transverse Road Markings not mentioned in current NZ legislation, guidelines or design standards.
• NZ researchers using driving simulators had shown speed reductions were possible in high speed rural environments
• No official field trials involving speed assessment had been documented prior to this NZTA project.
Source: Google Pro Licence

Literature Review - International
• Research into understanding their effects and properties completed in Australia, UK & USA.
• Used extensively at motorway off-ramps and roundabouts in the UK.
Source: (left) Helliar-Symons et al, 1981 (right) high-speed curve layout in Milwaukee (Gates et al 2007)
Key Points from Literature Review
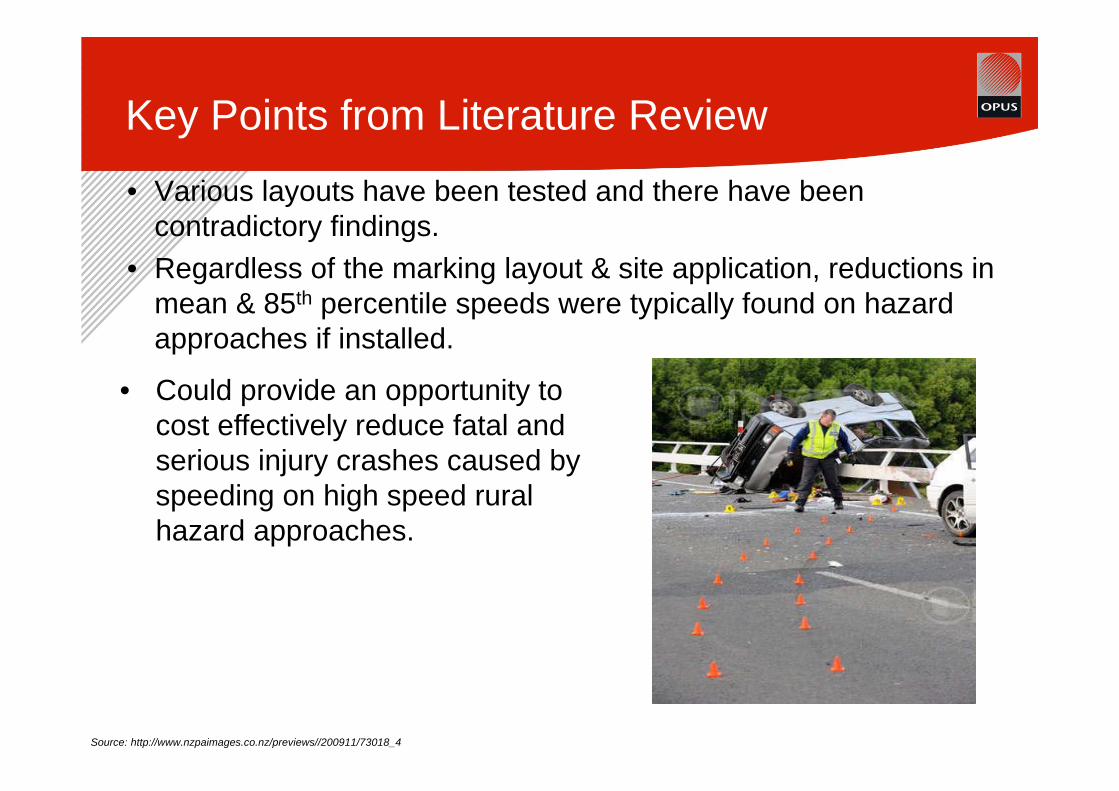
• Various layouts have been tested and there have been contradictory findings.
• Regardless of the marking layout & site application, reductions in mean & 85th percentile speeds were typically found on hazard approaches if installed.
Source: http://www.nzpaimages.co.nz/previews//200911/73018_4
• Could provide an opportunity to cost effectively reduce fatal and serious injury crashes caused by speeding on high speed rural hazard approaches.

Field Trials: Background
• In conjunction with NZTA, a layout consistent with NZ research completed by Dr. Sam Charlton was developed for field trials.
• Layout had to be re-designed conservatively due to concerns it may be to radical for NZ drivers to comprehend, possible wet weather issues and because of motorcyclist concerns.
Simulator Trial Marking Field Trial MarkingSource: (Left) “Development of a Road Safety Engineering Modelling Tool”, 2003, Charlton, S.G

Field Trials: Arrangement Details
Variable Explanation
Line Arrangement
100mm transverse bars extending at a 60 degree angle over 1.0m from the edgeline and centreline respectively.
Line SpacingTransverse bars placed at an even 3m spacing for approximately 300m, terminating at a distance of 110m prior to the hazard.
Line ColoursWhite coloured reflectorised road marking in accordance with NZTA (formerly TNZ) specification P/20, P/12, E/3 and M/7.
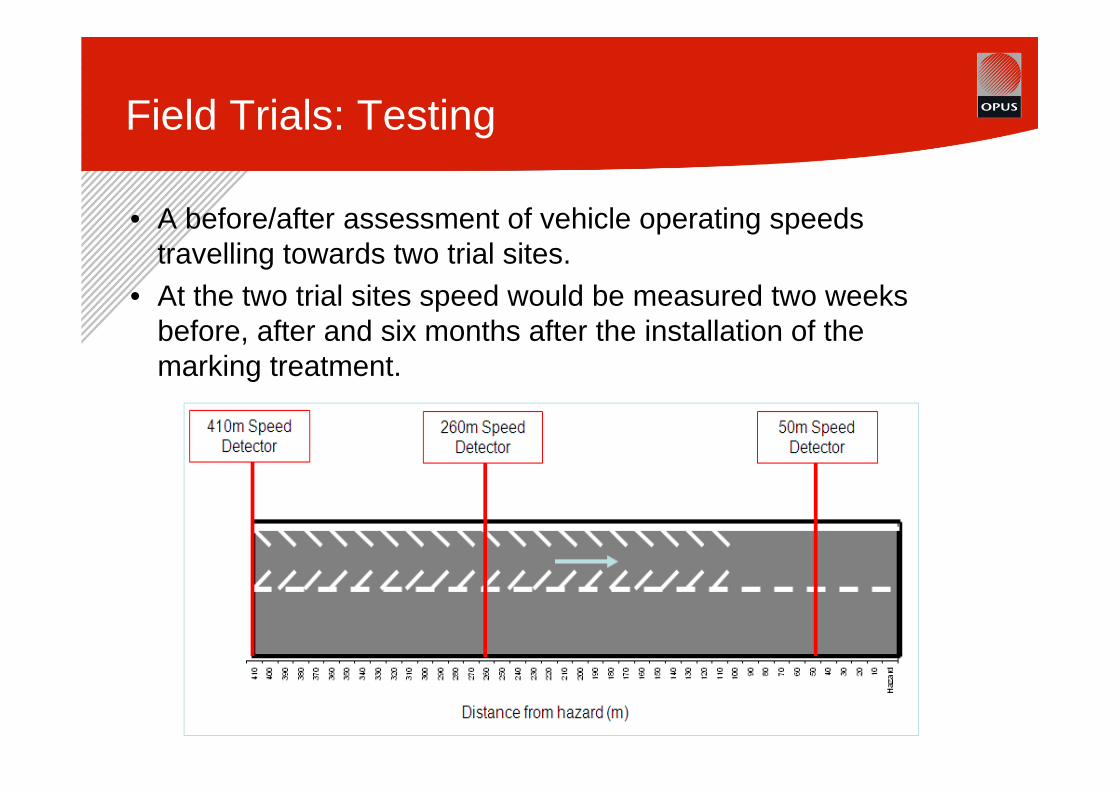
Field Trials: Testing
• A before/after assessment of vehicle operating speeds travelling towards two trial sites.
• At the two trial sites speed would be measured two weeks before, after and six months after the installation of the marking treatment.

Trial Site 1
• Southbound approach to the Kimberley Road / Arapaepae Road intersection on SH57 (RP 0/2.083)
• 7 loss of control crashes between 2004-2008 where excess speed was a factor on the southbound approach.
Source: Google Earth
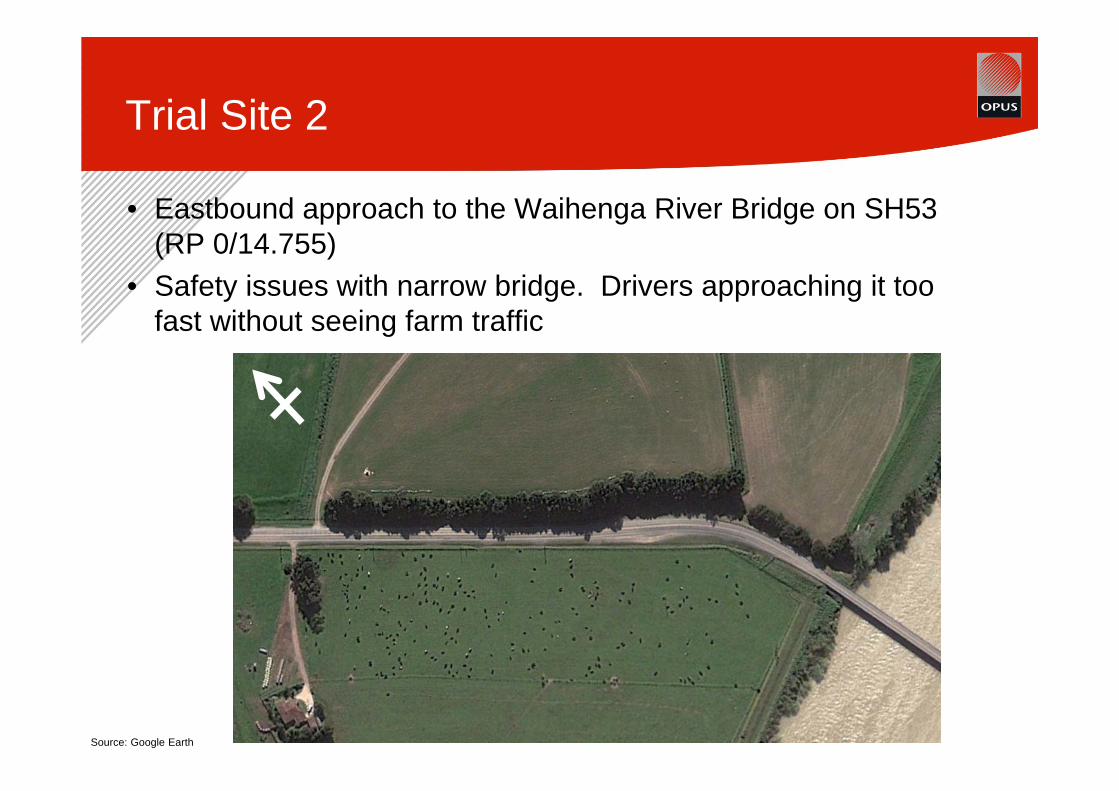
Trial Site 2
• Eastbound approach to the Waihenga River Bridge on SH53 (RP 0/14.755)
• Safety issues with narrow bridge. Drivers approaching it too fast without seeing farm traffic
Source: Google Earth

Installation
• Integrated Traffic Solutions installed the markings for us at both trial sites. Took about 3 hours per site to install.
• $2,500 per site, but more than half of cost due to TM.

Before & After Photos
• SH57 – 260m out from hazard

Before & After Photos
• SH53 – 260m out from hazard

Results – Overall Speed Change
• At SH57 vehicle speeds reduced at all measurement locations in the long term (statistically)
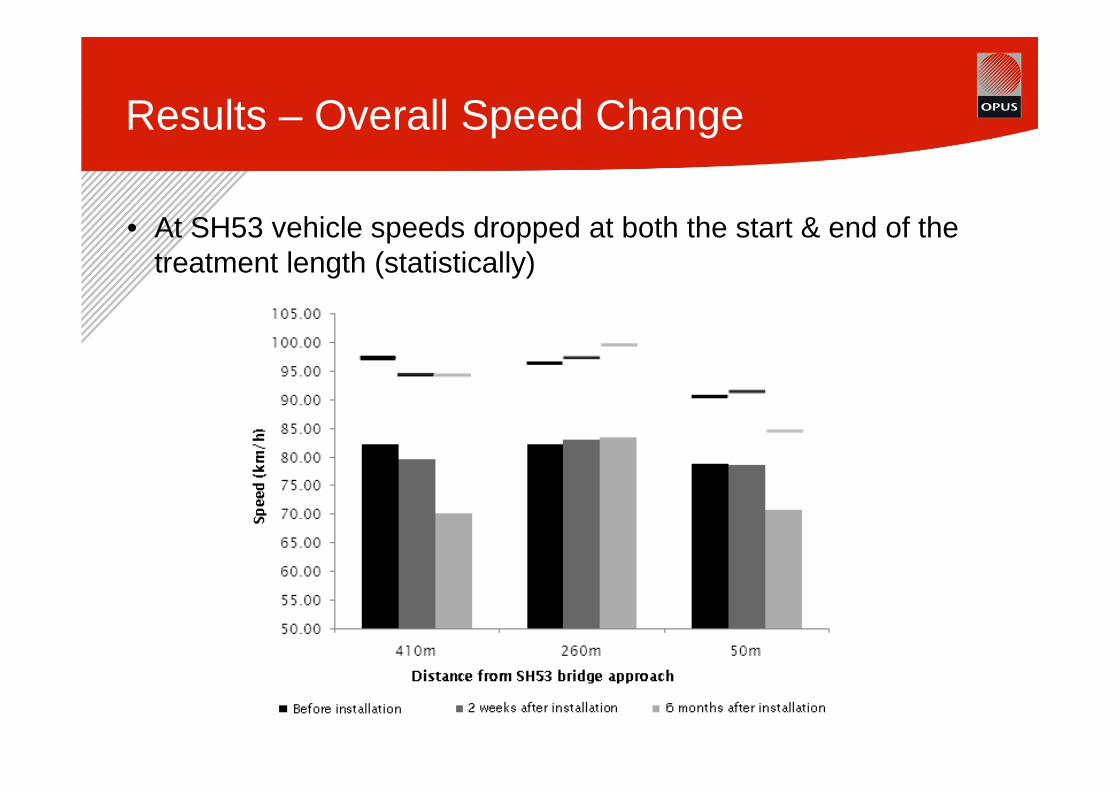
Results – Overall Speed Change
• At SH53 vehicle speeds dropped at both the start & end of the treatment length (statistically)

Results - Summary
• Largest speed reduction effects were clearly at the start of the marking treatment.
• Drivers have appeared to slow down out of precaution due to the alerting properties of the lines.
• Because of the length of the marking treatment, drivers had enough time to return to their pre installation speed at the treatment mid-point.
• But, drivers are likely to be more aware of the visual cues of the intersection/bridge which is why they arrived at a reduced speed 50m from the hazard.

Conclusions
• The research showed that transverse markings have promise to be used as a speed mitigation device on the approach to high speed rural hazards in a NZ environment.
• Based on the results of field trials a number of recommendations can be made to the arrangement used:
• Distance between the hazard and the start/end point of the treatment should be reduced
• Increasing the width of the individual bars to 500mm
• Distance between the bars should be increased from 3m to 10m
• Long term assessment period should be increased from 6 to 12 months and additional review of crash history after 5 years.
• Comparison of day and night speed reduction properties should be investigated
• More Trial Sites
Post Trial
• There were no crashes for the one-year period (August 2009-2010) at SH53 until the markings were removed as part re-seal maintenance.
• There have been no crashes at the intersection since the lines have been installed at SH57 (August 2009 – January 2012)
• International interest in findings
• The markings have been installed at other locations in conjunction with other measures.

Post Trial
Questions?