effective pressure or what is the effect of...
TRANSCRIPT

Using time-lapse seismics as a reservoir-monitoring tool,geophysics can help distinguish different reservoir pro-duction scenarios. For example, Eiken et al. (2000) success-fully detected fluid-saturation changes after CO2 injectionusing time-lapse seismics at Sleipner Field. Over the cycleof a reservoir life, oil saturation usually decreases, reservoirpressure declines, and gas breakout may occur. Thesechanges cause rock property changes that are detectible intime-lapse seismics. Therefore, it is important to understandthe effects of pressure and saturation changes on rock prop-erties. While the effects of saturation changes are often welldescribed by Gassmann (1951), Brown and Korringa (1975),and Mavko (1975), the effects of pressure changes are lessunderstood. Here we focus on understanding the effects offluid pressure on velocities.
Reservoir-pressure changes depend on productionschemes. For example, under weak acquifer-drive condi-tions, the pore pressure tends to decrease during produc-tion, and therefore, the differential pressure (the differencebetween confining and pore pressure) increases. In contrast,in the case of fluid injection, the pore pressure can increasenear injection wells.
Both theoretical and empirical methods are used tounderstand the effects of pressure changes on rock proper-ties. The Hertz-Mindlin model uses spheres to predict the-oretically the effects of pressure changes on the rock stiffness.Using their approach, the increase of rock stiffness and rigid-ity with the differential pressure is caused by the increaseof contact area between spheres. Eberhart-Phillips et al.(1989) show empirically that rock velocities increase expo-nentially with differential pressure. Using local calibrationfrom core measurements, coefficients for these equations canbe found and used to predict pressure changes due to pro-duction.
However, several case studies show that our under-standing of how rocks respond to pressure changes is stilllimited. MacBeth et al. (2004) show that the predicted time-lapse amplitude changes are much larger than the mea-sured amplitude changes for a field in the UK’s SouthernGas Basin. Tondel and Eiken (2005) also show that for TrollField, the seismic 4D response is much smaller than the pre-dicted response.
Several causes are given to explain these discrepanciesbetween the predicted and observed time-lapse responses.One of the most plausible reasons is the misunderstandingof the concepts of differential and effective pressure. To bemore accurate, we should consider stress rather than justpressure; however, for our discussion here, we restrict our-selves to the simpler isotropic case.
Differential versus effective pressure. The differential pres-sure (Pd) is the difference between confining pressure (Pc)and pore pressure (Pp),
(1)
For soils and unconsolidated rocks, Terzaghi (1936)shows that Pd governs the pressure dependency of soil andsoft rock deformation. For consolidated rocks, however, Biot
and Willis (1957) show that rock deformation is not solelydependent on Pd, but rather, on effective pressure,
(2)
The effective pressure differs from the differential pres-sure by the so-called effective-pressure coefficient, n. Theirtheoretical derivation relates the coefficient to the dry mod-ulus, Kdry, and mineral modulus, Km, of the rock:
(3)
Effective pressure or what is the effect of pressure?RONNY HOFMANN, XIAOXIA XU, and MICHAEL BATZLE, Colorado School of Mines, Golden, USAMANIKA PRASAD, Indian Institute of Technology, Mumbai, IndiaANNE-KARI FURRE AND ANGELA PILLITTERI, Statoil ASA, Trondheim, Norway
1256 THE LEADING EDGE DECEMBER 2005
Figure 1. The effective pressure coefficient for bulk modulus as function ofporosity. The critical porosity concept is applied to calculate the dry bulkmodulus, which is then applied through the Biot-Willis theory.
Figure 2. Effective pressure as function of the porosity. For two in-situconditions (Pc=25 MPa, Pp=14 MPa; Pc=45 MPa, Pp=34 MPa) thedifferential pressure is constant (Pd=11 MPa) as function of porosity;with a decrease of porosity, the effective pressure increases dependingon Pc and Pp.

This relation is derived from static deformations of therock frame and may differ from empirical relations fordynamic properties. As an upper bound for these empiri-cal relations, the critical porosity model (Nur et al., 1995)can be applied to obtain the effective-pressure coefficient:
(4)
where the critical porosity φcr is 0.4 for clastic rocks. Figure1 and Figure 2 show the results of this model and its impli-cation for an effective-pressure coefficient. As indicated inFigure 1 at high porosities, where the dry bulk modulus isvery small, the effective-pressure coefficient is close to one.Conversely, if the porosities are very small, the effective-pres-sure coefficient is very small, approaching zero. Effectivepressures (equation 2) for two different pressure conditionsare shown in Figure 2. Differential pressure remains thesame for both scenarios: Pc=45 MPa, Pp=34 MPa, Pd=11 MPaand Pc=25 MPa, Pp=14 MPa, Pd=11 MPa. However, the effec-tive pressure can be very different, ranging from 25 MPa to45 MPa at very low porosities (n=0), in contrast, at very highporosities the effective pressures converge to the differen-tial pressure (n=1).
Todd and Simmons (1972) derive an empirical equation,yet more general, for effective-pressure coefficients by tak-ing the ratio of the change of any property Q at constantdifferential pressure (Pd=const) over the change at constantpore pressure (Pp=const):
(5)
As illustrated in Figure 3, the denominator in equation5 can be obtained from the tangent of the constant pore pres-sure curve, while the numerator is the slope of the curve forconstant differential pressure. Zoback et al. (1975) measuredthe effective-pressure coefficient for permeabilities, whereasPrasad and Manghnani (1997) measured the coefficient forcompressional velocity and quality factor. The effective-pressure coefficient for rock properties, such as velocity andpermeability, depends on the deformation behavior of rocks.Because deformation affects permeability and velocity dif-ferently, the effective-pressure coefficient is different foreach property.
For rocks with high porosity the value of the coefficientis very close to one, which means that changes in confiningand pore pressure have the same effect on permeability andvelocities. In contrast, rocks with low porosity are influencedmore by changes in confining pressure than by changes inpore pressure. Therefore the effective-pressure coefficient issmaller than one. When the effective-pressure coefficientapproaches zero, the pore pressure has no influence ondeformation, velocity, or permeability.
When a rock is subjected to constant differential pres-sure, pore pressure has to be changed accordingly; there-fore, fluid compressibility and density change. Figure 4shows schematically how the increase of velocity at constantdifferential pressure is caused by the increase in fluid stiff-ness and the increase in rock frame stiffness. As an exam-ple, Figure 5 shows the change in brine density and modulusas a function of pore pressure. As expected, the densitychange is nominal, from 1.03 g/cm3 to 1.10 g/cm3, a totalof 7%. The fluid modulus, however, changes from 2.5 GPato 3.6 GPa (44%) as the pore pressure increases from 7 MPato 170 MPa. To remove this fluid contribution to the increasedrock stiffness, we use Gassmann’s equation to calculate the
stiffness of a rock frame under a constant pore pressure. Inthis study, all the brine-saturated measurements have beennormalized to fluid properties at constant pore pressure ofPp=3.9 MPa (1000 psi).
Given the importance of the effective-pressure coefficientat low porosities, measurements of a Cretaceous sandstonewith a porosity of 13% are presented in this analysis. At first,the normalization of the brine properties is applied; the
DECEMBER 2005 THE LEADING EDGE 1257
Figure 3. Schematic behavior of compressional wave velocity (VP). Thetwo derived quantities for constant differential and constant pore pressureare indicated.
Figure 4. Compressional wave velocity (VP) as function of pore pressure.The contributions from changing fluid properties and rock properties areindicated.
Figure 5. Changes in brine density and modulus as function of the porepressure (triangles indicate density - right axis, squares indicate modulus- left axis).
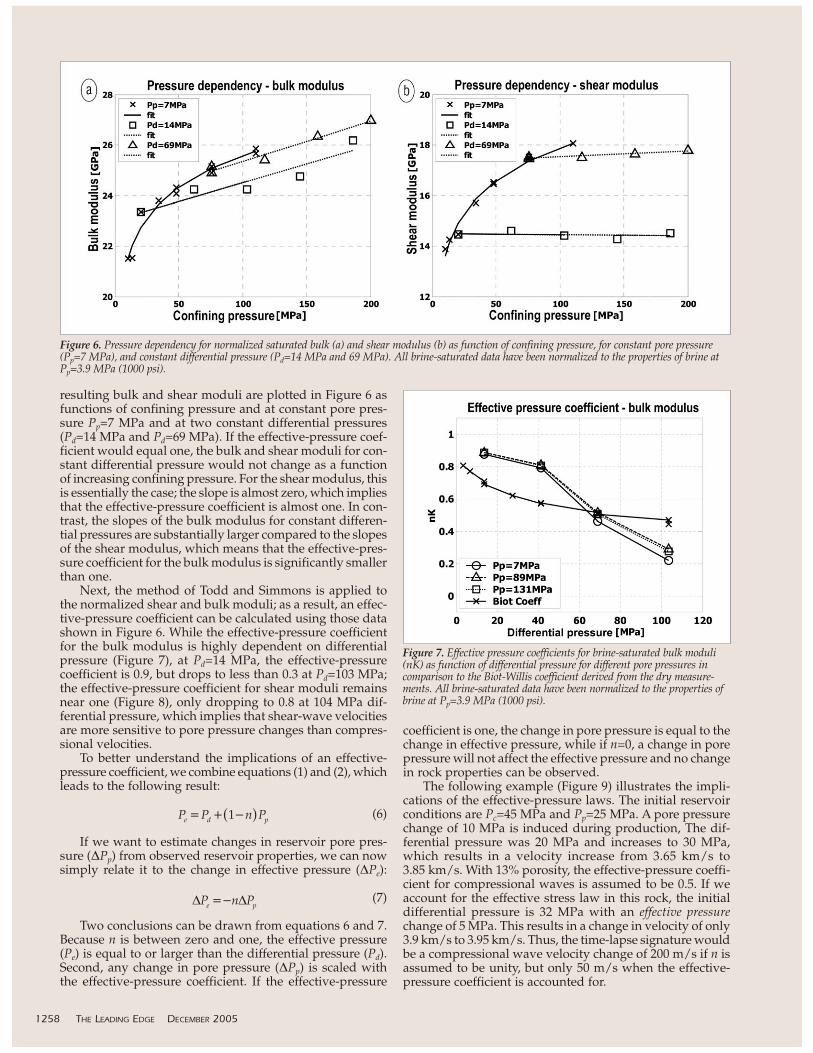
resulting bulk and shear moduli are plotted in Figure 6 asfunctions of confining pressure and at constant pore pres-sure Pp=7 MPa and at two constant differential pressures(Pd=14 MPa and Pd=69 MPa). If the effective-pressure coef-ficient would equal one, the bulk and shear moduli for con-stant differential pressure would not change as a functionof increasing confining pressure. For the shear modulus, thisis essentially the case; the slope is almost zero, which impliesthat the effective-pressure coefficient is almost one. In con-trast, the slopes of the bulk modulus for constant differen-tial pressures are substantially larger compared to the slopesof the shear modulus, which means that the effective-pres-sure coefficient for the bulk modulus is significantly smallerthan one.
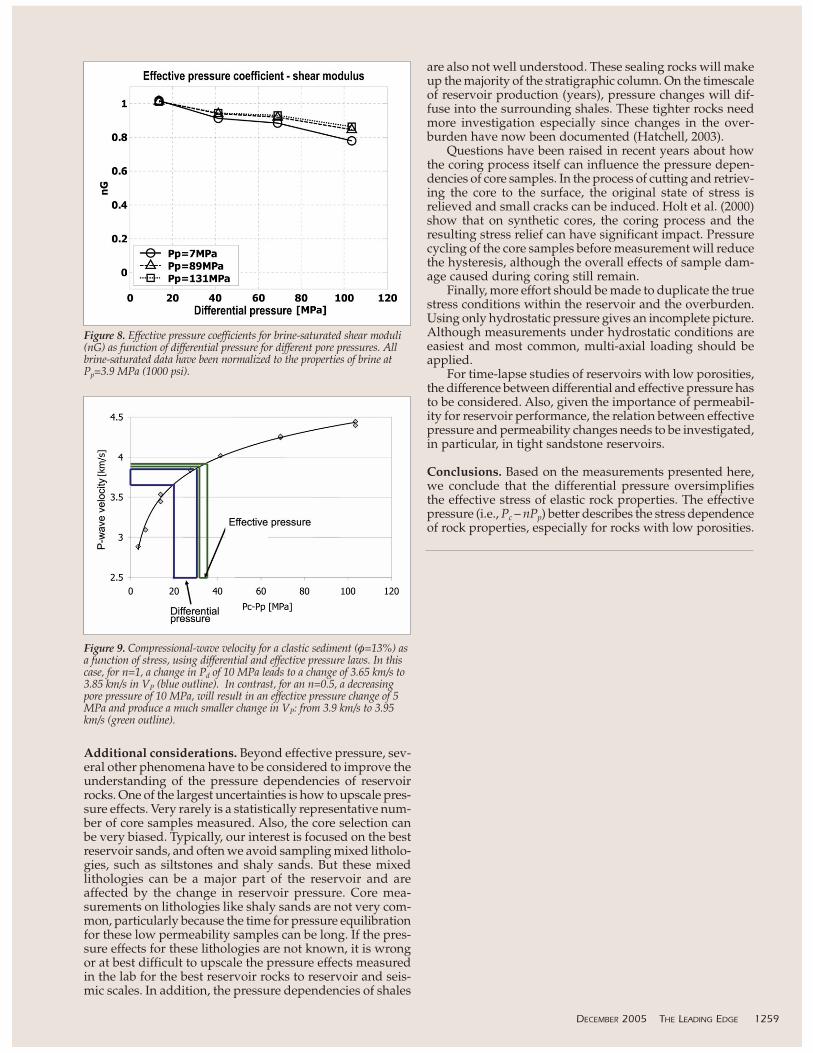
Next, the method of Todd and Simmons is applied tothe normalized shear and bulk moduli; as a result, an effec-tive-pressure coefficient can be calculated using those datashown in Figure 6. While the effective-pressure coefficientfor the bulk modulus is highly dependent on differentialpressure (Figure 7), at Pd=14 MPa, the effective-pressurecoefficient is 0.9, but drops to less than 0.3 at Pd=103 MPa;the effective-pressure coefficient for shear moduli remainsnear one (Figure 8), only dropping to 0.8 at 104 MPa dif-ferential pressure, which implies that shear-wave velocitiesare more sensitive to pore pressure changes than compres-sional velocities.
To better understand the implications of an effective-pressure coefficient, we combine equations (1) and (2), whichleads to the following result:
(6)
If we want to estimate changes in reservoir pore pres-sure (∆Pp) from observed reservoir properties, we can nowsimply relate it to the change in effective pressure (∆Pe):
(7)
Two conclusions can be drawn from equations 6 and 7.Because n is between zero and one, the effective pressure(Pe) is equal to or larger than the differential pressure (Pd).Second, any change in pore pressure (∆Pp) is scaled withthe effective-pressure coefficient. If the effective-pressure
coefficient is one, the change in pore pressure is equal to thechange in effective pressure, while if n=0, a change in porepressure will not affect the effective pressure and no changein rock properties can be observed.
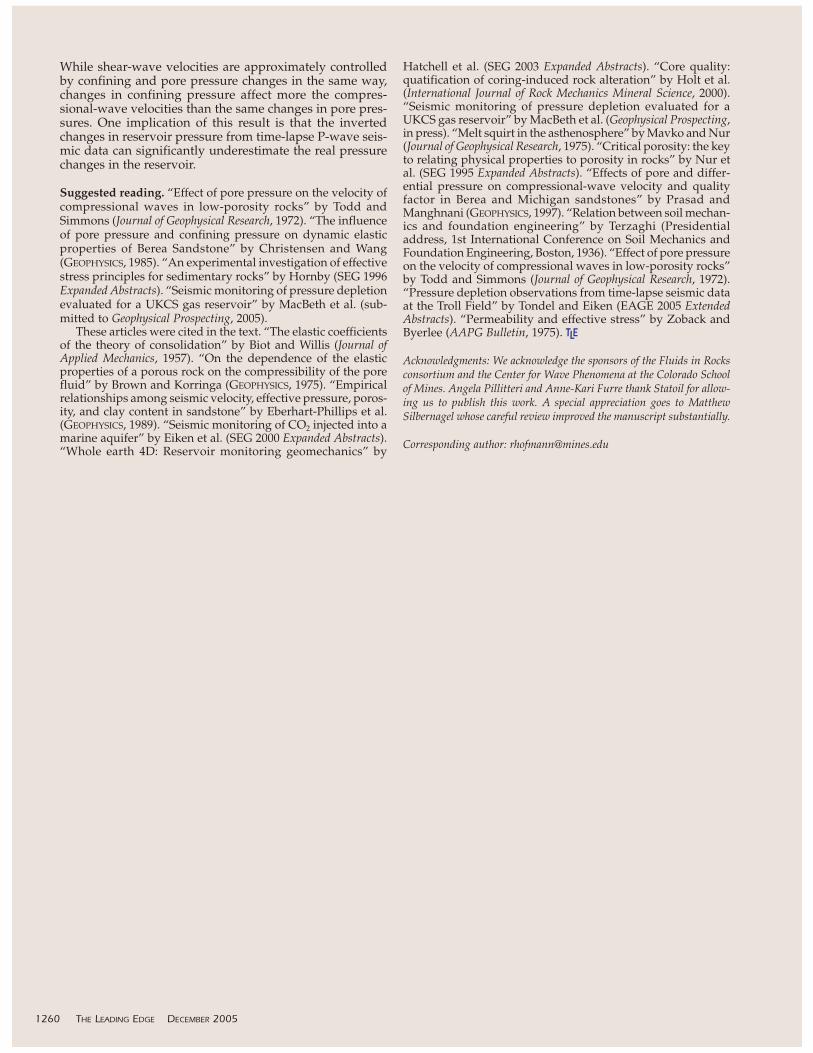
The following example (Figure 9) illustrates the impli-cations of the effective-pressure laws. The initial reservoirconditions are Pc=45 MPa and Pp=25 MPa. A pore pressurechange of 10 MPa is induced during production, The dif-ferential pressure was 20 MPa and increases to 30 MPa,which results in a velocity increase from 3.65 km/s to3.85 km/s. With 13% porosity, the effective-pressure coeffi-cient for compressional waves is assumed to be 0.5. If weaccount for the effective stress law in this rock, the initialdifferential pressure is 32 MPa with an effective pressurechange of 5 MPa. This results in a change in velocity of only3.9 km/s to 3.95 km/s. Thus, the time-lapse signature wouldbe a compressional wave velocity change of 200 m/s if n isassumed to be unity, but only 50 m/s when the effective-pressure coefficient is accounted for.
1258 THE LEADING EDGE DECEMBER 2005
Figure 6. Pressure dependency for normalized saturated bulk (a) and shear modulus (b) as function of confining pressure, for constant pore pressure(Pp=7 MPa), and constant differential pressure (Pd=14 MPa and 69 MPa). All brine-saturated data have been normalized to the properties of brine atPp=3.9 MPa (1000 psi).
Figure 7. Effective pressure coefficients for brine-saturated bulk moduli(nK) as function of differential pressure for different pore pressures incomparison to the Biot-Willis coefficient derived from the dry measure-ments. All brine-saturated data have been normalized to the properties ofbrine at Pp=3.9 MPa (1000 psi).
Additional considerations. Beyond effective pressure, sev-eral other phenomena have to be considered to improve theunderstanding of the pressure dependencies of reservoirrocks. One of the largest uncertainties is how to upscale pres-sure effects. Very rarely is a statistically representative num-ber of core samples measured. Also, the core selection canbe very biased. Typically, our interest is focused on the bestreservoir sands, and often we avoid sampling mixed litholo-gies, such as siltstones and shaly sands. But these mixedlithologies can be a major part of the reservoir and areaffected by the change in reservoir pressure. Core mea-surements on lithologies like shaly sands are not very com-mon, particularly because the time for pressure equilibrationfor these low permeability samples can be long. If the pres-sure effects for these lithologies are not known, it is wrongor at best difficult to upscale the pressure effects measuredin the lab for the best reservoir rocks to reservoir and seis-mic scales. In addition, the pressure dependencies of shales
are also not well understood. These sealing rocks will makeup the majority of the stratigraphic column. On the timescaleof reservoir production (years), pressure changes will dif-fuse into the surrounding shales. These tighter rocks needmore investigation especially since changes in the over-burden have now been documented (Hatchell, 2003).
Questions have been raised in recent years about howthe coring process itself can influence the pressure depen-dencies of core samples. In the process of cutting and retriev-ing the core to the surface, the original state of stress isrelieved and small cracks can be induced. Holt et al. (2000)show that on synthetic cores, the coring process and theresulting stress relief can have significant impact. Pressurecycling of the core samples before measurement will reducethe hysteresis, although the overall effects of sample dam-age caused during coring still remain.
Finally, more effort should be made to duplicate the truestress conditions within the reservoir and the overburden.Using only hydrostatic pressure gives an incomplete picture.Although measurements under hydrostatic conditions areeasiest and most common, multi-axial loading should beapplied.
For time-lapse studies of reservoirs with low porosities,the difference between differential and effective pressure hasto be considered. Also, given the importance of permeabil-ity for reservoir performance, the relation between effectivepressure and permeability changes needs to be investigated,in particular, in tight sandstone reservoirs.
Conclusions. Based on the measurements presented here,we conclude that the differential pressure oversimplifiesthe effective stress of elastic rock properties. The effectivepressure (i.e., Pc – nPp) better describes the stress dependenceof rock properties, especially for rocks with low porosities.
DECEMBER 2005 THE LEADING EDGE 1259
Figure 8. Effective pressure coefficients for brine-saturated shear moduli(nG) as function of differential pressure for different pore pressures. Allbrine-saturated data have been normalized to the properties of brine atPp=3.9 MPa (1000 psi).
Figure 9. Compressional-wave velocity for a clastic sediment (φ=13%) asa function of stress, using differential and effective pressure laws. In thiscase, for n=1, a change in Pd of 10 MPa leads to a change of 3.65 km/s to3.85 km/s in VP (blue outline). In contrast, for an n=0.5, a decreasingpore pressure of 10 MPa, will result in an effective pressure change of 5MPa and produce a much smaller change in VP: from 3.9 km/s to 3.95km/s (green outline).
While shear-wave velocities are approximately controlledby confining and pore pressure changes in the same way,changes in confining pressure affect more the compres-sional-wave velocities than the same changes in pore pres-sures. One implication of this result is that the invertedchanges in reservoir pressure from time-lapse P-wave seis-mic data can significantly underestimate the real pressurechanges in the reservoir.
Suggested reading. “Effect of pore pressure on the velocity ofcompressional waves in low-porosity rocks” by Todd andSimmons (Journal of Geophysical Research, 1972). “The influenceof pore pressure and confining pressure on dynamic elasticproperties of Berea Sandstone” by Christensen and Wang(GEOPHYSICS, 1985). “An experimental investigation of effectivestress principles for sedimentary rocks” by Hornby (SEG 1996Expanded Abstracts). “Seismic monitoring of pressure depletionevaluated for a UKCS gas reservoir” by MacBeth et al. (sub-mitted to Geophysical Prospecting, 2005).
These articles were cited in the text. “The elastic coefficientsof the theory of consolidation” by Biot and Willis (Journal ofApplied Mechanics, 1957). “On the dependence of the elasticproperties of a porous rock on the compressibility of the porefluid” by Brown and Korringa (GEOPHYSICS, 1975). “Empiricalrelationships among seismic velocity, effective pressure, poros-ity, and clay content in sandstone” by Eberhart-Phillips et al.(GEOPHYSICS, 1989). “Seismic monitoring of CO2 injected into amarine aquifer” by Eiken et al. (SEG 2000 Expanded Abstracts).“Whole earth 4D: Reservoir monitoring geomechanics” by
Hatchell et al. (SEG 2003 Expanded Abstracts). “Core quality:quatification of coring-induced rock alteration” by Holt et al.(International Journal of Rock Mechanics Mineral Science, 2000).“Seismic monitoring of pressure depletion evaluated for aUKCS gas reservoir” by MacBeth et al. (Geophysical Prospecting,in press). “Melt squirt in the asthenosphere” by Mavko and Nur(Journal of Geophysical Research, 1975). “Critical porosity: the keyto relating physical properties to porosity in rocks” by Nur etal. (SEG 1995 Expanded Abstracts). “Effects of pore and differ-ential pressure on compressional-wave velocity and qualityfactor in Berea and Michigan sandstones” by Prasad andManghnani (GEOPHYSICS, 1997). “Relation between soil mechan-ics and foundation engineering” by Terzaghi (Presidentialaddress, 1st International Conference on Soil Mechanics andFoundation Engineering, Boston, 1936). “Effect of pore pressureon the velocity of compressional waves in low-porosity rocks”by Todd and Simmons (Journal of Geophysical Research, 1972).“Pressure depletion observations from time-lapse seismic dataat the Troll Field” by Tondel and Eiken (EAGE 2005 ExtendedAbstracts). “Permeability and effective stress” by Zoback andByerlee (AAPG Bulletin, 1975). TLE
Acknowledgments: We acknowledge the sponsors of the Fluids in Rocksconsortium and the Center for Wave Phenomena at the Colorado Schoolof Mines. Angela Pillitteri and Anne-Kari Furre thank Statoil for allow-ing us to publish this work. A special appreciation goes to MatthewSilbernagel whose careful review improved the manuscript substantially.
Corresponding author: [email protected]
1260 THE LEADING EDGE DECEMBER 2005