effect of tendon stiffness on the generated force at the
TRANSCRIPT

Bulletin of the JSME
Journal of Biomechanical Science and EngineeringVol.9, No.3, 2014
J-STAGE Advance Publication date: 30 June, 2014© 2014 The Japan Society of Mechanical Engineers[DOI: 10.1299/jbse.13-00294]
0123456789
* Department of Mechanical Engineering, The University of Tokyo
7-3-1 Hongo, Bunkyo-ku, Tokyo, Japan
E-mail: [email protected]
** Department of Mechanical Engineering, University of Minho
Largo do Paço, Braga, Portugal
*** Human Life and Health Sciences, Hyogo University of Teacher Education
942-1 Shimokume, Kato-shi, Hyogo, Japan
**** Department of Human Sciences, Kanagawa University
3-27-1 Rokkakubashi, Kanagawa-ku Yokohama-shi, Kanagawa, Japan
Abstract Skeletal muscles develop forces as a result of muscle activation for human locomotion. To know the force generating ability of skeletal muscles is important to understand the muscle functions. Computer simulation is a useful tool for estimating the force generating ability. Therefore we have developed a three-dimensional (3D) finite element software to simulate both the so-called passive behavior of biological soft tissues and the muscle active behavior. The software is based on a nonlinear finite element setting for almost incompressible hyperelastic materials, where a total Lagrangian formulation, a mixed type displacement-pressure finite element and a fully implicit time integration scheme are adopted. The active stress as a result of muscle contraction is modeled by Hill-type model. Here, we investigated the effect of tendon stiffness within the range indicated in several literatures on the generated force at the Achilles tendon during isometric contraction of the triceps surae muscle. 3D FE-model of a human triceps surae muscle reconstructed by magnetic resonance images, which have the 3D distribution of the fascicle arrangement within the muscles. The stiffer tendon generated higher force at the Achilles tendon than the low-stiffness tendon, and the largest generated force was 1.45 times greater than the smallest one. It is, therefore, important to carefully obtain the material parameters from in vivo experimental observations. In this software, the subject-specific geometry and material properties can be used in the simulation. This software may therefore become a valuable tool for studying on orthopedics and rehabilitation planning, as well as for improving our understanding of muscle mechanics.
1. Introduction
Skeletal muscles develop forces as a result of muscle activation for human locomotion. Skeletal muscle has a
hierarchical structure consisting of connective tissues and muscle fibers. The muscle fibers are force generators and intricately arranged within the muscle, this arrangement being of both functional and clinical significance (Lieber and Friden, 2000; Agur et al., 2003). The muscle fiber forces are transmitted to the bone through tendinous tissues, such as tendon and aponeurosis. The generated force of the muscle-tendon complex when it is activated is a critical factor in defining human kinetics. Thus, to know the force generating ability of skeletal muscles is important to understand the muscle functions.
Computer simulation is a useful tool for estimating the force generating ability of muscles. Many numerical models
1
Received 21 November 2013
Key words : Finite element method, Muscle contraction, Tendon stiffness, Triceps surae muscle, Achilles tendon force
Effect of tendon stiffness on the generated force at the Achilles tendon – 3D finite element simulation of a human triceps
surae muscle during isometric contraction
Paper No.13-00294
Naoto YAMAMURA*, Jose Luis ALVES**, Toshiaki ODA***, Ryuta KINUGASA**** and Shu TAKAGI*

2
Yamamura, Alves, Oda, Kinugasa and Takagi, Journal of Biomechanical Science and Engineering, Vol.9, No.3 (2014)
© 2014 The Japan Society of Mechanical Engineers[DOI: 10.1299/jbse.13-00294]
of musculo-skeletal systems had developed and represented as a simple muscle-tendon complex by means of a series of line segments (e.g., Zajac, 1989; Hatze, 1981). The lumped-parameter models using line segments are useful for the analysis of the large-scale human motion, due to the reduction of the degrees of freedom. However, the lack of volume and internal fiber distribution limits the opportunity to investigate the phenomena on either the surface or inside the muscles, and also the force generating ability of muscles.
To overcome these problem, many finite element (FE) formulations for 2D/3D skeletal muscle have already been developed for investigating the behavior of the muscle and tendinous tissues (e.g., Johansson et al., 2000; Jenkyn et al., 2002; Yucesoy et al., 2002; Blemker et al., 2005; Tang et al., 2009). We have also developed a 3D FE software called V-Biomech (Alves et al., 2010), in order to simulate both the passive behavior of biological soft tissues and the muscle active behavior. The 3D FE-model is geometrically reconstructed from medical imaging apparatus such as CT or MRI. This software therefore allow us to simulate the mechanical behavior of musculo-skeletal systems using patient-specific data evaluated from medical imaging data acquisition, allowing to predict the strain and stress fields inside all domain of living tissues. Such software shall be a valuable tool for investigations on the causes of sports' injuries, as well as on the definition and optimization of surgical and rehabilitation plans.
In contrast to the lumped-parameter models, in order to predict accurately the behavior of the tissues in the 3D FE-simulation, it is important to use adequately the 3D models and material parameters. One motivation for this study was to investigate factors affecting the behavior of muscle and tendinous tissues in the 3D FE-simulation, in order to improve the accuracy of the numerical simulation. In almost all previous studies by FE-models have only marginally focused on the geometrical responses of muscles, such as deformation and fiber strains. Thus, to investigate the force generating ability of skeletal muscles by using 3D muscle model is important to understand the muscle functions.
This paper describes 3D FE-model of a human triceps surae muscle investigation in which we have attempted to examine how the tendon stiffness, within the range indicated in several literatures (Louis-Ugbo et al., 2004; Rosager et al., 2002; Reeves et al., 2005; Shin et al., 2008), may influence the generated forces at the Achilles tendon of contracting skeletal muscle. Such 3D FE-model obtained from in vivo real human leg non-invasively is particularly challenging in the relatively complex structure of human triceps surae muscle, which is composed of different structural components with a complex arrangement of muscle fiber orientation (Kawakami et al., 1998).
2. Mechanical modeling of skeletal muscle and tendinous tissues
The modeling of biological soft tissues, like muscle and tendon, involves several phenomena, such as
incompressibility, hyperelasticity, nonlinearity and large deformations. Therefore, V-Biomech was based on a nonlinear FE setting for almost incompressible hyperelastic materials, where a total Lagrangian formulation and a fully implicit time integration scheme were adopted. Due to the incompressibility character of the biological soft tissues, a mixed type displacement-pressure (u/p) FE formulation was adopted. A muscle has the ability to develop internal forces and thus to produce internal work as a result of muscle fiber contraction. Therefore, the stress state in a muscle must be seen as the result of a superposition of passive and active parts (Johansson et al., 2000), i.e.,
total pas actf f fσ σ σ= + (1)
where and are the total, the passive and the active Cauchy stress normal components in the muscle fiber direction. 2.1 Passive material behavior
Hyperelastic materials are assumed to be governed by a constitutive law linking the 2nd Piola-Kirchhoff stress tensor pasS and the right Cauchy-Green strain tensor C by means of a strain energy potential density W, which plays the role of a stress potential, i.e.,
2pas W W∂ ∂= =∂ ∂
SE C
(2)
where E is the Green-Lagrange strain tensor defined by
,total pasf fσ σ act
fσ
2

2
Yamamura, Alves, Oda, Kinugasa and Takagi, Journal of Biomechanical Science and Engineering, Vol.9, No.3 (2014)
© 2014 The Japan Society of Mechanical Engineers[DOI: 10.1299/jbse.13-00294]
1( )
2= −E C I (3)
and the right Cauchy-Green strain tensor C is defined by
T= ⋅C F F (4)
where F is the deformation gradient tensor defined as , and I is the second-order unit tensor. We adopted a strain energy potential W for almost incompressible materials as follows (Sussman and Bathe, 1987):
2 21( ) ( 1) ( )
2 2
kW W J p p
k= + − − −C ɶ (5)
where the first term is related to the constitutive model and is a function of the isochoric strain tensor and the second term represents the strain energy associated with the volumetric change . The bulk modulus plays the role of a parameter penalizing the volumetric change quantified by . In the limit of , any volumetric change is strongly penalized, and the above formulation approaches the total incompressibility constraint. The third term which arises from the use of the mixed type formulation is a function of both the hydrostatic pressure
computed from the displacement field and the interpolated pressure from the unknown nodal variables. The term is a function of the adopted hyperelastic constitutive model. In the present study, we adopted the
following transversely isotropic model for muscles,
pas matrix fibertranverselyW W W= + (6)
The term corresponds to the connective tissues of muscles and is defined as a Mooney-Rivlin material (Chi et al., 2010),
( ) ( )2
1 21
3 3i jmatrix
iji j
W c I I+ =
= − −∑ (7)
where are material constants. and are the reduced invariants of defined as and 2 2
2 1/ 2[ ( ) ( )]I tr tr= −C C . The term corresponds to the muscle fibers and connects the Cauchy stress in the fiber direction to the fiber stretch by the relation
00
fiberpas pas pasfiber fiber
Wf
λλ σ σλ λ
∂ = =∂
(8)
where is a material constant and is the optimal fiber stretch. is the normalized passive force given by
*1 2
*1 2 2 1 2
0,
[exp{ ( 1)} 1],
exp(0.4 )*( 1.4) [exp(0.4 ) 1],
pasfiberf γ γ λ
γ γ γ λ γ γ
= − − − + −
*
*
*
1
1 1.4
1.4
for
for
for
λλ
λ
≤< ≤
>
(9)
where and are material constants and is the normalized stretch defined as (Blemker et al., 2005).
The passive Cauchy stress component in the fiber direction in Eq. (1) is written as
( )1pas pas Tf J
σ = ⋅ ⋅ ⊗F S F a a (10)
= ∂ ∂F x X
23J −=C C
detJ = F k1J − k → +∞
p pɶ
Wpas
transverselyW
matrixW
ijc 1I 2I C 1 ( )I tr= CfiberW
pasfiberσ λ
0pasσ 0λ pas
fiberf
1γ 2γ *λ *0/λ λ λ=
a
3

2
Yamamura, Alves, Oda, Kinugasa and Takagi, Journal of Biomechanical Science and Engineering, Vol.9, No.3 (2014)
© 2014 The Japan Society of Mechanical Engineers[DOI: 10.1299/jbse.13-00294]
2.2 Muscle active behavior We adopted a Hill-type model for the muscle activation model (Johansson et al., 2000), the Cauchy stress
component in the fiber direction in Eq. (1) is defined as
act isomf t l vf f fσ σ ⋅ ⋅ ⋅= (11)
where is the isometric stress, is the activation function, is the length dependence factor, and is the velocity dependence factor. When fibers are positively stretched, the area of the cross section (whose normal is along the fiber direction) decreases, but not the number of fibers, and thus, in an incompressible material, the isometric stress changes in accordance with
00 0
0
isom isom isomA
A
λσ σ σλ
= ⋅ = ⋅ (12)
where is the maximum isometric stress that occurs at the optimum fiber stretch . and are the areas of the cross section in the current and optimum configurations, respectively. The term is a time-history of activation, being approximated by a piecewise linear function. For the term , we adopted the following function of fiber strain (Jenkyn et al., 2002).
( )( )
31
22
exp 0( )
exp 0
f f
l f
f f
b forf
b for
ε εε
ε ε
≤=
>
(13)
where are material constants. The fiber strain is defined by . For the term , we adopted the following function of fiber strain rate (Nagano and Gerritsen, 2001),
1 21
2
12
3
3 5 12
5
0 12.5
(1 )12.5 0
( )0 8.556
28.556
f
ff
v ff
f
ff
for
k kk for
k
cfc for
c
c k cc for
k
ε
εε
ε εε
εε
< −
+ − − ≤ ≤ − += − < ≤ − + − − − <
ɺ
ɺɺ
ɺɺ
ɺ
ɺɺ
(14)
where . and are material constants. A schematic
representation of tf , and is shown in Figure 1.
Fig. 1 Schematic representation of Hill type model factors. (a) the activation level, (b) the length dependence factor and (c)
the velocity dependence factor of the active stress. Activation level 1.0 indicates the maximal voluntary contraction.
isomσ tf lf vf
0isomσ 0λ A
0A
tf
lf
fε
1 2andb b * 1fε λ= − vf
fεɺ
22 2 1
1 2 4 31 3 2
(1 ),
(1 ) 1
k c cc c k and c
k k c
+= = − =
+ + 1 2 3 4, , ,k k k k 5k
lf vf
4

2
Yamamura, Alves, Oda, Kinugasa and Takagi, Journal of Biomechanical Science and Engineering, Vol.9, No.3 (2014)
© 2014 The Japan Society of Mechanical Engineers[DOI: 10.1299/jbse.13-00294]
3. Numerical simulation
3.1 FE-model of triceps surae muscle The FE-model shown in Figure 2 was adopted to simulate the isometric contraction of the human triceps surae
muscle. One subject was positioned in the foot-first supine position on the bed of a 1.5-T EXELART MR scanner (Toshiba Medical Systems, Japan). The right lower leg was fastened with a Velcro tape at an ankle angle of 90° and a knee angle of 180°. Axial MR images were acquired with a spin echo sequence (repetition time 600 ms, echo time 15 ms, matrix 256 × 256, FOV 256 × 256 mm, slice thickness 3 mm, slice interval 0 mm). The each tissue was manually segmented into gastrocnemius of medial and lateral heads (LG and MG), soleus muscles and Achilles tendon with a part of the deep aponeurosis. The geometry was discretized into 8-node hexahedral elements. The boundary nodes of the each muscle and tendinous tissue are coincident, and we assumed that the boundary surfaces could not slide each other. We modeled muscle fiber distributions from fascicle arrangement measured by 2D ultrasound images (Kawakami et al., 1998). The pennation angles of the medial and lateral gastrocnemius and soleus muscle were defined in sagittal planes of A and B, as shown in Figure 3, and the angles were ���
���= 24°, ���
���= 13° and ���� = 21°. The fiber
orientations were set at each material point (Gauss point) of the finite elements. This MRI measurement was approved by the ethical committee of RIKEN and was consistent with their
requirements for human experimentation. The subject was fully informed of the procedures to be utilized as well as purpose of this study.
Fig. 2 FE-model of the triceps surae muscle. From the view of (a) the back side and (b) the medial side of the human body. The
models are segmented into gastrocnemius (LG and MG) and soleus muscles and tendinous tissue. (c) The tendinous
tissue is composed of a deep aponeurosis and an external tendon parts.
Fig. 3 Schematic drawing of calf of right leg from back side and the muscle fascicle (fiber bundle) orientations in sagittal
planes A and B. In the sagittal planes, the fibers are arranged at a pennation angle of ���
���= ��°, ���
���= ��° and
���� = ��° from the z-direction.
5
2
Yamamura, Alves, Oda, Kinugasa and Takagi, Journal of Biomechanical Science and Engineering, Vol.9, No.3 (2014)
© 2014 The Japan Society of Mechanical Engineers[DOI: 10.1299/jbse.13-00294]
3. 2 Simulation conditions and material properties For the simulation of the isometric contraction, the nodes of the insertions with bones, i.e. femur, fibula, tibia and
calcaneus, were fixed in all directions. A 100% maximal voluntary contraction (MVC), whose time history is shown in Fig.1 (a), was applied to the all muscles for the contraction. We choose a sufficiently small size of the time increments, in order to avoid affecting the generated force. The material properties of muscle tissues used in the simulation are listed in Table 1. The bulk modulus k was defined to be 1000 times the shear modulus of the tissue (Blemker et al., 2005), which then means that the material is almost incompressible. The difference of the generated forces was less than 0.1 % between calculation with k and much greater than k.
Table 1 Material parameters of muscle tissue used in the simulation
Bulk modulus [MPa] � 52.6
Muscle matrix constants in Eq. (7) a [MPa]
� ! 6.43E-2 �!
-3.80E-2
�"! 0.94E-2 �
-4.32E-5
�!" 0.50E-5
Muscle fiber constants in Eqs. (8) and (9) b #!$�� 0.3 [MPa] %! 0.85
γ 0.05 γ" 6.6
Length dependence factor in Eq. (13) c b1 10.0 b2 -6.0
Velocity dependence factor in Eq. (14) d
k1 0.4 k2 5.0
k3 2.0 k4 1.5
k5 200.0
a: Chi et al. 2010, b: Blemker et al. 2005, c: Jenkyn et al. 2002, d: Nagano and Gerritsen, 2001
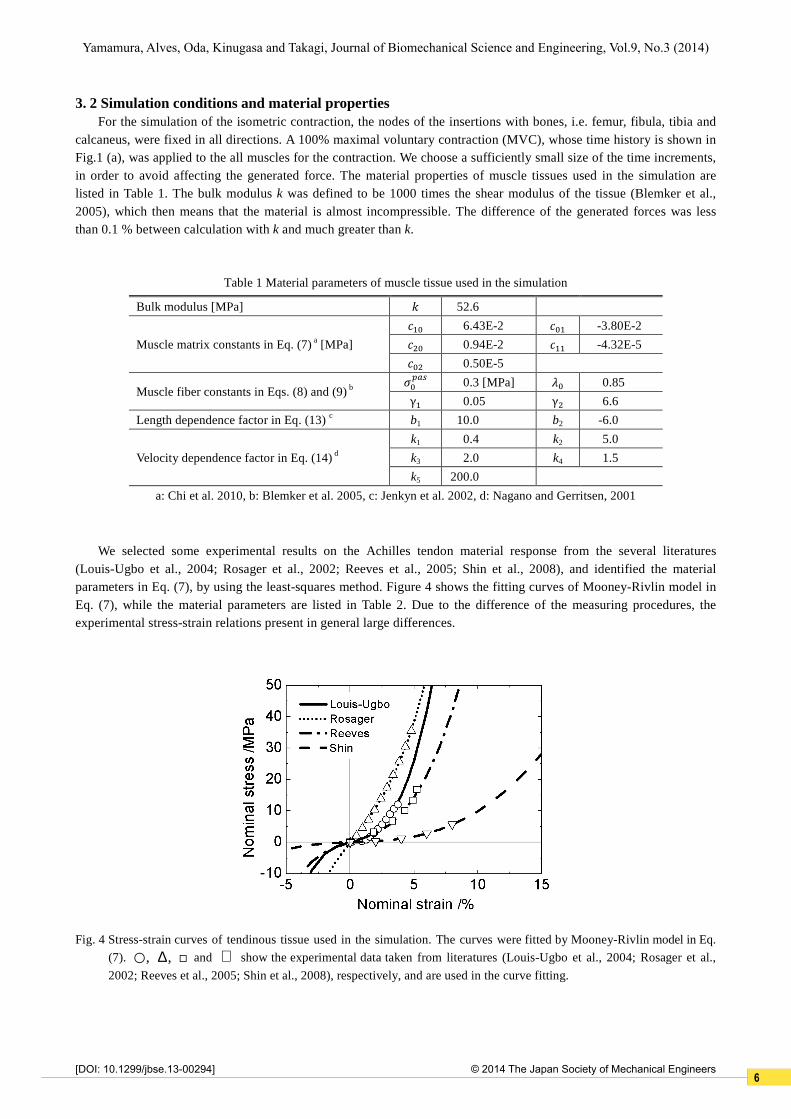
We selected some experimental results on the Achilles tendon material response from the several literatures (Louis-Ugbo et al., 2004; Rosager et al., 2002; Reeves et al., 2005; Shin et al., 2008), and identified the material parameters in Eq. (7), by using the least-squares method. Figure 4 shows the fitting curves of Mooney-Rivlin model in Eq. (7), while the material parameters are listed in Table 2. Due to the difference of the measuring procedures, the experimental stress-strain relations present in general large differences.
Fig. 4 Stress-strain curves of tendinous tissue used in the simulation. The curves were fitted by Mooney-Rivlin model in Eq.
(7). and show the experimental data taken from literatures (Louis-Ugbo et al., 2004; Rosager et al.,
2002; Reeves et al., 2005; Shin et al., 2008), respectively, and are used in the curve fitting.
, ,∆○ □ ∇
6

2
Yamamura, Alves, Oda, Kinugasa and Takagi, Journal of Biomechanical Science and Engineering, Vol.9, No.3 (2014)
© 2014 The Japan Society of Mechanical Engineers[DOI: 10.1299/jbse.13-00294]
Table 2 Material parameters of tendinous tissues
Bulk modulus [MPa] Mooney-Rivlin parameters [MPa]
� � ! �! �"! � �!"
Louis-Ugbo a 3.21E4 1.24E1 3.62E0 5.83E2 1.80E3 3.11E3
Rosager b 1.73E5 4.48E1 4.19E1 7.54E2 1.19E3 1.66E3
Reeves c 4.13E4 8.57E0 1.21E1 9.36E2 7.18E2 4.80E2
Shin d 4.68E3 1.11E0 1.23E0 1.01E2 1.02E2 1.03E2
a: Louis-Ugbo et al., 2004, b: Rosager et al., 2002, c: Reeves et al., 2005, d: Shin et al., 2008
Fig. 5 Typical simulation results during isometric contraction of the triceps surae muscle. (a) Displacement distribution was
calculated along the longitudinal z-direction. (b) The fiber orientation before and at the end of the activation in a
sagittal plane was indicated red lines inside of the lateral gastrocnemius and soleus muscles. (c) The vectors of were
indicated the nodal force vectors at the end of the activation.
7

2
Yamamura, Alves, Oda, Kinugasa and Takagi, Journal of Biomechanical Science and Engineering, Vol.9, No.3 (2014)
© 2014 The Japan Society of Mechanical Engineers[DOI: 10.1299/jbse.13-00294]
3. 3 Simulation results of isometric contraction of triceps surae muscle Examples of typical results of the simulation are shown in Figure 5. These results were simulated by using
Louis-Ugbo's material model. The muscles contracted along the fiber direction. Almost all muscle fibers were shortened during the contraction. The average nominal fiber shortening strain of muscles from the initial condition was 0.57 in the gastrocnemius muscle and was 0.38 in the soleus muscle, respectively. As a result of the muscle fiber shortening, the outer surface of the gastrocnemius and soleus muscle is moved distally (Fig.5 (a)). Their surfaces were maximally displaced by around 30.2 mm in the gastrocnemius muscle and 25.4 mm in the soleus muscle, respectively. The fiber pennation angles in a sagittal plane increased with increasing the activation level (Fig.5 (b)). The average pennation angle changes of each muscle in the volume from initial to the end of the activation were 29.0 degree in the MG, 32.0 degree in the LG and 25.0 degree in the soleus muscle, respectively. Due to the widening of the pennation angles, the aponeurosis, where located in between the gastrocnemius and soleus muscles, is moved proximally during the contraction, indicating the Achilles tendon stretch along the proximal-distal axis. As a result of the stretch of the Achilles tendon through the aponeurosis, the nodal forces at the end of the activation were generated on the part of the fixed nodes at the insertion with the bones (Fig.5(c)).
3. 4 Effect of tendon stiffness on the strains of tendinous tissue The longitudinal nominal strains of the deep aponeurosis and of the external tendon at the end of the activation are
Table 3. The strain of the aponeurosis and the external tendon ranged from 0.009 to 0.047 and from 0.047 to 0.144, respectively. The strains decreased in proportion with the stiffness of the tendon. There is a significant difference in the strain between the aponeurosis and the external tendon. The strains of the external tendon were 2.9 to 5.3 times greater than the strain of the aponeurosis in this simulation.
Table 3 Longitudinal nominal strains of the deep aponeurosis and of the external tendon at the end of the activation
Louis-Ugbo a Rosager b Reeves c Shin d
Strain Deep aponeurosis 0.021 0.009 0.019 0.047
External tendon 0.072 0.047 0.055 0.144
a: Louis-Ugbo et al., 2004, b: Rosager et al., 2002, c: Reeves et al., 2005, d: Shin et al., 2008
3. 5 Effect of tendon stiffness on the generated force at the Achilles tendon The effects of tendon stiffness on the generated force at the Achilles tendon at the end of the activation are shown
in Table 4. The generated force at the insertion of the Achilles tendon, as shown in Fig.5(c), is the resultant of the components in the longitudinal z-direction of the forces at the calcaneus. The generated forces ranged from 467.5 to 676.2 N. The stiffer tendon generated higher force at the Achilles tendon than the low-stiffness tendon, and the largest generated force was 1.45 times greater than the smallest one.
Table 4 Generated forces at the Achilles tendon at the end of the activation
Louis-Ugbo a Rosager b Reeves c Shin d
Generated force [N] 645.6 676.2 616.5 467.5
a: Louis-Ugbo et al., 2004, b: Rosager et al., 2002, c: Reeves et al., 2005, d: Shin et al., 2008
4. Discussion We have developed here 3D FE software to simulate both the passive behavior of biological soft tissues and the
muscle active behavior, and simulated the 3D FE-model of a human triceps surae muscle during isometric contraction. This is the first use of the complex architecture within triceps surae muscle and highlights the potential for FEM
8

2
Yamamura, Alves, Oda, Kinugasa and Takagi, Journal of Biomechanical Science and Engineering, Vol.9, No.3 (2014)
© 2014 The Japan Society of Mechanical Engineers[DOI: 10.1299/jbse.13-00294]
studies. For the FE analyses of skeletal muscles, to reconstruct the high quality FE-mesh of the soft tissues from in vivo measured experimental data is difficult and laborious task. Our developed software is closely coupled with other VCAD software that provides powerful tools linking the 3D measurement data reconstruction to the 3D FE mesh generation and simplification (Teodosiu, 2010). The most difficult problem in the FE simulation of soft tissues is to obtain the material properties, especially the in vivo mechanical response. The passive material response of biological soft tissue has anisotropic behavior due to the fiber distribution and highly nonlinearity. In many situations, to identify the material parameters is difficult or even impossible to perform. Hence, in several cases, an inverse analysis is used to obtain the material parameters (e.g., Kroon and Holzapfel, 2008). Our software would be also a useful tool for identifying the material parameters in the passive behavior of biological soft tissues, such as muscle and tendinous tissues by inverse FEM analysis.
For tendon material, in vivo stress-strain relation has been acquired from medical image modalities, such as MRI and ultrasonography. The strain in human gastrocnemius aponeurosis (1.4± 0.4%) and external tendon (8.0± 1.2%) identified by Magnusson et al. (2003) are within the range of the present our simulation. The difference of the strain between the deep aponeurosis and the external tendon was observed in a FEM simulation and also in experiments (e.g., Chi et al., 2010; Magnusson et al., 2003; Kinugasa et al., 2008). In the experiments of Magnusson et al. (2003), the strain of the external tendon was 5.7 times greater than the strain of the aponeurosis during isometric contraction. The discrepancies of the simulation results with experimental results could arise from differences in the definition of the strain as well as morphological properties. A simple geometrical consideration would predict that an unconstrained external tendon would displace more under tension, compared to the aponeurosis. Consequently, the stress-strain relation obtained from the strain of the external tendon (Shin’s model) has low stiffness compared to the relation obtained from the strain of aponeurosis by ultrasonography (Rosager’s model and Reeves’s model), as shown in Fig. 4.
From our experimental observation of triceps surae muscle in plantar flexors, the Achilles tendon force was estimated to be 1319.5 N. The experimental Achilles tendon force data did not support our simulation: 1.95-2.82 times larger. One of the reasons of this relatively large difference lies in the initial condition of the Achilles tendon. The Achilles tendon's material parameters were obtained from the experiments with various knee and ankle joint angles. In the present study, however, the initial configuration of Achilles tendon was defined as state at 90 degrees of the ankle joint angle, due to the difficulty of the identification of the stress free condition of the tendon from the in vivo experiments. Therefore, the differences in the initial length and cross-section of the Achilles tendon in the experiments are not considered in the present simulation. The Achilles tendon is initially in the state which already stretched (Muraoka et al., 2002), just as that of the muscles. Thus, the initial stretch of the tendon should be taken into consideration in the simulation. As a result, the passive tensile force is applied to the Achilles tendon initially and the tendon force increases more during the isometric contraction.
Geometrical effects also affect to the generated force at the Achilles tendon. The velocity dependence factor of the active muscle parameter always saturated to steady value at the end phase of the contraction (i.e., maximal force contraction). Thus, the generated force was controlled by the length dependence factor. The muscle fibers were shortened during the isometric contraction. The experimental shortening strain and pennation angles in the maximal voluntary isometric plantar flexion were acquired by Kawakami et al. (1998). The FEM results of the shortening strain were 1.4 times in MG, 1.8 times in LG and 1.2 times in soleus muscle greater than the experimental results. The pennation angle changes during the contraction estimated by the FEM simulation were also 1.8 times in MG, 2.9 times in LG and 1.3 times in soleus muscle greater than the experimental ones. The larger shortening strains and the pennation angles in FEM results of gastrocnemius muscle (MG and LG) would arise from less constraint of the outer surface of the gastrocnemius muscle. If the muscle fiber shortening is constraint, the generated force will increase more. Fascia has well been known as a membrane of covering muscles (Findley, 2009), which is in general much stiffer than the muscle’s material itself. Therefore, fascia would play a significant role in the mechanics of muscles and musculo-skeletal systems, and would have influence the amount of force production. It should be noted that the fascia is not considered in the present simulation, due to the difficulty of the reconstruction of a 3D FE-model of the fascia from in vivo images.
5. Summary
A 3D FE software has been developed to simulate both the passive behavior of biological soft tissues and the
9

2
Yamamura, Alves, Oda, Kinugasa and Takagi, Journal of Biomechanical Science and Engineering, Vol.9, No.3 (2014)
© 2014 The Japan Society of Mechanical Engineers[DOI: 10.1299/jbse.13-00294]
muscle active behavior of 3D skeletal muscles. In the present study, we investigated the effect of tendon stiffness on the generated force at the Achilles tendon during isometric contraction of the triceps surae muscle. Consequently, the stiffer tendon generated higher force at the Achilles tendon and the largest generated force was 1.45 times greater than the smallest one. The mechanical responses of the contractile muscles were greatly affected by the material parameters, indicating it is important to carefully obtain the material parameters from in vivo experimental observations.
Acknowledgements
This study was supported by HPCI STRATEGIC PROGRAM Computational Life Science and Application in Drug
Discovery and Medical Development by MEXT.
References
Agur, A., Ng-Thow-Hing, V., Ball, K.A., Fiume, E., McKee, N., Documentation and three-dimensional modelling of
human soleus muscle architecture, Clinical Anatomy, Vol.16, No.4 (2003), pp.285-293. Alves, J.L., Yamamura, N., Oda, T., Teodosiu, C., Numerical simulation of musculo-skeletal systems by V-Biomech, In
Proceedings of the 9th International Symposium on Computer Methods in Biomechanics and Biomedical Engineering, (2010), Valencia, Spain.
Blemker, S.S., Pinskya, P.M., Delp, S.L., A 3D model of muscle reveals the causes of nonuniform strains in the biceps brachii, Journal of Biomechanics, Vol.38, (2005), pp.657-665.
Chi, S.W., Hodgson, J., Chen, J.S., Edgerton, V.R., shin, D.D., Roiz, R.A., Sinha, S., Finite element modeling reveals complex strain mechanics in the aponeurosis of contracting skeletal muscle, Journal of Biomechanics, Vol.43, (2010), pp.1243-1250.
Findley, T.W., International Journal of Therapeutic Massage and Bodywork, Vol.2 (2007), pp.1-6. Hatze, H., Myocybernetic control models of skeletal muscle: characteristics and applications, University of South
Africa, (1981), Pretoria. Jenkyn, T.R., Koopman, B., Huijing, P., Lieber, R.L., Kaufman, K.R., Finite element model of intramuscular pressure
during isometric contraction of skeletal muscle, Physics in Medicine and Biology, Vol.47, (2002), pp.4043-4061. Johansson, T., Meier, P., Blickhan, R., A Finite-Element Model for the Mechanical Analysis of Skeletal Muscles,
Journal of Theoretical Biology, Vol.206, (2000), pp.131-149. Kawakami, Y., Ichinose, Y., Fukunaga, T., Architectural and functional features of human triceps surae muscles during
contraction, Journal of Applied Physiology, Vol.85, (1998), pp.398-404. Kinugasa, R., Shin, D., Yamauchi, J., Mishra, C., Hodgson, J.A., Edgerton, V.R., Sinha1, S., Phase-contrast MRI
reveals mechanical behavior of superficial and deep aponeuroses in human medial gastrocnemius during isometric contraction, Journal of Applied Physiology, Vol.105, (2008), pp.1312-1320.
Kroon, M., Holzapfel, G.A., Estimation of the distributions of anisotropic, elastic properties and wall stresses of saccular cerebral aneurysms by inverse analysis, Proceedings of the Royal Society A, Vol.464, (2008), pp.807-825.
Lieber, R.L., Friden, J., Functional and clinical significance of skeletal muscle architecture, Muscle Nerve, Vol.23, (2000), pp.1647-1666.
Louis-Ugbo, J., Leeson, B., Hutton, W.C., Tensile properties of fresh human calcaneal (Achilles) tendons, Clinical Anatomy, Vol.17, (2004), pp.30-35.
Magnusson, S.P., Hansen, P., Aagaard, P., Brond, J., Dyhre-Poulsen, P., Bojsen-Moller, J., Kjaer, M., Differential strain patterns of the human gastrocnemius aponeurosis and free tendon, in vivo, Acta Physiologica Scandinavica, Vol.177, (2003), pp.185-195.
Muraoka, T., Muramatsu, T., Takeshita, D., Kawakami, Y., Fukunaga, T., Length Change of Human Gastrocnemius Aponeurosis and Tendon during Passive Joint Motion, Cells Tissues Organs, Vol.171, (2002), pp.260-268.
Nagano, A., Gerritsen, K.G.M., Effects of neuromuscular strength training on vertical jumping performance – A computer simulation study, Journal of Applied Biomechanics, Vol.17, (2001), pp.113–128.
Reeves, N.D., Maganaris, C.N., Ferretti, G., Narici, M.V., Influence of 90day simulated microgravity on human tendon mechanical properties and the effect of resistive countermeasures, Journal of Applied Physiology, Vol.98, (2005), pp.2278-2286.
10

2
Yamamura, Alves, Oda, Kinugasa and Takagi, Journal of Biomechanical Science and Engineering, Vol.9, No.3 (2014)
© 2014 The Japan Society of Mechanical Engineers[DOI: 10.1299/jbse.13-00294]
Rosager, S., Aagaard, P., Dyhre-Poulsen, P., Neegaard K., Kjaer, M., Magnusson, S.P., Load-displacement properties of the human triceps surae aponeurosis and tendon in runners and non-runners, Scandinavian Journal of Medicine & Science in Sports, Vol.12, (2002), pp.90-98.
Shin, D., Finni, T., Ahn, S., Hodgson, J.A., Lee, H.-D., Edgerton, V.R., Sinha, S., Effect of chronic unloading and rehabilitation of human Achilles tendon properties: a velocity-encoded phase-contrast MRI study, Journal of Applied Physiology, Vol.105, (2008), pp.1179-1186.
Sussman, T., Bathe, K.-J., A FE Formulation for Nonlinear Incompressible Elastic and Inelastic Analysis, Computer & Structures, Vol.26, (1987), pp.357-409.
Tang, C.Y., Zhang, G., Tsui, C.P., A 3D skeletal muscle model coupled with active contraction of muscle fibers and hyperelastic behaviour, Journal of Biomechanics, Vol.42, (2009), pp.865-872.
Teodosiu, C., VCAD Software for FEM Simulations in Manufacturing, Materials Design, and Biomechanics, In Proceedings of the 4th symposium on Volume-CAD System Research Program, (2010), RIKEN, Japan.
Yucesoy, C.A., Koopman, B.H., Huijing, P.A., Grootenboer, H.J., Three-dimensional finite element modeling of skeletal muscle using a two-domain approach: linked fiber-matrix mesh model, Journal of Biomechanics, Vol.35, (2002), pp.1253-1262.
Zajac, F.E., Muscle and tendon: properties, models, scaling, and application to biomechanics and motor control, Critical Reviews in Biomedical Engineering, Vol.17, (1989), pp.359-411.
11