effect of shear reinforcement on seismic … of the tenth pacific conference on earthquake...
TRANSCRIPT

Proceedings of the Tenth Pacific Conference on Earthquake Engineering Building an Earthquake-Resilient Pacific
6-8 November 2015, Sydney, Australia
1
Effect of Shear Reinforcement on Seismic Performance of RC Beam-Column Joints
C.G. Kim & H.G. Park Department of Architecture, Seoul National University, Seoul, Korea.
T.S. Eom Department of Architectural engineering, Dankook University, Yongin, Korea.
T.W. Kim Division of Urban, Design & Architecture, Kangwon National University, Chuncheon, Korea.
ABSTRACT: In many old one or two story buildings, horizontal hoops were not used in the beam-column joints due to lack of proper design codes and difficulty in construction. Further, weak-columns and strong-beams were used due to the short building height. Such beam-column joints are known to be vulnerable to earthquake loading. In this study, cyclic loading tests were performed to evaluate the strength of beam-column joints. The test parameters were the use of lateral hoops and types of joints (i.e. exterior joint or interior joint). The test results showed that the joint strength and deformation capacity were proportional to the ratio of lateral hoops. In exterior joints, hoops with spacing less than 100mm 0.29 minimum column width) successfully attained the joint shear strength of ASCE41-13. In the interior joints, on the other hand, the joint shear strength was achieved without using joint hoop reinforcement because their joints were confined on two opposite faces by the beams. The test strengths correlated well with the joint shear strengths specified in ASCE41-13, depending on confirming and non-conforming transverse reinforcement details.
1 INTRODUCTION
One or two story low-rise buildings generally show weak-column and strong-beam behaviour under seismic loads because architecturally small columns are preferred. Further, in old low-rise buildings, hoop reinforcements was seldom used in the beam-column joints due to consider only gravity load in structural design (See Figure 1). In such conditions, the beam-column joints and the overall structures are vulnerable to earthquake loading. The lack of hoop reinforcement in beam-column joints is attributed to absence of proper design codes for low-rise buildings and difficulty in placing hoop bars in the joints. The current design guideline for low-rise buildings in Korea (KSEA 2012) do not specify the requirement of joint shear reinforcement. On the other hand, the requirements of ACI318-14 could be excessive for low-rise RC buildings in moderate seismic zones. In ASCE41-13, nominal strength for joint shear, , is defined as follows
0.083γ (1)
where is the effective horizontal joint area and γ is the coefficient addressing the joint confinement by transverse beams and the detailing of transverse reinforcement (see Table 1). The joint shear strength
for conforming transverse reinforcement is same as that of ACI318-14.
Figure 1. Joint details of old one or two story buildings in Korea

2
In several previous studies, beam-column joints using non-seismic details have been investigated. Park (2012) studied the influence of aspect ratio(beam depth / column width = 0.7 ~ 2.5) on exterior beam-column joints. The failure mode was changed from beam flexural failure to joint shear failure as the aspect ratio increased. Lee (2009) investigated the deformation capacity of exterior joints with non-seismic details. The specimens without hoop reinforcement showed joint shear failure before flexural yielding of beams. Kwon (2003) tested full-scale exterior joints designed according to the weak-column and strong-beam philosophy. The specimen was damaged by shear cracks in the joint and column, and failed due to joint shear cracking. Pampanin (2002) investigated the seismic behaviour of various types of joints designed only for gravity load. The knee joint and interior joint showed relatively high deformation capacity exceeding drift ratio of 3.0%. On the other hand, the exterior joint failed due to joint shear cracking showing drift ratio less than 1.0%. In the study of Calvi (2002), the static test on a three story RC frame designed for gravity load, similar behaviour was observed. In the drift ratio of 1.6% at the top floor, the exterior joints were severely damaged by diagonal shear cracking but the interior and knee joints were not. Plastic hinges occurred in the interior columns and the bottom of the columns. Hwang (2005) studied the effects of shear reinforcement on shear strength of exterior joints. Adequate joint performance was achieved even though the amount of joint shear reinforcement did not conform the requirement of ACI318. Murty (2003) studied the effectiveness of reinforcement details in exterior beam column joints of gravity designed reinforced concrete frames. Low ductility and poor energy dissipation were shown with excessive shear cracking in the joints due to small size of joints.
2 TEST PROGAM
2.1 Test specimens
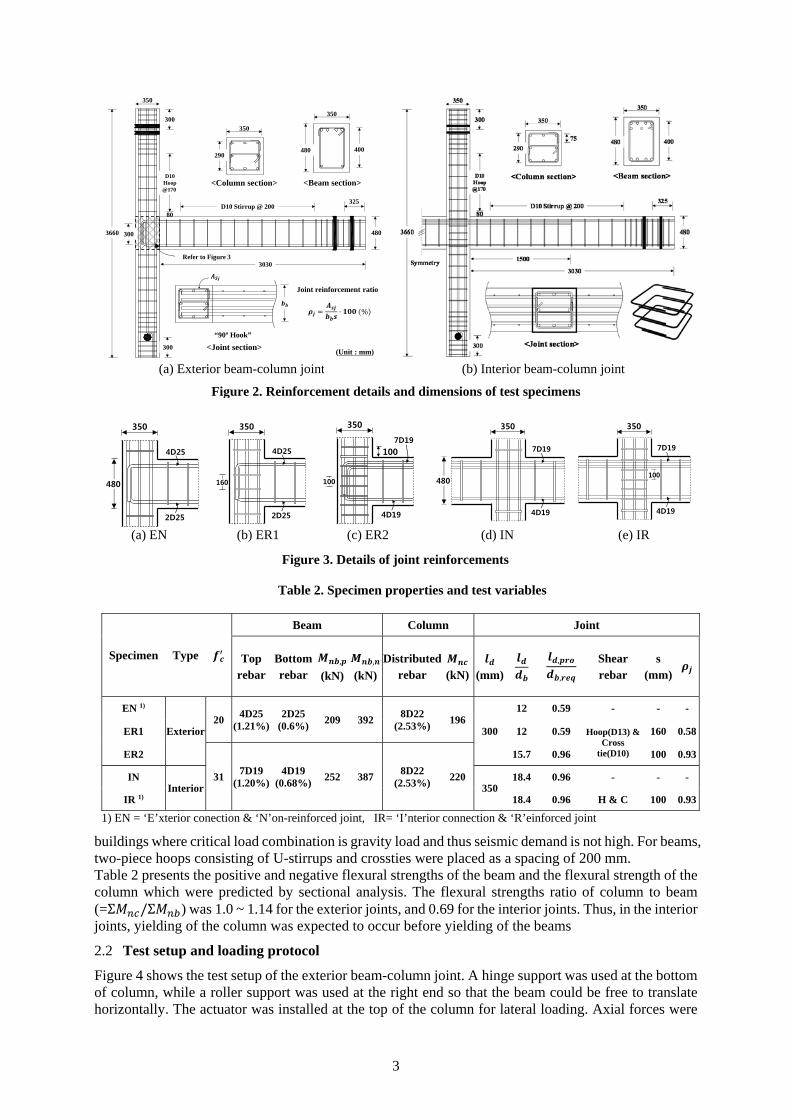
A cyclic loading test for interior and exterior beam-column joints were performed to evaluate the effects of joint shear reinforcement and joint types. Three exterior and two interior joints having the configuration and reinforcement details shown in Figure 2 were tested. The main test parameters were the joint reinforcement ratio, beam longitudinal bar diameter, and joint types (i.e. exterior or interior joint) (see Figure 3). The joint reinforcement ratio ( / ranged from 0 to 0.93%. is total cross sectional area of joint transverse reinforcement, including crossties, within spacing . is width of beam. is center-to-center spacing of transverse reinforcement. To study the effect of the development length of beam longitudinal bars, D19( =287 mm2) and D25( =507 mm2) bars were used for the top and bottom reinforcements of the beams. For the exterior joint specimens, the beam flexural reinforcement were anchored within the joint area using standard 90-degree hooks. On the other hand, the beam reinforcement of the interior joint specimens was extended through the joint area. Figure 2 shows the configurations and reinforcement details of specimens. The cross-sectional dimensions of the column and beam were 350 mm x 350 mm and 350 mm x 400 mm, respectively. The overall length of the beam is 3060 mm and the net length between the center of the column and the beam support is 2880 mm. SD500 (Grade 500 MPa) and SD400 (Grade 400 MPa) steel bars were used for longitudinal and transverse reinforcements, respectively. The diameter of reinforcing bars is presented in Figure 2 and Table 2. For columns, the rectangular hoops with 90-degree anchorage hooks were used in a spacing of 170 mm. Such non-seismic hoop detail was used for better constructability in low-rise
Table 1. γ for joint shear strength
Transverse Reinforcement
Interior joint w/ transverse
beams
Interior joint w/o transverse
beams
Exterior joint w/ transverse
beams
Exterior joint w/o transverse
beams
Knee joint w/ or w/o transverse
beams
C * 20 15 15 12 8
NC * 12 10 8 6 4 * “C” and “NC” are abbreviations for “conforming” and “nonconforming” transverse reinforcement. Joint transverse
reinforcement is “conforming” if the hoops are spaced at ≤ hc/2 within the joint.
3
buildings where critical load combination is gravity load and thus seismic demand is not high. For beams, two-piece hoops consisting of U-stirrups and crossties were placed as a spacing of 200 mm. Table 2 presents the positive and negative flexural strengths of the beam and the flexural strength of the column which were predicted by sectional analysis. The flexural strengths ratio of column to beam (=Σ /Σ ) was 1.0 ~ 1.14 for the exterior joints, and 0.69 for the interior joints. Thus, in the interior joints, yielding of the column was expected to occur before yielding of the beams
2.2 Test setup and loading protocol
Figure 4 shows the test setup of the exterior beam-column joint. A hinge support was used at the bottom of column, while a roller support was used at the right end so that the beam could be free to translate horizontally. The actuator was installed at the top of the column for lateral loading. Axial forces were
(a) EN (b) ER1 (c) ER2 (d) IN (e) IR
Figure 3. Details of joint reinforcements
(a) Exterior beam-column joint (b) Interior beam-column joint
Figure 2. Reinforcement details and dimensions of test specimens
Table 2. Specimen properties and test variables
Specimen Type
Beam Column Joint
Top rebar
Bottom rebar
,
(kN),
(kN)
Distributedrebar (kN) (mm)
,
,
Shear rebar
s (mm)
EN 1)
Exterior 20
4D25 (1.21%)
2D25 (0.6%)
209 3928D22
(2.53%) 196
300
12 0.59 - - -
ER1 12 0.59 Hoop(D13) & Cross
tie(D10)
160 0.58
ER2
31 7D19
(1.20%) 4D19
(0.68%) 252 387
8D22 (2.53%)
220
15.7 0.96 100 0.93
IN Interior 350
18.4 0.96 - - -
IR 1) 18.4 0.96 H & C 100 0.93
1) EN = ‘E’xterior conection & ‘N’on-reinforced joint, IR= ‘I’nterior connection & ‘R’einforced joint
350
4D25
2D25
480 160
350
4D25
2D25
100
100
350
7D19
4D19
350
7D19
4D19
480100
350
7D19
4D19
3660
3030
D10Hoop@170
350
480
300
D10 Stirrup @ 200325
300
350
290
<Column section>
350
480 400
<Beam section>
80
<Joint section>
“90º Hook”
300(Unit : mm)
Refer to Figure 3
Joint reinforcement ratio

4
not applied to columns because the level of axial load is low in the low-rise buildings. The loading protocol in Figure 5 was planned according to ACI374.1. The first lateral drift ratio was 0.25% in the elastic range. The drift ratio was increased in the rate of 1.25 ~ 1.5 times the previous drift ratio. The cyclic loading was repeated three times in each drift level and was terminated when the post peak load decreased to 80% of the peak load. The load cell, LVDTs, and steel and concrete strain gauges were used for test measurements. Lateral load and displacement at the loading point, respectively, were measured by the load cell in the actuator and the line LVDT attached directly to the column. The measured displacement was calibrated by using horizontal and vertical slips ( , ) measured at the supports.
3 MATERIAL STERNGTH AND STRENGTH PREDICTIONS
3.1 Concrete and re-bars
Concrete cylinders were tested on the day of testing. The average compression strengths of the three cylinders were 20 MPa for specimens EN and ER1 and 31 MPa for specimens ER2, INS, and IR. The maximum aggregate size was 25 mm. The yield strengths ( ) of the shear reinforcement were 552 ~ 576 MPa for SD400 D10 bars and 481 ~ 528 MPa for SD400 D13 bars. The yield strengths of the longitudinal reinforcement were 550 MPa for SD500 D19 bars, 565 ~ 577 MPa for SD500 D22 bars, and 550 ~ 588 MPa for SD500 D25 bars.
3.2 Strength predictions of test specimens
Since the specimens have relatively small joint dimensions, the load-carrying capacity of the connection can be governed by either flexural yielding of beams and columns or joint shear. The nominal strength of the connection developed by each mechanism can be calculated as follows.
Figure 4. Test setup Figure 5. Loading protocol
(a) External forces on the specimens (b) Forces on column (c) Flexural moment (d) Shear forces
Figure 6. External and internal forces acting on external joints
-8
-6
-4
-2
0
2
4
6
8
0 5 10 15 20 25 30 35
Dri
ft r
atio
(%
)
Number of cycle
0.25%
0.35%
0.5%
0.75%
1.0%
1.5%
2.0%
2.5%
3.5%
5.0%
6.0%

5
First, the moment strengths of beams and columns are calculated by sectional analysis. Then, the load-carrying capacity of the connections, and , corresponding to column yielding and beam yielding, respectively, are calculated from the force equilibrium of support reactions, as shown in Figure 6(a).
2 ⁄ (2)
0.5⁄ (3)
where = shear force applied to the column; = shear force applied to the beam; = flexural moment of the column end; = flexural moment of the beam end; , = heights of the column and beam; and , = lengths of the column and beam between support reactions. Next, the shear strength of beam-column joint ( ) can be estimated from Equation 1 and γ values in Table 1. On the other hand, the shear demand of the joint ( ) can be estimated using the internal resultants on the column face as follows (see Figure 6(b) ~ (d)).
(4)
/ 0.9 0.5 / 0.9 (5)
Figure 7. Lateral load and drift ratio relationships of test specimens
-200
-150
-100
-50
0
50
100
150
200
-7 -6 -5 -4 -3 -2 -1 0 1 2 3 4 5 6 7
Lat
eral
Loa
d (
kN
)
-200
-150
-100
-50
0
50
100
150
200
-7 -6 -5 -4 -3 -2 -1 0 1 2 3 4 5 6 7
Lateral Drift ratio(%)
Lat
eral
Loa
d (
kN
)
Lateral Drift ratio(%)
(a) EN (b) ER1
-200
-150
-100
-50
0
50
100
150
200
-7 -6 -5 -4 -3 -2 -1 0 1 2 3 4 5 6 7
(c) ER2
-200
-150
-100
-50
0
50
100
150
200
-7 -6 -5 -4 -3 -2 -1 0 1 2 3 4 5 6 7
(d) IN
-200
-150
-100
-50
0
50
100
150
200
-7 -6 -5 -4 -3 -2 -1 0 1 2 3 4 5 6 7
(e) IR
Lat
eral
Loa
d (
kN
)
-200
-150
-100
-50
0
50
100
150
200
-7 -6 -5 -4 -3 -2 -1 0 1 2 3 4 5 6 7
ENER1ER2INIR

6
4 TEST RESULTS
4.1 Lateral load – drift ratio relationships
The test results of hysteretic and envelope curves are shown in Figure 7. The values with white circles represent the positive and negative peak lateral loads. The predicted values , and , are joint shear strengths corresponding to the “conforming” and “non-conforming” hoops in Table 1. The magnitudes of predicted strengths were as follows: > > , > > , for the exterior joints; > > , > , for the interior joints. This result indicates that beam yielding or joint shear failure was expected for the exterior joints, column yielding or joint shear failure was expected for the interior joints. Exterior joint EN without shear reinforcement showed the maximum loads (= +44.7 and -32.9 kN) which were close to the joint strength for non-conforming reinforcement , (= 41 kN). In exterior joint CSU with shear reinforcement(s = 160 mm, = 0.58%), the maximum loads (= +66.6 and -36.1 kN) were 49% and 10% greater than that of EN in the positive and negative directions, respectively. However, although the shear re-bars were spaced at /2, the load carry capacity of ER1 was only 44 ~ 81% of the joint strength for conforming reinforcement , (= 82 kN). This is because the development length( ) of the beam longitudinal bars was 75% of the requirement of ACI318. In exterior joint ER2 with 0.91 (i.e. 91% of the development length of ACI318) and shear reinforcement spaced at 100 mm ( = 0.93%), the maximum loads (= +108 and -89 kN) increased and were close to , (= 102 kN) in the positive direction and (= -88kN) in the negative direction. The result indicates that the development length of beam longitudinal bars and the spacing of joint shear reinforcements significantly affect the joint shear strength. Interior joints IN and IR had development length of beam re-bars of 0.74 . In IN, the maximum loads
(= +144 and -137 kN) were close to the joint strength for conforming reinforcement , (= 128 kN) even without shear reinforcement in the joint. In IR with U-type shear reinforcement (s = 100 mm ( = 0.93%)), the maximum shear strengths (= +162 and -154 kN) were 12% greater than those of IN. The effective stiffness ( ) was estimated using the test results of envelope curves in Figure 7. The effective stiffness was defined by the secant stiffness corresponding to 60% of the maximum load as defined in ASCE41-13. Figure 8 shows the yield displacement (∆ ) and the post peak displacement (∆ ) corresponding to 80% of the maximum load. In Table 3, both yield and ultimate drift ratios (∆/L) increased when shear reinforcements increased in the joints. In exterior specimens EN and ER1 ( = 0, 0.58%), the yield drift ratio was 0.31 ~ 1.0% and the ultimate drift ratio was 1.98 ~ 3.59%, while the yield drift ratio was 1.74 ~ 1.93% and the ultimate drift ratio was 4.68 ~ 5.73% in exterior specimen ER2 ( = 0.93%). In interior specimen IN ( = 0%), the yield drift ratio was 1.78 ~ 1.83% and the ultimate drift ratio was 3.88 ~ 3.96%, while the yield drift ratio was 2.08~2.12% and the ultimate drift ratio was 5.00 ~ 5.25% in interior specimen IR ( = 0.93%).
4.2 Failure mode
Figure 9 shows damage propagations of test specimens in order of drift ratio, 1.5%, 3.5%, and 5.0%, or 6.0%. The number of diagonal shear cracking increased in the joint when the spacing of joint shear reinforcement decreased at the drift ratio of 1.5%. In the specimen ER2, over the eight diagonal cracks occurred in the joint, while three or four diagonal cracks were shown in the specimens EN and ER1.
Table 3 Yield and ultimate drift ratio and stiffness
Specimen Positive direction (+) Negative direction (-)
(kN/mm)
(%)
(%)
(kN/mm)
(%)
(%)
EN 1.69 0.84 2.97 3.5 3.27 0.31 1.98 6.4
ER1 2.13 1.00 3.59 3.6 2.12 0.55 2.27 4.1
ER2 2.00 1.74 4.68 2.7 1.44 1.93 5.73 3.0
IN 2.64 1.78 3.96 2.2 2.45 1.83 3.88 2.1
IR 2.44 2.12 5.25 2.5 2.42 2.08 5.00 2.4
Figure 8. Displacement of envelop curves

7
Similar phenomenon is found in the interior specimens. When sufficient shear reinforcements are applied in the joint or the joint shear strength is reached to , , the flexural cracks are evenly distributed along the beams and columns as shown in Figure 9(c) ~ (e) since the beam-column joint is working to connect the beams and columns even after many shear cracks are propagated in the joint. Failure state of EN and ER1 at the drift ratio of 3.5% demonstrates the joint performance for seismic action that the joint without adequate shear reinforcements and with short development length of beam longitudinal reinforcements accumulates huge damages along the joints and columns. On the other hand, relatively small damages inside the interior joint were occurred even in the specimen IN without joint shear reinforcement. It is noted that the interior joints are much safer than exterior joints in terms of stiffness, strength, energy dissipation, and failure mode in Figure 7 and figure 9.
5 CONCLUSIONS
In this study, five exterior and interior beam- column joints were tested to evaluate the effects of the joint shear reinforcement ratio and the joint types on the seismic behaviour of low-rise RC buildings. From the test, both the joint shear strength and deformation capacity were increased, especially in the exterior beam-column joints by increasing the joint shear reinforcement. In exterior joints, when spacing of joint shear reinforcements was smaller than 100 mm (0.29 minimum column width) and the development length of beam longitudinal bars satisfied the requirements of ACI318, the test strength agreed with the joint shear strength for conforming shear reinforcement of ASCE41-13.In interior joints, on the other hand, the joint shear strength for conforming shear reinforcement was achieved even without shear reinforcement.
Figure 9. Failure mode of test specimens at each drift ratio (1.5, 3.5, 5.0, and 6.0%)

8
REFERENCES:
ACICommittee318. 2014. Building Code Requirements for Structural Concrete (ACI 318-14) and Commentary. American Concrete Institute. MI: Farmington Hills.
ACI 374.1-05. Acceptance criteria for moment frames based on structural testing and commentary. Michigan, USA: American Concrete Institute.
ASCE/SEI 41-13. 2013. Seismic evaluation and retrofit of existing buildings. Virginia, USA: American Society of Civil Engineers.
Calvi, G. & Magenes, G. & Pampanin, S. 2002. Experimental test on a three storey reinforced concrete frame designed for gravity only. 12th European Conference on Earthquake Engineering.
Hwang, S.J. & Lee, H.J. & Liao, T.F. & Wang, K.C. & Tsai, H.H. 2005. Role of hoops on shear strength of reinforced concrete beam-column joints. ACI Structural Journal. 102(3). 445-53.
KSEA. 2012. Structural design criteria and commentary for one and two story small buildings. Seoul: Korean Structural Engineers Association.
Kwon, K.H. & Park, S.H. & Choi, O.C. & Oh, S.H. & Yoon, M.H. & Moon, T.S. 2003. An experimental study on hysteretic behavior of full-size reinforced concrete exterior beam-column joints. Architectural Institute of Korea. 19(6). 19-26.
Lee, Y.W. & Park, H.G. & Choi, D.B. 2009. An experiment to enhance the deformation capacity of RC exterior joint with the non-seismic details. Architectural Institute of Korea. 25 (8). 27-34.
Murty, C. & Rai, D. & Bajpai, K. & Jain, S. 2003. Effectiveness of reinforcement details in exterior reinforced concrete beam-column joints for earthquake resistance. ACI Structural Journal. 100(2). 149-156.
Pampanin, S. & Calvi, G. & Moratti, M. 2002. Seismic behavior of RC beam-column joints designed for gravity only. 12th European Conference on Earthquake Engineering.
Park, M. H. 2012. An experimental study on structural behaviour of beam-column joint with various aspect ratios and anchorage methods. Master Thesis, Ewha university, Korea.