effect of omeprazole on gastric adenosine a and a receptor...
TRANSCRIPT
JPET # 069708 1
Effect of Omeprazole on Gastric Adenosine A1 and A2A Receptor
Gene Expression and Function
Linda Yip, Henry Chi Hang Leung and Yin Nam Kwok
Department of Physiology, University of British Columbia, 2146 Health Sciences Mall,
Vancouver, BC, Canada. V6T 1Z3
JPET Fast Forward. Published on May 20, 2004 as DOI:10.1124/jpet.104.069708
Copyright 2004 by the American Society for Pharmacology and Experimental Therapeutics.
This article has not been copyedited and formatted. The final version may differ from this version.JPET Fast Forward. Published on May 20, 2004 as DOI: 10.1124/jpet.104.069708
at ASPE
T Journals on July 7, 2018
jpet.aspetjournals.orgD
ownloaded from
JPET # 069708 2
Running Title: Omeprazole on Gastric A1 and A2A receptors
Corresponding Author: Yin Nam Kwok Ph.D., Department of Physiology, University of
British Columbia, 2146 Health Sciences Mall, Vancouver, BC. Canada. V6T 1Z3. Tel: 604-
822-6228, Fax: 604-822-6048, email: [email protected]
Number of pages text: 32
Number of tables: 1
Number of figures: 9
Number of references: 40
Number of words (Abstract 248; Introduction 607; Discussion 1480)
Non-standard abbreviations used in paper: N6-cyclopentyladenosine (CPA), 2-p-(2-
carboxyethyl)phenethylamino-5’N-ethylcarboxamidoadenosine (CGS 21680), immunoreactive
gastrin (IRG), somatostatin-like immunoreactivity (SLI), reverse transcription-polymerase chain
reaction (RT-PCR), bovine serum albumin (BSA), radioimmunoassay (RIA), 6-
carboxyfluorescein (FAM), 6-carboxytetramethylrhodamine (TAMRA), normalized reporter
emissions (Rn), threshold cycle (CT), and glyceraldehyde-3-phosphate dehydrogenase (GAPDH).
Recommended section assignment: Gastrointestinal, hepatic, pulmonary & renal
This article has not been copyedited and formatted. The final version may differ from this version.JPET Fast Forward. Published on May 20, 2004 as DOI: 10.1124/jpet.104.069708
at ASPE
T Journals on July 7, 2018
jpet.aspetjournals.orgD
ownloaded from
JPET # 069708 3
Abstract
Adenosine has been shown to inhibit immunoreactive gastrin (IRG) release and to
stimulate somatostatin-like immunoreactivity (SLI) release by activating adenosine A1 and A2A
receptors, respectively. Since the synthesis and release of gastrin and somatostatin are regulated
by the acid secretory state of the stomach, the effect of achlorhydria on A1 and A2A receptor gene
expression and function were examined. Omeprazole-induced achlorhydria was shown to
suppress A1 and A2A receptor gene expression in the antrum and corporeal mucosa, but not in the
corporeal muscle. Omeprazole treatment produced reciprocal changes in A1 receptor and gastrin
gene expression, and parallel changes in A2A receptor and somatostatin gene expression. The
localization of A1 and A2A receptors on gastrin-secreting G-cells and somatostatin-secreting D-
cells, respectively, suggests that changes in adenosine receptor expression may modulate the
synthesis and release of gastrin and somatostatin. Thus, the effect of omeprazole on adenosine
receptor-mediated changes in IRG and SLI release was also examined in the vascularly perfused
rat stomach. Following omeprazole treatment, the A1 receptor-mediated inhibition of IRG and
SLI release induced by N6-cyclopentyladenosine (A1 receptor-selective agonist) was not altered,
but the A2A receptor-mediated augmentation of SLI release induced by 2-p-(2-
carboxyethyl)phenethylamino-5’N-ethylcarboxamidoadenosine (A2A-selective agonist) was
significantly attenuated. These findings agree well with the corresponding omeprazole-induced
decrease in antral A2A receptor mRNA expression. Overall, the present study suggests that
adenosine receptor gene expression and function may be altered by omeprazole treatment. Acid-
dependent changes in adenosine receptor expression may represent a novel purinergic regulatory
feedback mechanism in controlling gastric acid secretion.
This article has not been copyedited and formatted. The final version may differ from this version.JPET Fast Forward. Published on May 20, 2004 as DOI: 10.1124/jpet.104.069708
at ASPE
T Journals on July 7, 2018
jpet.aspetjournals.orgD
ownloaded from
JPET # 069708 4
Adenosine has been demonstrated to protect the stomach against stress-induced ulcer
formation (Geiger and Glavin, 1985; Westerberg and Geiger, 1987), to inhibit gastric acid
secretion (Gerber et al., 1985; Heldsinger et al., 1986; Scarpignato et al., 1987) and to modulate
the release of gastric regulatory peptides (Kwok et al., 1990). Unlike in other species (Gerber et
al., 1985; Heldsinger et al., 1986), adenosine does not alter gastric acid secretion in the rat by
acting directly on the acid-secreting parietal cells (Puurunen et al., 1987). Instead, our laboratory
has shown that in the isolated vascularly perfused rat stomach, the exogenous administration of
adenosine suppressed and augmented the release of immunoreactive gastrin (IRG) and
somatostatin-like immunoreactivity (SLI), respectively (Kwok et al., 1990). Thus, in these
animals, adenosine may exert its inhibitory action on acid secretion indirectly by regulating the
release of the gastric acid secretagogue, gastrin, and the acid inhibitor, somatostatin. In addition,
adenosine deaminase, a metabolic enzyme of adenosine, has been shown to enhance basal and
carbachol-stimulated IRG release in rat antral mucosal fragments (Harty and Franklin, 1984),
and to inhibit basal gastric SLI release (Yip and Kwok, 2004), while dipyridamole, an adenosine
uptake blocker, and erythro-9-(2-hydroxy-3-nonyl)adenine hydrochloride, an inhibitor of
adenosine deaminase, were shown to enhance basal SLI release in the perfused rat stomach
(Kwok et al., 1990; Yip and Kwok, 2004). These findings suggest that endogenous adenosine
may play a role in controlling the release of gastrin and somatostatin, and consequently, gastric
acid.
Adenosine elicits its actions by activating specific G-protein-coupled receptors that are
classified into the A1, A2A, A2B and A3 receptor subtypes (Fredholm et al., 2001). The inhibitory
and stimulatory effects of adenosine on IRG and SLI release are likely mediated by the
activation of A1 and A2A receptors, respectively (Schepp et al., 1990; Yip and Kwok, 2004; Yip
This article has not been copyedited and formatted. The final version may differ from this version.JPET Fast Forward. Published on May 20, 2004 as DOI: 10.1124/jpet.104.069708
at ASPE
T Journals on July 7, 2018
jpet.aspetjournals.orgD
ownloaded from
JPET # 069708 5
et al., 2004). Furthermore, the basal release of SLI is likely to be under the control of the A2A
receptors since ZM 241385 (A2A receptor-selective antagonist) was shown to suppress basal SLI
release (Yip and Kwok, 2004). The A1 and A2A receptors were shown to be expressed
throughout the antral and corporeal mucosa, and in the enteric plexi (Yip and Kwok, 2004; Yip
et al., 2004). The cellular localization of A1 receptors on gastrin-containing G-cells and A2A
receptors on somatostatin-containing D-cells further suggests that adenosine may act directly to
alter the release of IRG and SLI. Although adenosine A1 and A2A receptors may regulate gastric
acid secretion by modulating gastrin and somatostatin release, it has not been determined
whether the gene expression of these receptors could be altered by changes in the acid secretory
state of the stomach. Our laboratory has demonstrated that fasting, a condition that increases
gastric acidity (Matsumoto et al., 1989), upregulated gastric A1 and A2A receptor gene expression
and altered gastrin and somatostatin gene expression (Yip and Kwok, 2002). The proton pump
inhibitor, omeprazole, has also been demonstrated to alter gastrin and somatostatin gene
expression (Brand and Stone, 1988; Wu et al., 1990; Sandvik et al., 1995). However, it is
unclear if omeprazole-induced achlorhydria also alters adenosine receptor gene expression. The
objective of the present study was to examine whether short-term omeprazole treatment alters
adenosine A1 and A2A receptor gene expression and function. The gene expression of gastrin and
somatostatin was also measured since changes in adenosine receptor expression may be
associated with changes in gastrin and somatostatin gene expression and release. To examine if
omeprazole-induced changes in adenosine receptor gene expression also results in corresponding
changes in adenosine receptor-mediated SLI and IRG release, the effect of selective adenosine
agonists on SLI and IRG release were also studied following omeprazole treatment.
This article has not been copyedited and formatted. The final version may differ from this version.JPET Fast Forward. Published on May 20, 2004 as DOI: 10.1124/jpet.104.069708
at ASPE
T Journals on July 7, 2018
jpet.aspetjournals.orgD
ownloaded from
JPET # 069708 6
Materials and Methods
Animals were treated in accordance with the guidelines of the University of British Columbia
Committee on Animal Care.
Omeprazole treatment: Male Wistar rats (250-270g) housed in light- and temperature-
controlled rooms with free access to food and water were used. As suggested by the
manufacturer, omeprazole (50 µmol/ml; AstraZeneca, Molndal, Sweden) was thoroughly
dispersed in 0.25% Methocel® (Dow, Midland, Michigan) containing 2 mg/ml NaHCO3 (pH 9.0)
using the Tissumizer® tissue homogenizer (Tekmar Co. Cincinnati, OH). The drug was
aliquoted, frozen, and stored at -20°C. To prevent drug degradation due to repeated freezing and
thawing, a new aliquot of drug was thawed overnight at 4°C and brought to room temperature
prior to administration. Test groups were treated by gavage with a dose of 400 µmole/kg
omeprazole once daily between 9 and 10 a.m. for either 1 or 3 days. These regimens were
selected since gastric acid secretion is decreased by up to 80% after 1 day of treatment with 400
µmole/kg omeprazole (Larsson et al., 1988; Lee et al., 1992), and steady state inhibition is
achieved after 3 days of treatment at this dose (Carlsson et al., 1986). Rats were not treated for
more than 3 days since G-cell and/or D-cell density are altered after 4 days (Bolkent and
Yilmazer, 1997) and 5 days (Pawlikowski et al., 1992) of treatment. Control groups were treated
similarly with the vehicle. Animals were anaesthetized with an i.p. injection of 60 mg/kg sodium
pentobarbital (Somnotol®, MTC Pharmaceuticals, Cambridge, ON, Canada) 24 h after the last
treatment, and tissue extraction occurred between 10 a.m. to 11 a.m.
This article has not been copyedited and formatted. The final version may differ from this version.JPET Fast Forward. Published on May 20, 2004 as DOI: 10.1124/jpet.104.069708
at ASPE
T Journals on July 7, 2018
jpet.aspetjournals.orgD
ownloaded from
JPET # 069708 7
Quantification of adenosine A1 and A2A receptor and gastric peptide gene expression
The quantitative Real-Time RT-PCR developed to measure A1 and A2A receptor gene expression
have previously been described (Yip and Kwok, 2004; Yip et al., 2004). Two-step Real-Time
RT-PCR assays were used to quantify the gene expression of adenosine A1 and A2A receptors,
gastrin and somatostatin in various gastric regions following omeprazole treatment. Primers and
probes were designed using the Primer Express Sequence Design software program (v. 1.0,
Applied Biosystems, Foster City, CA). The reporter dye, 6-carboxyfluorescein (FAM) and the
quencher dye, 6-carboxytetramethylrhodamine (TAMRA) were linked to the 5’ and 3' ends of
the probes, respectively. The sequences of the forward primers, reverse primers, and probes used
are listed in Table 1. The primers and probes were synthesized by the Nucleic Acid Protein
Services (NAPS) Unit (University of British Columbia) and Synthegen, LLC (Houston, TX),
respectively.
A1 and A2A gene expression: RNA transcripts expressing the entire coding region of the A1 and
A2A receptors were used as the standards for Real-Time RT-PCR. The standards were
synthesized from plasmids containing the A1 or A2A receptor transcript by in vitro transcription
using the Riboprobe in vitro transcription kit and T7 RNA polymerase (Promega, Madison, WI),
as previously described (Yip and Kwok, 2004; Yip et al., 2004). Adenosine receptor RNA
standards were DNase I (Amersham Pharmacia, Piscataway, NJ)-treated and purified. Standard
concentrations were determined using the RiboGreen Reagent Quantitation kit (Molecular
Probes, Eugene, OR), the FL600 Microplate Fluorescence reader (Biotek Inc., Winooski, VT),
and the KC4 Kineticalc Software (version 2.6, Biotek Inc.), according to manufacturer’s
This article has not been copyedited and formatted. The final version may differ from this version.JPET Fast Forward. Published on May 20, 2004 as DOI: 10.1124/jpet.104.069708
at ASPE
T Journals on July 7, 2018
jpet.aspetjournals.orgD
ownloaded from
JPET # 069708 8
instructions. RNA standards were serially diluted to 1×10³ to 1×10¹² copies/µl in RNase-free
water, aliquoted, stored at -80°C, and thawed only once prior to use.
Gastrin and somatostatin gene expression: Relative gastrin and somatostatin gene expression
levels were measured using a sample of rat antrum total RNA to produce the standards for the
standard curve. Antral total RNA (1 µg) was reverse transcribed into 10 µl of cDNA using
Superscript II RNase H- Reverse Transcriptase. This sample was designated as the 100 ng/µl
sample since 100 ng total RNA was reverse transcribed to produce 1 µl of cDNA. This sample
was then serially diluted to various concentrations (0.1 ng/µl to 100 ng/µl) to produce a relative
standard curve.
Glyceraldehyde-3-phosphate dehydrogenase (GAPDH) and 18S rRNA gene expression:
The expression of GAPDH mRNA and 18S rRNA was measured using the Rodent GAPDH
Control Reagents Kit (Applied Biosystems) and the TaqMan ribosomal RNA Control Reagents
Kit (Applied Biosystems), respectively, according to the protocol described in the PE Applied
Biosystems User Bulletin #2. A relative standard curve was constructed using the Rodent
Control RNA Standard (50 ng/µl) provided with the kit. Rodent Control RNA (100 ng) was
reverse transcribed into 10 µl of cDNA using Superscript II RNase H- Reverse Transcriptase.
This sample was designated as the 10 ng/µl sample since 10 ng of Rodent Control RNA was
used to produce 1 µl of cDNA. The 10 ng/µl sample was diluted to 7.5, 5, 2.5, 1, 0.5, and 0.1
ng/µl, and these samples were used to construct the relative standard curve for the Real-Time
RT-PCR assay. The 18S rRNA and GAPDH Real-Time RT-PCR assays were performed
according to the manufacturer’s instruction.
This article has not been copyedited and formatted. The final version may differ from this version.JPET Fast Forward. Published on May 20, 2004 as DOI: 10.1124/jpet.104.069708
at ASPE
T Journals on July 7, 2018
jpet.aspetjournals.orgD
ownloaded from
JPET # 069708 9
Tissue and total RNA extraction
The corporeal mucosa, corporeal muscle, and antrum were dissected out. These regions were
examined since the corporeal mucosa contains somatostatin-secreting D-cells, the corporeal
muscle contains somatostatin-releasing nerve fibers, and the antrum contains D-cells, gastrin-
secreting G-cells, and somatostatin-releasing nerve fibers. Care was taken to avoid inclusion of
tissue at the antro-corpus border. Since the antrum is a relatively small tissue, total RNA was
extracted from the whole antrum to ensure consistency between samples. The corpus was
separated into the corporeal mucosa and muscle. The whole corpus tissue was rinsed in ice-cold
saline, and the mucosa was removed from the corpus with gentle scraping using a sterile glass
slide. The mucosa was then rinsed off the slide using Trizol® reagent (Invitrogen Corp. Carlsbad,
CA), and total RNA was extracted immediately using the same reagent. The corporeal muscle
and antrum were flash frozen in liquid nitrogen and stored at -80°C until RNA extraction. Total
RNA was extracted from all tissues using Trizol® reagent, according to manufacturer’s
instructions and concentrations were determined using the RiboGreen Quantitation Kit
(Molecular Probes). Total RNA samples were treated with DNase I to remove any residual DNA
contamination that may remain in samples after total RNA extraction. DNase I treatment was
performed at room temperature in 1× first strand buffer [50 mM Tris-HCl (pH 8.3 at 25°C), 75
mM KCl, 3 mM MgCl2] containing 1 U DNase I/µg total RNA. The reaction was allowed to
proceed for 15 min, before 1 µl of 25 mM EDTA was added to stop the reaction. Samples were
then incubated for an additional 10 min at 65°C.
This article has not been copyedited and formatted. The final version may differ from this version.JPET Fast Forward. Published on May 20, 2004 as DOI: 10.1124/jpet.104.069708
at ASPE
T Journals on July 7, 2018
jpet.aspetjournals.orgD
ownloaded from
JPET # 069708 10
Two step Real-Time RT- PCR
Reverse transcription: One µg of DNase I-treated tissue RNA was reverse transcribed in a
total volume of 10 µl containing 200 ng random hexamers, 20 U RNAguard RNase inhibitor
(Pharmacia), 1× first strand buffer, 10 mM DTT, 0.5 mM dNTP mix, and 100 U Superscript II
RNase H-Reverse Transcriptase. At least 6 concentrations of each standard and a sample
containing DNase I-treated RNase-free water in place of the template (negative control) were
reverse transcribed simultaneously. The reverse transcribed RNA standards were used to
construct the standard curve for the Real-Time RT-PCR assay.
PCR: Each assay consisted of at least 6 standard curve samples, a negative control sample, and
unknown samples. All reactions were performed in triplicates. The PCR reaction mixture (25 µl)
consisted of 1× TaqMan buffer A, 200 µM of each dATP, dCTP, and dGTP, 400 µM dUTP, 0.01
U/µl AmpErase uracil-N-glycosylase, and 0.025 U/µl AmpliTaq Gold DNA polymerase from
the TaqMan PCR Core Kit (Applied Biosystems). Reaction mixtures also contained 0.5 µl tissue
cDNA, standard cDNA or negative control, 100 nM probe, 100 nM (A2A receptor, gastrin and
somatostatin assay) or 300 nM (A1 assay) each of the forward and reverse primers, and 7.5 mM
MgCl2 (A1 receptor, gastrin and somatostatin assay) or 4.5 mM MgCl2 (A2A receptor assay). The
reaction was performed using the ABI Prism 7700 Sequence Detector (Applied Biosystems) with
the following cycling parameters: 2-min hold at 50°C for uracil-N-glycosylase incubation, 10-
min hold at 95°C for AmpliTaq Gold activation, followed by 40 cycles of amplification
consisting of a 15-sec denaturation step at 95°C and 1-min anneal/extend period at 60°C.
Data collection and analysis: Data were collected during each PCR cycle, and analyzed using
the Sequence Detection Software (v. 1.6.3, Applied Biosystems). An amplification plot showing
normalized reporter emissions (Rn) vs. cycle number was generated. The threshold cycle (CT),
This article has not been copyedited and formatted. The final version may differ from this version.JPET Fast Forward. Published on May 20, 2004 as DOI: 10.1124/jpet.104.069708
at ASPE
T Journals on July 7, 2018
jpet.aspetjournals.orgD
ownloaded from
JPET # 069708 11
the cycle where an increase in fluorescence is associated with exponential growth, was
determined by the software using the fluorescence emitted during the first 15 cycles. A standard
curve of CT vs. Log (initial standard concentrations) was then generated. The initial
concentration of each unknown sample was determined by interpolation using the CT value
determined by the assay. The correlation coefficient of each standard curve was > 0.95, and the
CT of the negative control exceeded 40 cycles in every assay, indicating the absence of DNA
contamination. To compare gene expression levels between the test and control animals,
measurements were first normalized with the gene expression of the endogenous control (18S
rRNA). This was performed according to the procedures described in the Applied Biosystems
User bulletin #2. The adenosine A1 receptor, A2A receptor, gastrin or somatostatin gene
expression level of each individual sample was divided by the 18S rRNA level to obtain a
normalized value of measurement. The mean ± S.E.M. of this normalized value was calculated
for control and omeprazole-treated groups. The mean of each control group was expressed as
100%, and gene expression levels of the omeprazole-treated groups were expressed as a
percentage of the control. Statistical significance was determined using the two-tailed unpaired
Student’s t-test, and was performed using GraphPad Prism (v. 3.0, GraphPad software, San
Diego, CA); P ≤ 0.05 was considered significant.
Stomach perfusion
Rats were housed in light- and temperature-controlled rooms with free access to food and water.
Omeprazole-treated animals were deprived of food for 12-14 h, but had free access to water prior
to stomach perfusion. Rats were anesthetized with Somnotol® (60 mg/kg). The procedures used
to prepare the stomach for perfusion have previously been described (Kwok et al., 1990).
This article has not been copyedited and formatted. The final version may differ from this version.JPET Fast Forward. Published on May 20, 2004 as DOI: 10.1124/jpet.104.069708
at ASPE
T Journals on July 7, 2018
jpet.aspetjournals.orgD
ownloaded from
JPET # 069708 12
Following the exposure of the stomach through an abdominal midline incision, the superior
mesenteric artery and vasculatures supplying the left and right adrenal glands and kidneys were
occluded or cut between double ligatures. The pancreas and spleen were then dissected along the
greater curvature of the stomach, while preserving the right gastroepiploic artery. A cannula was
secured into the gastroduodenal junction for drainage of any gastric contents. The spleen,
pancreas, small and large intestines were then dissected out. Arterial perfusion was achieved
through a cannula inserted into the aorta with the tip lying adjacent to the celiac artery. An
injection of 2 ml saline containing 600 U of heparin (Sigma, St. Louis, MO) was introduced into
the gastric circulation through this arterial cannula followed by perfusate. Venous effluent was
collected via the portal vein cannula. The preparation was equilibrated for 30 min before 5-min
samples were collected into ice-cold scintillation vials containing 0.3 ml of Trasylol® (aprotinin,
10,000 KIU/ml; Miles Labs., Etobicoke, ON). Aliquots (0.5 ml) of samples were immediately
transferred into ice-cold test-tubes containing 0.05 ml aprotinin and stored at -20°C until assayed.
The stomach was perfused at a rate of 3 ml/min using a peristaltic pump (Cole-Parmer
Instrument Co. Chicago, IL). The perfusate was composed of Krebs’ solution (in mM: NaCl,
120; KCl, 4.4; CaCl2, 2.5; MgSO4·7H2O, 1.2; KH2PO4, 1.5; NaHCO3, 25 and dextrose, 5.1)
containing 0.2% BSA (RIA grade; Sigma) and 3% dextran (Clinical grade; Sigma). The
perfusate was continuously gassed with a mixture of 95% O2 and 5% CO2 to maintain a pH of
7.4. Both the perfusate and the preparation were kept at 37oC by thermostatically-controlled
heating units throughout the experiment. Drugs were introduced into the perfusate via side-arm
infusion at a rate calculated to give the final perfusion concentrations. N6-cyclopentyladenosine
(CPA) and 2-p-(2-carboxyethyl)phenethylamino-5’N-ethylcarboxamidoadenosine HCl (CGS
21680) were purchased from Sigma-Aldrich. Drugs were first dissolved in a small volume of
This article has not been copyedited and formatted. The final version may differ from this version.JPET Fast Forward. Published on May 20, 2004 as DOI: 10.1124/jpet.104.069708
at ASPE
T Journals on July 7, 2018
jpet.aspetjournals.orgD
ownloaded from
JPET # 069708 13
DMSO (BDH, Toronto, ON) and subsequently diluted with saline or perfusate to 0.03 or 0.5%
DMSO before perfusing into the stomach. At these concentrations, DMSO did not alter basal
IRG or SLI release. The perfusion concentrations of the A1 receptor agonist, CPA, and A2A
receptor agonist, CGS 21680, were 0.1 or 1 µM. The lower concentration (0.1 µM) was selected
to approximate the EC50 of CPA (0.067 µM with a 95% confidence interval between 0.014 and
0.325 µM) (Yip et al., 2004) and CGS 21680 (0.06 µM with a 95% confidence interval between
0.02 and 0.17 µM) (Yip and Kwok, 2004) in inhibiting and stimulating IRG and SLI release,
respectively. The higher concentration (1 µM) was also examined since CPA and CGS 21680
elicited their maximal effects at this concentration.
Measurement of gastric peptides and data analysis
The specific RIA employed for the measurement of IRG (Jaffe and Walsh, 1978; Fujimiya and
Kwok, 1997) and SLI (McIntosh et al., 1987; Kwok et al., 1990) have previously been described.
The gastrin antibody (PM1) used to measure IRG was kindly provided by Dr. R. Pederson
(Physiology, UBC). The inter- and intra-assay variation was less than 6 and 4%, respectively.
The monoclonal antibody, SOMA-3 (MRC-RPG), was used to measure SLI. The inter- and
intra-assay variation of the RIA was less than 12 and 8%, respectively. The drugs used in the
present study did not cross-react with these antibodies.
Although the basal release rate of IRG and SLI release varied among animals, previous
experiments have demonstrated that basal IRG (Pederson et al., 1984; Kwok et al., 1990) and
SLI release (Kwok et al., 1990) were maintained in the perfused stomach. Therefore, results
were expressed as mean ± SEM of IRG or SLI release (%), which was calculated as follows:
[release (pg/min) during a 5 min period ÷ release (pg/min) during period 1] × 100. Results were
This article has not been copyedited and formatted. The final version may differ from this version.JPET Fast Forward. Published on May 20, 2004 as DOI: 10.1124/jpet.104.069708
at ASPE
T Journals on July 7, 2018
jpet.aspetjournals.orgD
ownloaded from
JPET # 069708 14
also expressed as percentage (%) inhibition of IRG release, which was calculated as follows:
[mean basal IRG release (periods 1-3) – mean IRG release in the presence of drug (periods 4-7)]
pg/min ÷ [mean basal IRG release (periods 1-3)] pg/min × 100. The percent (%) change of SLI
release was calculated as follows: (mean SLI release in the presence of drug – mean basal SLI
release) pg/min ÷ (mean basal SLI release) pg/min × 100. Statistical significance (P < 0.05) was
determined using one-way ANOVA followed by Dunnett’s multiple comparison test, and the
paired or unpaired Student’s t-test when appropriate.
This article has not been copyedited and formatted. The final version may differ from this version.JPET Fast Forward. Published on May 20, 2004 as DOI: 10.1124/jpet.104.069708
at ASPE
T Journals on July 7, 2018
jpet.aspetjournals.orgD
ownloaded from
JPET # 069708 15
Results
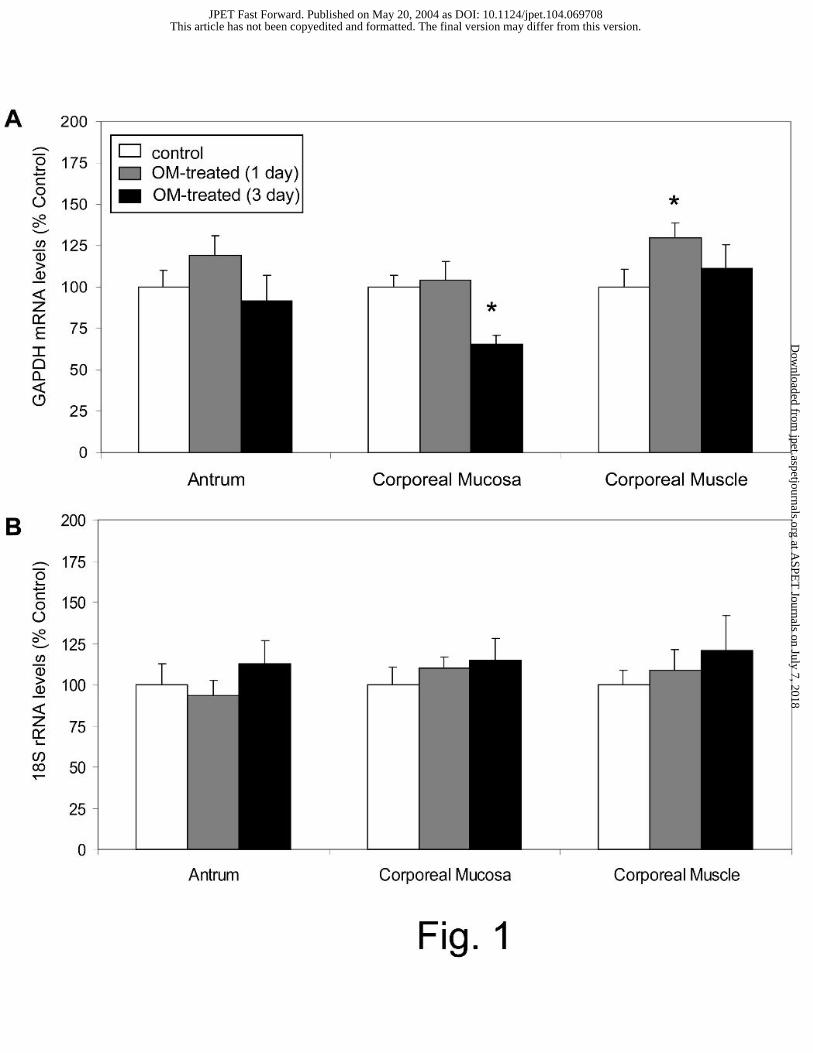
Effect of omeprazole treatment on 18S rRNA and GAPDH gene expression
Omeprazole treatment was found to alter GAPDH mRNA levels in various gastric regions. The
gene expression of GAPDH in the corporeal mucosa was significantly decreased to 65±5% of
control levels after 3 days of omeprazole treatment. In the corporeal muscle, the GAPDH
mRNA level was significantly increased to 130±9% after 1 day of treatment (Fig. 1A). In all
gastric regions examined, 18S rRNA levels were not altered by 1 or 3 days of omeprazole
treatment (Fig. 1B). Since omeprazole treatment did not alter 18S rRNA levels, this gene was
used as the endogenous control for the subsequent quantification of gastric A1 receptor, A2A
receptor, somatostatin, and gastrin gene expression using Real-Time RT-PCR.
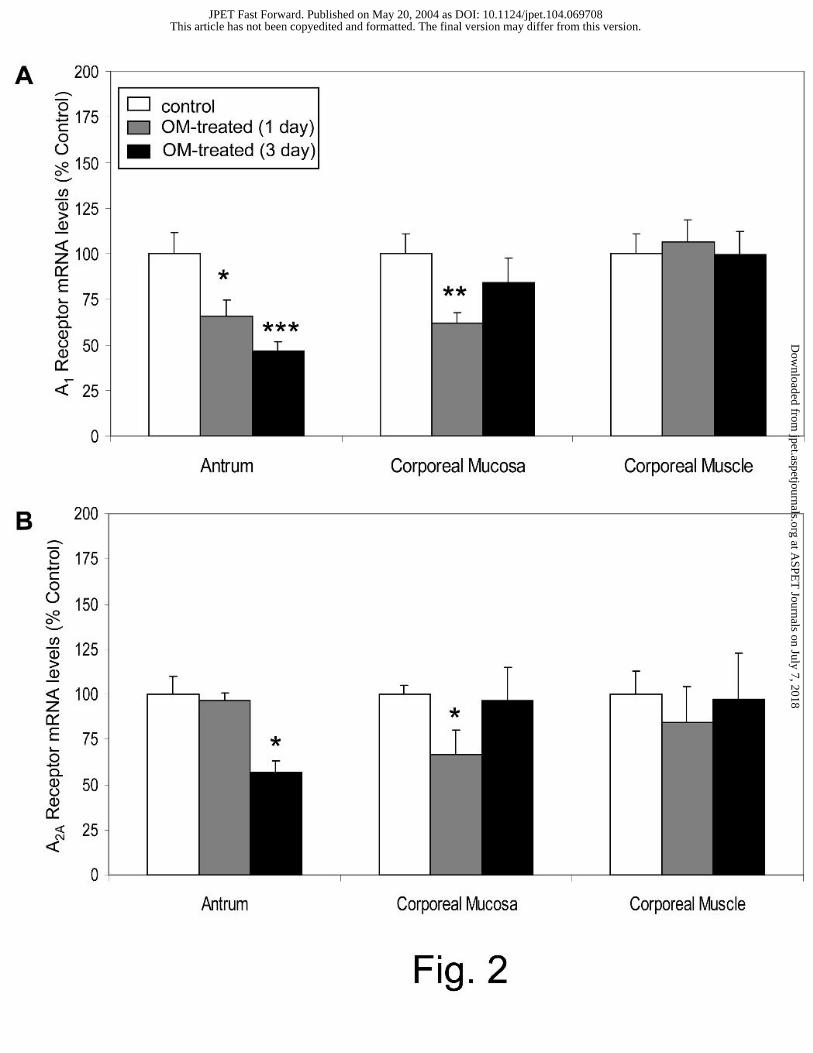
Effect of omeprazole treatment on adenosine A1 and A2A receptor gene expression
Fig. 2A shows that antral adenosine A1 receptor gene expression was significantly reduced to
66±12% and 47±8% of control levels after 1 and 3 days of omeprazole treatment, respectively.
In the corporeal mucosa, A1 receptor gene expression was significantly decreased to 62±6% of
control levels after 1 day of treatment, but changes were not apparent after 3 days of treatment.
The gene expression of the A2A receptor was significantly reduced in the antrum to 57±7% of
control levels after 3 days of treatment (Fig. 2B). A2A receptor gene expression was also
decreased in the corporeal mucosa, to 67±14% of control levels, after 1 day of treatment.
However, changes were not detected in this tissue after 3 days of treatment. In the corporeal
muscle, neither A1 receptor nor A2A receptor gene expression was altered by omeprazole
treatment.
This article has not been copyedited and formatted. The final version may differ from this version.JPET Fast Forward. Published on May 20, 2004 as DOI: 10.1124/jpet.104.069708
at ASPE
T Journals on July 7, 2018
jpet.aspetjournals.orgD
ownloaded from
JPET # 069708 16
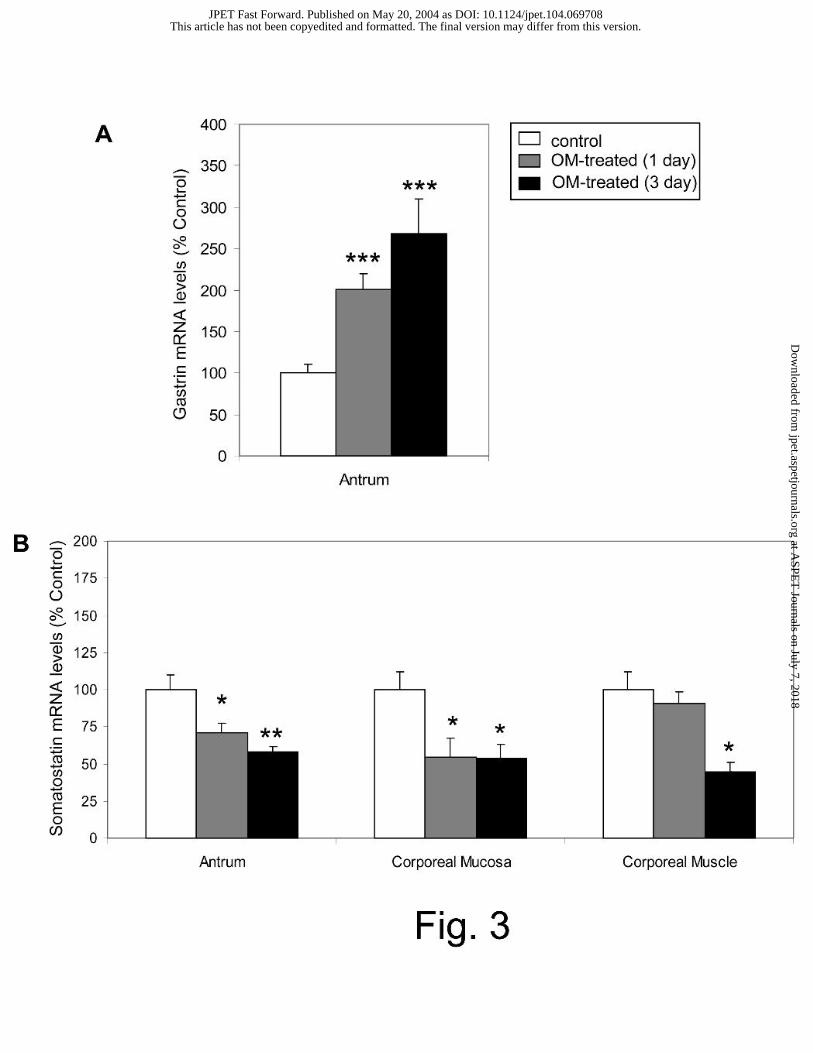
Effect of omeprazole treatment on gastrin and somatostatin gene expression
Antral gastrin gene expression was significantly increased to 201±18% and 268±42% of controls
after 1 and 3 days of omeprazole treatment, respectively (Fig. 3A). In contrast, after 1 and 3
days of omeprazole treatment, antral somatostatin gene expression was significantly reduced to
71±6% and 58±4% of controls, respectively. The somatostatin gene expression in the corporeal
mucosa was also reduced to 54±13% and 54±10% of control levels after 1 and 3 days of
treatment, respectively (Fig. 3B). In the corporeal muscle, a significant decrease (45±6%) in
somatostatin gene expression was observed following 1 day of omeprazole treatment.
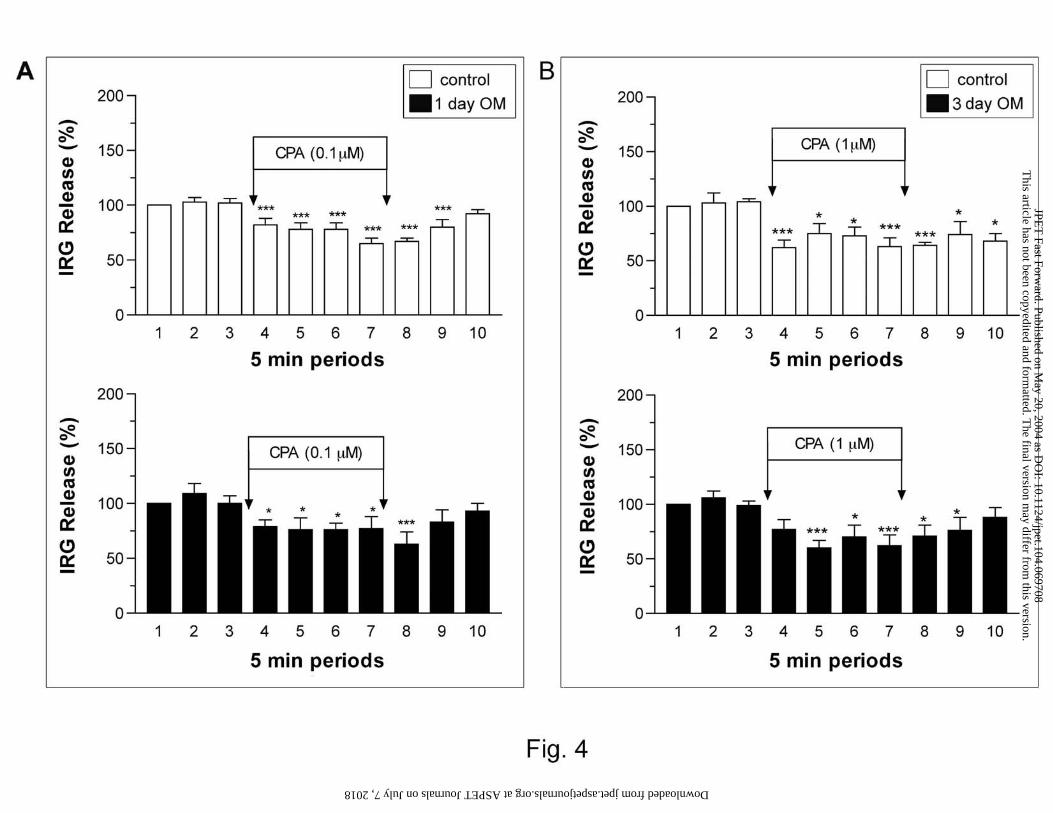
Effect of omeprazole on CPA-induced changes in IRG release
Previous studies have shown that adenosine A1 receptors are involved in the inhibition of IRG
release. Thus, the effect of omeprazole treatment on CPA (A1-selective agonist)-induced
changes in IRG release was examined. Fig. 4A shows the effect of 0.1 µM CPA on IRG release
in animals after 1-day treatment with omeprazole. Basal IRG release during periods 1 to 3 in
control (222±46 to 238±52 pg/min) and treated (175±19 to 198±23 pg/min) animals were
comparable. The administration of CPA (0.1 µM) resulted in a significant inhibition of basal
IRG release in both control and treated animals. However, no significant difference in CPA-
induced IRG release was observed between these two groups. Fig. 4B shows the effect of 1 µM
CPA on IRG release in controls and animals treated with omeprazole for 3 days. The basal
release of IRG during periods 1 to 3 in control (203±24 to 212±29 pg/min) and treated (231±36
to 251±46 pg/min) animals were also comparable. The perfusion of CPA (1 µM) significantly
inhibited IRG release. However, this response also did not differ between 3-day omeprazole
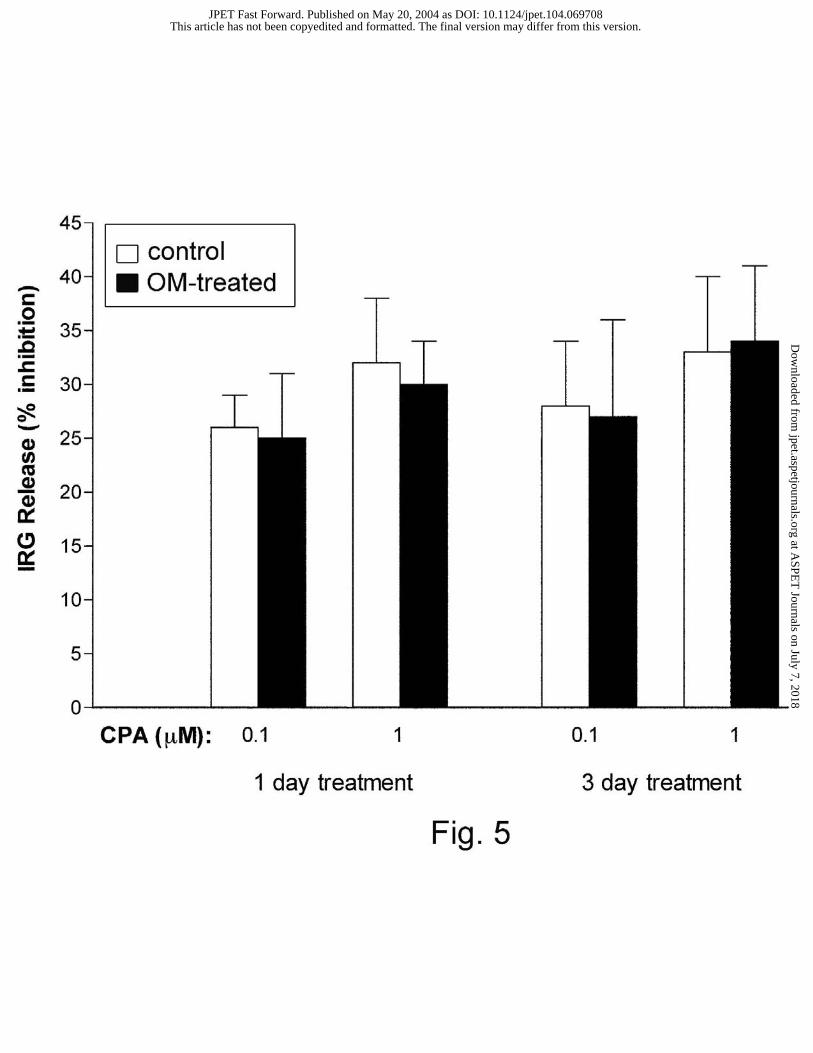
treated and control animals. For comparison, results are also expressed as percentage inhibitions
This article has not been copyedited and formatted. The final version may differ from this version.JPET Fast Forward. Published on May 20, 2004 as DOI: 10.1124/jpet.104.069708
at ASPE
T Journals on July 7, 2018
jpet.aspetjournals.orgD
ownloaded from
JPET # 069708 17
and summarized in Fig. 5. No significant changes in the inhibitory effect of CPA (0.1 µM and 1
µM) on IRG release occurred between 1-day and 3-day omeprazole treated and vehicle-treated
control animals.
Effect of omeprazole on CPA- and CGS 21680-induced changes of SLI release
Previous studies have demonstrated that adenosine A1 and A2A receptors are involved in the
inhibition and augmentation of SLI release, respectively. Thus, the effect of omeprazole
treatment on CPA and CGS 21680 (A2A selective agonist)-induced changes in SLI release were
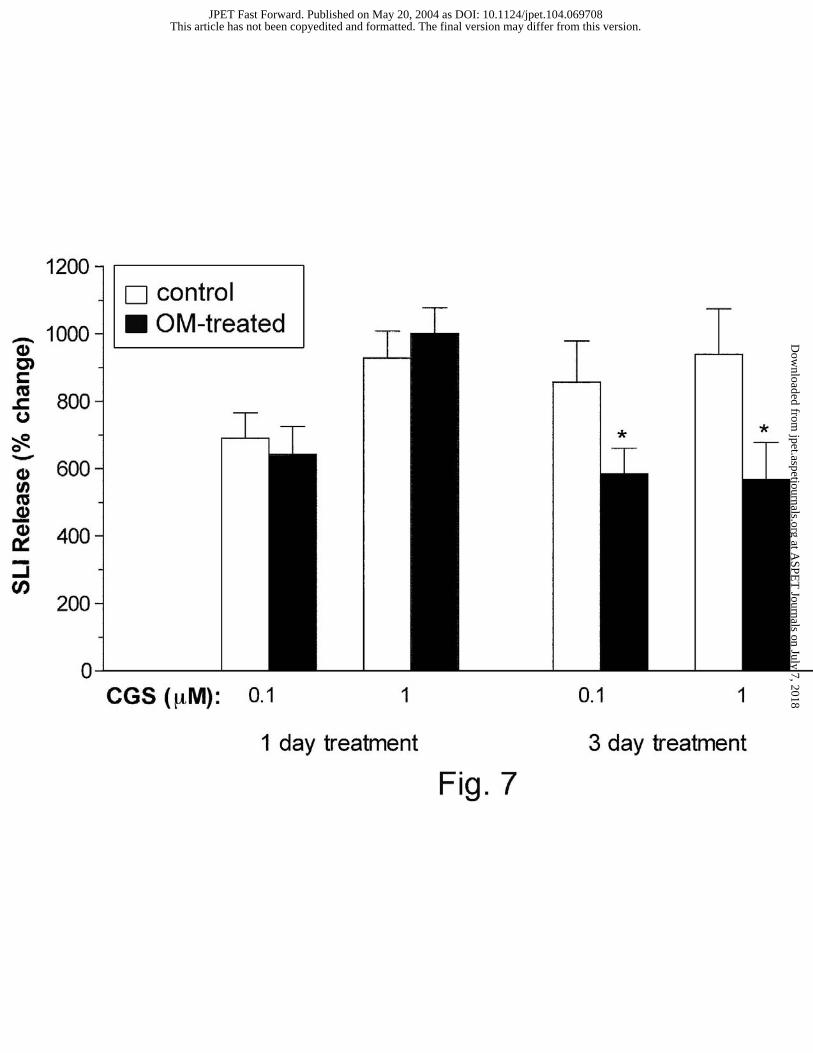
examined. Fig. 6 shows the effect of 1 µM CGS 21680 on SLI release in control and 3 day
omeprazole-treated animals. The basal release of SLI during periods 1 to 3 in controls (152±48
to 157±51 pg/min) was not significantly different from that of treated animals (194±45 to
197±47 pg/min). In these experiments, SLI release was enhanced by CGS 21680 in both groups
of animals. However, CGS 21680-induced SLI release was significantly attenuated by 3 days of
omeprazole treatment. The percentage change in SLI release induced by CGS 21680 (0.1 and 1
µM) in control and 1- and 3-day omeprazole-treated animals are summarized in Fig. 7. After 3
days of omeprazole treatment, CGS 21680-induced augmentation of SLI released was shown to
be significantly reduced.
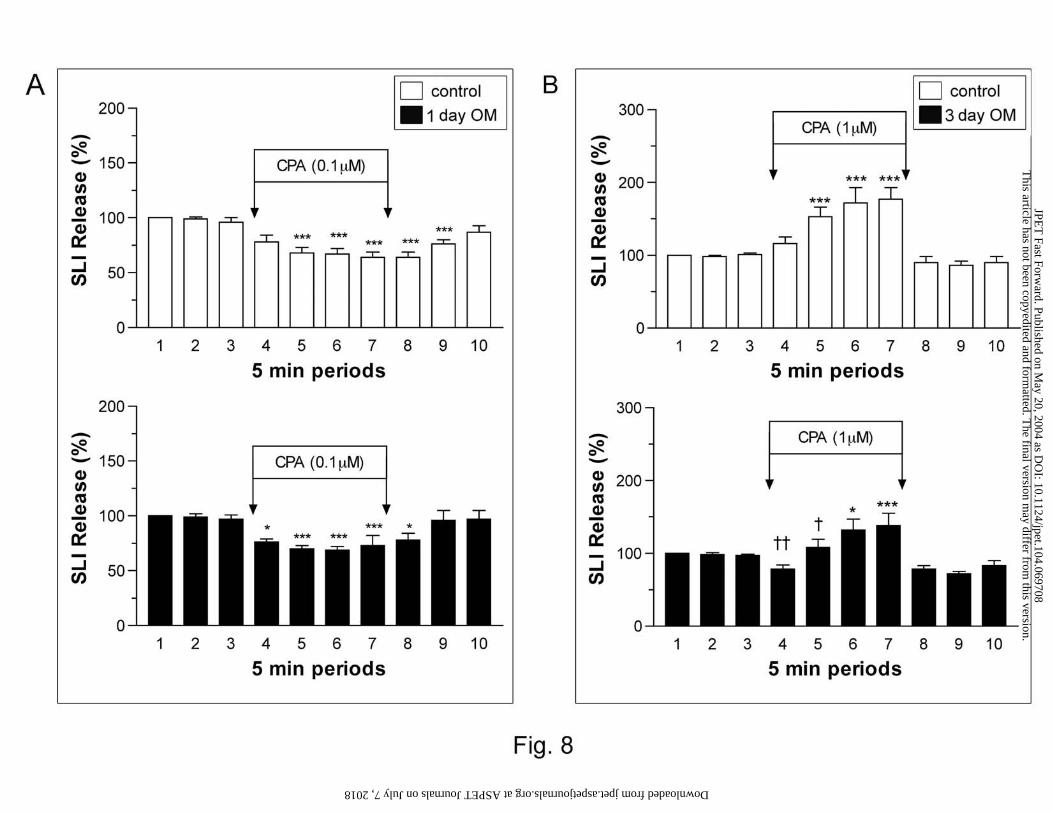
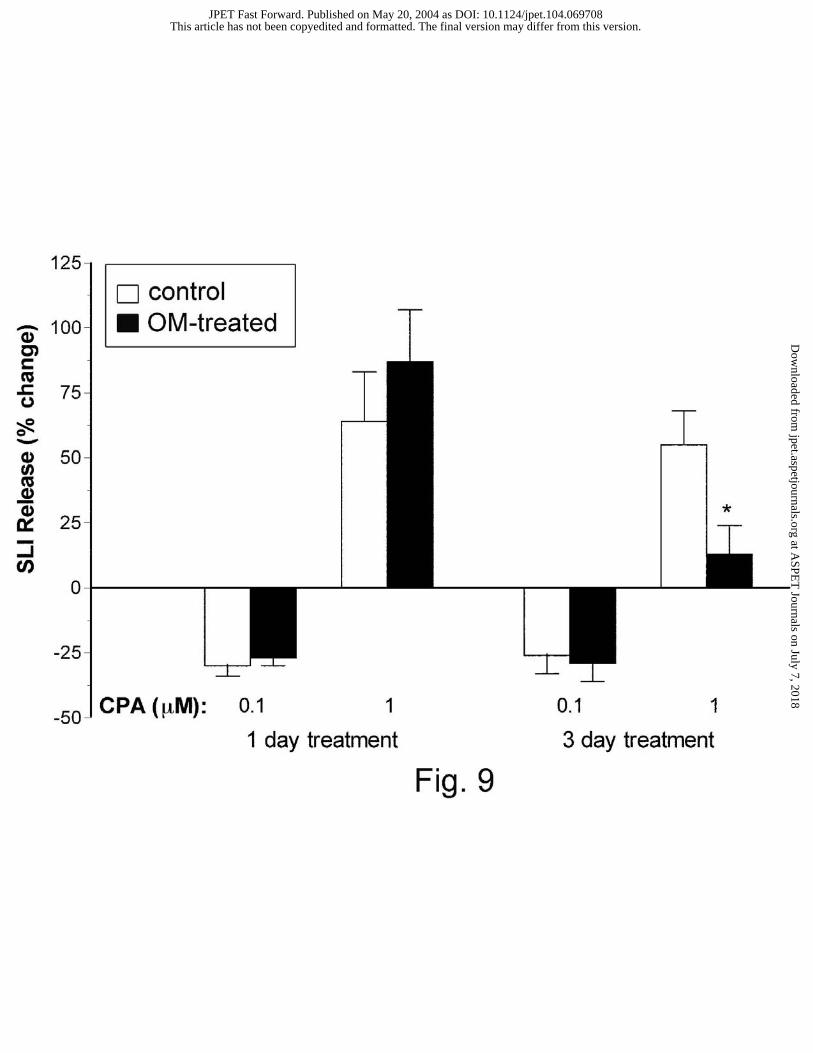
Previous studies have demonstrated that the administration of 0.1 µM CPA significantly
inhibited gastric SLI release, while the administration of 1 µM CPA significantly stimulated SLI
release (Yip and Kwok, 2004). These observations were also observed in the current study (Fig.
8 and 9). Fig. 8A shows the effect of 0.1 µM CPA on SLI release after 1 day of omeprazole
treatment. Basal SLI release did not differ significantly between control (227±33 to 234±30
pg/min) and treated (194 ±27 to 197±21 pg/min) animals. The administration of 0.1 µM CPA
This article has not been copyedited and formatted. The final version may differ from this version.JPET Fast Forward. Published on May 20, 2004 as DOI: 10.1124/jpet.104.069708
at ASPE
T Journals on July 7, 2018
jpet.aspetjournals.orgD
ownloaded from
JPET # 069708 18
significantly reduced SLI release. However, this inhibitory response did not differ between
control and 1-day omeprazole-treated animals. Fig. 8B shows the effect of 1 µM CPA on SLI
release after 3 days of omeprazole treatment. Basal SLI release was comparable between control
(158±33 to 165±37 pg/min) and treated (134± 26 and 138±30 pg/min) animals. The
administration of CPA (1 µM) significantly increased SLI release. This stimulatory response
was shown to be attenuated after 3 days of omeprazole treatment. The effect of omeprazole
treatment on CPA-induced changes in SLI release is summarized on Fig. 9. The inhibition of
SLI release induced by 0.1 µM CPA was not altered by either 1 or 3 days of omeprazole
treatment. However, 3 days of treatment did significantly attenuate the stimulatory effect of 1
µM CPA on SLI release (Fig. 9).
This article has not been copyedited and formatted. The final version may differ from this version.JPET Fast Forward. Published on May 20, 2004 as DOI: 10.1124/jpet.104.069708
at ASPE
T Journals on July 7, 2018
jpet.aspetjournals.orgD
ownloaded from
JPET # 069708 19
Discussion
In the present study, the gene expression of GAPDH, a commonly used housekeeping
gene, was shown to be significantly increased in the corporeal muscle and decreased in the
corporeal mucosa after 1 and 3 days of omeprazole treatment, respectively. These findings are
consistent with another study demonstrating increased GAPDH mRNA levels in the rat corpus
after omeprazole treatment (Sandvik et al., 1995). In contrast, 18S rRNA gene expression was
not altered by omeprazole treatment. Therefore, 18S rRNA was used as the endogenous control
for the measurement of A1 receptor, A2A receptor, somatostatin, and gastrin gene expression.
Results demonstrate that both gastrin and somatostatin mRNA levels were altered by omeprazole
treatment. The observation that 1 and 3 days of omeprazole treatment led to increased gastrin
mRNA levels agrees well with other studies showing increased expression following 4 and 14
days of omeprazole treatment (Wu et al., 1990; Dockray et al., 1991). The present study also
demonstrates decreased antral somatostatin gene expression after 1 and 3 days of treatment,
which also agrees well with the findings of other investigators (Brand and Stone, 1988; Wu et al.,
1990; Sandvik et al., 1995). Similar to previous studies (Tari et al., 1991; Sandvik et al., 1995),
the present study also demonstrated reduced somatostatin mRNA expression in the corporeal
mucosa and muscle following omeprazole treatment.
We have previously demonstrated that adenosine may regulate gastric acid secretion by
suppressing IRG and stimulating SLI release via activation of A1 and A2A receptors, respectively
(Yip and Kwok, 2004; Yip et al., 2004). The present study suggests that the gene expression and
function of these receptors may be regulated by changes in the acid secretory state of the
stomach. Omeprazole treatment inhibited A1 receptor gene expression in the antrum (1 and 3
day treatment) and corporeal mucosa (1 day treatment), and A2A receptor gene expression in the
This article has not been copyedited and formatted. The final version may differ from this version.JPET Fast Forward. Published on May 20, 2004 as DOI: 10.1124/jpet.104.069708
at ASPE
T Journals on July 7, 2018
jpet.aspetjournals.orgD
ownloaded from
JPET # 069708 20
antrum (3 day treatment) and corporeal mucosa (1 day treatment). The precise cellular
localization of both receptors have been examined in these tissues (Yip and Kwok, 2004; Yip et
al., 2004). A1 receptors were shown to be expressed on D-cells and G-cells, while A2A receptors
are expressed on D-cells. Thus, it is plausible that omeprazole-induced changes in adenosine
receptor gene expression may occur in the mucosal G-cells and/or D-cells of the corpus and
antrum. Both of these adenosine receptors have also been localized in the enteric plexi.
However, changes in A1 and A2A receptor gene expression were not observed in the corporeal
muscle after omeprazole treatment, suggesting that adenosine receptor gene expression in the
corporeal enteric plexi was unlikely altered by omeprazole treatment.
Conditions that increase intracellular acidity, such as hypoxia or ischemia, have
previously been shown to upregulate A1 and A2A receptor gene expression in DDT1-MF2 cells
(Nie et al., 1998) and PC12 cells (Kobayashi and Millhorn, 1999), respectively. In addition,
fasting, which increases gastric acidity (Matsumoto et al., 1989), has been shown to upregulate
both gastric A1 and A2A receptor mRNA levels (Yip and Kwok, 2002). In the present study,
adenosine receptor gene expression was reduced following omeprazole-induced achlorhydria.
This observation fits the proposal that adenosine receptor gene expression may respond to
changes in acidity.
When omeprazole-induced changes in adenosine receptor and gastric regulatory peptide
gene expression were compared, a reciprocal relationship was observed between changes in A1
receptor and gastrin gene expression. Although a clear relationship between A2A receptor and
somatostatin gene expression was not apparent, the expression of both genes were reduced in
gastric tissues after various lengths of omeprazole treatment. Omeprazole-induced achlorhydria
may decrease adenosine receptor expression, and subsequently alter the synthesis and release of
This article has not been copyedited and formatted. The final version may differ from this version.JPET Fast Forward. Published on May 20, 2004 as DOI: 10.1124/jpet.104.069708
at ASPE
T Journals on July 7, 2018
jpet.aspetjournals.orgD
ownloaded from
JPET # 069708 21
gastrin and somatostatin. Both gastrin and somatostatin gene expression are enhanced by cAMP
formation (Shiotani and Merchant, 1995; Montminy et al., 1996). Activation of A1 and A2A
receptors inhibits and stimulates cAMP formation, respectively (Ralevic and Burnstock, 1998).
Thus, activation of adenosine receptors may alter cAMP levels to regulate gastrin and
somatostatin gene expression. Studies have shown that A2A receptor stimulation can induce the
expression of genes regulated by cAMP (Chae and Kim, 1997; Ravid et al., 1999). Therefore, a
reduction in A2A receptor gene expression may lead to a subsequent decrease in somatostatin
gene expression.
Although the possible regulatory mechanism(s) involved in the modulation of adenosine
receptor gene expression by omeprazole was not examined in the present study, the expression of
the A1 and A2A receptor gene may be regulated by changes in gastric acidity, as suggested for
gastrin and somatostatin gene expression. Omeprazole, however, has also been shown to induce
the expression of various genes, through the activation of specific intracellular signaling
pathways (Backlund et al., 1997; Kikuchi and Hossain, 1999). Thus, the direct regulation of A1
and A2A receptor gene expression by omeprazole, therefore, cannot be ruled out.
Omeprazole-induced changes in adenosine receptor mRNA expression may result in
similar changes in receptor density, and thus receptor function. The present study demonstrates
that changes in gastric adenosine receptor gene expression can occur with corresponding changes
in adenosine receptor function. We have previously suggested that high concentrations of CPA
(≥1 µM) may stimulate SLI release through the non-specific activation of A2A receptors (Yip and
Kwok, 2004). Following 3 days of omeprazole treatment, the stimulatory effect of 1 µM CPA
on SLI release was decreased, suggesting a reduction in A2A receptor expression. This proposal
is supported by the observation that the stimulatory effect of the A2A receptor agonist, CGS
This article has not been copyedited and formatted. The final version may differ from this version.JPET Fast Forward. Published on May 20, 2004 as DOI: 10.1124/jpet.104.069708
at ASPE
T Journals on July 7, 2018
jpet.aspetjournals.orgD
ownloaded from
JPET # 069708 22
21680, on SLI release was also significantly attenuated after 3 days of omeprazole treatment.
The reduced A2A receptor-mediated function is consistent with the reduced level of A2A receptor
gene expression observed in the antrum after 3 days of omeprazole treatment. Together, these
results suggest that omeprazole may decrease the number of A2A receptors in the antrum by
reducing A2A receptor gene expression. Our previous studies have implicated the involvement of
the A2A receptor in the tonic control of basal SLI release by endogenously released adenosine
(Yip and Kwok, 2004). Furthermore, in comparison to the A1 receptors, the relative abundance
of the gastric mucosal A2A receptors was found to be relatively low (Yip and Kwok, 2004; Yip et
al., 2004), suggesting the existence of a fairly small A2A receptor reserve in this region. Thus,
changes in A2A receptor expression may readily alter somatostatin secretion.
Contrary to the A2A receptor, the A1 receptor is highly expressed in the gastric mucosa
(Yip et al., 2004). A1 receptors are expressed on all G-cells, all corporeal D-cells and some
antral D-cells (Yip et al., 2004). Thus, a large A1 receptor population may be present in the rat
gastric mucosa. In the present study, omeprazole treatment reduced A1 receptor gene expression
in the antrum and corporeal mucosa, but did not alter A1 receptor-mediated inhibition of IRG and
SLI release. The large reserve of A1 receptors may prevent decreased A1 receptor expression
from altering gastrin and somatostatin release, thus, resulting in a discrepancy between changes
in A1 receptor mRNA levels and A1 receptor function. However, this discrepancy may also be
due to other factors. The present study examined the effect of short-term (1 and 3 day)
omeprazole treatment. Although changes in actual receptor expression may require more time to
occur, the effect of a longer treatment regimen was not examined. In rats treated with
omeprazole for more than 3 days, both G-cell and D-cell density have been shown to be altered
(Pawlikowski et al., 1992; Bolkent and Yilmazer, 1997). Any changes in adenosine receptor
This article has not been copyedited and formatted. The final version may differ from this version.JPET Fast Forward. Published on May 20, 2004 as DOI: 10.1124/jpet.104.069708
at ASPE
T Journals on July 7, 2018
jpet.aspetjournals.orgD
ownloaded from
JPET # 069708 23
mRNA expression may be complicated by the alterations in G-cell and D-cell numbers since
adenosine receptors are present on both these endocrine cell types. The adenosine receptors are
also expressed in different regions of the stomach including the enteric plexi and vasculature.
Thus, it is also possible that changes in adenosine receptor mRNA expression may occur in
anatomical structures that are not involved in the control of IRG and SLI release. The regulation
of adenosine receptor gene expression by post-transcriptional mechanism, such as changes in the
translational rate (Ren and Stiles, 1994; Chu et al., 1996; Lee et al., 1999), also cannot be ruled
out. Thus, the disparity between adenosine receptor mRNA levels and receptor function may
result from various factors.
The results of this study suggest that adenosine A1 and A2A receptor gene expression may
respond to changes in the acid secretory state of the stomach. Omeprazole-treatment inhibited
both A1 and A2A receptor gene expression in gastric tissues. Although A1 receptor-mediated
inhibition of IRG and SLI release was not altered by omeprazole treatment, A2A receptor-
mediated augmentation of SLI release was attenuated. The omeprazole-induced inhibition of
A2A receptor function corresponds with the reduced level of antral A2A receptor mRNA. These
findings suggest that gastric acidity may modulate the purinergic control of IRG and SLI release
through the alteration of adenosine receptor expression. The possible modification of adenosine
receptor expression by changes in intraluminal acidity may represent a novel purinergic
regulatory feedback mechanism to control gastric acid secretion.
This article has not been copyedited and formatted. The final version may differ from this version.JPET Fast Forward. Published on May 20, 2004 as DOI: 10.1124/jpet.104.069708
at ASPE
T Journals on July 7, 2018
jpet.aspetjournals.orgD
ownloaded from
JPET # 069708 24
References
Backlund M, Johansson I, Mkrtchian S and Ingelman-Sundberg M (1997) Signal transduction-
mediated activation of the aryl hydrocarbon receptor in rat hepatoma H4IIE cells. J Biol
Chem 272:31755-31763.
Bolkent S and Yilmazer S (1997) Alterations in gastrin cells induced by short-term omeprazole
treatment in the rat antrum: an immunocytochemical and in situ hybridization study.
Histochem J 29:479-485.
Brand SJ and Stone D (1988) Reciprocal regulation of antral gastrin and somatostatin gene
expression by omeprazole-induced achlorhydria. J Clin Invest 82:1059-1066.
Carlsson E, Larsson H, Mattsson H, Ryberg B and Sundell G (1986) Pharmacology and
toxicology of omeprazole--with special reference to the effects on the gastric mucosa.
Scand J Gastroenterol Suppl 118:31-38.
Chae HD and Kim KT (1997) Stimulation of the A2A adenosine receptor increases expression of
the tyrosine hydroxylase gene. Brain Res Mol Brain Res 44:31-38.
Chu YY, Tu KH, Lee YC, Kuo ZJ, Lai HL and Chern Y (1996) Characterization of the rat A2a
adenosine receptor gene. DNA Cell Biol 15:329-337.
Dockray GJ, Hamer C, Evans D, Varro A and Dimaline R (1991) The secretory kinetics of the G
cell in omeprazole-treated rats. Gastroenterology 100:1187-1194.
Fredholm BB, AP IJ, Jacobson KA, Klotz KN and Linden J (2001) International Union of
Pharmacology. XXV. Nomenclature and classification of adenosine receptors.
Pharmacol Rev 53:527-552.
Fujimiya M and Kwok YN (1997) Effect of carbachol on vascular and luminal release of
immunoreactive gastrin from isolated perfused rat duodenum. Dig Dis Sci 42:634-639.
This article has not been copyedited and formatted. The final version may differ from this version.JPET Fast Forward. Published on May 20, 2004 as DOI: 10.1124/jpet.104.069708
at ASPE
T Journals on July 7, 2018
jpet.aspetjournals.orgD
ownloaded from
JPET # 069708 25
Geiger JD and Glavin GB (1985) Adenosine receptor activation in brain reduces stress-induced
ulcer formation. Eur J Pharmacol 115:185-190.
Gerber JG, Nies AS and Payne NA (1985) Adenosine receptors on canine parietal cells modulate
gastric acid secretion to histamine. J Pharmacol Exp Ther 233:623-627.
Harty RF and Franklin PA (1984) Effects of exogenous and endogenous adenosine on gastrin
release from rat antral mucosa. Gastroenterology 86:1107.
Heldsinger AA, Vinik AI and Fox IH (1986) Inhibition of guinea-pig oxyntic cell function by
adenosine and prostaglandins. J Pharmacol Exp Ther 237:351-356.
Jaffe B and Walsh JH (1978) Gastrin and related peptides, in Methods of Hormone
Radioimmunoassay (Jaffe bM and Behrman HR eds) pp 455-477, Academic Press, New
York.
Kikuchi H and Hossain A (1999) Signal transduction-mediated CYP1A1 induction by
omeprazole in human HepG2 cells. Exp Toxicol Pathol 51:342-346.
Kobayashi S and Millhorn DE (1999) Stimulation of expression for the adenosine A2A receptor
gene by hypoxia in PC12 cells. A potential role in cell protection. J Biol Chem
274:20358-20365.
Kwok YN, McIntosh C and Brown J (1990) Augmentation of release of gastric somatostatin-like
immunoreactivity by adenosine, adenosine triphosphate and their analogs. J Pharmacol
Exp Ther 255:781-788.
Larsson H, Carlsson E, Ryberg B, Fryklund J and Wallmark B (1988) Rat parietal cell function
after prolonged inhibition of gastric acid secretion. Am J Physiol 254:G33-39.
This article has not been copyedited and formatted. The final version may differ from this version.JPET Fast Forward. Published on May 20, 2004 as DOI: 10.1124/jpet.104.069708
at ASPE
T Journals on July 7, 2018
jpet.aspetjournals.orgD
ownloaded from
JPET # 069708 26
Lee H, Hakanson R, Karlsson A, Mattsson H and Sundler F (1992) Lansoprazole and
omeprazole have similar effects on plasma gastrin levels, enterochromaffin-like cells,
gastrin cells and somatostatin cells in the rat stomach. Digestion 51:125-132.
Lee YC, Chang CW, Su CW, Lin TN, Sun SH, Lai HL and Chern Y (1999) The 5' untranslated
regions of the rat A2A adenosine receptor gene function as negative translational
regulators. J Neurochem 73:1790-1798.
Matsumoto A, Asada S, Saitoh O, Tei H, Okumura Y, Hirata I and Ohshiba S (1989) A study on
gastric ulcers induced by long-term fasting in rats. Scand J Gastroenterol Suppl 162:75-
78.
McIntosh CHS, Kwok YN, Tang C and Brown JC (1987) The use of monoclonal antibodies in
RIA for gastrointestinal hormones. J Clin Immunoassay 10:79-84.
Montminy M, Brindle P, Arias J, Ferreri K and Armstrong R (1996) Regulation of somatostatin
gene transcription by cyclic adenosine monophosphate. Metab Clin Exp 45:4-7.
Nie Z, Mei Y, Ford M, Rybak L, Marcuzzi A, Ren H, Stiles GL and Ramkumar V (1998)
Oxidative stress increases A1 adenosine receptor expression by activating nuclear factor
kappa B. Mol Pharmacol 53:663-669.
Pawlikowski M, Karbownik M, Lewinski A, Pisarek H, Wajs E and Szkudlinski M (1992)
Effects of omeprazole on the number of immunoreactive gastrin- and somatostatin-cells
in the rat gastric mucosa. Histol Histopathol 7:153-156.
Pederson RA, Kwok YN, Buchan AM, McIntosh CH and Brown JC (1984) Gastrin release from
isolated perfused rat stomach after vagotomy. Am J Physiol 247:G248-252.
Puurunen J, Ruoff HJ and Schwabe U (1987) Lack of direct effect of adenosine on the parietal
cell function in the rat. Pharmacol Toxicol 60:315-317.
This article has not been copyedited and formatted. The final version may differ from this version.JPET Fast Forward. Published on May 20, 2004 as DOI: 10.1124/jpet.104.069708
at ASPE
T Journals on July 7, 2018
jpet.aspetjournals.orgD
ownloaded from
JPET # 069708 27
Ralevic V and Burnstock G (1998) Receptors for purines and pyrimidines. Pharmacol Rev
50:413-492.
Ravid K, Smith-Mungo LI, Zhao Z, Thomas KM and Kagan HM (1999) Upregulation of lysyl
oxidase in vascular smooth muscle cells by cAMP: role for adenosine receptor activation.
J Cell Biochem 75:177-185.
Ren H and Stiles GL (1994) Posttranscriptional mRNA processing as a mechanism for regulation
of human A1 adenosine receptor expression. Proc Natl Acad Sci U S A 91:4864-4866.
Sandvik AK, Dimaline R, Brenna E and Waldum HL (1995) Differential expression and
regulation of SSTR2 messenger RNA in rat gastric antrum and corpus. Am J Physiol
269:G542-547.
Scarpignato C, Tramacere R, Zappia L and Del Soldato P (1987) Inhibition of gastric acid
secretion by adenosine receptor stimulation in the rat. Pharmacology 34:264-268.
Schepp W, Soll AH and Walsh JH (1990) Dual modulation by adenosine of gastrin release from
canine G-cells in primary culture. Am J Physiol 259:G556-563.
Shiotani A and Merchant JL (1995) cAMP regulates gastrin gene expression. Am J Physiol
269:G458-464.
Tari A, Wu V, Sumii M, Sachs G and Walsh JH (1991) Regulation of rat gastric H+/K(+)-
ATPase alpha-subunit mRNA by omeprazole. Biochim Biophys Acta 1129:49-56.
Westerberg VS and Geiger JD (1987) Central effects of adenosine analogs on stress-induced
gastric ulcer formation. Life Sci 41:2201-2205.
Wu SV, Giraud A, Mogard M, Sumii K and Walsh JH (1990) Effects of inhibition of gastric
secretion on antral gastrin and somatostatin gene expression in rats. Am J Physiol
258:G788-793.
This article has not been copyedited and formatted. The final version may differ from this version.JPET Fast Forward. Published on May 20, 2004 as DOI: 10.1124/jpet.104.069708
at ASPE
T Journals on July 7, 2018
jpet.aspetjournals.orgD
ownloaded from
JPET # 069708 28
Yip L and Kwok Y (2002) Regulation of gastric adenosine A1 and A2A receptor gene
expression: effect of fasting and omeprazole treatment. Drug Dev Res 56:557.
Yip L and Kwok YN (2004) Role of adenosine A2A receptor in the regulation of gastric
somatostatin release. J Pharmacol Exp Ther 309:804-815.
Yip L, Leung HC and Kwok YN (2004) Role of adenosine A1 receptor in the regulation of
gastrin release. J Pharmacol Exp Ther (in press).
This article has not been copyedited and formatted. The final version may differ from this version.JPET Fast Forward. Published on May 20, 2004 as DOI: 10.1124/jpet.104.069708
at ASPE
T Journals on July 7, 2018
jpet.aspetjournals.orgD
ownloaded from
JPET # 069708 29
Footnotes:
This work was supported by the Canadian Apoptosis Research Foundation Society, Canada
Foundation for Innovation, Wah Sheung Fund and the former BCHRF. Linda Yip was supported
by the Cordula and Gunter Paetzold Fellowship and the University of British Columbia Graduate
Fellowship.
A portion of this work was included in Linda Yip’s Ph.D. thesis entitled: Adenosine A1 and A2A
Receptors in the Rat Stomach: Biological Actions, Cellular Localization, Structure, and Gene
Expression.
Part of this work will be presented at the Purines 2004 Meeting, and a portion of this work has
previously been published in abstract form:
Yip L, Ko A, Leung H and Kwok YN (2004) Role of calcitonin gene-related peptide, vasoactive
intestinal peptide, and achlorhydria in regulating A2A receptor-induced somatostatin-like
immunoreactivity release. To be presented at the Purines 2004 meeting, June 6-9, 2004,
Chapel Hill, North Carolina, USA.
Yip L and Kwok Y (2002) Regulation of gastric adenosine A1 and A2A receptor gene expression:
effect of fasting and omeprazole treatment. Drug Dev Res 56:557.
Please send reprint requests to: Yin Nam Kwok Ph.D., Department of Physiology, University of
British Columbia, 2146 Health Sciences Mall, Vancouver, BC. Canada. V6T 1Z3. Tel: 604-
822-6228, Fax: 604-822-6048, Email: [email protected]
This article has not been copyedited and formatted. The final version may differ from this version.JPET Fast Forward. Published on May 20, 2004 as DOI: 10.1124/jpet.104.069708
at ASPE
T Journals on July 7, 2018
jpet.aspetjournals.orgD
ownloaded from
JPET # 069708 30
Figure Legends
Fig. 1. Effect of omeprazole treatment on gastric housekeeping gene expression. GAPDH
mRNA (A) and 18S rRNA (B) levels were measured in rats treated with vehicle or omeprazole
(OM) for 1 or 3 days; n ≥ 7. Results are expressed as a percentage of the control as described in
the Methods section; * P < 0.05.
Fig. 2. Effect of omeprazole treatment on adenosine A1 and A2A receptor gene expression. A1
receptor (A) and A2A receptor (B) mRNA levels were measured in rats treated with omeprazole
(OM) for 1 or 3 days; n ≥ 7. Results are expressed as a percentage of the control as described in
the Methods section; * P < 0.05, ** P <0.01, ***P < 0.001.
Fig. 3. Effect of omeprazole treatment on gastric peptide gene expression. Gastrin (A) and
somatostatin (B) mRNA levels were measured in rats treated with omeprazole (OM) for 1 or 3
days; n ≥ 7. Results are expressed as a percentage of the control, as described in the Methods
section; * P < 0.05, ** P <0.01, ***P < 0.001.
Fig. 4. Effect of CPA on gastric IRG release in 1-day (A) and 3-day (B) omeprazole (OM)-
treated animals. Results are expressed as IRG release (%) as described in the Methods section.
Each column represents the mean ± SEM. *P < 0.05 and ***P < 0.001 when compared with
period 3 using repeated measures ANOVA followed by Dunnett’s multiple comparison test (n ≥
5). The IRG release during each 5-min period was not significantly different between
omeprazole-treated and control animals when compared using the Student’s unpaired t-test.
This article has not been copyedited and formatted. The final version may differ from this version.JPET Fast Forward. Published on May 20, 2004 as DOI: 10.1124/jpet.104.069708
at ASPE
T Journals on July 7, 2018
jpet.aspetjournals.orgD
ownloaded from
JPET # 069708 31
Fig. 5. Effect of omeprazole (OM) treatment on CPA-induced changes in IRG release. The
percentage inhibition of IRG release between omeprazole-treated animals and their respective
controls was compared using the Student’s unpaired t-test, and were found not to differ. Each
column represents the mean ± SEM (n ≥ 5).
Fig. 6. Effect of CGS 21680 (CGS; 1µM) on gastric SLI release in control (A) and 3-day
omeprazole (OM)-treated (B) animals. Results are expressed as SLI release (%) as described in
the Methods section. Each column represents the mean ± SEM (n ≥ 5); ***P < 0.001 when
compared with period 3 using repeated measures ANOVA followed by Dunnett’s multiple
comparison test. The SLI release during each 5-min period was compared between omeprazole-
treated and control rats using the Student’s unpaired t-test and found to differ significantly during
periods 6, 7, and 8; †P < 0.05.
Fig. 7. Effect of omeprazole (OM) treatment on CGS 21680-induced changes in SLI release.
The percentage change in SLI release between omeprazole-treated animals and their respective
controls was compared using the Student’s unpaired t-test. Each column represents the mean ±
SEM (n ≥ 5); *P < 0.05.
Fig. 8. Effect of CPA on gastric SLI release in 1-day (A) and 3-day (B) omeprazole (OM)-
treated animals. Results are expressed as SLI release (%) as described in the Methods section.
Each column represents the mean ± SEM. *P < 0.05 and ***P < 0.001 when compared with
period 3 using repeated measures ANOVA followed by Dunnett’s multiple comparison test (n ≥
This article has not been copyedited and formatted. The final version may differ from this version.JPET Fast Forward. Published on May 20, 2004 as DOI: 10.1124/jpet.104.069708
at ASPE
T Journals on July 7, 2018
jpet.aspetjournals.orgD
ownloaded from
JPET # 069708 32
5). The SLI release during each 5-min period was compared between omeprazole-treated and
control rats using the Student’s unpaired t-test. In 1-day treated rats perfused with 0.1 µM CPA
(A), SLI release did not differ from controls. In 3-day treated rats perfused with 1 µM CPA (B),
SLI release was found to differ significantly during periods 4 and 5; †P < 0.05 and ††P < 0.01.
Fig. 9. Effect of omeprazole (OM) treatment on CPA-induced changes in SLI release. The
percentage change in SLI release between omeprazole-treated animals and their respective
controls was compared using the Student’s unpaired t-test. Each column represents the mean ±
SEM (n ≥5); *P < 0.05.
This article has not been copyedited and formatted. The final version may differ from this version.JPET Fast Forward. Published on May 20, 2004 as DOI: 10.1124/jpet.104.069708
at ASPE
T Journals on July 7, 2018
jpet.aspetjournals.orgD
ownloaded from
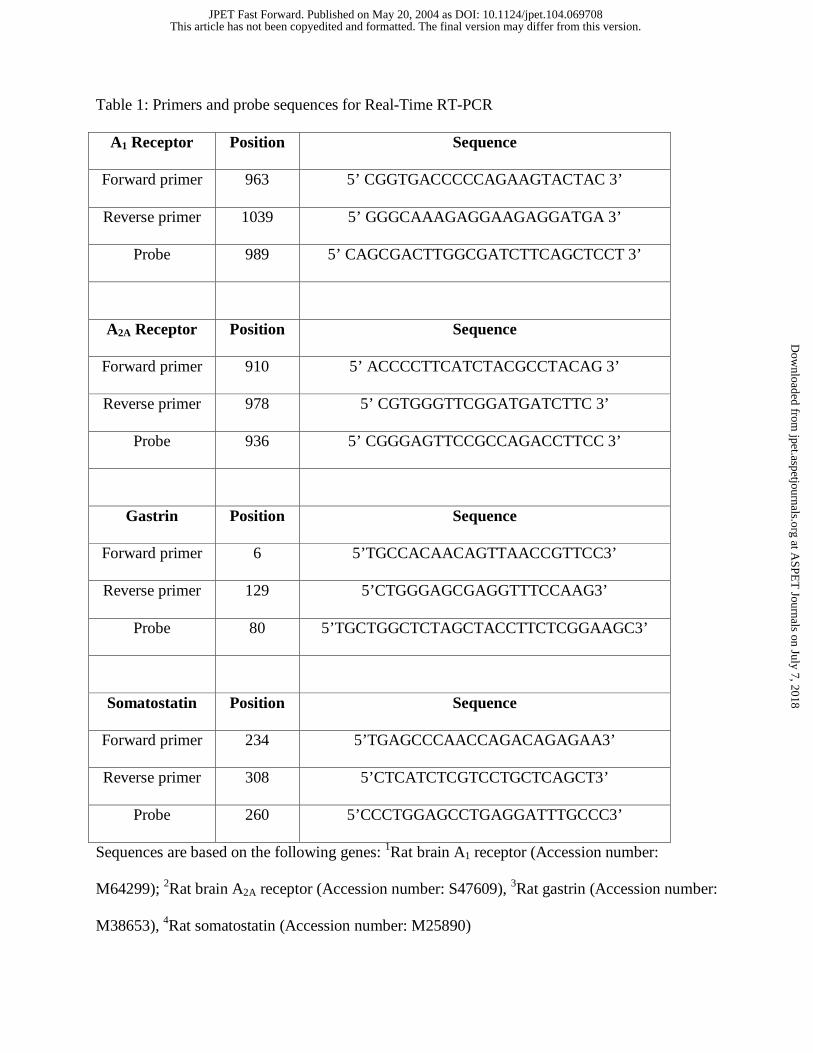
Table 1: Primers and probe sequences for Real-Time RT-PCR
A1 Receptor Position Sequence
Forward primer 963 5’ CGGTGACCCCCAGAAGTACTAC 3’
Reverse primer 1039 5’ GGGCAAAGAGGAAGAGGATGA 3’
Probe 989 5’ CAGCGACTTGGCGATCTTCAGCTCCT 3’
A2A Receptor Position Sequence
Forward primer 910 5’ ACCCCTTCATCTACGCCTACAG 3’
Reverse primer 978 5’ CGTGGGTTCGGATGATCTTC 3’
Probe 936 5’ CGGGAGTTCCGCCAGACCTTCC 3’
Gastrin Position Sequence
Forward primer 6 5’TGCCACAACAGTTAACCGTTCC3’
Reverse primer 129 5’CTGGGAGCGAGGTTTCCAAG3’
Probe 80 5’TGCTGGCTCTAGCTACCTTCTCGGAAGC3’
Somatostatin Position Sequence
Forward primer 234 5’TGAGCCCAACCAGACAGAGAA3’
Reverse primer 308 5’CTCATCTCGTCCTGCTCAGCT3’
Probe 260 5’CCCTGGAGCCTGAGGATTTGCCC3’
Sequences are based on the following genes: 1Rat brain A1 receptor (Accession number:
M64299); 2Rat brain A2A receptor (Accession number: S47609), 3Rat gastrin (Accession number:
M38653), 4Rat somatostatin (Accession number: M25890)
This article has not been copyedited and formatted. The final version may differ from this version.JPET Fast Forward. Published on May 20, 2004 as DOI: 10.1124/jpet.104.069708
at ASPE
T Journals on July 7, 2018
jpet.aspetjournals.orgD
ownloaded from
This article has not been copyedited and formatted. The final version may differ from this version.JPET Fast Forward. Published on May 20, 2004 as DOI: 10.1124/jpet.104.069708
at ASPE
T Journals on July 7, 2018
jpet.aspetjournals.orgD
ownloaded from
This article has not been copyedited and formatted. The final version may differ from this version.JPET Fast Forward. Published on May 20, 2004 as DOI: 10.1124/jpet.104.069708
at ASPE
T Journals on July 7, 2018
jpet.aspetjournals.orgD
ownloaded from
This article has not been copyedited and formatted. The final version may differ from this version.JPET Fast Forward. Published on May 20, 2004 as DOI: 10.1124/jpet.104.069708
at ASPE
T Journals on July 7, 2018
jpet.aspetjournals.orgD
ownloaded from
This article has not been copyedited and form
atted. The final version m
ay differ from this version.
JPET
Fast Forward. Published on M
ay 20, 2004 as DO
I: 10.1124/jpet.104.069708 at ASPET Journals on July 7, 2018 jpet.aspetjournals.org Downloaded from
This article has not been copyedited and formatted. The final version may differ from this version.JPET Fast Forward. Published on May 20, 2004 as DOI: 10.1124/jpet.104.069708
at ASPE
T Journals on July 7, 2018
jpet.aspetjournals.orgD
ownloaded from

This article has not been copyedited and formatted. The final version may differ from this version.JPET Fast Forward. Published on May 20, 2004 as DOI: 10.1124/jpet.104.069708
at ASPE
T Journals on July 7, 2018
jpet.aspetjournals.orgD
ownloaded from
This article has not been copyedited and formatted. The final version may differ from this version.JPET Fast Forward. Published on May 20, 2004 as DOI: 10.1124/jpet.104.069708
at ASPE
T Journals on July 7, 2018
jpet.aspetjournals.orgD
ownloaded from
This article has not been copyedited and form
atted. The final version m
ay differ from this version.
JPET
Fast Forward. Published on M
ay 20, 2004 as DO
I: 10.1124/jpet.104.069708 at ASPET Journals on July 7, 2018 jpet.aspetjournals.org Downloaded from
This article has not been copyedited and formatted. The final version may differ from this version.JPET Fast Forward. Published on May 20, 2004 as DOI: 10.1124/jpet.104.069708
at ASPE
T Journals on July 7, 2018
jpet.aspetjournals.orgD
ownloaded from