effect of moisture content and temperature on the
TRANSCRIPT

EFFECT OF MOISTURE CONTENT AND TEMPERATURE ON THE MECHANICAL PROPERTIES OF WOOD:
AN ANALYSIS O F IMMEDIATE EFFECTS1
C. C. Gerhards Engineer
Forest Products 1,aboratory. Forest Service, U.S. Department of AgricultureL
(Received I5 November 1980)
ABSTRACT
Mechanical properties of wood increase as moisture content decreases below fiber saturation point, at least down to about 5% MC, and as temperature decreases. This report summarizes the relevant studies reported in the literature on the immediate effects of moisture content and temper- ature on several mechanical properties of clear wood. Recommendations are made for future research.
K~..v~r.ordr: Moisture content, temperature, mechanical properties of wood.
INTRODUCTION
Moisture content (MC) and temperature (T) have important effects on me- chanical properties of wood. These effects need to be understood and taken into account in the structural use of wood. While wood technology books such as the U.S. Department of Agriculture Wood Handbook (1974) present a general dis- cussion of moisture and temperature effects, discussion and presentation of data are general1 y limited.
To provide a more thorough background for understanding the effects of mois- ture and temperature on mechanical properties of wood, an attempt is made here to evaluate and summarize the data from all pertinent reports dealing with the immediate effects on clear wood.Vermanent effects due to MC-T-time interac- titons are very important but have received much less research emphasis than innmediate effects. Some permanent effects are discussed in the Wood Handbook.
Almost all mechanical properties of wood increase both as MC decreases below the fiber saturation point (FSP) (approximately 30% MC) and as T decreases. For the moisture effect, it is common to linearly relate the logarithm of a property to iVLC (USDA 1974). On the other hand, it is common to relate the property linearly to temperature, at least up to the level not rapidly affected by thermal degrada- tion. As will be shown in this report, however, some research suggests deviations from these linear trends.
Because the reported research covered a variety of species and specimen sizes (Appendix I), test conditions, and analyses, it was necessary in this report to
' This article was written and prepared by U.S. Government employees on official time, and it is therefore in the public domain. It was presented at the Symposium on Wood Moisture Content- T'emperature and Humidity Relationships, Blacksburg, VA, October 29, 1979.
Maintained at Madison. WI, in cooperation with the University o f Wisconsin. :' Because time is required to raise the temperature of wood, some permanent effects may be
included as immediate effects in the higher temperature research (above about 150 C ) covered in this review.
W o < , d o,zd I-'ihcr. 14( I). 1982. pp 4-3h

Grrhuril\-EFFECT OF MOISTURE CONTENT A N D TEMPERATURE 5
develop common bases for all of the data so that data could be summarized for direct comparison of moisture or temperature effects only. To evaluate the effect of moisture on mechanical properties of clear wood, ii base value at about 20 C and 12% MC was inferred from each data set containing moisture-effect data. The average moisture effects trend of the data set was then represented relative to the base value for the set. Similarly, to evaluate the effect of temperature on mechanical properties of clear wood, a base value at about 20 C was inferred from a data set at a discrete moisture condition. The average temperature trend of the data set for the moisture condition was then represented relative to the base value for the set. As some of the reported research did not contain a 20 C condition, the base value was determined by interpola1:ion or extrapolation, or by using the data directly (as for modulus of elasticity) when "room temperature" test condition was no greater than 27 C. Further discussion of the data analysis iind scope of research is cited for each reference in Appendix 11.
Temperature effects on green or wet wood are inclutled in this report, but green wood or wet wood mechanical values are not compared to 12% MC values. Ratios of mechanical properties between green and 12% MC, however, can be developed from existing tabular species values of mechanical properties (e.g., USDA 1974) or obtained from actual tabulations (ASTM 1979).
MC and T are known to affect wood dimensionally, but those effects are not directly considered in this report because mechanical properties are typically based on dimensions at test conditions. Users of research results, however, may be interested in how strength or stiffness of wood products changes with MC or T in use. For moisture changes in particular, users should consider the combined effect on mechanical property and dimensions. For example, bending stiffness varies inversely with the product of modulus of elasticity (E) and moment of inertia (1) of the cross section. Moisture has an opposite effect on E and I such that the product, EI, is affected less than either E or I alone.
RESULTS
Most results of the analyses are summarized graphically for each wood prop- erty: first in relation to MC at room temperature arid then in relation to T at certain moisture conditions. Moduli of elasticity and rigidity are discussed before strength properties and "parallel-to-grain" precedes "perpendicular-to-grain."
For several mechanical properties, the graphs summarizing MC and T effects do not include all pertinent research results. However, the exclusions, omitted for clarity, are discussed in relation to graphed results.
"Greater effect" and "lesser effect" are terms used frequently to compare research results. A greater effect implies a greater change in mechanical property due to a given change in MC or T. "Greater effect trend" used in context with results on more than one species in a report implies the steeper slope in the relation between a property and MC or T for that report.
As will be shown, the summary graphs typically display a wide variation in MC and T effects. Middle effect trends estimated at certain MC and T conditions from the illustrated results are featured in Tables 1 and 2 and the Summary. At this point the reader may wish to turn directly to the Summary and Recommen- dations sections before delving into the main body of'the text.

6 WOOD A N D FIBER, JANUARY 1982. V . 14(1)
TABLE I. Approximute middle trend qffrcts of moisture content on mechanical properties of clear wood tit ribout 20 C .
Property
Relative change In property from 12% MC
At 6% MC At MC
Modulus of elasticity parallel-to-the-grain Modulus of elasticity perpendicular-to-the-grain Shear modulus Bending strength Tensile strength parallel-to-the-grain Cclmpressive strength parallel-to-the-grain Shear strength parallel-to-the-grain Tensile strength perpendicular-to-the-grain Compressive strength perpendicular-to-the-grain
at the proportional limit
T ~ L B L E 2. Approximute middle trend effects qf temperature on mechanical properties of clear wood or vc1riou.s moisture condition.^.
Property
Relative change in mechanical property
from 20 C Moisture condit~on At -50 C At +50 C
Modulus of elasticity parallel-to-the-grain
Modulus of elasticity perpendicular-to-the-grain 6 12
3 20
Shear modulus >FSP
Bending strength
Tensile strength parallel-to-the-grain
Compressive strength parallel-to-the-grain
Shear strength parallel-to-the-grain
T~ensile strength perpendicular-to-the-grain
Compressive strength perpendicular-to-the-grain 0-6 at the proportional limit 3 10

Gerhurd.s-EFFECT OF MOISTURE CONTENT A N D TEMPERATURE 7
MOISTURE CONTENT (%) FIG. I . Effect of MC at about 20 C on modulus of elasticity parallel-to-the-grain. 10m at 12% MC.
Modulus of e1asticit.y parallel-to-the-grain
Moisture effects.-The relative effects of MC on ~nodulus of elasticity (E) at room temperature are summarized (Fig. 1) from the results of four works (Kufner 1978; Schneider 1971 ; Sulzberger 1953; Wilson 1932). Six additional works (Com- ben 1964; Drow 1945; Ishida 1954; Kadita et al. 1961 , Sellevold et al. 1975; Tang and Hsu 1972) have pertinent data.
The moisture effect for one of Comben's species lies within Schneider's range of effects at 18% MC, but a second species had a low (about 6Wo) relative E at 2Wo MC. Drow's range in effects for two species from 7 to 16% MC encompasses the trends in Fig. I . Ishida's value for near 0% MC falls within Schneider's range. The Kadita et al. data for two species suggest a curving tendency similar to Kufner's but with a lesser moisture effect. Sellevold et al. also suggest a similar curving trend, falling within the range of Schneider's trend from 0 to about 16% MC and within Kufner's range at about 26% MC. Tang and Hsu's data suggest a curving tendency similar to Schneider's upper range for the lower end of the hygroscopic range and a more linear trend within 'GVilson's range over the re- maining hygroscopic range.
Temperature effects.-The effect of temperature on E for wood near WO MC (Fig. 2A) is illustrated with results from eight studies (Bernier and Kline 1968; Ishida 1954; Kitahara and Matsumoto 1974; Kollmann 1960; Okuyama 1974, 1975; Partl and Strassler 1977; Schaffer 1970; Sellevold et al. 1975). The base (100% E) is at 25 C, as most of the pertinent studies focused on that temperature, and correction to 20 C would be almost nil. Because most of the studies were limited to a single species, all but Ishida's data (for two experiments) are represented as single lines. Although Schaffer represented his data by a straight line, he recog- nized that E seemed to be more severely affected by temperatures above 225 C

8 WOOD A N D FIBER, J A N U A R Y 1982, V. 14(1)
150 I I I I I I I I I BERNIER ISHIDA (I- 2 %MC) 1
KOLLMANN, 2 SPECIES R PARTL OKUYAMA
5 0
COMBEN,
1- SELLEVOLD h--
-200 -150 -100 -50 0 50 100 150 200 250 300 TEMPERATURE PC)
FIG. 2 . Effect of temperature on modulus of elasticity parallel-to-the-grain. A: Near 0% MC, 100% at 25 C. B: -12% MC, 100% at 2 0 C. C: aFSP, 100% at 2 0 C.
than below 225 C; this is represented by a second curve generally passing through Schaffer's average data. Most of the other curves, extending over a broad range of temperature, are slightly nonlinear. For small ranges in temperature (e.g., 0 to 100 C), however, straight lines could adequately represent the data.
The effect of temperature on E within the hygroscopic range does not appear t o be as well established as for MC. Variation among results for nine studies that contained data on temperature effect for I I-15% MC (Comben 1964; Ishida 1954; James 1961 ; Kitahara and Matsumoto 1974; Noack and Geissen 1976; Preus- ser 1968; Sano 1961 ; Sellevold et al. 1975; Sulzberger 1953) was greater than at 0% MC.
The temperature effect at about 12% MC is summarized (Fig. 2B) from six of the studies (Comben, James, Kitahara and Matsumoto, Preusser, Sellevold et a]., and Sulzberger). Preusser's data may not adequately reflect the 12% condition as specimens were heated for 1 h prior to testing; however, the results from James

G ' ~ ~ I I O ~ ~ , \ - E F F E C T O F MOISTURE CONTENT AND TEMPERATURE 9
and Kitahara and Matsumoto suggest only a slightly greater temperature effect than Preusser's. Ishida's results for two experiments at 14-15% MC down to --40 C are not shown, but they encompass the effects shown for Comben and Sellevold et al. Noack and Geissen's results for one species at 12% MC agree with the minimum effect trend in Comben's data. Sano's data for two species at 13-15% MC and ranging from -55 to +70 C encompass the Sellevold et al. trend below 20 C and lie between James' trend and Sulzberger's minimum effect trend above 20 C.
Study results in the hygroscopic range below 11% a.nd above 15% are insuffi- cient to warrant separate figures; however, they are of interest when compared with those given in Fig. 2B. Results of Tsuzuki et al. ( 1976) for seven species at 4% MC down to - 180 C cover a range in temperature effects encompassing Comben's lower effects trend and a linear extension of Preusser's trend for below + 160 C. The temperature-effect trend in Noack and Geissen's data for 5% MC down to -40 C closely coincides with Comben's higher effect trend. The tem- perature trend for James' (1961) data at 7% MC agrees closely with his trend in Fig. 2B. Sulzberger's temperature trend for 8% MC matches his trends in Fig. 2B for below 20 C but lies between his lower effect trend and James' trend (Fig. 2B) above 20 C. The temperature trends in James' (1961) data for 16 to 27% MC tend to be greater than his trend in Fig. 2B but are less than Comben's lower effect trend. Noack and Geissen's data for 17% MC lie between Comben's lower temperature effect and Sellevold's temperature effect in Fig. 2B, their 21% MC data lie within Comben's temperature trend in Fig. 2B, their 28% MC data suggest a greater temperature trend than Comben's greater tirend (Fig. 2B). Comben's 18-20% MC data down to - 183 C for two species suggest a temperature trend from his greater effect trend in Fig. 2B to about 17% higher. Sulzberger's six- species data at 20% MC for -20 to +60 C lie within the range of Comben's data below 20 C in Fig. 2B but straddle his own Fig. 2B trend above 20 C with about three times the spread. The trend in the Sellevold et al. data for 27% MC lies within Comben's (Fig. 2B) temperature effects range in Fig. 2B down to about 9 0 C but tends',to show a somewhat greater temperature effect between -100 and - 130 C.
The effect of temperature on wood above fiber saturation in green or wet conditions (Fig. 2C, Comben 1964 and Sellevold et al. 1975) is definitely greater than the effect on wood below fiber saturation (Fig. 2A, B). Sellevold et al. found a dramatic shift in E near 0 C and a decidedly nonlinear effect below 0 C. (See Kollmann 1940, for a related discussion of the effect of ice temperature on wood strength.) Comben's data suggest a somewhat greater temperature effect but do not reflect the same curving tendency as those of Sellevold et al. because Comben used only three discrete temperatures in his study.
Modulus of elasticity perpendicular-to-the-grain
Moisture effects.-Data on the effect of MC on E perpendicular-to-the-grain near room temperature were gleaned from seven reports (Ellwood 1954; Greenhill 1936; Kadita et al. 1961; Kunesh 1968; Schniewind 1962; Siimes 1967; Youngs 1957), of which four (Ellwood, Greenhill, Kadita et al., and Siimes) are summa- rized (Fig. 3) . E perpendicular appears to have both a greater moisture effect and a much greater variation in results than E parallel.

WOOD AND FIBER, JANUARY 1982, V. 14(1)
6 0 ' I I I I I 0 5 10 15 20 2 5 30
MOISTURE CONTENT ('10) FIG. 3 . Effect of MC at about 20 C on modulus of elasticity perpendicular-to-the-grain. 100% at
12% MC.
Of the three studies not plotted, Kunesh's results agree with Siirnes' greater rr~oisture effect at 6% MC, Schniewind's results agree closely with Greenhill's below 12% MC but are more in line with Ellwood's above 12% MC, and Youngs' results suggest an agreement with Ellwood's trend at 6% MC but with an extrap- olation of Siimes' results for 20% MC.
Temperature effects.-Eight reports evaluated the effect of temperature on E plerpendicular-to-the-grain (Byvshykh 1959; Ellwood 1954; Greenhill 1936; Kita- h,ara and Suematsu 1955; Noack and Geissen 1976; Okuyarna et al. 1977; Siirnes 1'367; Youngs 1957). Kitahara and Suernatsu offered the only results for 0% MC- in four species over the temperature range of 10 to 50 C . Their trends were similar to data at 6% MC.
Of the six studies containing data on temperature effect at 6% MC (Byvshykh, Ellwood, Greenhill, Noack and Geissen, Siimes, and Youngs), results from four are plotted (Fig. 4A). Noack and Geissen's data for 0 to -40 C suggest a lesser effect of temperature than the other data sets, but perhaps the required extrap- olation to 20 C yielded an overestimated base value. The trend in Greenhill's data to 82 C (not plotted) agrees closely with Siimes' greater effect trend. Byvshykh's data for 50 to 100 C (not plotted) suggest a trend similar to Ellwood's greater effect trend. Kitahara and Suematsu's results for 0% MC encompass the trends of Youngs, Ellwood, and Siimes shown in Fig. 4A.
Of seven studies (Byvshykh 1959; Ellwood 1954; Greenhill 1936; Kitahara and Suematsu 1955; Noack and Geissen 1976; Siirnes 1967; Youngs 1957) with data for evaluating temperature effects at 12% MC or for the air-dry condition, five (Ellwood, Kitahara and Suematsu, Noack and Geissen, Siimes, and Youngs) are

Gerhard.s-EFFECT OF MOISTURE CONTENT AND TEMPERATURE I I
NOACK, I 6% MC R A D I A L & TAN.
YOUNGS (oO)\" COMf? 8 TEN.
A I I
NOACK, '12% MC
ELLWOOD,
KITAHARA,
4 SPECIES
(0°, I 1°/o MC), \ COME (3 TEN.
SIIfylES 3 SPECIES
OKUYAMA, 1 2 SPECIES, RADIAL &
ELLWOOD 7 lcOMl? 8 TEN. , R@] YOUNGl3 COMP. 8 TEN. D
- 5 0 0 5 0 100 -50 0 50 100 TEMPERATURE (OC)
FIG. 4. Effect of temperature on modulus of elasticity perpendicular-to-the-grain. 100% at 20 C. A: -6% MC. B: -12% MC. C: -20% MC. D: 3FSP.
summarized (Fig. 4B). Noack and Geissen's data for 12% MC, as for 6% MC, over the range 0 to -40 C suggest a lesser temperature effect than others, perhaps due to an overestimate of a 20 C base value by extrapolation. Greenhill's data (not shown) suggest a slightly greater effect than Ellwood's lesser effect trend, while Byvshykh's data (not shown) suggest a trend !slightly less than Siimes' lesser effect trend.
The effect of temperature on E perpendicular at 205% MC is shown (Fig. 4C) for five (Byvshykh 1959; Ellwood 1954; Greenhill 1936; Noack and Geissen 1976; Youngs 1957) of six studies containing pertinent data. The trend in Siimes' data (not shown) falls within the middle of the range of Ellwood's data.
Of five studies containing data on the effect of temperature on E perpendicular above fiber saturation, four (Ellwood 1954; Okuyama et al. 1977; Siimes 1967;

12 WOOD A N D FIBER, J A N U A R Y 1982. V . 14(1)
LLI 80
:> i= 70 a -J LLI cr 60
MOISTURE CONTENT (%I FIG. 5 . Effect of MC at about 20 C on shear modulus parallel-to-the-grain. 100% at 12% MC
Ysoungs 1957) are summarized (Fig. 4D). The trend in Greenhill's (1936) data (not shown) lies about in the middle of Siimes' data. Results of Okuyama et al. were decidedly nonlinear, supporting trends for some of the other data in Fig. 4D only at about 80 C.
Modulus of rigidity
Only two studies evaluated the effects of moisture on shear modulus (G): results of Mark et al. (1970) and Tang et al. (1971) (Fig. 5 ) were determined on plate shear specimens during dryout from the green condition.
Only a report by Okuyama et al. (1977) evaluated the effect of temperature on G-for two species in the wet condition from 20 to 80 C. The results suggest a slightly nonlinear trend with a spread in G values at 80 C of 20 to 5W0 of the values at 20 C.
M n d u l ~ ~ s of rllpture
Moisture effects.-Five reports (Drow 1945; James 1964; Leont'ev 1960; Sulz- berger 1953; Wilson 1932) evaluated the effect of MC on bending strength, show- ing considerable range in moisture effects (Fig. 6) and making it difficult to gen- eralize an approximate moisture effect. Because Wilson's and Leont'ev's trends b,nsed on many species are in relatively close agreement, however, the middle trend of Wilson's data from 6 to 20% MC may yield the most representative effect on bending strength.
Tc~tnperuturr effic.ts.--Seven works (Boller 1954; Comben 1964; Okuyama 1974, 1'375; Partl and Strassler 1977: Sulzberger 1953; Tsuzuki et al. 1976) reported

G'erhrrrd.\-EFFECT O b MOISTURE CONTENT A N D TEMPERATURE 13
-
-
0 5 10 15 210 25 3 0 MOISTURE CONTENT ('Yo)
FIG. 6 . Effect of MC at about 20 C on bending strength of wood. loM at 12% MC.
temperature effects on bending strength. Figure 7A sunlmarizes the trends at 0% MC from Okuyama et al., Partl and Strassler, and Sulzberger along with Tsuzuki's for 4% MC. Okuyama's (1975) results (not completely shown, for clarity) extend linearly down to 5 0 C and thus agree closely with the lower temperature effect trends in Tsuzuki's data.
In addition to the studies at 0 and 4% MC, other data on the effect of temper- ature on bending strength at higher MC's were reported by Boller for 9% MC, Comben and Sulzberger for 1 1-12%, Partl and Strassler for 15% MC, Comben and Sulzberger for 18-20% MC, and Comben and Partll and Strassler for >FSP. Summarized results (Fig. 7B) suggest an increasing temperature effect as MC is increased. This is more evident for the colder temperatures than for the warmer temperatures.
Partl and Strassler's data for 15% MC are shown only for a limited temperature range (Fig. 7B) but they extend down to -30 C, coincitiing with Comben's trend for 11-12% MC down to that temperature. Boller's data for % MC extending down to about - 180 C (not shown, for clarity) suggest a linear temperature trend but with considerable range, with about 140 to 240% of r~oom temperature strength at - 180 C. That range for Boller's data includes Sulzberger's trend for 12% MC, all of Comben's trends for 11-12% MC, and part of Comben's trends for 18% MC.
As shown by Partl and Strassler's 75% MC data, temperature has a much

14 WOOD A N D FIBER. JANUARY 1982. V . 14(1)
2 0 0 - I I I I I 1 TSUZUKI (4 '10 M C), 0 % M C
SULZBERGER ( 0 % MC), -
- 100 -
$ - A I I I
50 I
C3 z W
v, 211 O/o MC
-
PARTL(75OIoMC) -
-
SULZBERGER
- '00 -150 -100 - 5 0 0 50 100 150 TEMPERATURE (?2 )
FIG 7 Effect of temperature on bendlng strength of wood 100% at 20 C A O and 4% MC. B 2 1 1 % MC
greater effect on bending strength of wet wood below 20 C than above. Their cold-temperature trend for wet wood is supported by Comben's data while their warm-temperature trend is more in line with the temperature effect on bending strength of Sulzberger for 2m MC.
Tensile strength parallel-to-the-grain
Moisture effects. -Kollmann (1 956), Kufner (1 978), and Leont'ev ( 1 962) pro- vided data on the effect of MC on tensile strength parallel-to-the-grain (Fig. 8). Most of the species evaluated by Kufner suggested a maximum strength between 4 and 8% similar to, but not as pronounced as, the maximum in Kollmann's trend.

Gerhurda-EFFECT OF MOISTURE CONTENT A N D TEMPERATURE 15
FIG. 8. 12% MC.
0 5 10 15 E!O 25 30 MOISTURE CONTENT (%)
Effect of MC at about 20 C on tensile strength of wood parallel-to-grain. 100% at
Temperature effects.-Only six reports contained data on the effect of tem- perature on tensile strength of wood parallel-to-the-grain (Comben 1964; Knudson 1973; Knudson and Schnlewind 1975; Kollmann 1952; Sano 1961; Schaffer 1973). A summary of those data (Fig. 9) suggests that temperature has only a moderate effect. Schaffer's results for 0% MC suggest a loss of only 15% at 150 C, and Kollmann's trend for 12% MC out to 100 C suggests on~ly a slightly greater effect. The greater high-temperature trend in Schaffer's data over 200 C is probably due to rapid thermal degradation. The trend discerned in Knudson and Schniewind's data suggests a generally greater high-temperature effect than Schaffer's, but the Knudson-Schniewind result may be confounded with kIC as their specimens were
0 1 I 1 I I 1 I
-200 150 -100 -50 0 50 100 150 200 250 300 TEMPERATURE (OC )
FIG. 9. Effect of temperature on tensile strength parallel-to-the:-grain for various moisture con- tents. 100%~ at 20 C.

16 WOOD A N D FIBER, J A N U A R Y 1982. V . 14(1)
0 5 10 15 2 0 2 5 30 MOISTURE CONTENT (%)
FIG. 10. Effect of MC at about 20 C on compressive strength parallel-to-the-grain. 100% at 12% MC.
conditioned to 12% MC prior to heating. Comben's results for 11-20% MC sug- gest some moderate reductions in tensile strength for cold temperatures. Sano's results for air-dry wood, however, indicate an opposite trend. Except for Sano's result, the trends for temperature effects (Fig. 9) and for moisture effects (Fig. 8) suggest that tensile strength parallel-to-the-grain may have an absolute maxi- mum value near room temperature and between 0 and 10% M C .
Maximum compressive strength parallel-to-the-grain
Moisture effects.-Nine reports evaluated the effects of M C on compressive strength of wood parallel-to-the-grain (Drow 1945; lshida 1954; James 1964; Koll- lnann 1940; Leont'ev 1960; Matejek and Starecka 1971; Schneider 1971; Sulz- loerger 1953; Wilson 1932). Results from Ishida, Leont'ev, Matejek and Starecka,

(;prhard.%-EFFECT OF MOISTURE CONTENT A N D TEMPERATURE 17
- KOLLMANN, 3 SPECIES
A I I I I I I I I I - 2 0 0 -150 -100 - 5 0 0 5 0 100 150 2 0 0 2 5 0
SULZBERGER
KOI-LMAN (28 -45%MC)
I I I -200 -150 -100 - 5 0 0 5 0 100 -100 - 5 0 5 100
TEMPERATURE (OC:)
I . I I. Effect of temperature on compressive strength parallel-to-the-grain. 100% at 20 C. A: 0% MC. B: -12% MC. C: ZFSP.
Schneider, and Wilson (Fig. 10) show that the range of effects in Wilson's data encompasses the trends in the other four. Of the studies not illustrated, Drow's data for two species from 7 to 16% MC tend to agree closely with Matejek and Starecka's trend; James' data for 2 to 25% MC tend to agree closely with the lesser trend limiting Leont'ev's data; Kollmann's results for one species tend to fall in the middle of Leont'ev's trend up to 15% MC but more toward Leont'ev's greater effect trend above 15% MC; and Sulzberger's data for eight species cover the same range of moisture effects indicated for Wilson's data in Fig. 10.
Temperuture effects.-Of the eight studies with data on the effect of temper- ature on compressive strength parallel-to-the-grain, six evaluated wood at 0% MC (Ishida 1954; Kitahara and Suematsu 1955; Knudson and Schniewind 1975; Koll- mann 1940; Schaffer 1973; Sulzberger 1953), four at about 12% MC (Comben 1964; Kollmann; Sano 1961; Sulzberger), and four at above fiber saturation (Com- ben, Ishida, Kollmann, and Sulzberger).
Results of research on temperature effect at WO MC showed good agreement (Fig. 1 IA). While Kitahara and Suematsu's data suggest a somewhat greater

18 WOOD AND FIBER. JANUARY 1982, V . 14( 1)
0
Effect of
DROW, I A 2 SPECIES
/ W I LSON.
I 5 10 15 20 25 30
MOISTURE CONTENT ('10) MC at about 20 C on shear strength parallel-to-the-grain. 100% at 12% MC.
temperature effect on compressive strength, their data cover a rather narrow range of temperatures compared with the others. The trend in Ishida's data from 2 0 to +60 C (not shown) agrees closely with Schaffer's trend.
The results for temperature effect on compressive strength at 12% MC (Fig. 1 IB) suggest considerable variation, largely a result of the trend displayed by C'omben's data for cold temperatures in contrast to that shown for Kollmann, Sano, and Sulzberger.
Kitahara and Suematsu's data for four species (not shown) in the air-dry con- dition (13-17% MC) from 10 to 50 C encompass almost the entire range of effects attributed to Sulzberger and Sano for 12% MC in Fig. 11B. Ishida's data for 15% M[C from -20 to +60 C (not shown) closely agree with the lesser temperature effect of Sulzberger's data (Fig. 1 1B).
On the basis of results for compressive strength above fiber saturation (Fig. I IC), an interesting interaction of moisture and cold temperatures takes place (ICollmann 1940): the higher the wet MC, the greater the cold-temperature effect om strength. Comben's and Ishida's data for unspecified MC qualitatively support K.ollmann's greater cold-temperature effects. In fact, Comben's data for - 183 C suggest a strength five times that at 20 C for wet wood. The results of Sulzberger and Ishida for warmer temperatures and Kollmann for 28 to 45% MC have tem- perature-effect trends similar to those for 12% MC (Fig. 1 lB), exclusive of Com- ben's 12% MC data.

Grrhurds-EFFECT OF MOISTURE CONTENT A N D TEMPERATURE 19
TEMPERATURE ( "C) FIG. 13. Effect of temperature on shear strength parallel-to-the-grain for two moisture conditions.
lom at 20 C.
Shear strength parallel-to-the-(yrain
Moisture effects.-Trends in the data from reports by Drow (1945), Leont'ev (1960), and Wilson (1932) on the effect of MC on shear strength parallel-to-the- grain (Fig. 12) suggest considerable variation in moisture effects. Drow's data, of limited extent compared to the others, show very little moisture effect.
Temperature effects.-Only Ohsawa and Yoneda ( 1978) and Sano (1961) eval- uated the temperature effect on shear strength parallel-to-the-grain (Fig. 13). Sano's data for the air-dry condition suggest a lesser temperature effect than Ohsawa and Yoneda's data for wood above fiber saturation.
Ohsawa and Yoneda also evaluated the effect of temperature on wet shear strength of one species in a radial-longitudinal plane perpendicular-to-the-grain (rolling shear type). The effect was similar to their re:sults for wet shear strength parallel-to-the-grain.
Tensile strength perpendicular-to- the-grain
Moisture effects.-Eight studies presented data on the effect of MC on the tensile strength of wood perpendicular-to-the-grain at about 20 C (Ellwood 1954; Goulet 1960; Greenhill 1936; Kollmann 1956; Leont'ev 1962; Schniewind 1962; Siimes 1967; Youngs 1957). The moisture-effect trerrds from Goulet, Kollmann, Leont'ev, and Siimes (Fig. 14) suggest a relatively wide range in effects. Of the studies not illustrated, Ellwood's data for 6 to 18% MC closely agree with the lesser trend in Siimes data for less than 12% MC but lie a little above Siimes' lesser effect above 12%; Greenhill's data for 6 to 18% MC lie in the middle of Goulet's range of effects above 12% MC and slightly below the Kollmann trend below 12% MC; Schniewind's data for 6 to 20% MC have about the same vari- ability as Goulet's results but tend to show slightly lower effects below 12%; and

WOOD AND FIBER, JANUARY 1982, V . 14(1)
MOISTURE CONTENT ('10) FIG. 14. Effect of MC on tensile strength perpendicular-to-the-grain at 20 to 27 C. 100% at 12%
M(J.
Young's data for 6 to 18% MC suggest a trend that closely agrees with the lesser effect trend in Goulet's data.
Temperature effects.-Seven reports evaluated the effect of temperature on te~nsile strength perpendicular-to-the-grain (Byvshykh 1959; Ellwood 1954; Goulet 1960; Greenhill 1936; Okuyama et al. 1977; Siimes 1967; Youngs 1957). All of the
FIG. 15. 69'0 MC. B:
GOULET (4 % MC), GREENHILL
r3SPECIES (6YeMC) r ELLWOOD/ GREENHILL
0 5 0 100 0 5 0 100 0 50 100 TEMPERATURE ("C)
Effect of temperature on tensile strength perpendicular-to-the-grain. lom at 20 C. A: 4- l I-16% MC. C: 318% MC.

G ~ ~ I ~ u ~ ~ A - E F F E C T OF MOISTURE CONTENT A N D TEMPERATURE 2 1
WILSON; 4 SPECIES
4 0 1 1 1 - 0 5 10 15 2 0 25 3 0
MOISTURE CONTENT ( % I FIG. 16. Effect of MC on the proportional limit compressive strength perpendicular-to-the-grain
at 20 to 27 C. 10070 at 12% MC.
studies were limited to temperatures from 0 to 100 C Results (Fig. 15) for three categories (4-6% MC, 11-16% MC, and 218% MC:) suggest a wide range in temperature effects, particularly for the lower moisture conditions. The temper- ature effects from Okuyama et al. for four species in the wet condition are not shown but lie generally within the range of Goulet's. For the 4-6% MC category, Byvshykh's data suggest a much greater temperature effect than do other studies. That difference, however, may be due to a poor estimate of a 20 C value due to the relatively large extrapolation required of ByvshyE;h's data (from 50 to 20 C). Overall, the temperature effect on tensile strength perplendicular-to-the-grain gen- erally increases as moisture increases (Fig. 15).
Compressive strength a t the proportional limit per;uendiculur-to-the-gruin
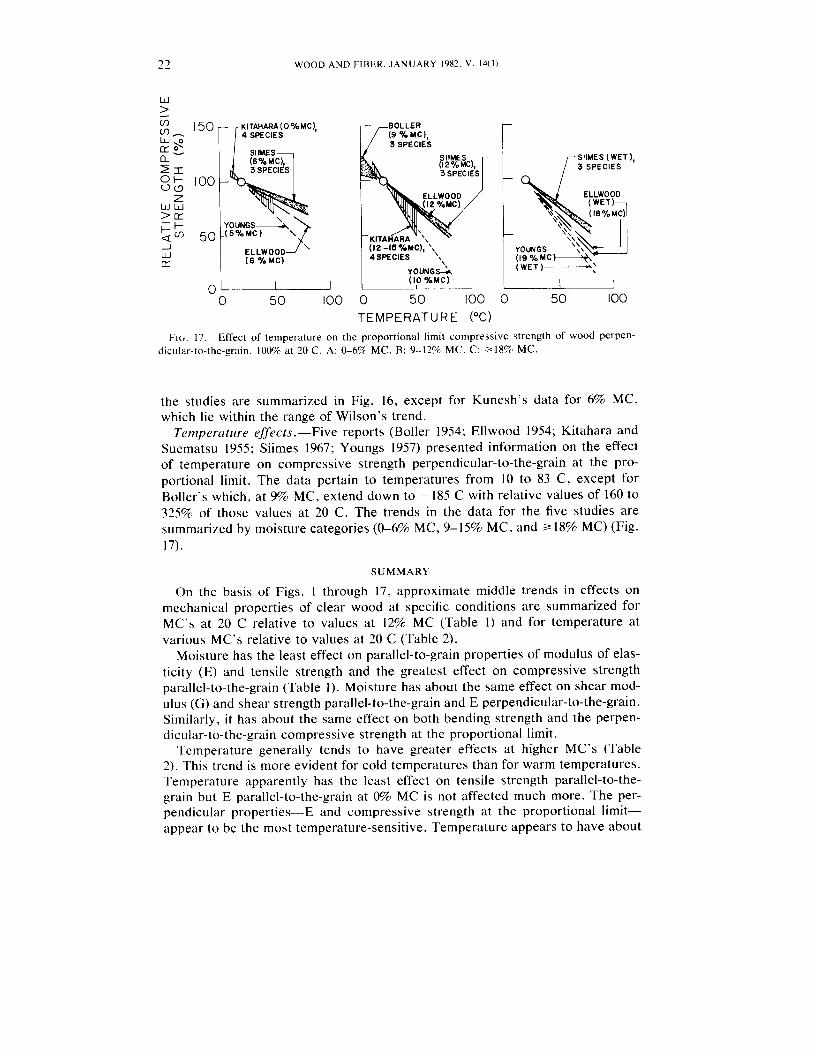
Moisture effects.-Six reports (Ellwood 1954; Kunesh 1968; Okohira 1955; Siimes 1967; Wilson 1932; Youngs 1957) evaluated the effect of MC on compres- sive strength perpendicular-to-the-grain at the proportitonal limit. The results from
WOOD AND FIBER, JANUARY 1982. V. 14(1)
150 r~lTAHARA(O%MC), 4 SPECIES
SllMES
3 SPECIES
BOLLER rr(9 Ole MC),
3 SPEClES
SllMES (1 2% MC), 3 SPECIES
YOUNGSA
0 50 100 TEMPERATURE ( O C )
1 r SllMES (WET 1, 3 SPECIES
YOUNGS
(WET I-,
l3c. 17. Effect of temperature on the proportional limit compressive strength of wood perpen- dicular-to-the-grain. 100% at 20 C. A: 0 4 % MC. B: 9-12% MC. C: 318% MC.
the studies are summarized in Fig. 16, except for Kunesh's data for 6% MC, which lie within the range of Wilson's trend.
Temperature effects.-Five reports (Boller 1954; Ellwood 1954; Kitahara and Suematsu 1955; Siimes 1967; Youngs 1957) presented information on the effect of temperature on compressive strength perpendicular-to-the-grain at the pro- portional limit. The data pertain to temperatures from 10 to 83 C, except for Boller's which, at % MC, extend down to - 185 C with relative values of 160 to 325% of those values at 20 C. The trends in the data for the five studies are summarized by moisture categories (0-6% MC, 9-15% MC, and 218% MC) (Fig. I '7).
SUMMARY
On the basis of Figs. 1 through 17, approximate middle trends in effects on m~echanical properties of clear wood at specific conditions are summarized for MC's at 20 C relative to values at 12% MC (Table 1) and for temperature at v,arious MC's relative to values at 20 C (Table 2).
Moisture has the least effect on parallel-to-grain properties of modulus of elas- ticity (E) and tensile strength and the greatest effect on compressive strength parallel-to-the-grain (Table I). Moisture has about the same effect on shear mod- ulus (G) and shear strength parallel-to-the-grain and E perpendicular-to-the-grain. Similarly, it has about the same effect on both bending strength and the perpen- dicular-to-the-grain compressive strength at the proportional limit.
Temperature generally tends to have greater effects at higher MC's (Table 2). This trend is more evident for cold temperatures than for warm temperatures. Temperature apparently has the least effect on tensile strength parallel-to-the- grain but E parallel-to-the-grain at MC is not affected much more. The per- pendicular properties-E and compressive strength at the proportional limit- appear to be the most temperature-sensitive. Temperature appears to have about

(;erhrtrds-EFFECI' OF MOISTURE CONTENT A N D TEMPERATURE 23
the same effect on bending strength, compressive strength parallel-to-the-grain, and tensile strength perpendicular-to-the-grain.
Unfortunately, data available for this overview contained wide variation within and between species. Thus, factors pertinent to differences between species and between properties cannot be adequately evaluated at this time. Specific research is necessary to explore that aspect further.
RECOMMENDATIONS
Wood technology can be more fruitfully advanced by studying why moisture and temperature effects on mechanical properties appear to be highly variable than by studying h o w the effects occur. Certainly, many studies of the latter kind are reported in the literature. If some of the former have been reported, this author is not aware of any.
The "why" is important because structural safety may be adversely affected if type of species or growth characteristic is a significant interacting variable with moisture and temperature. Some research suggests greater than twofold differ- ences in effects of moisture and temperature for a given mechanical property (e.g., Figs. 6 and 1 IB). If these reflect real differences between species, it is possible that an elevated temperature condition-in an attic, for example-may cause a reduction of only 10% from room-temperature strength in one species but of perhaps 40% in another. Structurally safe design depends on such knowledge.
Although experimental error has probably contributed to some of the noted variability, anatomical differences within and between species may have been a significant factor. Anatomical differences between species are well known. Soft- woods may be distinguished by characteristic latewalod and resin canals. Hard- woods may be distinguished by size and arrangement of pores, size of rays, interlocked or wavy grain, and other characteristics. Segregating characteristics for both general types of wood include density and extractive content. Differences within a species occur between juvenile and mature wood, earlywood and late- wood, rapid- and slow-growth wood and reaction and normal wood.
Not all of the different growth characteristics may contribute to significant differences in moisture and temperature effects, but some-such as earlywood vs. latewood or reaction wood vs. normal wood-may, because of probable dif- ferences in thermal expansion and moisture swelling coefficients. Different rates of expansion or contraction suggest that internal stresses may be induced in a specimen as moisture or temperature is changed. Thus, internal stresses could vary depending on the ratio of earlywood to latewood (within species) or on the ratio of expansion coefficients for the two growth increments (between species). A similar phenomenon could occur where reaction wood is found intermixed with normal wood in a ~pecimen, as it is well known that cross breaks occur when some boards containing reaction wood are dried.
Any one of the several different mechanical properties of wood could serve as the basis for studying the "why" problem. Certain properties, such as bending strength, may be more important to engineers while others, such as tensile strength perpendicular-to-the-grain, may be more important to wood drying sci- entists and technologists.
Good scientific technique is important in evaluatirig the "why" problem. Se-

2 4. WOOD AND FIBER. JANUARY 1982, V. 14(1)
lection of several species for broad differences in anatomy and segregation of material within a species by growth characteristics are essential. A large number of' test specimens would be necessary to provide statistically meaningful data, antd adequate ranges in moisture (6 to 20%) and temperature (0 to 100 C) would be required. Such study would have a large scope and could serve as the basis for more than one thesis.
A final area worth study is the relation of tensile strength parallel-to-the-grain to MC and temperature to verify that maximum strength occurs at some inter- mediate conditions. An adequate number of discrete temperature and moisture levels would be required to determine the interaction of those two variables on tensile strength.
REFERENCES
AMERICAN SOCIETY FOR TESTING A N D MATERIALS. 1979. Standard methods for establishing clear wood strength value\. ASTM D 2555-78. ASTM, Philadelphia, PA.
BERNIER, G. A., A N D D. E. KLINE. 1968. Dynamic mechanical behavior of birch compared with methylmethacrylate impregnated birch from 90" to 475" K. For. Prod. J . 18(4):79-82.
BOLLER, K. H. 1954. Wood at low temperatures. Mod. Packag. 28(1):153-157. BYVSHYKH, M. D. 1959. [Influence of temperature and moisture content of wood on its elastic
properties.] Derev. Prom. 8(2):13-15. [In Russian] COMBEN, A. J . 1964. The effect of low temperatures on the strength and elastic properties of timber.
J . Inst. Wood Sci. 13:44-55. DROW, J . T. 1945. Effect of moisture content on the compressive, bending, and shear strengths, and
on the toughness ofplywood. U.S. For. Serv. Rep. No. 1519. U.S. Dep. Agric., For. Serv., For. Prod. Lab., Madison, WI.
E I I WOOD, E. L. 1954. Properties of American beech in tension and compression perpendicular to the grain and their relation to drying. Yale Univ. School For., Bull. No. 61. Yale Univ., New Haven, CT.
GOULET, M. 1960. [Dependence of transverse tensile strength of oak, beech and spruce on moisture content and temperature within the range of O" to 100" C.] Holz Roh- Werkst. 18(9):325-331. [In German]
GREENHII I., W. L. 1936. Strength tests perpendicular to the grain of timber at various temperatures and moisture contents. J . Counc. Sci. Ind. Res. 9(4):265-278.
ISHIDA, S. 1954. [The effect of temperature on the strength of wood.] Hokkaido Univ. Res. Bull., Coll. Exp. For. 17(1): 1-14. [In Japanese]
J A M E S , W. L. 1961. Effect of temperature and moisture content on internal friction and speed of sound in Douglas-fir. For. Prod. J . 11(9):383-390.
-- . 1964. Vibration and static strength and elastic properties of clear Douglas-fir at various levels of moisture content. For. Prod. J . 14(9):409-413.
KADITA, S., T. YAMADA, M. SUZUKI, A N D K . KOMATSU. 1961. [Studies on the rheological properties of wood. 1. Effect of moisture content on the dynamic Young's modulus of wood. 11. Effect of heat-treating condition on the hygroscopicity and dynamic Young's modulus of wood.] J. Jap. Wood Res. Soc. 7(1):29-33, 34-38. [In Japanese]
K.ITAHARA, K., A N D A. SUEMATSU. 1955. [The influence of temperature on compressive properties of wood.] J. Jap. Wood Res. Soc. 1(2):47-51. [In Japanese]
K.IIAHARA, R. , A N D T. MATSUMOTO. 1974. [Temperature dependence of dynamic mechanical loss of wood.] J. Jap. Wood Res. Soc. 20(8):349-354. [In Japanese]
K.NUDSON, R. M. 1973. Performance of structural wood members exposed to fire. Ph.D Thesis, Dep. Wood Sci. Tech., Univ. California, Berkeley, CA.
-- , A N D A. P. SCHNIEWIND. 1975. Performance of structural wood members exposed to fire. For. Prod. J. 25(2):23-32.
K . 0 1 ILMANN, F. 1940. [The mechanical properties of wood of different moisture content within 2 0 0 " to +20OoC temperature range.] VDI-Forschungsh. 403(11): 1-18. [In German]
-- . 1952. [The dependence of some mechanical properties of woods on time, notching and

Gerhurd3-EFFECT OF MOISTURE CONTENT AND TEMPERATURE 25
temperature. 111. The influence of temperature on some mechanical properties of woods.] Holz Roh- Werkst. 10(7):269-278. [In German]
-- . 1956. [Investigations on the tensile strength of woods perpendicular to the grain.] Rep. Inst. Wood Res. Wood Tech., Munich Univ., Sonderdmck Forstw. Cbl. 75:257-512. [In German]
-- . 1960. [The dependence of the elastic properties of wood on temperature.] Holz Roh- Werkst.
18(8):304-3 14. [In German] KUFNER, M. 1978. [Modulus of elasticity and tensile strength of wood species with different density
and their dependence on moisture content.] Holz Roh- Werkst. 36(11):435-439. [In German] KUNESH, R. H. 1968. Strength and elastic properties of wood in transverse compression. For. Prod.
J. 18(1):65-72. LEONT'EV, N . L. 1960. [The strength of wood at varying moisture content.] Derev. Prom. 10: 17-18.
[In Russian] .- . 1962. [Strength of wood of different moisture content.] Derev. Prom. 4: 14-15. [In Russian] MARK, R. E. , S. F. ADAMS, A N D R. C. TANG. 1970. Moduli of rigidity of Virginia pine and tulip
poplar related to moisture content. Wood Sci. 2(4):203-211. MATEJEK, M., A N D D. STARECKA. 1971. [Influence of the freezing process with wood on its com-
pressive strength.] Holztechnologie 12(3):144-146. [In German] NOACK, D., A N D A. GEISSEN. 1976. [Influence of temperature and moisture on the modulus of
elasticity in the freezing state.] Holz Roh- Werkst. 34(2):55-62. [In German] OHSAWA, J., A N D Y. YONEDA. 1978. [Shear test of woods as a model of defibration.] J . Jap. Wood
Res. Soc. 24(4):230-236. [In Japanese] OKOHIRA, Y. 1955. [Studies on the compression perpendicular to the grain and radial to the growth
increment in the wood of "Sugi," Cryptomeria japonica D. Don.] J. Jap. Wood Res. Soc. 1(2):52-54. [In Japanese]
OKUYAMA, T. 1974, 1975. [Effect of strain rate on mechanical properties of wood. IV. On the influence of the rate of deflection and the temperature to bending strength of wood. V. On the influence of the temperature to impact bending strength.] J. Jap. Wood Res. Soc. 20(5):210-216, 2 1(4):2 12-216. [In Japanese]
.- , S. SUZUKI , A N D S. TERAZAWA. 1977. [Effect of temperature on orthotropic properties of wood. I. On the transverse anisotropy in bending.] J. Jap. Wood Res. Soc. 23(12):609-616. [In Japanese]
PARTL, M., A N D H. STRASSLER. 1977. [Effect of temperature on the static and impact bending behavior of spruce wood.] Holzforsch. Holzverwert. 29(5):94- 101. [In German]
PREUSSER, R. 1968. [Plastic and elastic behavior of wood affected by heat in open systems.] Holz- technologie 9(4):229-23 1. [In German]
SANO, E. 1961. [Effects of temperature on the mechanical properties of wood. I. Compression parallel-to-grain. 11. Tension parallel-to-grain. 111. Torsion test. / J. Jap. Wood Res. Soc. 7(4): 147- 150, 7(5):189-191, 7(5):191-193. [In Japanese]
SCHAFFER, E. L. 1970. Elevated temperature effect on the longitudinal mechanical properties of wood. Ph.D. Thesis, Dep. Eng. Mech., Univ. Wisconsin, Madison, WI.
-. 1973. Effect of pyrolytic temperatures on the longitudinal strength of dry Douglas-fir. J . Test. Eval. 1(4):319-329.
SCHNEIDER, A. 1971. [Investigations on the influence of heat treatments with a range of temperatures from 100" to 200" C on the modulus of elasticity, maximum crushing strength, and impact work of pine sapwood and beechwood.] Holz Roh- Werkst. 29(11):431-440. [In German]
SCHNIEWIND, A. P. 1962. Tensile strength perpendicular to the: grain as a function of moisture content in California black oak. For. Prod. J . 12(5):249-252.
SELLEVOLD, E. J . , F. RADJY, P. HOFFMEYER, A N D L. BACH. 1975. Low temperature internal friction and dynamic modulus for beech wood. Wood Fiber 7(3): 162-1 69.
SIIMES, F. E. 1967. The effect of specific gravity, moisture conttmt, temperature and heating time on the tension and compression strength and elastic properties perpendicular to the grain of Finnish pine, spruce and birch wood and the significance of those factors on the checking of timber at kiln drying. State Inst. Tech. Res., Publ. 84. Helsinki, Finland.
SUI-ZRERGER, P. H. 1953. The effect of temperature on the strength of wood, plywood and glue joints. Aeronaut. Res. Consultative Com. Rep. ACA-46. Melbourne, Australia.
TANG, R. C., S. F. ADAMS, A N D R. E. MARK. 1971. Moduli of rigidity and torsional strength of scarlet oak related to moisture content. Wood Sci. 3(4):238-244.

2 fb WOOD A N D FIBER. JANUARY 1982. V . 14(1)
-- , A N D N. N. HSU. 1972. Dynamic Young's moduli of wood related to moisture content. Wood Sci. 5(1):7-14.
TSUZUKI , K . , T. T A K E M U R A , A N D I . ASANO. 1976. [Physical properties of wood-based material at low temperatures. I . The bending strength of wood as related to temperature and specific gravity.] J . Jap. Wood Res. Soc. 22(7):381-386. [In Japanese]
U . S. DEPARTMENT OF AGRICULTURE, FORESI SERVICE, FOREST PRODUCTS LABORATORY. 1974. Wood handbook: Wood as an engineering material. USDA Agric. Handb. 72. Rev. U.S. Dep. Agric., Washington, D.C.
WILSON, T. R. C. 1932. Strength-moisture relations for wood. USDA Tech. Bull. No. 282. U.S. Dep. Agric., Washington, D.C.
YOUNGS, R. L. 1957. The perpendicular-to-grain mechanical properties of red oak as related to temperature, moisture content, and time. U.S. For. Serv. Rep. No. 2079. U.S. Dep. Agric., For. Serv., For. Prod. Lab., Madison, WI.

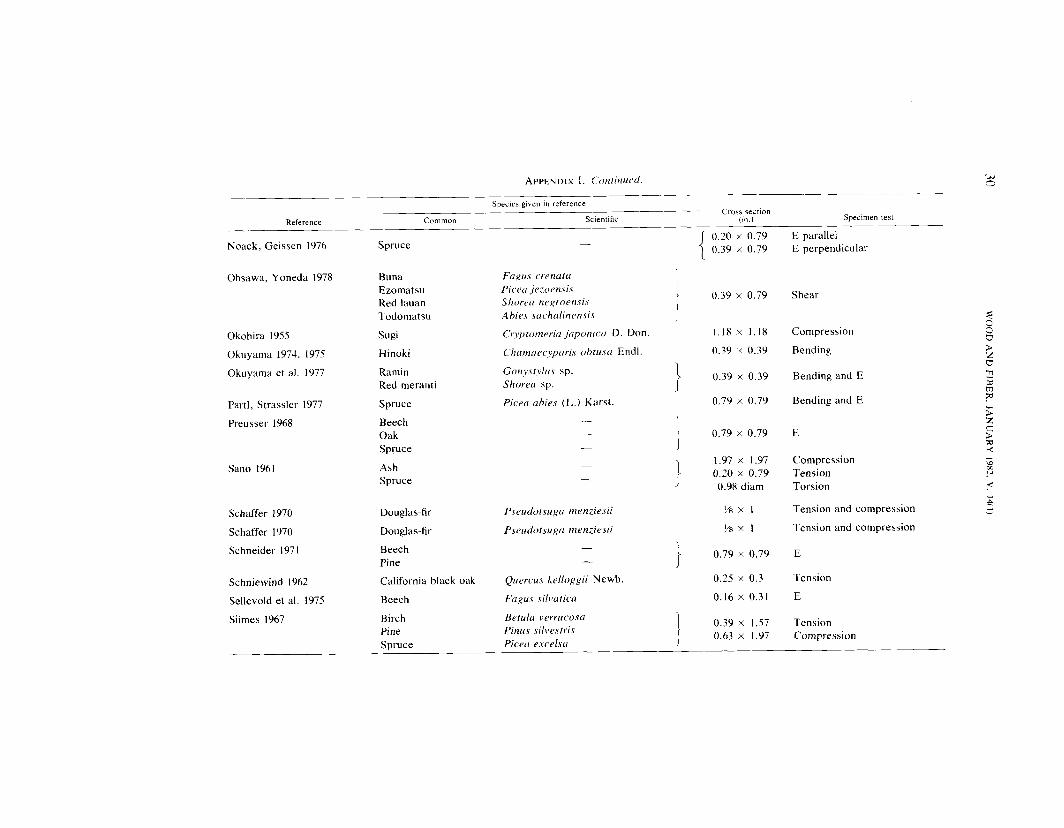
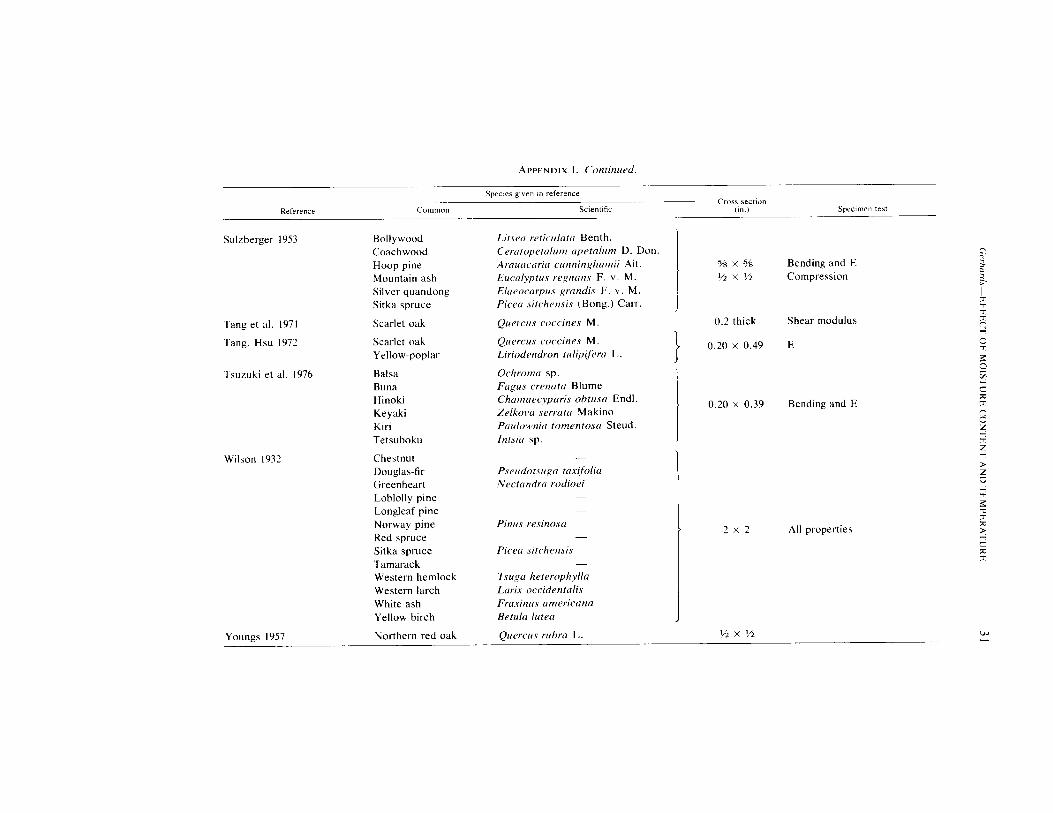
A P P ~ N D I X I . The /crhuln/ion in this crppendix lists the .spec,ic,s (common rrnd scientific) ncrtned in the rc:f'<fi.renced reports. The cros.s-.sectiontrl dimen.sion.s rrrc crl.,o .sho~~.ti. - indic,crrr cr 1nc.h ([f'in.f;)rtntrfion.
S p e c ~ e \ name given In reference C r o s ~ section
Reference Common Scientific (in.) Specimen te\t
Bernier, Kline 1968 Birch - 0.25 diam E
Balsa Douglas-fir Sitka spruce
% x % Bending and E 1 x 2 Compression
Byvshykh 1959 Pine - - Tension
Drow 1945
Ellwood 1954
Goulet 1960
Ash Balsa Douglas-fir
Douglas-fir Sitka spruce
Beech
Beech Oak Spruce
Greenhill 1936 Beech
Ishida 1954 Jezo-spruce
James 1961 Douglas-fir
James 1964 Douglas-fir
Kadita e t al. 1961 Bung Hinoki
Kitahara, Matsumoto 1974 Todomatsu
Fugrcs .silvrrticcr L. Quc~rcus sp. Piceu excelsci Link
Fugus grrrndifolirr
Piceu glehni Mast.
Fugus orenutu Blume Chumaecypuris ohtusn End
A hies sachulinensi.~ Mast.
1 0.79 x 0.79 Bending and compression j 0.10 x 0.25 Tension
- Bending and shear } 1 x 1 Compression
% x % Tension % x I / Z Compression
Tension
Tension and E
E Compression
E
Bending and compression

Species given In reference Cros5 section
Common Scientific ( ~ n . ) Specimen test Reference
Kitahara, Suematsu 1955 Buna Faxu .~ crenuta 91. Hinoki Chumaecjparir ohlvra Sieb. et Zucc. I l .I8 x 1.18 Compression and E Red lauan - Sugi Cryptomeria juponicu D. Don
I Knudson 1973 Douglas-fir Pseudotsuga menziesii (Mirb.) Franco ' I l6 x '116 Tension, compression, and E
Knudson, Schniewind 1975 Douglas-fir Pseudotsuga menziesii (Mirb.) Franco '/,ti x '116 Tension, compression, and E
Kollmann 1940 Balsa Beech Spruce
Kollmann 1952 Pine
Kollmann 1956 Pine
Kollmann 1960
Kufner 1978
Kunesh 1968
Oak Spruce
Beech Bongossi Douglasie Fir Oak Poplar Zapatero
Douglas-fir Western hemlock
Leont'ev 1960 Alder Ash Aspen
1 0.79 x 0.79 Compression I
- Tension 0.28 x 0.39 Tension parallel 0.79 diam Tension perpendicular
I 0.16 x 0.79 Tension
I x I, 2 x 2 , Compression and E Pseudorsuga menziesii (Mirb.) Franco
4 x 4, and Tslrga hererophylla (Raf.) Sarg.
6 x 6

Gerhards-EFFECT OF MOISTURE CONTENT A N D 'TEMPERATURE
Specles given In reference Crorr sectlon
~ ~ f ~ r e n ~ ~ Common Sc~entllic (in.) Speclmen test
0.20 x 0.79 E parallel 0.39 x 0.79 E perpendicular Noack, Geissen 1976 Spruce -
Ohsawa, Yoneda 1978 Buna Ezomatsu Red lauan Todomatsu
Faglrs crenatil Picecr jezoensis Shoren negroensis Ahies .scrchnlinensi.s
Cryptomrriu .jcrponicu D. Don.
Chamn~c;prrris ohtusc~ Endl.
Gonystylus sp. Shorrtr sp.
Picea uhies (L. ) Karst.
0.39 x 0.79 Shear
I . 18 x 1.18 Compression
0.39 x 0.39 Bending Sugi Okohira 1955
Okuyama 1974, 1975
Okuyama et al. 1977
Hinoki
Ramin Red meranti
0.39 x 0.39 Bending and E
0.79 x 0.79 Bending and E Partl, Strassler 1977
Preusser 1968
Spruce
Beech Oak Spruce
1.97 x 1.97 compression 0.20 x 0.79 Tension 0.98 diam Torsion
Sano 1961 Ash Spruce
% x I Tension and compression
% x I Tension and compression
0.79 x 0.79 E
Schaffer 1970
Schaffer 1970
Schneider 1971
Pseudorsugc~ menziesii
Beech Pine
California black oak Quercus kelloggii Newb. 0.25 x 0.3 Tension
0.16 x 0.31 E Schniewind 1962
Sellevold et al. 1975
Siimes 1967
Beech
Brtula verrucosa Pinus si1ve.stri.s Picrci e.vcelsa
Birch Pine Spruce
0.39 x 1.57 Tension 0.63 x 1.97 Compression
S p e c ~ e s glven in reference Croz? \ection
Reference Common Sc~entific (in.) S p e c m e n fezt
Tang et al. 1971
Tang. Hsu 1972
Tsuzuki et al. 1976
Wilson 1932
Sulzberger 1953 Bollywood Coachwood Hoop pine Mountain ash Silver quandong Sitka spruce
Scarlet oak
Scarlet oak Yellow-poplar
Balsa Buna Hinoki Keyaki Kiri Tetsuboku
Chestnut Douglas-fir Greenheart Loblolly pine Longleaf pine Norway pine Red spruce Sitka spruce Tamarack Western hemlock Western larch White ash Yellow birch
Litsecr reticulartr Benth. Cerutopetalum apetalum D. Don. Arrruacaria cunninghumii Ait. Euculyptris regnrrns F. v. M . Elueocarpris grandis F . v . M . Picc~a sitchetlsi.c. (Bong.) Carr.
Quercus coccines M
Quercus coccines M . Liriodendran trilipifrrn L .
Ochroma sp. Fagus crenutu Blume Chumciecyparis o h t u s ~ Endl Zelko~,cr .rerratcr Makino Puulownitr romentosrr Steud. Intsicr sp.
Pser~dot.tugri tcrxif'olirr Nectrrndrrr rodioei
Piceu sitchensis -
l suga heterophylla Lariv occidentcrlis Fruxinus americana Betulrr lutea
5/s x Bending and E % X % Compression
0.2 thick Shear modulus
Youngs 1957 Northern red oak Quercus rubra L. w -

3:! WOOD AND FIBER, JANUARY 1982, V . 14(1)
APPENDIX 11
The following discussion of each reference used in this report is intended to give the reader a brief overview of the research scope and the methods of analyses required to fit the data into a common format for summary in this report. The data in each report were used to determine a base value which was then used as a divider of the reported data, either as averages or regressions, so that data from all1 reports could be summarized on a relative basis. For moisture content (MC) effects at room temperature (typically 20 C), base values were estimated at 12% MC. For temperature effects, base values were determined at 20 C at various moisture conditions (0 and 12% and wet, for example).
No judgments are made of the quality of research for any given reference. While some research may have been better or worse than others on the basis of number and selection of specimens, accuracy and sensitivity in MC and temperature, or data analysis, quality cannot be rated because the reporting of experimental detail is frequently inadequate. A study reporting experimental behavior of a single specimen may be grossly inadequate to establish a species effect, but it may be important in establishing a trend-for example, that E is nonlinearly related to temperature. Another study reporting results for many species may clearly show that temperature has a significant effect, but it may not adequately support a significance test of a species interaction.
Bernier and Kline (1968) determined the transverse dynamic modulus of elasticity (E) for one specimen at 6% MC as temperature was increased from -183 to 202 C at a rate of about 1 C per minute. Modulus of elasticity was again determined on the specimen as a function of temperature after the specimen was oven-dried. Only their graph for the oven-dry condition was used for this report, as Bernier and Kline's report did not indicate that the 6% condition was maintained over the whole temperature range. For this report the graph for the oven-dry condition was used to determine a base value at 20 C.
Boller (1954) evaluated modulus of rupture, E, and stress at the proportional limit in compression perpendicular-to-the-grain at -56.7 and - 184.4 C. His results were shown as linear relations from room temperature down to - 184.4 C. For this report base values at 20 C were determined from the h e a r relationships.
Byvshykh (1959) evaluated tension perpendicular-to-the-grain for strength and elasticity at 50, 60, . . . , 100 C and MC's of 6 , 12, 18, and 24%. For this report his linear relations between temperature arnd strength or E were extrapolated to furnish base values at 20 C.
Comben (1964) evaluated effects of temperature at 17, 0, -73. and - 183 C on compressive strength and tensile strength (none at 0) parallel-to-the-grain and modulus of rupture and E in bending. Moisture conditions included 11-12% for all three species, and 18% for one species, 20% for another, and green for the third. Comben presented his averaged data in the form of graphs. For this report, values read from the graphs at 17 C were used as base values.
Drow (1945) tested modulus of rupture and E in bending, compressive strength parallel-to-the-grain, and shear strength parallel-to-the-grain at various MC's between 7 and 18%. Results were presented ;as linear relations between the logarithm of the mechanical property and MC. For this report the slopes of the linear relations determined from Drow's graphs were used to directly determine relative values.
Ellwood (1954) used five temperatures (26.7, 37.8,48.9,60, and 7 I . l C) and four moisture conditions ( 6 , 12. and 18%, and green) to evaluate effects on strength in tension and compression perpendicular- to-the-grain. He presented both graphs and regression equations relating maximum tensile strength, stress at the proportional limit in compression, and E in tension or compression to temperature at each condition. After Ellwood's equations were used to determine extrapolated values at 20 C, his equations were divided by the respective extrapolated values to obtain relative values for this report.
Goulet (1960) studied the effect of MC over the hygroscopic range of about 2 to 30970 at 20 C and the effects of temperature from 2 to 93.5 C at MC's of 3.5 and 15.7% and >FSP on tensile strength perpendicular-to-the-grain in both radial and tangential directions. From Goulet's moisture-effect curves, values at 12% MC were interpolated to use as the base for adjusting those curves to a relative basis for this report. Similarly, from his temperature-effect curves, values at 20 C at each moisture level were used as the bases in this report to adjust his temperature-effect curves.
Greenhill (1936) evaluated strength and E in tension perpendicular-to-the-grain at various temper- atures and MC's. Actual temperatures from 23.3 to 82.8 C were close to the four target test temper- atures of 26.7, 48.9, 71.1, and 82.2. While deviations of MC were very small for any one temperature- moisture test level. actual MC's from 4% to >FSP varied substantially across temperature levels, complicating analysis of temperature-moisture effects. For this report Greenhill's average mechanical

Gerhurd.\-EFFECT OF MOISTURE CONTENT A N D TEMPERATURE 33
property values for each temperature level were fit by the simple linear regression, Y = a + b(MC) where Y = the logarithm of the mechanical property and MC = moisture content, using only the data for the hygroscopic moisture range. Those regressions were used to estimate property values at 6, 12, and 20%~ MC's for each temperature test level. Then for each of the three moisture levels (6, 12, and 18%). a simple linear regression was used to relate the mechanical property to temperature, from which an extrapolated value at 20 C was determined as the base for adjusting the regression to a relative basis.
Ishida ( 1954) evaluated effects of temperature and MC on compressive strength parallel-to-the-grain and on E in bending. For compression Ishida used temperatures ranging from -20 to +60 C on wood at oven-dry, air-dry (-15% MC), -FSP (-25% MC) and green conditions. For E in bending, lshida used temperatures from -40 C to + 10 C on wood at oven-dry and air-dry conditions in two different experiments: one using the same specimens at each temperature, the other using different specimens at each temperature. Ishida represented the compression data by C = -2.07t + 914(10-0.0195M') where 12 = compressive strength, t = temperature, and MC = moisture content. For this report, that equa- tion was used to calculate a base value at 20 C and 12% MC to show the relative effect of MC and base values at 20 C and other MC's to show the relative effect of temperature. For wood >FSP, Ishida's average compression data for 2 0 C and above were linearly regressed on temperature to estimate a base strength at 20 C.
Because Ishida did not represent his E data by equation, his average E data were linearly regressed on temperature at each moisture condition to estimate a base E at.20 C for this report.
James (1961) determined E from longitudinal vibration and density measurements at various MC's ranging from -2 to 27% and at various temperatures ranging from - 17.8 to +93.3 C. At any one moisture level, his data averages were generally linearly related to temperature, but there did not appear to be much consistency in the average trends across MC. Consequently, for this report, only James' E data for 12.8% MC were used. Those data were linearly regressed against temperature to allow calculation of a base E at 20 C.
James (1964) conducted tests in static bending and compression parallel-to-the-grain at various MC's ranging from -2 to 27%. As James' report did not present the data in a form suitable for this report, his original data on file at the Forest Products Laboratory were used in the simple linear regression of logarithm of property on MC. The regressions were used to calculate an estimated base value at 12% MC.
Kadita et al. (1961) evaluated the effect of MC at 20 C on dynamic longitudinal E (similar to James [I961 I ) both parallel- and perpendicular-to-the-grajn. Graphs of the data were used to interpolate 12% MC base values for determining relative effects.
Kitahara and Matsumoto (1974) evaluated the effect of temperature on dynamic longitudinal E parallel-to-the-grain at five different moisture conditions ranging from 0 to 18%. Temperature ranged from -- 150 C to 0 or to +20 C for most moisture conditions and to about + 160 C for the oven-dry condition. The data plots at the different MC's suggest slight nonlinearity with temperature. For this report base values at 20 C were determined from the graphs by interpolation or extrapolation.
Kitahara and Suematsu (1955) evaluated the effects of temperature on compressive strength parallel- and perpendicular-to-the-grain, the latter at the proportional limit, and on E perpendicular-to-the- grain. Temperatures ranged from 10 to 50 C and moisture conditions were either oven-dry or air-dry (1 1-1792 MC, depending on species and temperature). The range in air-dry MC complicated analysis for this report. For each property, moisture condition, and species, the property average was linearly regressed on temperature to determine an estimate of the 20 C base value. For each species and property, logarithms of the estimated 20 C base values were linearly regressed on MC to allow calculation of a 12% MC base value.
Knudson (1973) and Knudson and Schniewind (1975) reported on results of tests to determi~e the effect of temperature on tensile and compressive strength and dynamic E parallel-to-the-grain. Spec- imens with cross sections :V,,j-inch square were conditioned to 12% MC and then heated to the desired temperatures for 5, 15, 30, or 60 minutes. Some specimens were tested at the heating temperature immediately after the heating period, while a like number were tested after reconditioning to about 12% at room temperature. Test temperatures ranged from 25 to 288 C. Thus, the experimental pro- cedure compounded temperature effects with MC and heating time effects. The averages reported for strength for each temperature level, either for testing at temperature or for testing after reconditioning to room temperature, ignored time as a variable, although some of Knudson's (1973) data indicated a time effect on strength at the higher temperatures. Knudson and Schniewind claimed that temper-

34 WOOD A N D FIBER, JANUARY 1982. V . 14(1)
ature and time had no significant effect on dynamic E, although the procedure used to determine E may have led to bias in the E results. Because average strength data were presented for both tests at temperature and after reconditioning, for this report the relative strength at a particular test tem- perature was divided by the relative strength after reconditioning at room temperature to remove the apparent permanent effect of heating. Because the authors presented the strength data in percent, the above adjustment for permanent effects resulted in data directly usable in this report.
K.ollmann (1940) evaluated oven-dry compressive strength parallel-to-the-grain for temperatures betlween - 190 and +200 C, other study phases covered temperatures from - 190 to f25 C for air-dry wood and evaluated the effect of freezing at -42 C on strength of wet wood for one species. For this report, base values at 20 C were determined from Kollmann's curves fit to his data.
K.ollmann (1952) also presented results from a study on the effect of temperatures from 10 to 100 C on tensile strength at 12% MC. For this study, a base value at 20 C was read from his temperature trend line.
K.ollmann (1956) presented data on the effect of MC over the hygroscopic range on tensile strength partallel- and perpendicular-to-the-grain. The parallel tests showed a maximum strength between 4 and 8%; the perpendicular showed a maximum at 0% MC. For this report, base values at 12% MC were read from Kollmann's curves fit to the data.
Kollmann (1960) presented linear regressions relating E parallel-to-the-grain for the oven-dry con- dition to temperature over the range -40 to +40 C. For this report the regressions were used to calculate base values at 20 C.
Kufner (1978) evaluated the effect of MC on tensile strength and E parallel-to-the-grain. Moisture contents covered the hygroscopic range. For this report, base values of strength and E at 12% MC were determined for each species from Kufner's curves fit to this data.
Kunesh (1968) presented average results on compressive strength at the proportional limit and E perpendicular-to-the-grain at 6 and 12% MC and in the green condition. His values at 12% were used directly as base values for this report.
Leont'ev ( 1960, 1962) summarized the effects of MC from 5 to 30% for many species and mechanical pro'perties (bending, tension, compression and shear parallel-to-the-grain, and tensile strength per- pej-~dicular-to-the-grain). Leont'ev claimed the model
where S = strength property, MC = moisture content, and
a, b, c = species constants
fit his data with only small deviations. For this study, Leont'ev's equations were used to calculate base values at 12% MC for each specieslproperty combination.
Mark et al. (1970) studied the effect of MC on the modulus of rigidity in the three principal planes of wood using the plate shear test. Their data were collected on specimens drying from the green condition to essentially 0% MC. For this report, trend lines were fitted by eye to their data plots to allow estimation of base values at 12%.
lMatejek and Starecka (1971) evaluated the effect of freezing and thawing water-saturated wood on compressive strength parallel to the grain. The frozen-thawed specimens along with controls were tested at room temperature after conditioning to various MC's from 0% to >FSP. For this report, the average control data were fitted in a regression of logarithm of strength vs. MC to determine an estimated base value at 12% MC. Although the freeze-thaw data were not used, they would have yielded about the same result as controls because there was very little effect of the freeze-thaw cycles on compressive strength.
IUoack and Geissen (1976) presented average test results for E both parallel- and perpendicular-to- the-grain for MC's from 5 to 28% and >FSP at temperatures from 0 to -40 C. From their linear ternperature regression data, base values were calculated at 20 C (a relatively large extrapolation) for use in this report.
Ohsawa and Yoneda (1978) evaluated the effect of temperature on the wet shear strength parallel- to-the-grain and, to a more limited extent, perpendicular-to-the-grain (rolling shear type). Tempera- tures ranged from 20 to 170 C for most variables and up to 190 C for one variable. Their data suggest a nonlinear temperature effect. Base values at 20 C were read from their data graphs for use in this report.

Gerhurds-EFFECT OF MOISTURE CONTENT AND TEMPERATURE 3 5
Okohira (1955) evaluated the effect of MC from 5% to >FSP on the compressive strength at the proportional limit. He fitted his data up to 30% MC with a simple linear regression of logarithm of strength on MC. For this report, Okohira's equation was used to calculate a base value at 12% MC.
Okuyama (1974, 1975) made two different evaluations of the effect of temperature on bending !strength of wood in the oven-dry condition. Both studies covered the temperature range from -50 to + 120 C. Three different bending rates of loading were used in the first study, and impact bending, nnstrumented to provide load-deflection data, was used in the second. For this study, linear regressions were fit to Okuyama's slowest rate of loading bending strength data, impact bending strength data, or E from impact tests to allow calculation of base values at 20 C.
Okuyama et al. (1977) evaluated the effect of temperature on perpendicular-to-the-grain bending strength and E in the wet condition. For this report, base values at 20 C were read from curves reported by the authors.
Partl and Strassler (1977) reported on static and impact bending tests at 0, 15, and 75% MC and temperatures of -30, +23, and +70 C. For this report, values of static and impact bending strength and static bending E at 23 C reported by the authors were used as base values.
Preusser (1968) presented data on E parallel-to-the-grain for temperatures between 20 and 255 C. His data were based on heating specimens for 1 h after conditioning to -12% MC. Thus the data were probably compounded with MC, as the higher temperatures would tend to oven-dry the wood. Preusser indicated a moderate linear temperature effect out to about 160-180 C and then a much greater temperature effect beyond 180 C. For this report, base values at 20 C were read from Preusser's curves.
Sano (1961) reported on a series of tests evaluating the effect of temperature on compressive, tensile, and torsion strengths parallel-to-the-grain. The range in temperatures evaluated fell between -60 and +70 C. The specimens were apparently at 13-15% MC. Sano presented linear regressions of all three strength properties and of E in compression on temperature. For this report Sano's regressions were used to calculate base values at 20 C.
Schaffer (1970, 1973) evaluated the effect of temperature on strength and E in both tension and compression parallel-to-the-grain. Temperatures ranged from 25 to 288 C. For this report base values at 25 C were read from Schaffer's curves fitted to his data.
Schneider (1971) presented average results for E by dynamic transverse tests at 0, 6, 12, 15, and MC after heating for up to 48 hours at temperatures between 100 and 150 C and for shorter times
up to 200 C. Except at the higher temperatures, there was no convincing evidence of a thermal- degradation effect on E. Consequently, Schneider's E values at 12% MC for each time-temperature combination were used as the base values for this report.
Schniewind (1962) evaluated the effect of MC at 6, 12, and 2% and >FSP on tensile strength perpendicular-to-the-grain. Schniewind's average values at 12% were used as base values for this report.
Sellevold et al. (1975) presented results of the effect of temperature on E parallel-to-the-grain at several levels of MC over the hygroscopic range and at 98% MC. Modulus of elasticity was determined from dynamic transverse measurements as specimens were slowly heated from about - 130 C to 1 2 5 C. MC changes were nomimal. Temperature effects were decidedly nonlinear, particularly for MC's >Iw. Their tabular results from 2 to 27% MC were linearly regressed with logarithm of E on MC to calculate a 12% MC base value for this report. However, they showed E as a function of temper- ature relative to E at 25 C at each MC evaluated, so those data were directly usable in this report.
Siimes (1967) considered several variables in his study of the effect of MC and temperature on perpendicular-to-grain strength and elasticity. Targeted MC's ranged from 4% to >FSP at tempera- tures of 20. 40, 60, or 80 C. Tensile strength and stress at the proportional limit in compression and E's from both types of tests were included in the evaluation. Siimes' data analysis was complicated by variation in specific gravity of test specimens and variation in MC between test temperatures. For this report, values of each mechanical property were determined from Siimes' property-specific grav- ity regressions for each temperature-moisture combination at the average specific gravity. Curves were fitted by eye to these data plotted against MC for each temperature and property to determine base values for this report.
Sulzberger (1953) evaluated the effects of temperature and MC on compressive strength parallel- to-the-grain, modulus of rupture, and E in bending. Test temperatures were -20, +20, and +hO C. Moisture conditions included 0, 8, 12, and 20% MC and >FSP in compression tests and 8, 12, and 2094 in bending tests. For this report, Sulzberger's linear graphs of property on temperature for each moisture condition were used to determine base values.

36 WOOD AND FIBER, JANUARY 1982, V . 1q1)
Tang et al. (1971) conducted a study of the effect on G of MC from green to near 0%. The study and the evaluation of the data were patterned after Mark et al. (1970).
Tang and Hsu (1972) presented individual test results of dynamic flexural E determinations on specimens at O% MC and as they gained moisture in stages to FSP. Intermediate measurements were made at about 7, 16, and 25% MC. For this report, the dynamic E data for the intermediate moisture conditions were regressed using logarithm E = a + b(MC) to determine an estimate of the base E at 12% MC for each specimen.
Tsuzuki et al. (1976) evaluated the effect of temperature from - 180 to +20 C on bending strength andl E of wood at 4% MC. From their linear regressions of bending strength or E on temperature, base values at 20 C were calculated for this report.
\Yilson (1932) summarized mechanical property-moisture relations usindl
where
S = mechanical property, MC = moisture content.
K = constant, and subscript p = intersection point or MC at which the hygroscopic property trend inter-
sects green property value.
Wilson's data included values of S,,, MC,,, and K for bending strength and E, compressive strength pal-allel-to-the-grain, compressive strength (proportional limit) perpendicular-to-the-grain, and shear strength parallel-to-the-grain. Wilson's data cover the moisture range from green to - 1-2% MC. His equations were used to evaluate base values at 12% MC for use in this report.
'Youngs (1957) evaluated the effects of MC and temperature on properties perpendicular-to-the- grain. His study included strength and E in both tension and compression (proportional limit) at 26.7, 54.4, and 82.2 C and at about 6, 12, and 18% MC and >FSP. Specimen orientations included 0". 45", and 90" to the growth rings in tension and 0" in compression. Youngs' complex experiment required complex analyses. His data on E in tension and compression at O" to the growth rings were about equal for any one combination of MC and temperature; consequently, for this report, the data for the two E's were combined in a linear regression with temperature for each moisture condition to allow estimation of a base value at 20 C (an extrapolation). A similar analysis was used for each strength property, treating each separately.