effect of industrial pol- lution on the distribution dynamics of
TRANSCRIPT
S T U K -A 1 6 8 A u g u s t 1 9 9 9
E f f e c t o f I n d u s t r i a l P o l -
l u t i o n o n t h e D i s t r i b u t i o n
D y n a m i c s o f R a d i o n u -
c l i d e s i n B o r e a l U n d e r -
s t o r e y E c o s y s t e m s
( E P O R A )
F i n a l r e p o r t
M.Suomela,1 R.Bergman2, K.Bunzl3, T.Jaakkola4, T. Ra-hola1, E.Steinnes5
__________________________________________________________________1) Radiation and Nuclear Safety Authority - STUK, Finland 2) National Defence Research Es-
tablishment, Sweden 3) National Research Center for Environmental and Health, Germany
4) University of Helsinki, Radiochemical Laboratory, Finland 5) Norwegian University of Sci-
ence and Technology
S T U K • S Ä T E I L Y T U R V A K E S K U S • S T R Å L S Ä K E R H E T S C E N T R A L E NR A D I A T I O N A N D N U C L E A R S A F E T Y A U T H O R I T Y
STUK-A168
18
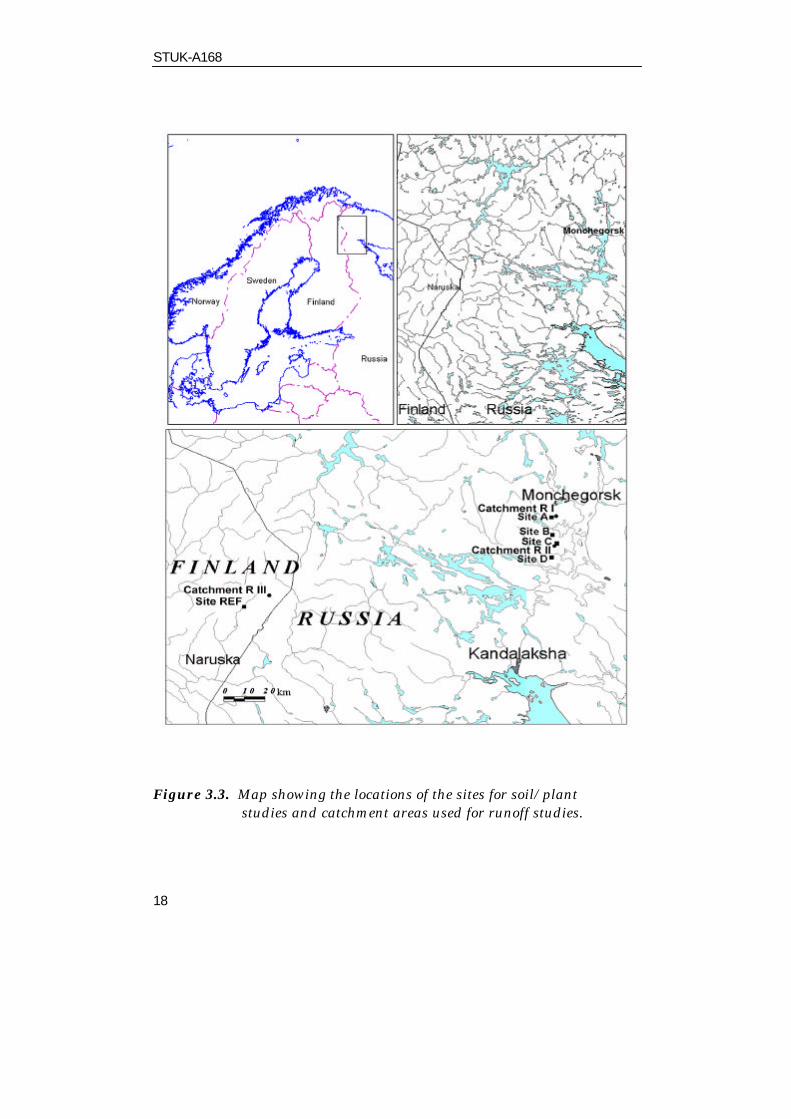
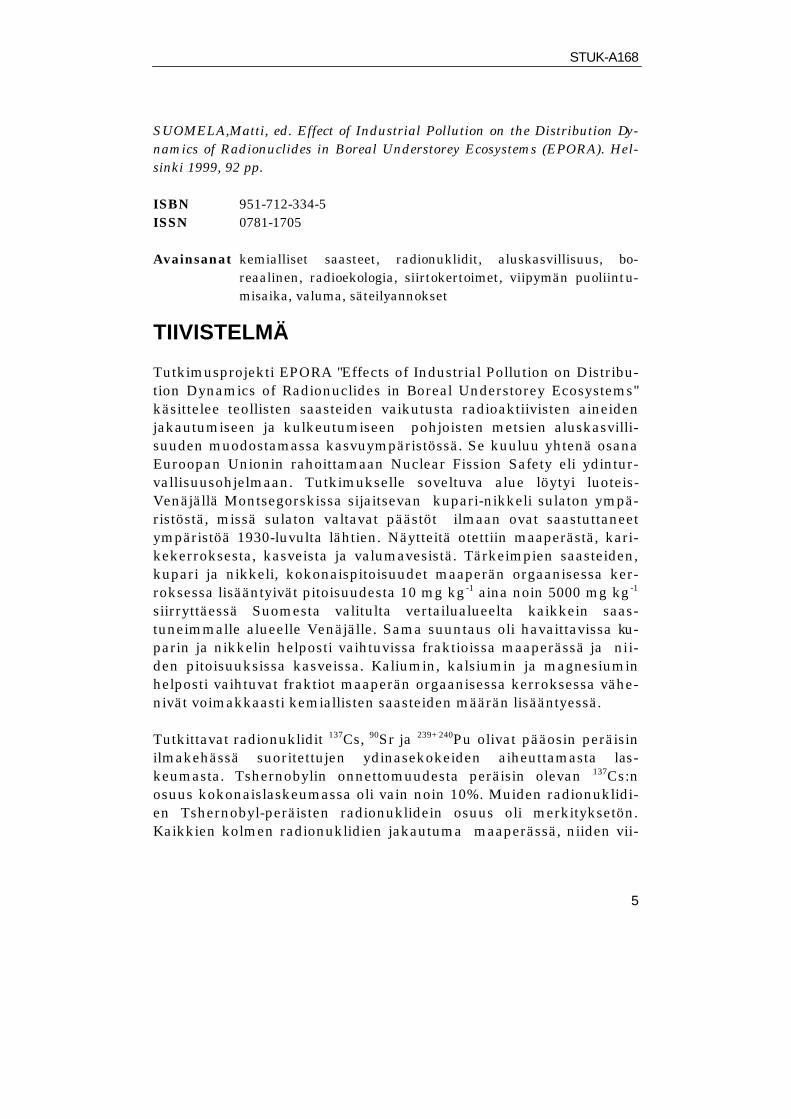
Figure 3.3. Map showing the locations of the sites for soil/plant studies and catchment areas used for runoff studies.

STUK-A168
19
sites were chosen in open areas in spruce forests (Piceetum fruticuloso-hylocomiosum) with an old tree stand (> 100 years).
Three catchment areas were chosen for the runoff studies. The distanceof the most polluted catchment area (RI) is about 7 km from the Mon-chegorsk smelter. The catchment area (RII) represents an intermediatelevel of pollution and is situated 21 km from Monchegorsk. The refer-ence area (RIII) for the catchment studies was selected at Naruska inFinland, about 137 km from Monchegorsk.
The geographical coordinates for the study areas are given in Table 3.1.A more detailed description of the study areas is given in the report Ra-hola et al. (1999).
Site descriptions
Quaternary deposits
The area, where the study sites are, is part of the glaciated terrain ofNorthern Europe. The lithology of the area is described by Rahola et al.(1999). The area was entirely covered by ice during the Pleistocene,which began 2 - 3 million years ago. The main quaternary deposit is till,which consists of an unsorted mixture of rock and mineral fragmentsfrom boulders to clay size, and the material in the till is mainly of localorigin. At the catchment area the quaternary overburden on the site isdominantly till with some outcrops and boulder fields. In the mapping ofKola Ecogeochemistry project (Reimann et al. 1998) the nearest sam-pling site is some kilometres to the south, and there in the soil profile inE- and B-layers is some organic material and the layers are loose. Thebottom part, parent material is till, stony and compact.
The predominant soils at the study area are podzolic Al-Fe soils.Podzolic Al-Fe-organic soils are characterised by high acidity and lowbase saturation. Organic horizons are the most acidic. In these horizonsthe cation exchange capacity is maximum.
At site A and catchment RI the overburden is meltout till, hummockymoraine. The area of the site is almost technogenic desert, almost all ofthe vegetation is destroyed and visible changes are found in drift, too.
The conclusions presented in the STUK report series are those of theauthors and do not necessarily represent the official position of STUK.
ISBN 951-712-334-5ISSN 0781-1705
Oy Edita Ab, Helsinki 1999
Sold by:STUK • Radiation and Nuclear Safety AuthorityP.O. Box 14 FIN-00881 HELSINKI FinlandTel. +358 9 759 881

STUK-A168
3
SUOMELA, Matti, ed. Effect of Industrial Pollution on the Distribution Dy-namics of Radionuclides in Boreal Understorey Ecosystems (EPORA). Hel-sinki 1999, 92 pp.
ISBN 951-712-334-5ISSN 0781-1705
Keywords chemical pollution, radionuclides, understorey, boreal, radio-ecology, transfer factors, residence half-times, runoff, radia-tion doses
ABSTRACT
The project EPORA ‘Effects of Industrial Pollution on Distribution Dy-namics of Radionuclides in Boreal Understorey Ecosystems’ is a part ofthe Nuclear Fission Safety Research programme of the European Union.A suitable environment for the study was found in the surroundings ofthe Cu-Ni smelter in Monchegorsk, in NW Russia where the huge at-mospheric emissions from the smelter have polluted the environmentsince the 1930's. Samples of soil, litter, plants and runoff water weretaken. Total concentrations of the main pollutants, Ni and Cu, in theorganic soil increased from about 10 mg kg-1 at the reference site in Fin-land to about 5000 mg kg-1 at the most polluted site in Russia. Similartrends were observed for exchangeable fractions and plant concentra-tions of the same elements. Concentrations of exchangeable K, Ca, andMg in the organic soil decreased strongly with increased input of chemi-cal pollutants.
The radionuclides studied were 137Cs, 90Sr and 239+240Pu, mainly originat-ing from the atmospheric nuclear weapons tests. The contribution of theChernobyl derived 137Cs deposition was about 10% but insignificant forthe other nuclides. The activity distribution of all three radionuclides inthe soil, their corresponding residence half-times as well as their aggre-gated transfer factors for various plants depended on the degree of pollu-tion:
• Activity distribution: in the litter layer, the activity of all three radio-nuclides increased continually from the reference site to the most pol-luted site. This effect was most pronounced for 239+240Pu and least for
STUK-A168
4
90Sr and could, at least partly, be explained by the increase of thethickness of this layer. In the root zone, the opposite effect was ob-served: the largest fraction of all radionuclides was found at the ref-erence site. In the organic layer, the exchangeable fractions of 137Cs,90Sr and 239+240Pu decreased with increasing pollution.
• Residence half-times: in the root zone, the residence half-times of 90Sr,but also of 137Cs and 239+240Pu became considerably shorter when ap-proaching the most polluted sites. Again, this effect was related to thethickness of the layer, which was significantly smaller at the mostpolluted site than at the other sites.
• Aggregated transfer factors: for two plant species, the aggregatedtransfer factors of 137Cs and 90Sr decreased with increasing chemicalpollution, for one species it increased. Obviously, the soil-to-planttransfer of all three radionuclides can be significantly modified by theindustrial pollution of the ecosystem, and these modifications areplant specific.
The studies of the transfer of 137Cs and 90Sr from the catchment soil tostreamwater by runoff showed that the concentrations of these radionu-clides depend more on the fraction of bogs in the catchment area than onthe amount of pollution.
The external dose rate of 137Cs as calculated from the depth profiles of itsactivity in the soil was approximately 1.5 nGy h-1 for all sites and did notdepend on the chemical pollution. Related to the total activity persquaremeter, the dose rate of Chernobyl-derived 137Cs was about 1.6times higher than that of 137Cs from global fallout, because the activityof Chernobyl-derived 137Cs was concentrated closer to the soil surfacethan that of 137Cs from the global fallout.
Summarising it can be concluded, that most of the radioecological quan-tities studied depended on the amount of pollution load at the varioussites, even though the effects were related to the type of soil/plant eco-system or soil/runoff water system. The methodology applied can also beused when investigating other polluted areas or evaluating the effi-ciency of restoration procedures applied to polluted areas.
STUK-A168
5
SUOMELA,Matti, ed. Effect of Industrial Pollution on the Distribution Dy-namics of Radionuclides in Boreal Understorey Ecosystems (EPORA). Hel-sinki 1999, 92 pp.
ISBN 951-712-334-5ISSN 0781-1705
Avainsanat kemialliset saasteet, radionuklidit, aluskasvillisuus, bo-reaalinen, radioekologia, siirtokertoimet, viipymän puoliintu-misaika, valuma, säteilyannokset
TIIVISTELMÄ
Tutkimusprojekti EPORA "Effects of Industrial Pollution on Distribu-tion Dynamics of Radionuclides in Boreal Understorey Ecosystems"käsittelee teollisten saasteiden vaikutusta radioaktiivisten aineidenjakautumiseen ja kulkeutumiseen pohjoisten metsien aluskasvilli-suuden muodostamassa kasvuympäristössä. Se kuuluu yhtenä osanaEuroopan Unionin rahoittamaan Nuclear Fission Safety eli ydintur-vallisuusohjelmaan. Tutkimukselle soveltuva alue löytyi luoteis-Venäjällä Montsegorskissa sijaitsevan kupari-nikkeli sulaton ympä-ristöstä, missä sulaton valtavat päästöt ilmaan ovat saastuttaneetympäristöä 1930-luvulta lähtien. Näytteitä otettiin maaperästä, kari-kekerroksesta, kasveista ja valumavesistä. Tärkeimpien saasteiden,kupari ja nikkeli, kokonaispitoisuudet maaperän orgaanisessa ker-roksessa lisääntyivät pitoisuudesta 10 mg kg-1 aina noin 5000 mg kg-1
siirryttäessä Suomesta valitulta vertailualueelta kaikkein saas-tuneimmalle alueelle Venäjälle. Sama suuntaus oli havaittavissa ku-parin ja nikkelin helposti vaihtuvissa fraktioissa maaperässä ja nii-den pitoisuuksissa kasveissa. Kaliumin, kalsiumin ja magnesiuminhelposti vaihtuvat fraktiot maaperän orgaanisessa kerroksessa vähe-nivät voimakkaasti kemiallisten saasteiden määrän lisääntyessä.
Tutkittavat radionuklidit 137Cs, 90Sr ja 239+240Pu olivat pääosin peräisinilmakehässä suoritettujen ydinasekokeiden aiheuttamasta las-keumasta. Tshernobylin onnettomuudesta peräisin olevan 137Cs:nosuus kokonaislaskeumassa oli vain noin 10%. Muiden radionuklidi-en Tshernobyl-peräisten radionuklidein osuus oli merkityksetön.Kaikkien kolmen radionuklidien jakautuma maaperässä, niiden vii-

STUK-A168
6
pymäpuoliintumisajat samoin kuin niiden kasvikohtaiset siirtoker-toimet riippuivat alueen saastumisen asteesta:§ Aktiivisuusjakautuma: Karikekerroksessa kaikkien kolmen ra-
dionuklidien pitoisuudet kohosivat siirryttäessä vertailualueeltakaikkein saastuneimmalle alueelle. Selvimmin muutos näkyi239+240Pu:n ja vähiten 90Sr:n pitoisuuksissa. Karikekerroksen pak-suuden lisääntyminen selittää ainakin osittain muutoksia. Päin-vastainen vaikutus oli nähtävissä maaperän juurikerroksessa, jos-sa suurimmat pitoisuudet löytyivät vertailualueelta. Orgaanisessakerroksessa 137Cs:n, 90Sr:n ja 239+240Pu:n helposti vaihtuvat osuudetkasvoivat saastumisasteen myötä.
§ Viipymän puoliintumisajat: Erityisesti 90Sr:n mutta myös 137Cs:n ja239+240Pu:n viipymän puoliintumisajat juurikerroksessa riippuivatsaasteiden määrästä ja lyhenivät huomattavasti siirryttäessä saas-tuneempia alueita kohti. Myös tässä tapauksessa muutos riippuikerroksen paksuudesta, joka kaikkein saastuneimmalla alueellaoli merkittävästi pienempi kuin muilla alueilla.
§ Siirtokertoimet: Kahden kasvin 137Cs:n ja 90Sr:n siirtokertoimetpienenivät ja yhden kasvoi kemiallisten saasteiden määrän lisään-tyessä. On ilmeistä, että teolliset saasteet voivat merkittävästimuuttaa kaikkien kolmen radionuklidin siirtymistä maasta kas-veihin ja että muutos on lajikohtainen.
Valuma-alueilla tehdyt 137Cs:n ja 90Sr:n siirtymistä maaperästä joki-veteen koskevat tutkimukset osoittivat, että kyseisten radionuklidienpitoisuudet jokivedessä riippuvat enemmän valuma-alueella oleviensoiden osuudesta kuin sillä olevien saasteiden määrästä.
Maaperän 137Cs:n syvyysjakautuman perusteella laskettu ulkoinensäteilyannosnopeus oli kaikilla alueilla noin 1,5 nGy h-1 eikä kemial-listen saasteiden määrä vaikuttanut sen suuruuteen. Kun annosnope-us lasketaan neliömetrillä olevan aktiivisuuden kokonaismäärän suh-teen, niin Tshernobyl-peräisen 137Cs:n aiheuttama annosnopeus oli 1,6kertaa suurempi kuin ydinasekokeista peräisin olevan 137Cs:n, koskaTshernobylin laskeumasta peräisin oleva 137Cs oli pääosin lähempänämaan pintaa kuin ydinasekokeiden laskeuman 137Cs.
Yhteenvetona voidaan todeta, että suurin osa tutkittujen radioekolo-gisten suureiden arvoista riippui alueella olevan saastekuormituksen
STUK-A168
7
määrästä, vaikkakin havaitut vaikutukset olivat ominaisia kullekinmaaperän ja kasvien muodostamalle eksosysteemille sekä kullekinmaaperä/valumavesialueelle. Tutkimuksessa sovellettua metodiikkaavoidaan käyttää myös tutkittaessa muita saastuneita alueita tai arvioi-taessa saastuneiden alueiden puhdistustoimien tehokkuutta.
CONTENTSpage
ABSTRACT 3
TIIVISTELMÄ 5
1. INTRODUCTION 9
2. OBJECTIVES 11
3. MATERIAL AND METHODS 14Climate 14Industrial pollution 14Radioactive pollution 15Selection of sites 16Site descriptions 19Sampling 24Analytical methods 26
4. RESULTS AND DISCUSSION 284.1. Distribution of nutrients and heavy metals in the soil/plant systemalong the pollution gradient 28
Properties related to the soil acidification status 29Heavy metals from the smelter 31Nutrient elements 34Stable cesium and strontium 35Sequential extractions 35Summary of main trends 35
4.2. Fallout radionuclides in the soil/plant system 36Distribution in the soil profiles and residence half-times 37
STUK-A168
8
Association of radionuclides with soil constituents 48Effect of pollution on the association of radionuclides with soilconstituents 52Concentration in plant species and transfer factors 55
4.3. Discharge of 90Sr and 137Cs via runoff from Boreal catchments 64Distribution in soil and estimated total deposition 64The activity distribution of 137Cs and 90Sr 64
5. MAIN ACHIEVEMENTS 73
6. CONCLUSIONS ON EFFECTS OF INDUSTRIAL POLLUTION ON THEDYNAMICS OF RADIONUCLIDES 76
7. PUBLICATIONS 84
8. REFERENCES 86
LIST OF PARTICIPANTS IN THE EPORA PROJECT 92

STUK-A168
9
1. INTRODUCTION
Finnish, Norwegian and Swedish Lapland as well as the Kola Peninsulain North-West Russia belong to the arctic and northern borealenvironment. Due to the climate and the soil properties of theseecosystems they are very sensitive to chemical pollutants, which maystrongly affect the behaviour of radionuclides and essential nutrients.
The huge copper-nickel smelters in the Kola Peninsula have since the1930's emitted enormous amounts of sulphur dioxide and heavy metalsinto the atmosphere. The effects of this airborne pollution on the localand regional scale have been extensively studied in recent years (e.g.Mäkinen 1994, Reimann et al. 1998, AMAP 1997). However, thepossible impact of this chemical pollution on the turnover of artificialradionuclides present in these ecosystems has not been studied so far.The present project was therefore initiated to study the extent to whichindustrial pollution from these smelters affect the migration of keyradionuclides in soil and their transfer from soil to plants and runoffwater. The test areas for this study were selected along a decreasingpollution gradient to the south from the Monchegorsk Cu-Ni smelter inthe Kola Peninsula. The annual emissions of this smelter were about100 000 tons SO2, 1600 tons Ni, 900 tons Cu and 80 tons Co in 1995(Reimann et al. 1998). The reference areas were chosen in FinnishLapland where the airborne pollution is very low compared to that in thetest area.
The radioactive fallout in Northern Fenno-Scandia and in the Kola Pen-insula originates mainly from the atmospheric nuclear weapons testsand to a minor extent of man-made radionuclides from other sources(STUK-A54, Saxén et al. 1987). However, the existence of nuclear powerplants, stored liquid and solid nuclear waste, nuclear powered vesselsand submarines as well as a nonspecified number of nuclear weapons inthe Kola region enhance the risk of further radioactive pollution.
The radionuclides selected for investigation were the long-lived 137Cs,90Sr and 239+240Pu. The aim of the study was to analyse to what extentthe industrial pollution affects the dynamics of radionuclides in soil,transfer from soil to plants and runoff waters and influence radiationdoses. After a potential accident at a nuclear facility where great

STUK-A168
10
amounts of radionuclides would be released into the vulnerable arcticenvironment, knowledge on the effect of pollutants on dynamics of theseradionuclides and thus also on radiation risks is crucial.
STUK-A168
11
2. OBJECTIVES
The general objective of the project was to study the effects of chemicalpollution on the distribution and transfer of radionuclides in thenorthern boreal ecosystems. To reach the aims of the study the followingobjectives were set:
I General characterisation and selection of study areaincluding sampling programmes
For this purpose the following task were to be performed:
a) assessment of the current information on industrial pollutionand radioactive fallout on the study areas in Northern Finlandand in the Kola Peninsula.
b) selection of study sites based on the background information.The reference sites were selected in Finnish Lapland in areaswhich were not polluted significantly more than what constitutesthe general levels in the selected environments. The pollutedsites were selected in surroundings of the Cu-Ni smelter inMonchegorsk, in the Kola Peninsula so that they representdifferent stages of damage caused by the pollution from thesmelter.
c) definition and experimental protocols includingstandardisation, planning the sampling programmes and fieldexpeditions.
II Determination of ecological effects of chemical pollutants in the study areas
The studies of the chemical pollution at the selected sites givebasic information needed for analysis of the effects of industrialpollution on the distribution dynamics of radionuclides. For thispurpose the following items were to be studied:
STUK-A168
12
a) the atmospheric pollution load by analysing composition andamounts of chemical pollutants, especially the level ofacidification and the concentrations of heavy metals (Cu, Nietc.) in different soil layers and the association of heavymetals to different soil constituents.
b) the effect of pollution on the chemical properties of soil (e.g.pH, exchangeable cations, base cations, nutrients).
c) plant uptake of heavy metals (Cu, Ni) and nutrients (Ca, Mg,K etc).
III Effects of chemical pollution on the distribution dynamicsof the radionuclides 137Cs, 90Sr and 239+240Pu in soil andplants
For determination of the effects of chemical pollution on thedistribution and dynamics of radionuclides soil and plant samplesfrom the five plots at each of the five sites were analysed for:
a) concentration of deposited radionuclides 137Cs, 90Sr and239+240Pu in litter, organic, eluvial and illuvial layers..
b) association of the radionuclides 137Cs, 90Sr and 239+240Pu indifferent soil constituents, especially in organic layers bysequential extraction.
c) residence half-times of the radionuclides 137Cs, 90Sr and239+240Pu in different soil layers.
d) concentrations of the radionuclides 137Cs, 90Sr and 239+240Pu inplants and their transfer from soil to plants
STUK-A168
13
IV Effects of industrial pollution on losses of theradionuclides 137Cs and 90Sr from the catchment areas
To estimate the losses the following items in the three catchmentareas were to be studied:
a) concentration of the radionuclides 137Cs and 90Sr in organicand mineral soil and in streamwater.
b) characteristics of the catchment area (size, areal distributionof different soil types, biotopes etc.) for analysing parametersaffecting the runoff.
V Conclusions on the effects of pollution on the distributionand dynamics of the studied radionuclides in the borealenvironment.
As a summary of the whole study the following items were to beconsidered and discussed:
a) amount and composition of industrial pollution at the studysites and the effects of the industrial pollution on thecontamination of soil and vegetation by the radionuclides.
b) effects of the industrial pollution on the residence half-times ofthe radionuclides in different soil layers.
c) effects on the industrial pollution on the losses ofradionuclides from catchment areas by runoff.
d) effects of the industrial pollution on the external dose ratefrom the 137Cs deposition.
e) estimation of the applicability of the methodology to otherpolluted areas and restoration of contaminated areas.
STUK-A168
14
3. MATERIAL AND METHODS
Climate
Nearly all of the Kola Peninsula as well as Finnish Lapland belongs tothe cool temperature zone where the mean annual temperature variesbetween – 1oC and + 1 oC. The air temperature is characterised by sharpseasonal variations. The temperature may drop below zero also duringall months and the thermal growing season (day mean temperature ishigher than + 5 oC) is short, only about 120 days. In the northern taigasub-zone the total amount of precipitation is 450 - 500 mm throughoutthe year. The precipitation is highest in the summer and autumn period.The monthly rainfall in Monchegorsk varies from less than 20 mm inMarch to almost 70 mm in August. The duration of snow fall period is 6 -6.5 months (from the middle of October to the end of May).
In winter the soil is frozen to the depth of 50 - 100 cm which character-ises the podzolic sandy soil that prevails in coniferous forests in the KolaPeninsula. This results from mild winters and thick snow cover (60 - 100cm). In the growing period the ”active” temperatures (higher than + 10oC) are observed from the end of June -middle of July to the beginning orend of August, that is, the duration of the period of ”active” temperaturesis 1 - 1.5 months. In relatively cold years the ”active” temperatures havebeen found only in the organic horizon (thickness of layer up to 10 cm).In moderate or relatively warm years (air temperature) the ”active”temperatures can be observed significantly deeper (15 - 20 cm and 40 -50 cm respectively). The same climatic pattern can be seen in Finland.According to Reimann et al. (1998) winds from the south and south-westdominate in the Kola Peninsula during winter. During summer the winddirections are from east to west. In Finland with a rather flat topogra-phy the wind directions are almost the same in winter and summerwithout any dominant wind direction.
Industrial pollution

STUK-A168
15
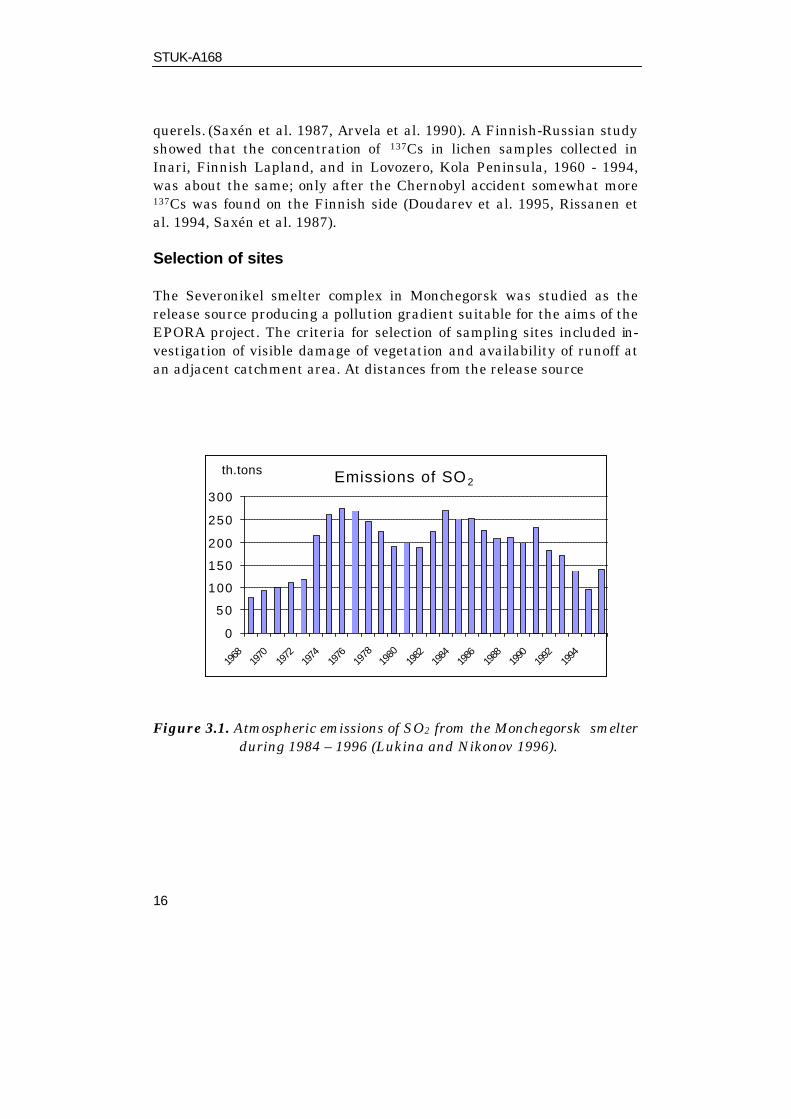
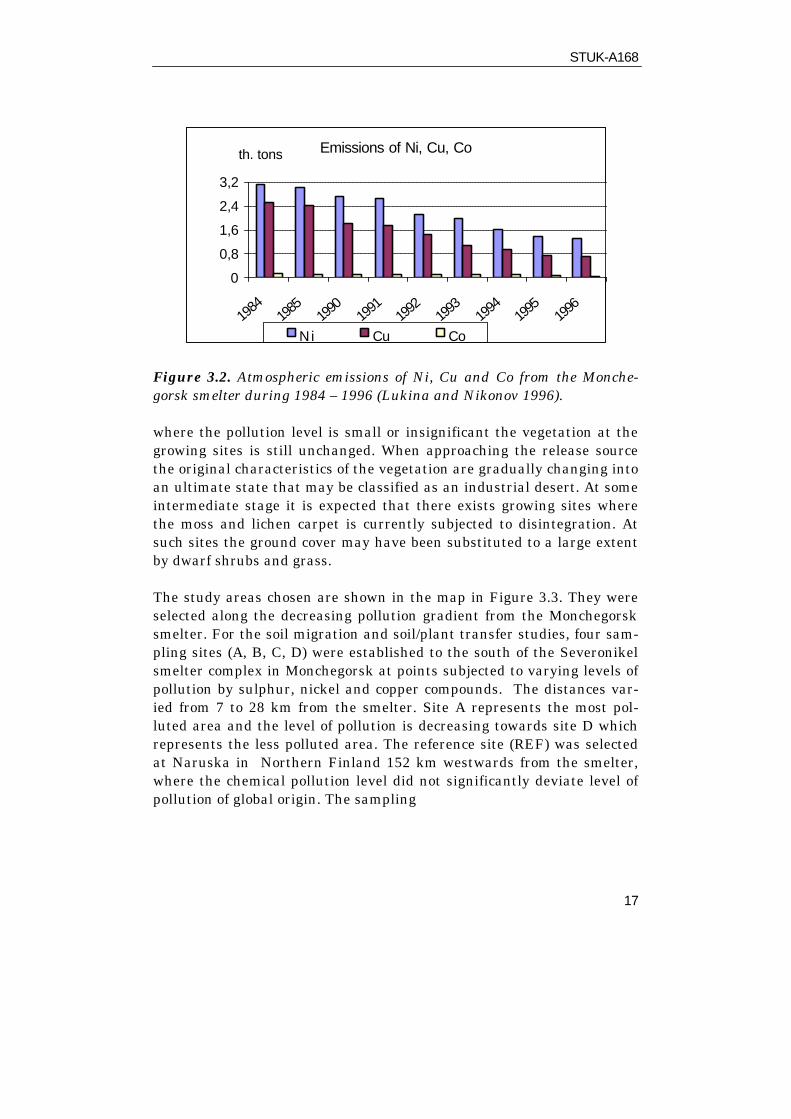
There are four important sources for chemical pollution: mining, energy,ore related industrial production and traffic. In the Kola Peninsula themain sources of pollution are the Cu-Ni smelters Severonikel at Mon-chegorsk and Pechenganikel at Nikel. The smelter at Nikel was built in1932 and an even bigger one in Monchegorsk in1938. Since 1972 orefrom Norilsk in Siberia was shipped via Murmansk to the smelters inthe Kola Peninsula. Regarding SO2 and heavy metal pollution the emis-sions from Nikel, Zapoljarnyij and Monchegorsk smelters place thesesources amongst the largest world-wide. Figure 3.1 shows the variationof the emissions of SO2, and Figure 3.2 changes in Cu, Ni and Co emis-sions in 1988 – 1996 (Lukina and Nikonov 1996). The ore from Norilskcontained more sulphur than the local ore, which resulted in increasingSO2 emission after 1972. During last years the emission show a decreas-ing trend. In the area this study, most of the Ni and Cu originates fromthe smelter at Monchegorsk.
Radioactive pollution
There are two main sources for radioactive contamination, the atmos-pheric nuclear weapons tests in the 1950’s and 1960’s and the Chernobylaccident in 1986. The possible releases from other nuclear facilities areof minor importance. The long-lived radionuclide 137Cs, 90Sr and239+240Pu are the most important when considering the long-term risksfrom internal radiation. In the case of external radiation the main con-tributor among the gamma emitting nuclides is 137Cs. The radionuclidedeposition originating in the nuclear weapons tests was rather evenlydistributed in contrast to the deposition from Chernobyl. The accumu-lated deposition of 137Cs before the end of 1985 was in Finland 1 800, of90Sr 1 100 and of 239+240Pu 60 Bq m-2, respectively (STUK-A54, Hardy etal. 1973). The fallout from Chernobyl was areally unevenly deposited.The mean surface 137Cs activity was 10 700 Bq m-2 on October 1, 1986 asmean for the whole Finland, but in northern Lapland only 1 000 to 2000 Bq m-2.
In all of Finland including Lapland the 90Sr deposition from Chernobylwas much smaller only a few percent of that of 137Cs and also small com-pared to the earlier deposition from the nuclear weapons tests. The239+240Pu fallout follows the same patchy deposition pattern and was verylow. The estimated range in Lapland varies from zero to a few bec-
STUK-A168
16
querels. (Saxén et al. 1987, Arvela et al. 1990). A Finnish-Russian studyshowed that the concentration of 137Cs in lichen samples collected inInari, Finnish Lapland, and in Lovozero, Kola Peninsula, 1960 - 1994,was about the same; only after the Chernobyl accident somewhat more137Cs was found on the Finnish side (Doudarev et al. 1995, Rissanen etal. 1994, Saxén et al. 1987).
Selection of sites
The Severonikel smelter complex in Monchegorsk was studied as therelease source producing a pollution gradient suitable for the aims of theEPORA project. The criteria for selection of sampling sites included in-vestigation of visible damage of vegetation and availability of runoff atan adjacent catchment area. At distances from the release source
Figure 3.1. Atmospheric emissions of SO2 from the Monchegorsk smelterduring 1984 – 1996 (Lukina and Nikonov 1996).
Emissions of SO 2
0
5 0
100
150
200
250
300
1968
1970
1972
1974
1976
1978
1980
1982
1984
1986
1988
1990
1992
1994
th.tons
STUK-A168
17
Figure 3.2. Atmospheric emissions of Ni, Cu and Co from the Monche-gorsk smelter during 1984 – 1996 (Lukina and Nikonov 1996).
where the pollution level is small or insignificant the vegetation at thegrowing sites is still unchanged. When approaching the release sourcethe original characteristics of the vegetation are gradually changing intoan ultimate state that may be classified as an industrial desert. At someintermediate stage it is expected that there exists growing sites wherethe moss and lichen carpet is currently subjected to disintegration. Atsuch sites the ground cover may have been substituted to a large extentby dwarf shrubs and grass.
The study areas chosen are shown in the map in Figure 3.3. They wereselected along the decreasing pollution gradient from the Monchegorsksmelter. For the soil migration and soil/plant transfer studies, four sam-pling sites (A, B, C, D) were established to the south of the Severonikelsmelter complex in Monchegorsk at points subjected to varying levels ofpollution by sulphur, nickel and copper compounds. The distances var-ied from 7 to 28 km from the smelter. Site A represents the most pol-luted area and the level of pollution is decreasing towards site D whichrepresents the less polluted area. The reference site (REF) was selectedat Naruska in Northern Finland 152 km westwards from the smelter,where the chemical pollution level did not significantly deviate level ofpollution of global origin. The sampling
Emissions of Ni, Cu, Co
0
0,8
1,6
2,4
3,2
1984
1985
1990
1991
1992
1993
1994
1995
1996
th. tons
Ni Cu Co

STUK-A168
20
Table 3.1. Location of soil/plant sites and catchment areas.
Samplesite
Sampling area and thename of the place
Latitude Longitude Distancefrom smelter
Russia Site A 67°51' 32°48' 7 km
Site B 67°46' 32°48' 16 km
Site C 67°44' 32°51' 21 km
Site D 67°40' 32°47' 28 km
Catchment RI 67°51' 32°50' 6 km
Catchment RII 67°43' 32°49' 21 km
Finland Reference site (REF) 67°26' 29°27' 152 km
Reference catchment RIII 67°29' 29°46' 137 km
The organic layer is almost totally absent and the samples of organiclayer are litter samples in practice. The E-layers, eluvial layers, are verythin, instead the B-layers, illuvial layers, are thick. The parent soil isyellowish green till.
The area of site B is also almost totally destroyed. The overburden isvery stony, the organic layer is thin and includes a lot of roots and ispoorly decomposed. The thickness of the E-layers is variable. The B-layers are thick, compact and partly cemented. The parent soil is greytill.
At site C and catchment RII the organic layer is thin, the thickness ofthe E-layers varies greatly and the B-layers are very stony. The parentsoil is grey till.
At site D the thickness of the organic layer varies in general from 3 to 4cm. Also the E-layers are very thick, from 4 to 10 cm, though the vari-
STUK-A168
21
ability is great. The thickness of B-layers is more than 10 cm. The par-ent soil is grey till.
At the reference site (REF) and catchment RIII, in Finland, the podzolprofile is well developed. The organic top layer is not well decomposed,whereas the lower parts represents the more decomposed organic mate-rial. The E layer is from 4 to 7 cm thick and the B-layer quite thick. Theparent soil material is brownish till.
Vegetation in soil/plant sites
According to the detailed descriptions done in 1930’s the pollution-transformed spruce forests in Monchegorsk were originally of thePiceetum fruticuloso - hylocomiosum type. In these forests mosses Hylo-comium splendens and Pleurosium schreberi were the dominant amongunderstorey species and Dicranum spp. were also found. The proportionof green mosses out of the total aboveground biomass was approximatelyequal to that of Empetrum nigrum, Vaccinium myrtillus and Vacciniumvitis-idaea taken together. Solitary specimens of Vaccinium uliginosum,Lycopodium annotinum, Cornus suecicum, Linnea borealis, Solidagolapponica, and of the lichens Nephroma arcticum, Cladina stellaris,Cladina mitis and Cladina rangiferina were found. In 1997 the forest inthe Naruska soil/plant reference site in Finland was still in this pristinestate.
It should be noted that the spatial distribution of biomass of the under-storey species in spruce forests is far from even. The trees regulate light,temperature, and hydrological and nutrient regimes in the forests. Theyalso regulate intensity of element fluxes, including pollutants and acidforming substances, in forest ecosystems.
On the basis of primary productivity parameters for four significantlydifferent degradation stages of the Piceetum fruticuloso - hylocomiosumsubjected to air pollution in the Kola Peninsula were identified: 1)Piceetum fruticulosum, 2) Piceetum graminoso-fruticulosum, 3) sparsePiceetum empetrosum, 4) industrial barrens. One of the four soil/plantsites in Monchegorsk presents the first stage of degradation - Piceetumfruticulosum (site D), two sampling sites (C, B) present the second stage
STUK-A168
22
of degradation - Piceetum graminoso-fruticulosum and sample site Apresents the third stage - sparse Piceetum empetrosum.
At site D, the spatial distribution of ground vegetation is much moreheterogeneous than in the reference area. This heterogeneity resultsfrom lack of green mosses and from the beginning of colonisation of theforest hair grass (Deschampsia flexuosa) and crowberry (Empetrum nig-rum). The important reason is also that the state of trees, which are re-sponsible for distribution of understorey species, is very different: fromdefoliating (with different extent of defoliation and crown thinning) todead.
At sample sites C and B the total biomass of ground vegetation is lowerthan in the reference area but significantly higher than at site D. Themain reason is an increase in biomass of crowberry and hair grass.Crowberry formed individual microgoups on fallen trees and stumps.Hair grass also formed microgroups.
Sampling site A represents the third stage of spruce forest degradation -sparse Piceetum empetrosum. In this stage the area not covered by vege-tation, so called industrial barrens, is increasing. The major part of thearea is occupied by crowberry. Hair grass formed individual micro-groups. The biomass of crowberry and hair grass reached maximal val-ues as also the amount of litter.
Catchment areas
Catchment area RI is the most affected area close (7 km) to Monche-gorsk. The area appears to have been of the North Taiga type with amixed spruce and pine forest before the occurrence of the drastic changesin the biotope during the last decades, as a consequence of the airbornereleases from the nearby Monchegorsk smelters. The pollution effectsare now very severe and the present state may be classified as a techno-genic desert. Old trees are lacking. The stumps indicate that tree fellinghas occurred. There are also traces of forest fire. The loss of living un-derstorey carpet has led to considerable erosion of the organic layer,probably mainly mediated by wind. In several places organic materialwas no longer present. At other spots organic material had accumulatedto considerable thickness.
STUK-A168
23
The stream runs approximately from NW to SE and ultimately dis-charges into Lake Imandra. It runs in a ravine 5 - 10 m deep and 100 mwide, somewhat meandering. Banks are steep and soft. Debris and or-ganic material have accumulated in the ravine, which was overgrown bybushes, grass and sedge. Tussocks of sedge are present along the stream.
Catchment area RII was on the border of the ”Lapland natural park”,and was much less affected by acid fallout than catchment area RI. Theforest consisted of an aged, mixed forest (spruce, pine, birch) with nor-mal understorey vegetation including berries (blueberry, lingonberry,cloudberry) and mushrooms. The ground rises on both sides of thestream, more steeply to the east with the bedrock visible between thestream and the road bank. A road runs west from the main road M10into the natural park. It fords the stream and water samples were takenjust upstream of the ford.
The stream runs roughly from north to south, parallel to the M10 mainroad and about 500 m west of it. Below the ford the stream runs into apeat area, but upstream the terrain was less peaty with firm groundalong the stream and tussocks of sedge along it. 800 m upstream fromthe ford there was a ridge of rock across the stream, about 1-meter high,and above this ridge was a small circular swamp, which could not becrossed on foot.
The landscape on the Finnish side at catchment area RIII was hillierthan on the Russian sites, and not significantly affected by acid falloutfrom any regional sources. The stream is running from west to east. Onthe south side of the stream, up to the hill there has been extensive log-ging, and furrows have been plowed downhill. Spruce has been plantedalong the furrows but has not yet grown over 50 cm. This concerns alimited area adjacent to the water sampling position. Upstream (ca300m) of the water sampling position, a similar-but much older areaexists where soil preparation and spruce planting had occurred in anabout 100m wide band up along the hill on the south side. The numberof branch whorls on these pine plants indicated a tree age of about 30years. The forest consists of an aged, mixed forest with understoreyvegetation typical for a morainic site of intermediate productivity. Theground is very stony gravel with a thin organic cover.
STUK-A168
24
Sampling
Vegetation from the soil/plant sites
The sampling sites were chosen in open areas between the trees in atypical spruce forest. The 5 plots were chosen at the corners of an ap-proximately 10 m x10 m square with one plot in the middle of thesquare. The size of the sampling plots were 1 m x 1 m at the referencesite in Finland and 1 m x 1.5 m at sites A, B, C and D in Russia. Theaboveground vegetation was carefully cut using scissors and later sortedaccording to the different species. Then the litter layer above the organiclayer was quantitatively collected from the five plots at each site. Thequantitative sampling of all plants and litter was carried out June 25,1997 in Finland and August 12 - 15, 1997 in Russia. The plants chosenfor analyses in this study were crowberry (Empetrum nigrum), blueberry(Vaccinium myrtillus), lingonberry (Vaccinium vitis-idaea) and foresthair grass (Deschampsia flexuosa). The state of growth was not exactlythe same for these different sampling periods. Because of the late springthe Finnish vegetation was unusually delayed in June.
The amounts of the above mentioned plants growing on the plots wererather small. To enable the radiochemical analyses of the presumablyvery low concentrations of 90Sr and 239,240Pu, additional large volumesamples of the four species were collected around the quantitative sam-pling plots (marked as P-samples) during the sampling expeditions inFinland and Russia. An additional collection of P-samples was performedin August 1997 after the expedition in Russia. Blueberries and crowber-ries were also collected on all five sampling sites.
The vegetation and litter samples collected at the Finnish site weretransported in two days to STUK’s laboratory in Rovaniemi and storedin + 4 oC temperature. All the vegetation and litter samples collectedfrom Monchegorsk sites D and C and the vegetation bags from sites Band A were transported from Russia to Rovaniemi in a few days aftersampling and stored in + 4oC. The plastic bags containing the litter frac-tion from sites C and D had to be stored in Monchegorsk and were trans-ported to Rovaniemi late in December. Further details on sampling pro-cedures are given in (Rahola et al. 1999).
STUK-A168
25
Soil from the soil/plant sites
To carry out soil sampling, the plot area was divided into two parts. Thefirst one (two strips of about 25 cm x 100 cm at the peripheral of the plotarea at the reference site in Finland and 50 cm x 100 cm in the Russiansites A - D) was used to sample the organic layer, the second one (a 50cm x 100 cm area in the middle) was needed to collect the samples fromthe mineral horizons.
The organic layer was divided in pieces of about 25 cm x 25 cm using asharp spade and then carefully put down on a plastic film. Attachedmineral soil was scraped off from the organic layer using a knife. Afterthis procedure, the organic layer was divided into two parts (Of and Oh)by hand according to their natural constitution. The top layer (Of) con-sists of poorly decomposed material, fibric soil material, whereas thesecond layer (Oh, about 1.5 to 2 cm thick) represents the more decom-posed organic material (sapric soil material). Both layers can be wellseparated from each other because of a weak zone between them. Mostpart of the roots of the understorey vegetation was in the organic layer.
To sample the mineral horizons, the organic layer was removed withoutdestroying the first cm of the E-horizon. Samples were taken from a de-fined area (about 35 cm x 35 cm) inside the plot. The E-horizon was di-vided into two layers: The first 2 cm were collected separately, whereasthe second layer was taken according to there natural thickness down tothe B-horizon (about 2 - 5 cm). The same procedure was also carried outwith the B-horizon, but in contrast the first layer consists of 5 cm.
In conclusion, samples representing six different soil layers were col-lected: two (Of and Oh) from the organic layer, two (E1 and E2) from theE-horizon (eluvial) and two (B1 and B2) from the B-horizon (illuvial).Sampling and preconcentration of runoff water
It was necessary to take water samples of 200 litres from each of thethree catchment areas (RI, RII and RIII), since concentrations of 137Csand 90Sr are only of the order of 1 Bq m-3. To avoid transporting theselarge samples preconcentration of the radionuclides was necessary. InFinland the samples were preconcentrated on the sampling area but in
STUK-A168
26
Russia the water samples were taken to a laboratory in Monchegorsk.Two samples from the reference area RIII were also acidified and takento the laboratory for evaporation. Preconcentration was done by runningthe sample through a 400-ml column of the exchange medium by hydro-static pressure at a flow rate of 15 l/h. The water was not pretreated, but500 Bq of 85Sr was added to some samples for determination of recovery.For most samples clinoptilolite, a natural zeolite, was used, but twosamples from the reference area were preconcentrated with a stronglyacidic cation resin.
Sampling of soil from the catchment areas
The primary objective of the sampling of soil is to get an estimation ofthe mean level of 137Cs and 90Sr remaining in the catchment area andthe variability of the activity levels. For that purpose area defined sam-ples were taken of a) the whole organic layer from the area of 25 cm x 25cm and b) 15 cm of the underlying mineral soil from the area of 12.5 cmx 25 cm. From each runoff area ten sets of organic and mineral soil sam-ples were taken from the river banks, five on each side upstream of thewater sampling point within a distance of 2 km.
Analytical methods
Chemical pollution
The methods used for determination of chemical properties of soil, heavymetals (Ni, Cu), nutrients (Ca, Mg, K, Zn, Mn) and stable Sr were stan-dard methods. Speciation of heavy metals by sequential extractions isdone according to the same procedure (Bunzl et al. 1997), which wasused for radionuclides. The method is described more closely in the re-port by Thørring et al. (1999).Radionuclides
The measurement methods used for determination of 90Sr and 137Cs insoil, plant and water samples are described in two STUK reports (Ran-tavaara et al. 1993 and Ikäheimonen et al. 1995). The corresponding239+240Pu analyses were done according to the description in the publica-tion of Hakanen and Jaakkola (1977). For the studies of the chemical

STUK-A168
27
association of 90Sr, 137Cs and 239+240Pu the sequential extraction method(Tessier et al. 1979) as modified by Bunzl et al. (1997) was used.
The concentration of 137Cs in runoff water samples was determined bydirect gammaspectrometric measurement of the clinoptilolite, ion ex-changer or evaporation concentrate. Some measurements were verifiedby duplicate measurements. 90Sr was eluted from clinoptilolite with 4bed volumes of 2M ammonium chloride and from cation exchanger with8M nitric acid. Strontium was radiochemically separated from the eluateor evaporation concentrate. After ingrowth of 90Y the activity was de-termined by measuring the Cerenkov radiation with a low-level liquidscintillation counter.
Quality assurance
All participating partners work at well-established institutions withquality assurance programmes of their own. The quality assurance pro-grammes are specially created for each establishment. During the ex-perimental part of the EPORA project the quality assurance pro-grammes of the partners institutes will guarantee the quality.
The sampling methods were routine methods used in the participatinglaboratories, slightly modified to fit the EPORA project. Only themethod for treatment of the water samples was developed for this proj-ect. Also the analysis methods were well established in the organisationsof the partners. All methods have been intercompared in a number ofinternational intercomparison exercises. Since the same methods werenot used in all the laboratories intercomparison between partner labora-tories were done to a limited extent.
STUK-A168
28
4. RESULTS AND DISCUSSION
4.1. Distribution of nutrients and heavy metals in thesoil/plant system along the pollution gradient
Effects of pollutants from copper-nickel smelters on coniferous forestecosystems may be evident in several different ways:
- Direct effects of sulphur dioxide on the forest canopy.
- Toxic effects by heavy metals on soil microflora and sensitive plantspecies.
- Indirect effects of acidic deposition via soil acidification which mayhave several different effects on plant growth, the most important ofwhich presumably being displacement of nutrients on soil colloid sur-faces by cation exchange and subsequent loss by leaching.
- Indirect effects of heavy metals by cation exchange displacement ofnutrients.
The two first points were considered to be outside the scope of EPORA.In the chemical studies of soil and plant samples from the four sites (A-D) along the pollution gradient from the Monchegorsk smelter and thereference site (REF) the following groups of parameters were studied:
- Properties related to soil acidification: Soil pH (in H2O and CaCl2),cations exchangeable with 1M ammonium nitrate (K, Mg, Ca, Mn,Fe, Al, Cu, Ni), and exchangeable acidity. From these parameters thecation exchange capacity (CEC) and base saturation factor were cal-culated. Ammonium nitrate was selected because this extractant hasno buffer capacity in the pH range considered and hence the extrac-tion takes place near the natural soil pH.
- Parameters related to heavy metal pollution, limited to the majormetal contaminants copper and nickel. These were primarily nitricacid soluble concentrations in soil and total concentrations in planttissue (also after nitric acid digestion). Moreover the soil sampleswere subjected to sequential extractions according to the procedure
STUK-A168
29
by Bunzl et al. (1997) and Cu and Ni determined in the various frac-tions.
- Parameters related to plant nutrients: In addition to the above “base”cations (K, Mg, Ca and Mn), zinc was included. These nutrients weredetermined in plant tissue in addition to the ammonium nitrate ex-tract.
- In addition some investigations on the behaviour of stable Sr and Csin the soil/plant system were performed.
In the following selected examples of the results are shown, and the mostimportant conclusions regarding the changes in soil chemistry and plantconcentrations along the pollution gradient are summarised. A full ac-count of the data is given in the publication by Thørring et al. (1999).
Properties related to the soil acidification status
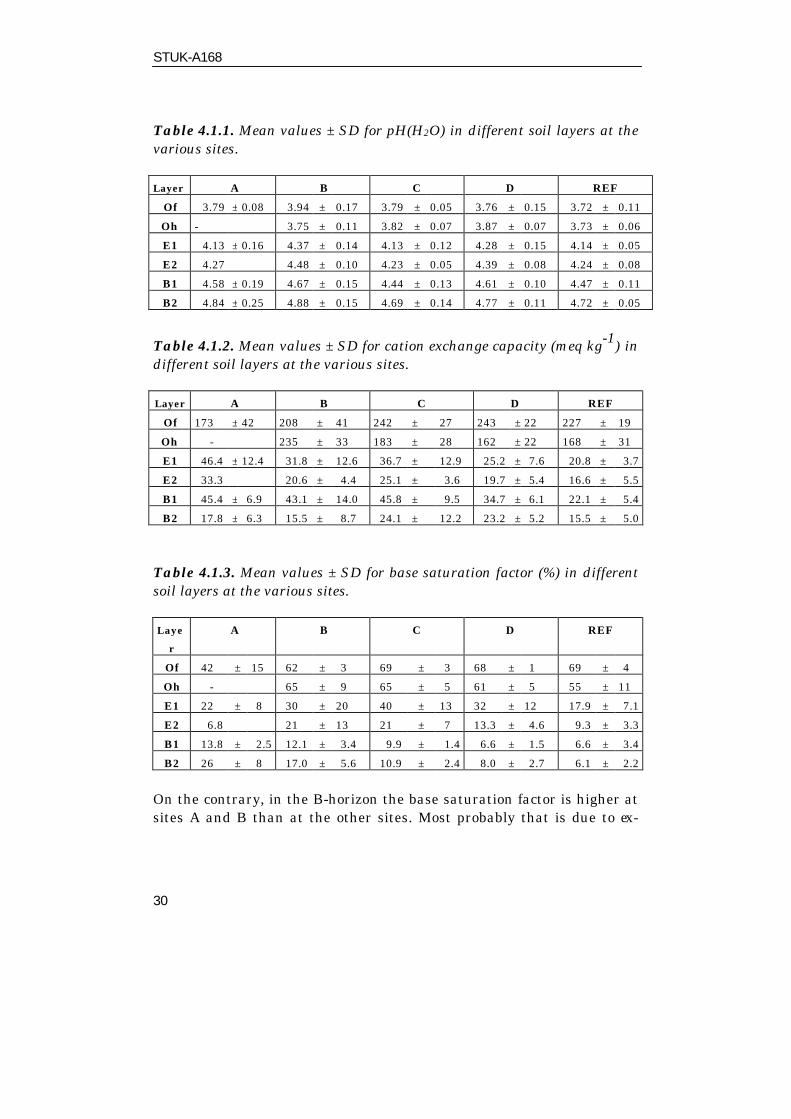
In Tables 4.1.1 – 4.1.3 data for pH(H2O), cation exchange capacity, andbase saturation factor in the various soil horizons at the five sites areshown. The values listed in the tables are mean values for the 5 plots ateach site.
From Table 4.1.1 it is apparent that there was no significant trend insoil pH along the pollution gradient in any of the soil layers sampled.The pH levels observed and the differences observed between differenthorizons are normal for nutrient-poor boreal forest soils (e.g. Steinnes etal. 1993). Very similar results were obtained for pH(CaCl2). Also valuesfor cation exchange capacity (Table 4.1.2) showed only small variationsbetween the sites. Even for base saturation, the factor normally exhibit-ing soil acidification most clearly, the apparent effects are only moder-ate. Only at site A the base saturation factor in the O horizon is signifi-cantly low compared to the other plots. This is mainly due to replace-ment of base cations (K, Mg, and to some extent Ca) with other metalcations. From Figure 4.1.1 it is evident that Al is the exchangeable ca-tion showing the greatest increase at site A.
STUK-A168
30
Table 4.1.1. Mean values ± SD for pH(H2O) in different soil layers at thevarious sites.
Layer A B C D REF
Of 3.79 ± 0.08 3.94 ± 0.17 3.79 ± 0.05 3.76 ± 0.15 3.72 ± 0.11
Oh - 3.75 ± 0.11 3.82 ± 0.07 3.87 ± 0.07 3.73 ± 0.06
E1 4.13 ± 0.16 4.37 ± 0.14 4.13 ± 0.12 4.28 ± 0.15 4.14 ± 0.05
E2 4.27 4.48 ± 0.10 4.23 ± 0.05 4.39 ± 0.08 4.24 ± 0.08
B1 4.58 ± 0.19 4.67 ± 0.15 4.44 ± 0.13 4.61 ± 0.10 4.47 ± 0.11
B2 4.84 ± 0.25 4.88 ± 0.15 4.69 ± 0.14 4.77 ± 0.11 4.72 ± 0.05
Table 4.1.2. Mean values ± SD for cation exchange capacity (meq kg-1) indifferent soil layers at the various sites.
Layer A B C D REF
Of 173 ± 42 208 ± 41 242 ± 27 243 ± 22 227 ± 19
Oh - 235 ± 33 183 ± 28 162 ± 22 168 ± 31
E1 46.4 ± 12.4 31.8 ± 12.6 36.7 ± 12.9 25.2 ± 7.6 20.8 ± 3.7
E2 33.3 20.6 ± 4.4 25.1 ± 3.6 19.7 ± 5.4 16.6 ± 5.5
B1 45.4 ± 6.9 43.1 ± 14.0 45.8 ± 9.5 34.7 ± 6.1 22.1 ± 5.4
B2 17.8 ± 6.3 15.5 ± 8.7 24.1 ± 12.2 23.2 ± 5.2 15.5 ± 5.0
Table 4.1.3. Mean values ± SD for base saturation factor (%) in differentsoil layers at the various sites.
Laye
r
A B C D REF
Of 42 ± 15 62 ± 3 69 ± 3 68 ± 1 69 ± 4
Oh - 65 ± 9 65 ± 5 61 ± 5 55 ± 11
E1 22 ± 8 30 ± 20 40 ± 13 32 ± 12 17.9 ± 7.1
E2 6.8 21 ± 13 21 ± 7 13.3 ± 4.6 9.3 ± 3.3
B1 13.8 ± 2.5 12.1 ± 3.4 9.9 ± 1.4 6.6 ± 1.5 6.6 ± 3.4
B2 26 ± 8 17.0 ± 5.6 10.9 ± 2.4 8.0 ± 2.7 6.1 ± 2.2
On the contrary, in the B-horizon the base saturation factor is higher atsites A and B than at the other sites. Most probably that is due to ex-
STUK-A168
31
change of acidic cations (H, Al) with base cations released from the sur-face horizons by acidification and recovered in the B-horizon.
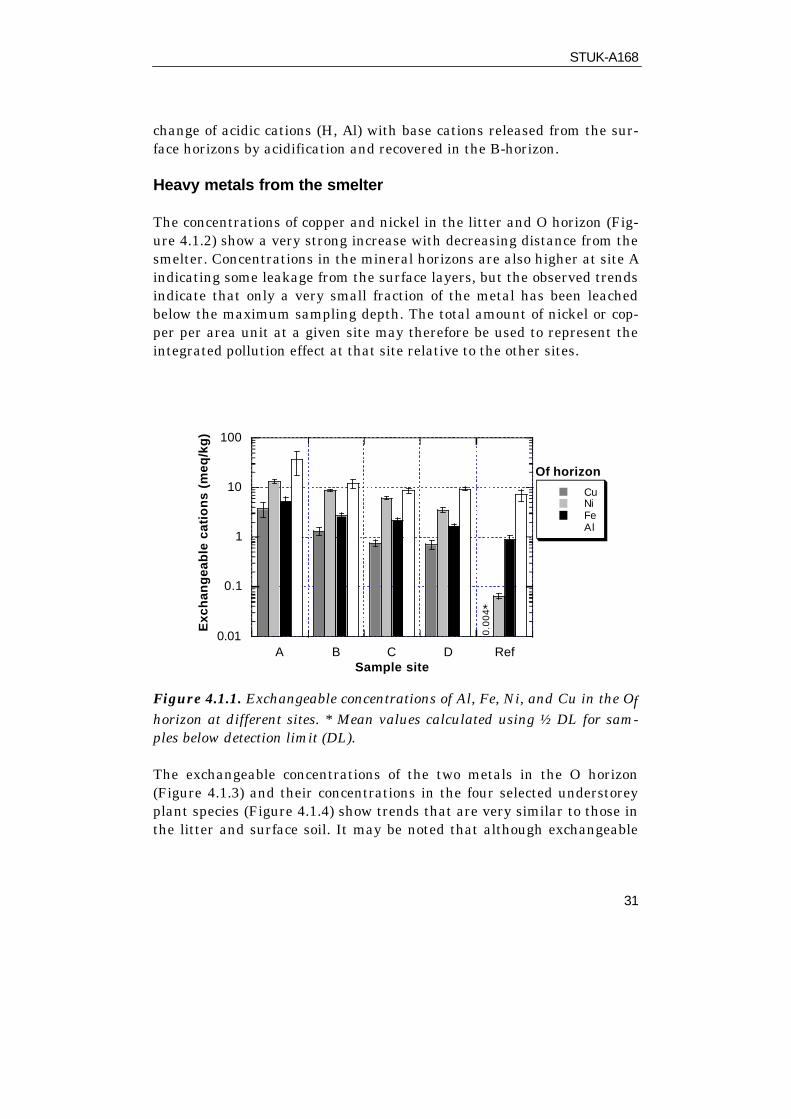
Heavy metals from the smelter
The concentrations of copper and nickel in the litter and O horizon (Fig-ure 4.1.2) show a very strong increase with decreasing distance from thesmelter. Concentrations in the mineral horizons are also higher at site Aindicating some leakage from the surface layers, but the observed trendsindicate that only a very small fraction of the metal has been leachedbelow the maximum sampling depth. The total amount of nickel or cop-per per area unit at a given site may therefore be used to represent theintegrated pollution effect at that site relative to the other sites.
Figure 4.1.1. Exchangeable concentrations of Al, Fe, Ni, and Cu in the Ofhorizon at different sites. * Mean values calculated using ½ DL for sam-ples below detection limit (DL).
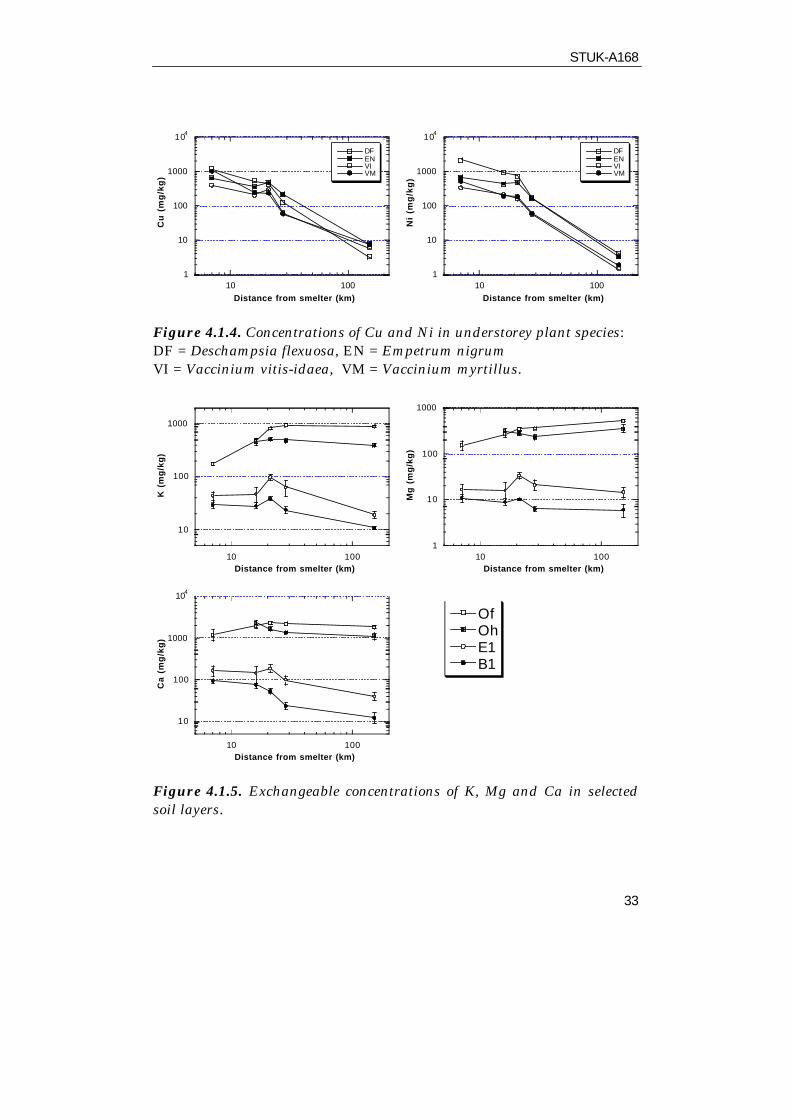
The exchangeable concentrations of the two metals in the O horizon(Figure 4.1.3) and their concentrations in the four selected understoreyplant species (Figure 4.1.4) show trends that are very similar to those inthe litter and surface soil. It may be noted that although exchangeable
0.01
0.1
1
10
100
A B C D Ref
CuNiFeAl
Exc
han
gea
ble
cat
ion
s (m
eq/k
g)
Sample site
0.0
04
Of horizon
*

STUK-A168
32
concentration of Ni is about 5 times higher than that of Cu, their con-centrations in vegetation are not much different. Deschampsia flexuosagenerally shows the highest and Vaccinium vitis-idaea the lowest metalconcentrations.
Figure 4.1.2. Concentrations of Cu and Ni in different soil layers. Thepoints at the distance of 7 km represent results from site A, those at 16, 21,28 and 152 km sites B, C, D, Reference sites, respectively.
Figure 4.1.3. Exchangeable concentrations of Cu and Ni in differentsoil layers. For explanations cf. Figure 4.1.2. * Mean values calculatedusing ½ DL for samples below detection limit (DL).
0.1
1
10
100
1000
104
10 100
LOfOhE1B1
Distance from smelter (km)
Cu
(m
g/k
g)
0.1
1
10
100
1000
104
10 100
LOfOhE1B1
Distance from smelter (km)
Ni
(mg
/kg
)
0.1
1
10
100
1000
10 100
OfOhE1B1
*
*
**
***
Cu
(m
g/k
g)
Distance from smelter (km)
0.1
1
10
100
1000
10 100
OfOhE1B1
Ni
(mg
/kg
)
Distance from smelter (km)
**
*
**
STUK-A168
33
Figure 4.1.4. Concentrations of Cu and Ni in understorey plant species:DF = Deschampsia flexuosa, EN = Empetrum nigrumVI = Vaccinium vitis-idaea, VM = Vaccinium myrtillus.
Figure 4.1.5. Exchangeable concentrations of K, Mg and Ca in selectedsoil layers.
1
10
100
1000
104
10 100
DFENVIVM
Distance from smelter (km)
Cu
(m
g/k
g)
1
10
100
1000
104
10 100
DFENVIVM
Distance from smelter (km)
Ni
(mg
/kg
)
10
100
1000
10 100Distance from smelter (km)
K (
mg
/kg
)
1
10
100
1000
10 100Distance from smelter (km)
Mg
(m
g/k
g)
10
100
1000
104
10 100Distance from smelter (km)
Ca
(m
g/k
g)
OfOhE1B1

STUK-A168
34
Figure 4.1.6. Concentrations of K, Mg and Ca in understorey plant spe-cies:DF = Deschampsia flexuosa, EN = Empetrum nigrumVI = Vaccinium vitis-idaea, VM = Vaccinium myrtillus.
Nutrient elements
Concentrations of exchangeable K, Mg, and Ca in selected soil layers areshown in Figure 4.1.5. For all three major nutrient cations there is astrong depletion in the Of layer with increasing pollution levels,whereas in the lower horizons a similar trend is not evident. In factthere is an increase of all three cations in the B-horizon, as discussedabove. The concentrations of these elements in plants, shown in Figure4.1.6, follow a trend similar to that observed for the exchangeable frac-tion in the Of horizon with strongly depleted concentrations near the
100
1000
104
10 100Distance from smelter (km)
K (
mg
/kg
)
100
1000
10 100Distance from smelter (km)
Mg
(m
g/k
g)
100
1000
104
10 100Distance from smelter (km)
Ca
(mg
/kg
)
DFENVIVM

STUK-A168
35
smelter. Manganese shows a similar behaviour as the other major ca-tions with respect to exchangeable fraction and plant contents.
Stable cesium and strontium
The data available for stable Cs and Sr are less extensive than for otherelements due to low concentration levels. Total Cs concentrations tend todecrease towards the smelter, but in the litter and Of horizon an in-crease is observed again at site A. Similar trends are observed in vegeta-tion, probably as a result of extensive resuspension in the strongly dam-aged areas near the smelter. Concentrations of Sr in the exchangeablefraction and in plants show only a small tendency of decrease towardsthe smelter, in contrast to K, Mg, and Ca.
Sequential extractions
Samples from all sites and soil layers were subjected to sequential ex-tractions according to the procedure described by Bunzl et al. (1997), andthe distributions of Cu and Ni between the four fractions were deter-mined. In the O horizon both metals were found predominantly in thefraction bound to organic matter, and the distribution between fractionsdid not change much with distance from the smelter. In the E- and B-horizons the organic bound fraction increased and the persistently bounddecreased on the most polluted sites. Cu showed a stronger association toorganic matter than did Ni.
Summary of main trends
The main trends observed in soil chemistry and plant uptake along thepollution gradient may be briefly described as follows:
- Total concentrations of Ni and Cu in the organic layer increase regu-larly from about 10 mg kg-1 at the reference site to about 5000 mg kg-
1 at the most polluted site. Similar trends are observed for exchange-able fractions and plant concentrations of the same elements.
- Concentrations of exchangeable K, Ca, and Mg in the Of horizon de-crease strongly with increased input of chemical pollutants. A similarstrong decrease is not observed in the lower soil horizons. Plant con-
STUK-A168
36
tents generally follow the trends in the O horizon, with the largestrelative decrease observed for Vaccinium myrtillus.
- For stable Sr no clear trend is observed with distance from thesmelter either in soil or plants.
- Only minor changes are observed in soil pH, cation exchange capac-ity, and exchangeable acidity with distance from the smelter. Thevertical distribution of these properties in the soil is normal forpodzols.
- Soil acidification at sites near the smelter, as evident from the basesaturation, is less pronounced than what might have been expectedconsidering the acidic emissions. This may be explained by the follow-ing two facts:
1. The dry deposition of SO2 from Monchegorsk is much more wide-spread than the deposition of particles, and the correspondingdeposition gradient therefore much less steep than e.g. for metals.A major part of the SO2 emitted from the smelter is distributedover rather large areas before oxidised to sulphate and deposited.
2. There are considerable emissions of alkaline ash particles fromthe industrial processes which may partly neutralise the effects ofacidic deposition at sites near Monchegorsk.
- The main changes in the distribution of exchangeable cations in theorganic layer is a higher content of Al, Fe, Ni, and Cu and a lower
content of H+ and base cations near Monchegorsk.
4.2. Fallout radionuclides in the soil/plant system
To investigate the effect of industrial pollution on the transfer of thefallout radionuclides within the soil and from the soil to plants, the fol-lowing approaches were used:
i) to determine vertical distribution of the radionuclides in the soil at thesites selected in different distances from the smelter in Monchegorsk.
STUK-A168
37
The aim was to examine partitioning of the radionuclides in the varioussoil horizons and especially to quantify their inventory in the root zoneas a function of industrial pollution load at the site. The vertical distri-bution of the radionuclides in the soil was also used to evaluate themean residence half-times of the radionuclides at the various sites in theroot layer and in the soil layer below the root layer.
ii) to examine the association of the radionuclides with the various soilconstituents and to determine the easily exchangeable (also called: read-ily available) fraction of a radionuclide, a sequential extraction proce-dure was used. In addition, because it was not possible to apply the se-quential extraction to all fresh samples immediately (which would bethe ideal case), for the first time in a separate study, the effect of air dry-ing and subsequent sample storage on the fractions extracted for a forestsoil (reference site in Finland) and a grassland site in Germany was ex-amined
iii) to detect the effect of industrial pollution on the soil-to-plant transferof fallout radionuclides, the activity concentrations of the radionuclidesin selected plants were determined, and the resulting aggregated trans-fer factors Tag were obtained for each plant species as a function of thedistance from the smelters.
Distribution in the soil profiles and residence half-times
Total inventory of 137Cs, 90Sr and 239+240Pu.
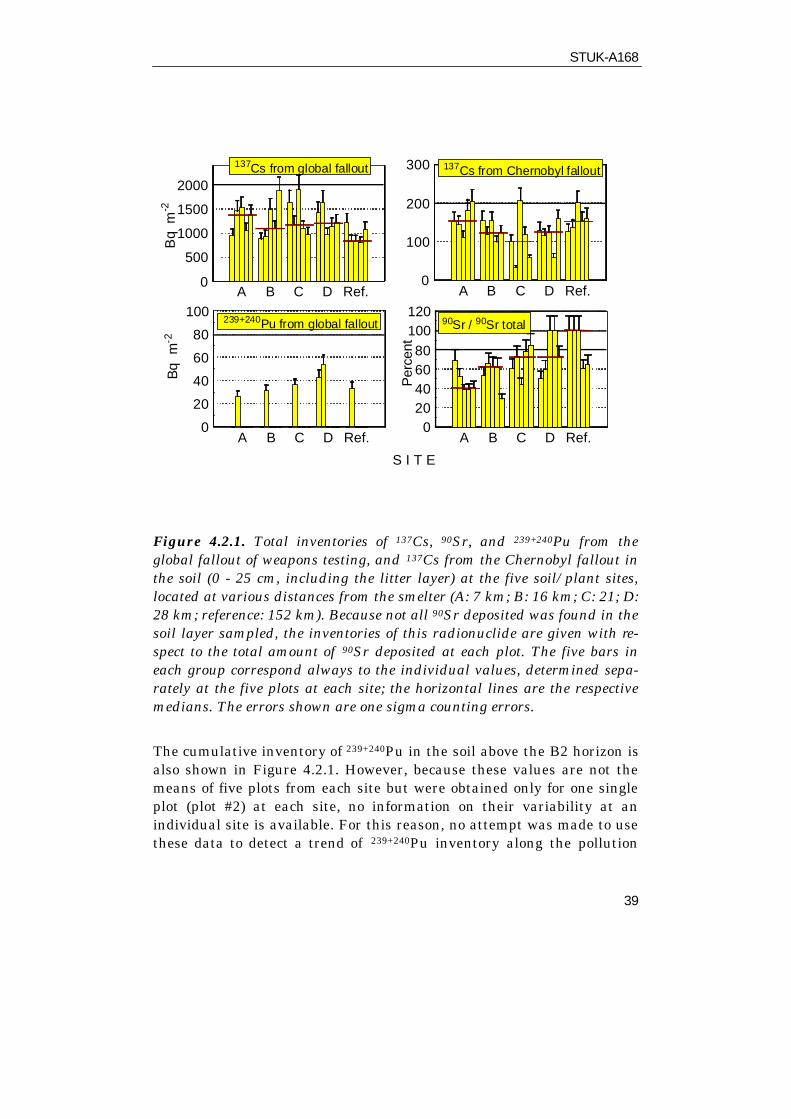
The total inventories (cumulative activities per unit area in Bq m-2) ofthese radionuclides at each site are shown in Figure 4.2.1. The amountof radiocesium below the B2 horizon (25 cm depth) was below the detec-tion limit. With help of the observed ratio 137Cs / 134Cs in each soil layer,the inventories were obtained separately for 137Cs from the global falloutand from the Chernobyl-derived fallout. As evident from Figure 4.2.1,the total inventory of 137Cs from the global fallout varies for all plotsfrom for all sites between 820 and 1900 Bq m-2, that of Chernobyl de-rived 137Cs between 60 and 200 Bq m-2. On average, Chernobyl-derived137Cs contributes by about 10% to the total 137Cs inventory. A continuoustrend of the mean 137Cs inventories from the global fallout within the
STUK-A168
38
sites A to D is not detectable (Spearman trend test, p>0.95), but the in-ventory at the reference site is about 20% smaller than that at the othersites. This difference is also statistically significant (U-test by Mann andWhitney, p < 0,05, two-tailed). For Chernobyl derived 137Cs, such a dif-ference is not detectable. From the variability of the 137Cs inventories ateach site, a mean coefficient of variation of 23% is obtained for the intra-site variability of 137Cs from the global fallout, and of 27% for Cherno-byl-derived 137Cs.
90Sr is usually more mobile in the soil than radiocesium. Therefore, itcould not be expected that all fallout radiostrontium deposited wouldstill be present in the upper 25 cm layer. The total inventory of this ra-dionuclide at each site was, therefore, calculated with help of global fall-out-derived 137Cs inventories and the known ratio of 137Cs / 90Sr = 1.6 inthe global fallout (Saxén et al.1987). The contribution of Chernobyl-derived 90Sr to the total 90Sr inventory is negligible in this area (Saxénet al. 1994). The resulting total 90Sr inventories at the various sites (notgiven here separately) can be compared with the corresponding cumula-tive inventories, obtained by summing up the 90Sr inventories in all soillayers above the B2 horizon (the deepest soil layer sampled). These re-sults are shown quantitatively in Figure 4.2.1(bottom, right), where thepercentage of 90Sr in the soil above the B2 horizon with respect to thetotal deposition of 90Sr are shown for all sites. Because this fractionis at most plots less than 100%, this demonstrates that indeed a fractionof 90Sr must have been transported to soil layers deeper than sampled byus. The extent of this loss to deeper soil layers is, however, site depend-ent. While at the reference site at most plots 100% of the deposited 90Srare still present above the B2 horizon, this amount decreases continu-ally, the closer the sites are located near the smelters. Thus, at site A,where the soil is most strongly polluted, only about 40% of the deposited90Sr is still found above the B2 horizon. The decreasing trend of the 90Srin the soil above the B2 horizon is also statistically significant (Spear-man trend test, p < 0.01). This enhanced loss of 90Sr activity from theupper soil layers at the polluted sites will be discussed in more detailbelow.
STUK-A168
39
A B C D Ref.0
500
1000
1500
2000B
q m
-2 137Cs from global fallout
A B C D Ref.0
100
200
300 137Cs from Chernobyl fallout
A B C D Ref.0
20
40
60
80
100
Bq
m-2
239+240Pu from global fallout
A B C D Ref.
S I T E
020406080
100120
Per
cent
90Sr / 90Sr total
Figure 4.2.1. Total inventories of 137Cs, 90Sr, and 239+240Pu from theglobal fallout of weapons testing, and 137Cs from the Chernobyl fallout inthe soil (0 - 25 cm, including the litter layer) at the five soil/plant sites,located at various distances from the smelter (A: 7 km; B: 16 km; C: 21; D:28 km; reference: 152 km). Because not all 90Sr deposited was found in thesoil layer sampled, the inventories of this radionuclide are given with re-spect to the total amount of 90Sr deposited at each plot. The five bars ineach group correspond always to the individual values, determined sepa-rately at the five plots at each site; the horizontal lines are the respectivemedians. The errors shown are one sigma counting errors.
The cumulative inventory of 239+240Pu in the soil above the B2 horizon isalso shown in Figure 4.2.1. However, because these values are not themeans of five plots from each site but were obtained only for one singleplot (plot #2) at each site, no information on their variability at anindividual site is available. For this reason, no attempt was made to usethese data to detect a trend of 239+240Pu inventory along the pollution

STUK-A168
40
gradient from the reference site to the polluted sites. By calculating,however, at each site for plot #2 the ratio of the inventories 239+240Pu /137Cs from the global fallout, one obtains for the mean ratio 239+240Pu/137Cs of all sites a value of 0.032 ± 0.004. This value is rather similar tothe corresponding ratio reported during 1962 –1967 for ground level airin Southern Finland, which is 0.018±0.002 (reference date 1997)(Miettinen, 1979). 238Pu/239+240Pu ratio in top soil of sampling sites inRussia and Finland was on average 0.029±0.003 indicating that allplutonium present originates from global fallout. According to literaturethe Chernobyl-derived 239+240Pu/137Cs ratio observed in 1986 inSouthern Finland was also small: 1.8 x 10⁻⁴ (range 9.1 x 10⁻⁷- 8.8 x 10⁻⁴)(Reponen et al, 1993). This further proves that the Chernobyl-derived239+240Pu in the top soil is negligible.
Vertical distribution of 137Cs, 90Sr and 239+240Pu
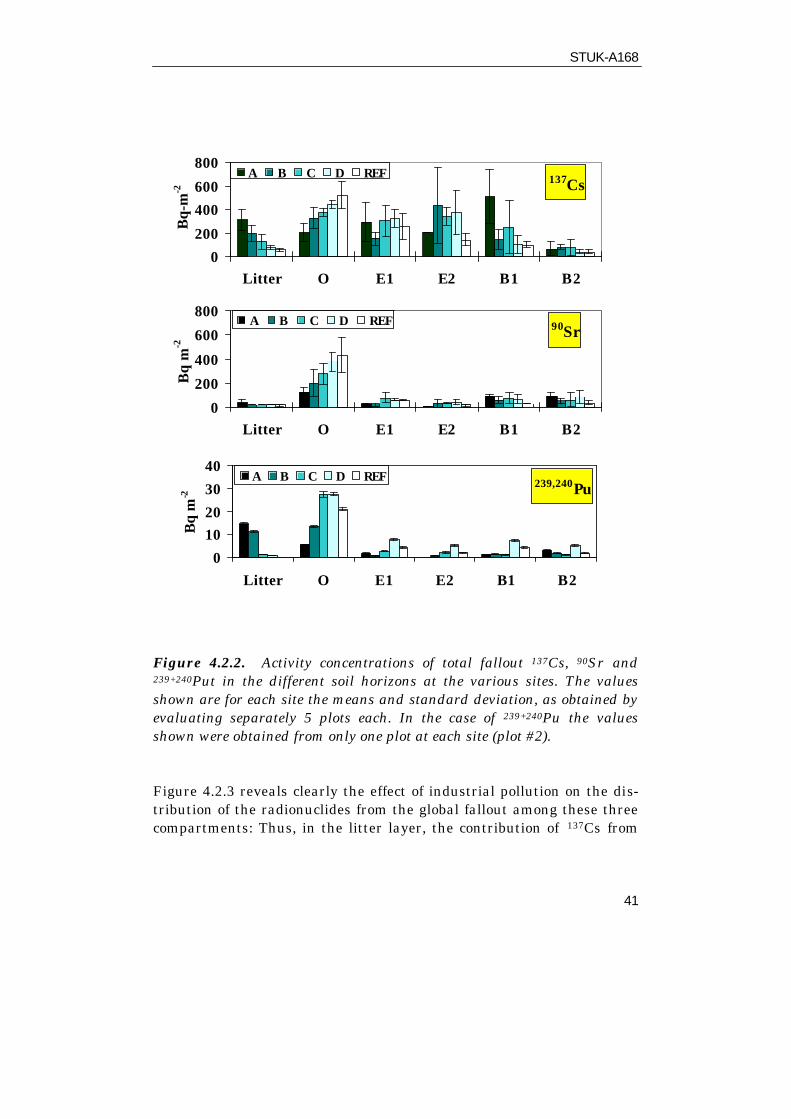
The vertical distribution of the radionuclides as observed in the varioussoil horizons is illustrated in Figure 4.2.2. They reveal a strong site de-pendence for the litter layer and the organic horizon: Especially the in-ventory of total 137Cs and 239+240Pu in the litter layer decreases with in-creasing distance from the smelters, while for all radionuclides the in-ventory in the organic layer increases with increasing distance from thesmelters indicating a clear effect of industrial pollution.
These values are needed below for the evaluation of the residence half-times, but for an understanding of radioecological consequences, it ismore relevant to use these values to calculate first the mean inventoriesof each radionuclide (in Bq m-2) at a given site for the following 3 com-partments: i) the litter layer, ii) the root zone (i.e. activities in the O-and E horizon, where essentially all roots we present), and iii) in allcombined layers below the root zone (i.e. the B1 and B2 horizons). Divid-ing the activities in each compartment by the corresponding total inven-tory (in Bq m-2), the percentage contribution of each compartment to thetotal inventory is obtained (see Figure 4.2.3). The total inventory for 90Srwas again calculated with help of the corresponding global fallout -derived 137Cs inventories and the known ratio of 137Cs / 90Sr = 1.6 in theglobal fallout.
STUK-A168
41
Figure 4.2.2. Activity concentrations of total fallout 137Cs, 90Sr and239+240Put in the different soil horizons at the various sites. The valuesshown are for each site the means and standard deviation, as obtained byevaluating separately 5 plots each. In the case of 239+240Pu the valuesshown were obtained from only one plot at each site (plot #2).
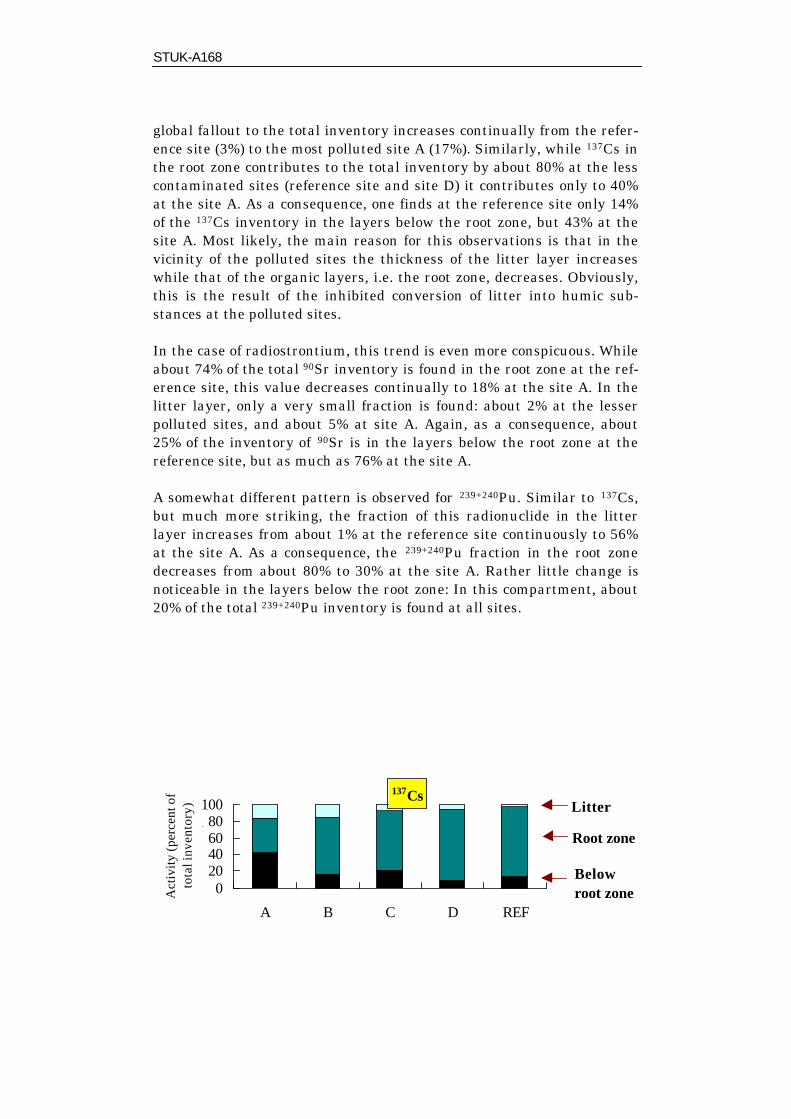
Figure 4.2.3 reveals clearly the effect of industrial pollution on the dis-tribution of the radionuclides from the global fallout among these threecompartments: Thus, in the litter layer, the contribution of 137Cs from
137Cs
0
200
400
600
800
Litter O E1 E2 B1 B2
Bq-
m-2
A B C D REF
90Sr
0
200
400
600
800
Litter O E1 E2 B1 B2
Bq
m-2
A B C D REF
239,240Pu
0
1020
30
40
Litter O E1 E2 B1 B2
Bq
m-2
A B C D REF
STUK-A168
42
global fallout to the total inventory increases continually from the refer-ence site (3%) to the most polluted site A (17%). Similarly, while 137Cs inthe root zone contributes to the total inventory by about 80% at the lesscontaminated sites (reference site and site D) it contributes only to 40%at the site A. As a consequence, one finds at the reference site only 14%of the 137Cs inventory in the layers below the root zone, but 43% at thesite A. Most likely, the main reason for this observations is that in thevicinity of the polluted sites the thickness of the litter layer increaseswhile that of the organic layers, i.e. the root zone, decreases. Obviously,this is the result of the inhibited conversion of litter into humic sub-stances at the polluted sites.
In the case of radiostrontium, this trend is even more conspicuous. Whileabout 74% of the total 90Sr inventory is found in the root zone at the ref-erence site, this value decreases continually to 18% at the site A. In thelitter layer, only a very small fraction is found: about 2% at the lesserpolluted sites, and about 5% at site A. Again, as a consequence, about25% of the inventory of 90Sr is in the layers below the root zone at thereference site, but as much as 76% at the site A.
A somewhat different pattern is observed for 239+240Pu. Similar to 137Cs,but much more striking, the fraction of this radionuclide in the litterlayer increases from about 1% at the reference site continuously to 56%at the site A. As a consequence, the 239+240Pu fraction in the root zonedecreases from about 80% to 30% at the site A. Rather little change isnoticeable in the layers below the root zone: In this compartment, about20% of the total 239+240Pu inventory is found at all sites.
137Cs
020406080
100
A B C D REF
Act
ivity
(per
cent
of
tota
l inv
ento
ry) Litter
Root zone
Below root zone

STUK-A168
43
Figure 4.2.3. Partitioning of 137Cs, 90Sr, and 239+240Pu from the globalfallout among the litter layer, the root zone, and the soil below the rootzone at the five soil/plant sites. The values given are always arithmeticmeans as observed at the five plots at each site.
Residence half-times of 137Cs, 90Sr and 239+240Pu
From the observed vertical distribution of a radionuclide in a soil, resi-dence half-times were evaluated using a multilayer compartment model.Only the mean residence half-time of a radionuclide for the period be-tween deposition and sampling date were calculated, because thechanges in the depth profile of a radionuclide over time were not avail-able in the present study. Thus a possible time dependence of the resi-dence half-time could not been determined. Because the thickness of thehorizons differed considerably (vertically and horizontally from plot to
90Sr
020406080
100
A B C D REF
Act
ivity
(per
cent
of
tota
l inv
ento
ry) Litter
Root zone
Belowroot zone
239+240Pu
020406080
100
A B C D REF
Act
ivity
(per
cent
of
tota
l inv
ento
ry) Litter
Root zone
Belowroot zone

STUK-A168
44
plot and site to site) the various horizons were subdivided into severalcompartments with about the same thickness of 1.5 ± 0.5 cm for all hori-zons at all plots and sites (i.e. the number of compartments varied be-tween 10 and 20) In this model, the transfer of activity Ai (Bq m-2) of aradionuclide in the compartment i in a small time interval ∆t (day) isgiven as
∆Ai /∆t = Ki-1 Ai-1 - KiAi - λAi (1)
where Ki (day-1) is the fractional rate of transfer from compartment i-1 tocompartment i, and λ is the disintegration constant of the radionuclide.For the first compartment Eq. (1) has to be written as
∆Ai /∆t = RACD - KiAi - λAi (2)
where RACD is the rate of activity deposited per unit area (in Bq cm-2
day-1), which must be known as a function of time. To obtain the valuesof Ki for a given radionuclide in a given soil layer, the differential equa-tion system of Eq. (1) and (2) is integrated numerically. The Ki are var-ied until the compartment activity matches the observed activity in thiscompartment. The residence half-time of a radionuclide in layer i is fi-nally obtained as τi = 0.693/Ki. For details see e.g..Bunzl et al. (1992).Residence half-times given here do not include the radioactive decay ofthe radionuclide. For this reason, this kind of residence half-time issometimes called the ecological residence half-time, because it character-ises the change of the activity in each compartment as resulting onlyfrom migration processes but does not take into account radioactive de-cay.
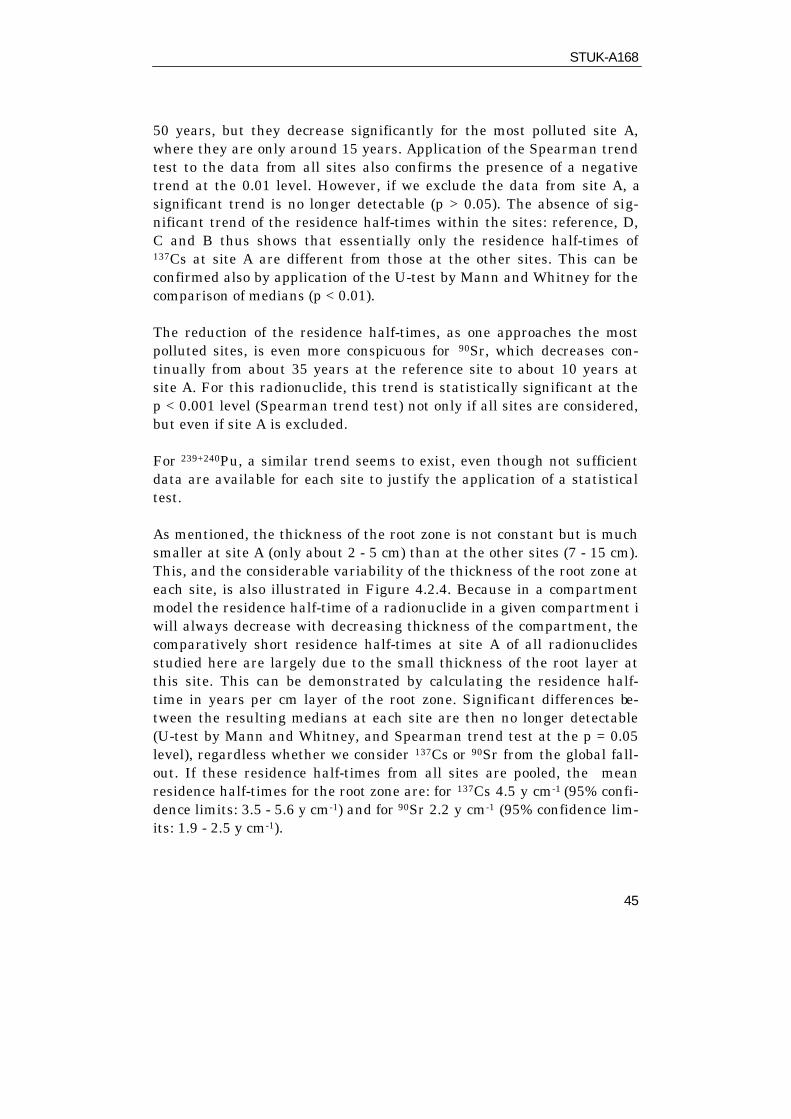
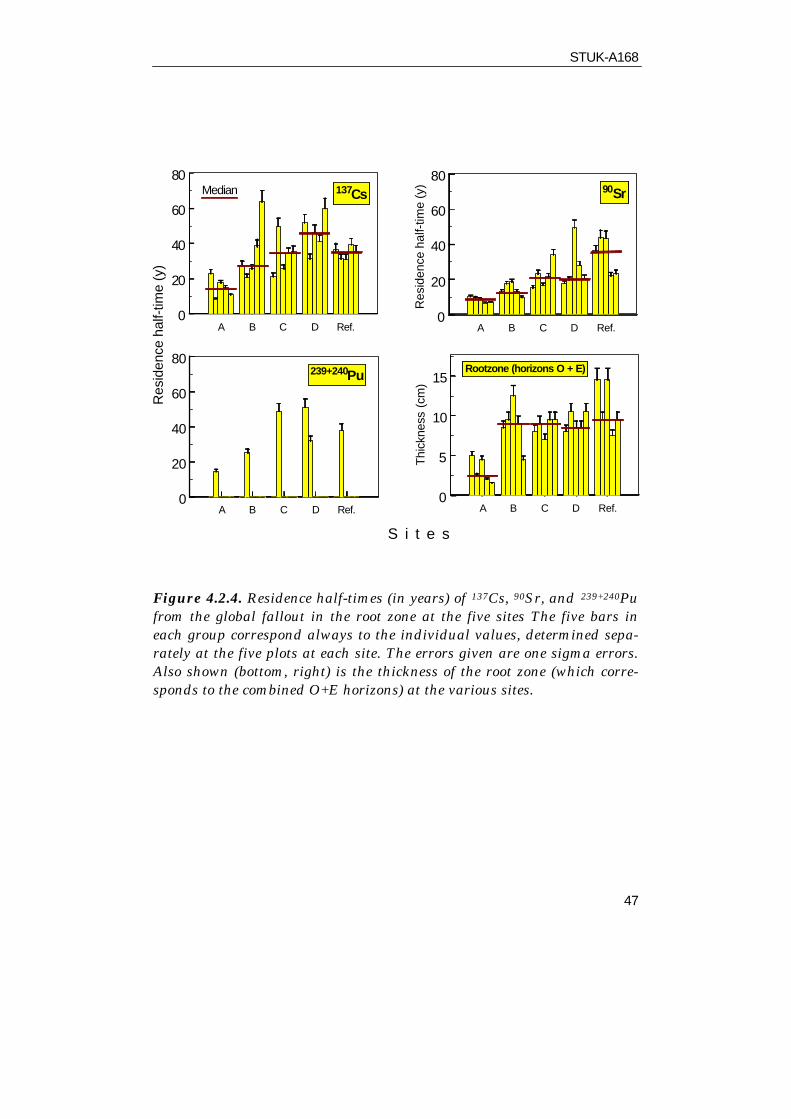
The residence half-times of the three radionuclides from the global fall-out were evaluated for the various soil horizons separately for each ofthe five plots at all sites as described above (with the exception of239+240Pu, where only data for the plots #2 were available). These dataare shown for the two most important soil compartments of interest: theroot zone (Figure 4.2.4) and the soil layer below the root zone; i.e. the B-horizon (Figure 4.2.5).
The residence half-times of 137Cs in the root zone (Figure 4.2.4, top, left)are for the reference and the lesser polluted sites D and C around 30 to
STUK-A168
45
50 years, but they decrease significantly for the most polluted site A,where they are only around 15 years. Application of the Spearman trendtest to the data from all sites also confirms the presence of a negativetrend at the 0.01 level. However, if we exclude the data from site A, asignificant trend is no longer detectable (p > 0.05). The absence of sig-nificant trend of the residence half-times within the sites: reference, D,C and B thus shows that essentially only the residence half-times of137Cs at site A are different from those at the other sites. This can beconfirmed also by application of the U-test by Mann and Whitney for thecomparison of medians (p < 0.01).
The reduction of the residence half-times, as one approaches the mostpolluted sites, is even more conspicuous for 90Sr, which decreases con-tinually from about 35 years at the reference site to about 10 years atsite A. For this radionuclide, this trend is statistically significant at thep < 0.001 level (Spearman trend test) not only if all sites are considered,but even if site A is excluded.
For 239+240Pu, a similar trend seems to exist, even though not sufficientdata are available for each site to justify the application of a statisticaltest.
As mentioned, the thickness of the root zone is not constant but is muchsmaller at site A (only about 2 - 5 cm) than at the other sites (7 - 15 cm).This, and the considerable variability of the thickness of the root zone ateach site, is also illustrated in Figure 4.2.4. Because in a compartmentmodel the residence half-time of a radionuclide in a given compartment iwill always decrease with decreasing thickness of the compartment, thecomparatively short residence half-times at site A of all radionuclidesstudied here are largely due to the small thickness of the root layer atthis site. This can be demonstrated by calculating the residence half-time in years per cm layer of the root zone. Significant differences be-tween the resulting medians at each site are then no longer detectable(U-test by Mann and Whitney, and Spearman trend test at the p = 0.05level), regardless whether we consider 137Cs or 90Sr from the global fall-out. If these residence half-times from all sites are pooled, the meanresidence half-times for the root zone are: for 137Cs 4.5 y cm-1 (95% confi-dence limits: 3.5 - 5.6 y cm-1) and for 90Sr 2.2 y cm-1 (95% confidence lim-its: 1.9 - 2.5 y cm-1).
STUK-A168
46
The reduced thickness of the root layer at the most polluted site is aneffect of the inhibited conversion of the litter layer to humic matter bythe soil micro-organisms. In addition, however, it is conceivable that thechemical composition of the humic substances in the root zone mightalso be different from that of the lesser-polluted sites. Not only becausethe type of the micro-organisms will probably depend on the degree ofsoil pollution, but also because the composition of the litter is differentat the polluted sites due to the modified plant communities there. A dif-ferent chemical composition of the soil organic matter might, however,also have an effect on its interactions with the radionuclides, and thusalso on the corresponding residence half-times (when reported in yearsper cm layer). However, such an effect was not detectable here.
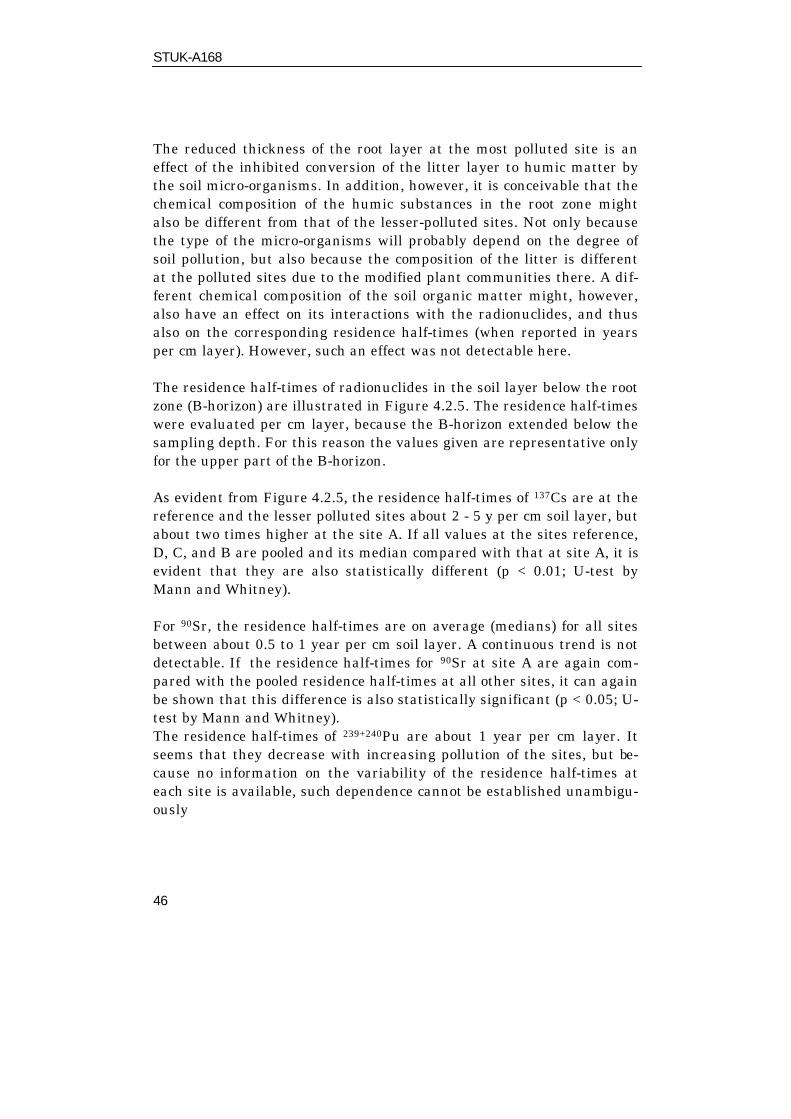
The residence half-times of radionuclides in the soil layer below the rootzone (B-horizon) are illustrated in Figure 4.2.5. The residence half-timeswere evaluated per cm layer, because the B-horizon extended below thesampling depth. For this reason the values given are representative onlyfor the upper part of the B-horizon.
As evident from Figure 4.2.5, the residence half-times of 137Cs are at thereference and the lesser polluted sites about 2 - 5 y per cm soil layer, butabout two times higher at the site A. If all values at the sites reference,D, C, and B are pooled and its median compared with that at site A, it isevident that they are also statistically different (p < 0.01; U-test byMann and Whitney).
For 90Sr, the residence half-times are on average (medians) for all sitesbetween about 0.5 to 1 year per cm soil layer. A continuous trend is notdetectable. If the residence half-times for 90Sr at site A are again com-pared with the pooled residence half-times at all other sites, it can againbe shown that this difference is also statistically significant (p < 0.05; U-test by Mann and Whitney).The residence half-times of 239+240Pu are about 1 year per cm layer. Itseems that they decrease with increasing pollution of the sites, but be-cause no information on the variability of the residence half-times ateach site is available, such dependence cannot be established unambigu-ously
STUK-A168
47
Figure 4.2.4. Residence half-times (in years) of 137Cs, 90Sr, and 239+240Pufrom the global fallout in the root zone at the five sites The five bars ineach group correspond always to the individual values, determined sepa-rately at the five plots at each site. The errors given are one sigma errors.Also shown (bottom, right) is the thickness of the root zone (which corre-sponds to the combined O+E horizons) at the various sites.
A B C D Ref.0
20
40
60
80
Res
iden
ce h
alf-
time
(y) 90Sr
A B C D Ref.0
20
40
60
80R
esid
ence
hal
f-tim
e (y
)
Median 137Cs
A B C D Ref.
S i t e s
0
20
40
60
80239+240Pu
A B C D Ref.0
5
10
15
Thic
knes
s (c
m)
Rootzone (horizons O + E)

STUK-A168
48
Figure 4.2.5 Residence half-times (in years per cm soil layer) of 137Cs,90Sr, and 239+240Pu from the global fallout in the soil below the root zone(B-horizon) at the five sites. The five bars in each group correspond alwaysto the individual values, determined separately at the five plots at eachsite. The errors given are one sigma errors.
No residence half times were evaluated for Chernobyl-derived 137Cs,because the depth profiles of this radionuclide immediately after thedeposition are not available for the sites studied. This information is,however, required, unless one can exclude that during this single deposi-tion event, a considerable portion of the total inventory was depositedwith a heavy rain shower and, thus, infiltrated already initially rapidlyin the soil by by-pass fluxes (Schimmack et al., 1998).
Association of radionuclides with soil constituents
A B C D Ref.0.0
0.5
1.0
1.5
2.0
Res
iden
ce h
alf-t
ime
(y c
m-1
)
90Sr
A B C D Ref.0
5
10
15
20 Median137Cs
A B C D Ref.
S i t e
0.0
1.5
3.0
4.5 239+240Pu

STUK-A168
49
Effect of air drying and storage time
Sequential extraction techniques have been used since many years toobtain information on the form of trace metals in sediments and soils. Itwas, however, early realised that already during sampling and samplestorage a transformation of the species may occur. Bartlett and James(1980) showed e.g. that air- or oven drying might cause instant and ma-jor changes in overall sediment and soil equilibrium by converting frac-tions relevant to trace metal binding into highly unstable and reactiveforms. They observed an enhanced solubility of organic matter and man-ganese as a result of soil drying. In addition, they found that the man-ganese extractability by pH 4.8 NH4Ac continued to increase with stor-age time. As noted by Kersten and Förstner (1995), air drying, sievingand mixing the soil in order to obtain a representative sample for bio-availability analysis may lead to precise but inaccurate results.
In spite of the substantial evidence that sample drying and storage mayhave an effect on the extractability of trace metals from soils, no analo-gous information seems to be available for the extraction of radionu-clides from these samples. This is somewhat surprising, because in therecent years sequential extraction techniques are used increasingly forinvestigating also the forms of either artificial radionuclides in the soil,resulting from fallout, such as 137Cs, 90Sr, or 239+240Pu. There is, however,no reason why sample drying may not also have an effect on the extrac-tability of radiocesium or, even more likely, for plutonium, which isknown to exist in several oxidation states.
For this reason it was decided to examine within this project the effect ofair drying and storage of soil samples on the percentage amounts of fall-out 137Cs and 239+240Pu extracted. Both of these radionuclides originatedfrom the global fallout of nuclear weapons testing and, in the case of137Cs, also due to the fallout following the accident at the nuclear powerplant in Chernobyl. For comparison, also the corresponding natural sta-ble element Cs was determined in all soil samples and extracts. Because,as mentioned above, the effect of drying and storing has been observedfor Mn in soils, the existence of this effect was also studied here.
The effect of drying and storage might depend on the form of the radio-nuclides in the soil. Because this form can again depend on the physico-
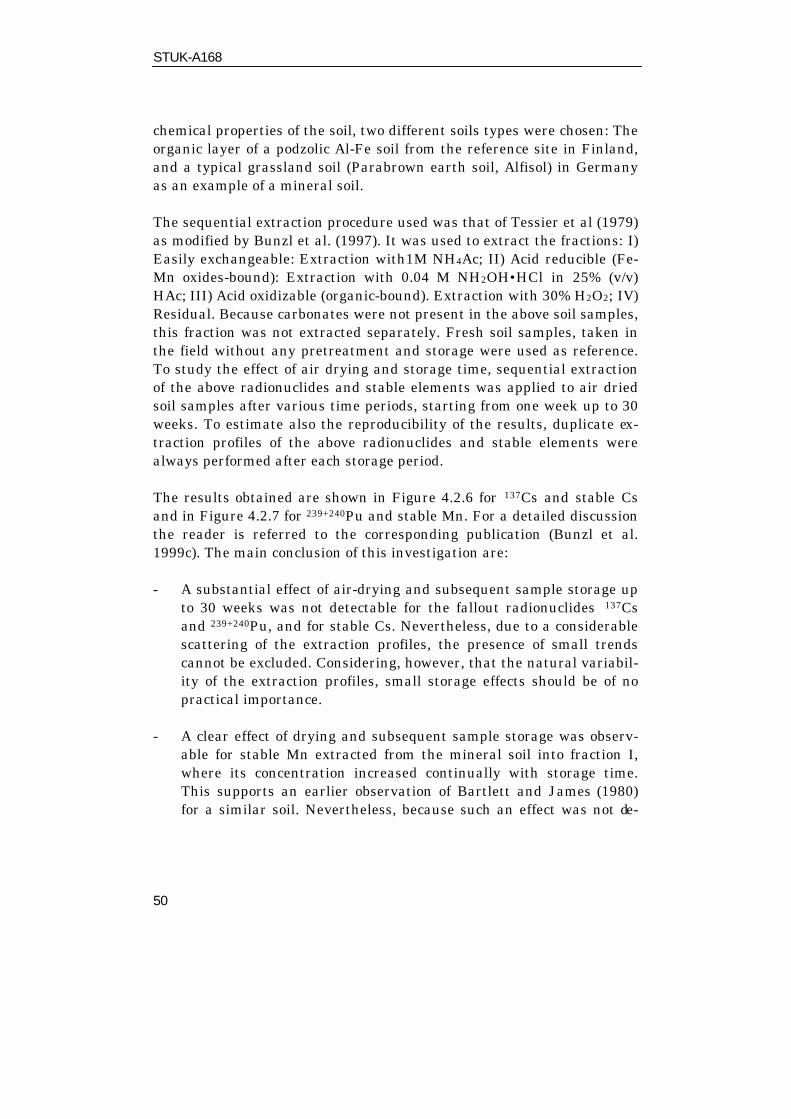
STUK-A168
50
chemical properties of the soil, two different soils types were chosen: Theorganic layer of a podzolic Al-Fe soil from the reference site in Finland,and a typical grassland soil (Parabrown earth soil, Alfisol) in Germanyas an example of a mineral soil.
The sequential extraction procedure used was that of Tessier et al (1979)as modified by Bunzl et al. (1997). It was used to extract the fractions: I)Easily exchangeable: Extraction with1M NH4Ac; II) Acid reducible (Fe-Mn oxides-bound): Extraction with 0.04 M NH2OH•HCl in 25% (v/v)HAc; III) Acid oxidizable (organic-bound). Extraction with 30% H2O2; IV)Residual. Because carbonates were not present in the above soil samples,this fraction was not extracted separately. Fresh soil samples, taken inthe field without any pretreatment and storage were used as reference.To study the effect of air drying and storage time, sequential extractionof the above radionuclides and stable elements was applied to air driedsoil samples after various time periods, starting from one week up to 30weeks. To estimate also the reproducibility of the results, duplicate ex-traction profiles of the above radionuclides and stable elements werealways performed after each storage period.
The results obtained are shown in Figure 4.2.6 for 137Cs and stable Csand in Figure 4.2.7 for 239+240Pu and stable Mn. For a detailed discussionthe reader is referred to the corresponding publication (Bunzl et al.1999c). The main conclusion of this investigation are:
- A substantial effect of air-drying and subsequent sample storage upto 30 weeks was not detectable for the fallout radionuclides 137Csand 239+240Pu, and for stable Cs. Nevertheless, due to a considerablescattering of the extraction profiles, the presence of small trendscannot be excluded. Considering, however, that the natural variabil-ity of the extraction profiles, small storage effects should be of nopractical importance.
- A clear effect of drying and subsequent sample storage was observ-able for stable Mn extracted from the mineral soil into fraction I,where its concentration increased continually with storage time.This supports an earlier observation of Bartlett and James (1980)for a similar soil. Nevertheless, because such an effect was not de-
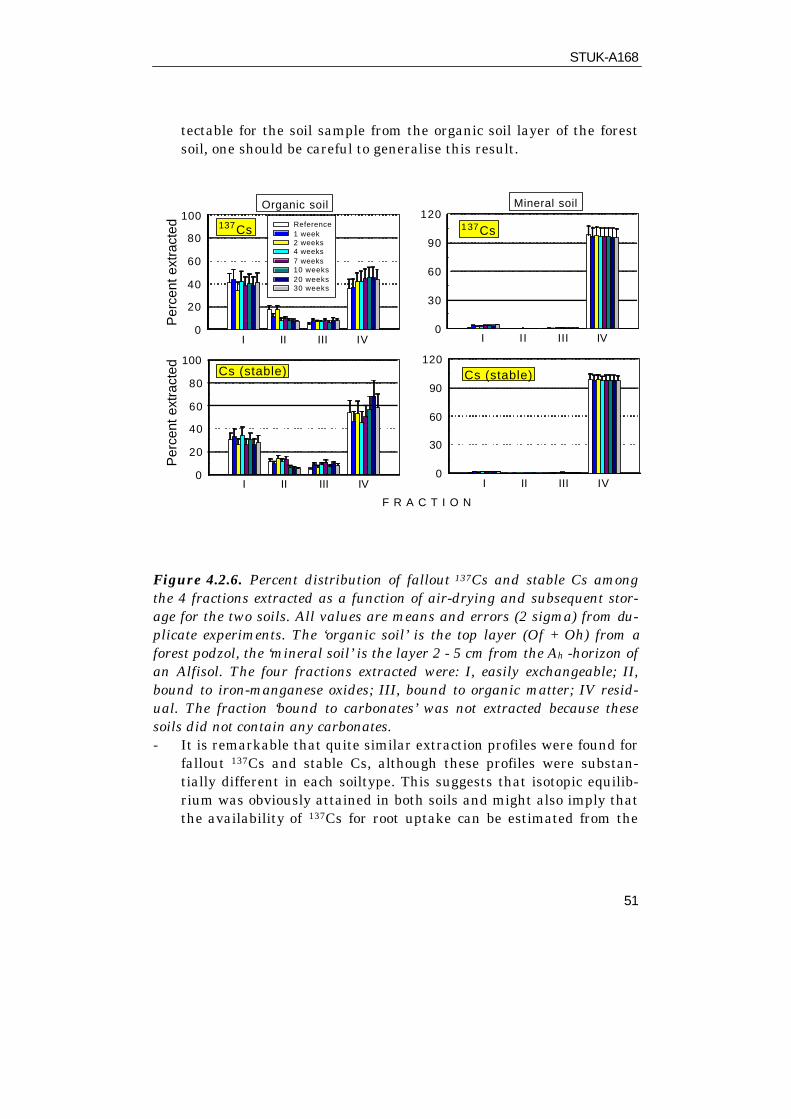
STUK-A168
51
tectable for the soil sample from the organic soil layer of the forestsoil, one should be careful to generalise this result.
Figure 4.2.6. Percent distribution of fallout 137Cs and stable Cs amongthe 4 fractions extracted as a function of air-drying and subsequent stor-age for the two soils. All values are means and errors (2 sigma) from du-plicate experiments. The ‘organic soil’ is the top layer (Of + Oh) from aforest podzol, the ‘mineral soil’ is the layer 2 - 5 cm from the Ah -horizon ofan Alfisol. The four fractions extracted were: I, easily exchangeable; II,bound to iron-manganese oxides; III, bound to organic matter; IV resid-ual. The fraction ‘bound to carbonates’ was not extracted because thesesoils did not contain any carbonates.- It is remarkable that quite similar extraction profiles were found for
fallout 137Cs and stable Cs, although these profiles were substan-tially different in each soiltype. This suggests that isotopic equilib-rium was obviously attained in both soils and might also imply thatthe availability of 137Cs for root uptake can be estimated from the
I II III IV0
20
40
60
80
100
Per
cent
ext
ract
ed 137Cs Reference1 week2 weeks4 weeks7 weeks10 weeks20 weeks30 weeks
Organic soil
I II III IV0
30
60
90
120137Cs
Mineral soil
I II III IV0
20
40
60
80
100
Per
cent
ext
ract
ed Cs (stable)
F R A C T I O N
I II III IV0
30
60
90
120Cs (stable)
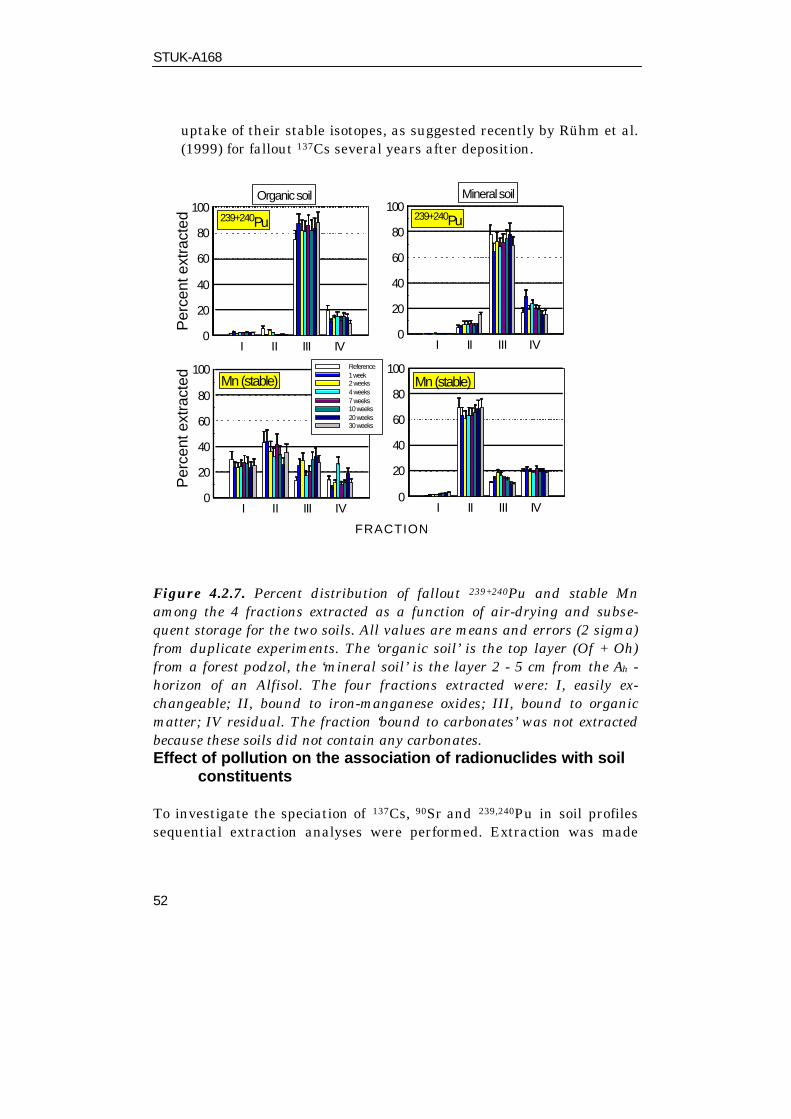
STUK-A168
52
uptake of their stable isotopes, as suggested recently by Rühm et al.(1999) for fallout 137Cs several years after deposition.
I II III IV0
20
40
60
80
100
Per
cent
ext
ract
ed 239+240Pu
Organic soil
I II III IV0
20
40
60
80
100239+240Pu
Mineral soil
I II III IV0
20
40
60
80
100
Per
cent
ext
ract
ed Mn (stable)Reference1 week2 weeks4 weeks7 weeks10 weeks20 weeks30 weeks
F R A C T I O N
I II III IV0
20
40
60
80
100Mn (stable)
Figure 4.2.7. Percent distribution of fallout 239+240Pu and stable Mnamong the 4 fractions extracted as a function of air-drying and subse-quent storage for the two soils. All values are means and errors (2 sigma)from duplicate experiments. The ‘organic soil’ is the top layer (Of + Oh)from a forest podzol, the ‘mineral soil’ is the layer 2 - 5 cm from the Ah -horizon of an Alfisol. The four fractions extracted were: I, easily ex-changeable; II, bound to iron-manganese oxides; III, bound to organicmatter; IV residual. The fraction ‘bound to carbonates’ was not extractedbecause these soils did not contain any carbonates.Effect of pollution on the association of radionuclides with soil
constituents
To investigate the speciation of 137Cs, 90Sr and 239,240Pu in soil profilessequential extraction analyses were performed. Extraction was made
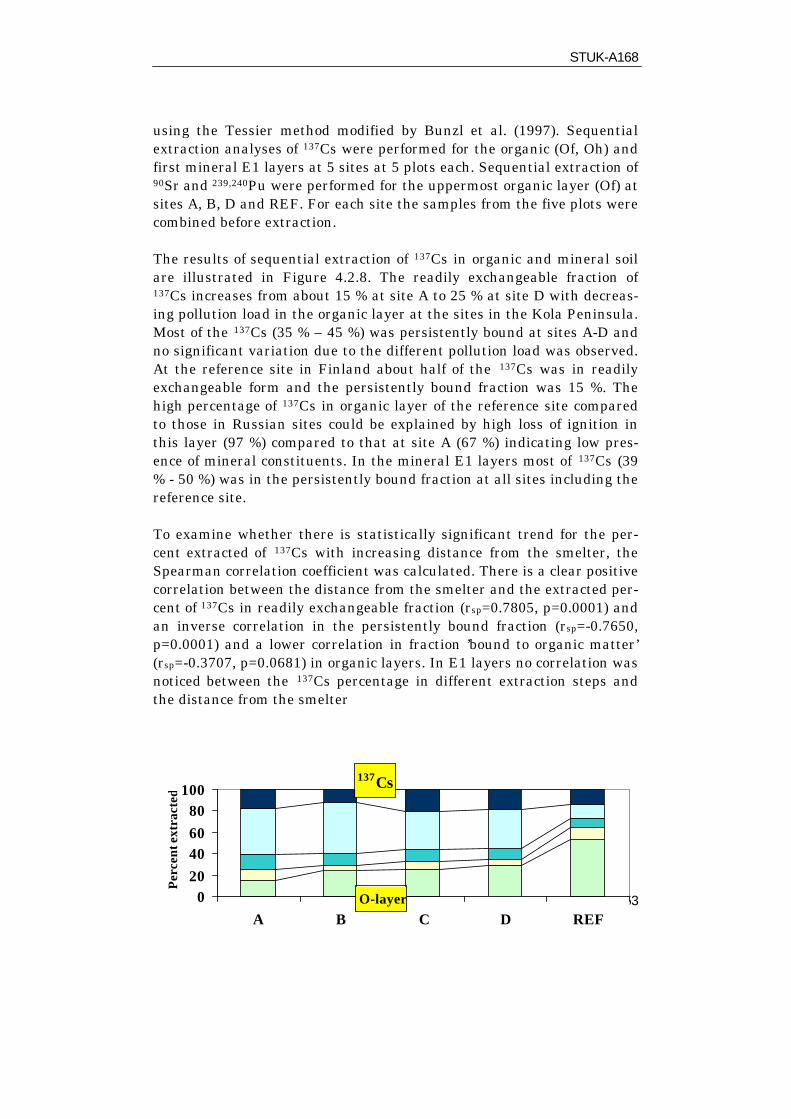
STUK-A168
53
using the Tessier method modified by Bunzl et al. (1997). Sequentialextraction analyses of 137Cs were performed for the organic (Of, Oh) andfirst mineral E1 layers at 5 sites at 5 plots each. Sequential extraction of90Sr and 239,240Pu were performed for the uppermost organic layer (Of) atsites A, B, D and REF. For each site the samples from the five plots werecombined before extraction.
The results of sequential extraction of 137Cs in organic and mineral soilare illustrated in Figure 4.2.8. The readily exchangeable fraction of137Cs increases from about 15 % at site A to 25 % at site D with decreas-ing pollution load in the organic layer at the sites in the Kola Peninsula.Most of the 137Cs (35 % – 45 %) was persistently bound at sites A-D andno significant variation due to the different pollution load was observed.At the reference site in Finland about half of the 137Cs was in readilyexchangeable form and the persistently bound fraction was 15 %. Thehigh percentage of 137Cs in organic layer of the reference site comparedto those in Russian sites could be explained by high loss of ignition inthis layer (97 %) compared to that at site A (67 %) indicating low pres-ence of mineral constituents. In the mineral E1 layers most of 137Cs (39% - 50 %) was in the persistently bound fraction at all sites including thereference site.
To examine whether there is statistically significant trend for the per-cent extracted of 137Cs with increasing distance from the smelter, theSpearman correlation coefficient was calculated. There is a clear positivecorrelation between the distance from the smelter and the extracted per-cent of 137Cs in readily exchangeable fraction (rsp=0.7805, p=0.0001) andan inverse correlation in the persistently bound fraction (rsp=-0.7650,p=0.0001) and a lower correlation in fraction ’bound to organic matter’(rsp=-0.3707, p=0.0681) in organic layers. In E1 layers no correlation wasnoticed between the 137Cs percentage in different extraction steps andthe distance from the smelter
137Cs
020406080
100
A B C D REFO-layer
Per
cent
ext
ract
ed
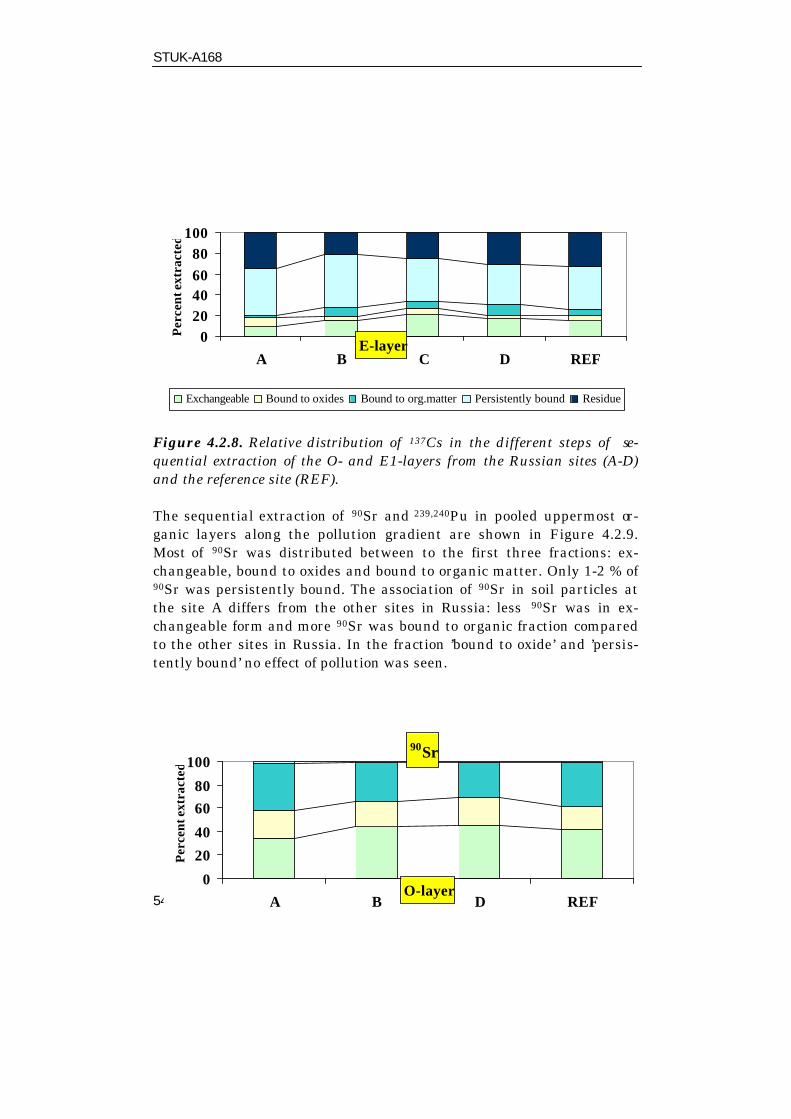
STUK-A168
54
Figure 4.2.8. Relative distribution of 137Cs in the different steps of se-quential extraction of the O- and E1-layers from the Russian sites (A-D)and the reference site (REF).
The sequential extraction of 90Sr and 239,240Pu in pooled uppermost or-ganic layers along the pollution gradient are shown in Figure 4.2.9.Most of 90Sr was distributed between to the first three fractions: ex-changeable, bound to oxides and bound to organic matter. Only 1-2 % of90Sr was persistently bound. The association of 90Sr in soil particles atthe site A differs from the other sites in Russia: less 90Sr was in ex-changeable form and more 90Sr was bound to organic fraction comparedto the other sites in Russia. In the fraction ’bound to oxide’ and ’persis-tently bound’ no effect of pollution was seen.
020406080
100
A B C D REFE-layer
Per
cent
ext
ract
ed
Exchangeable Bound to oxides Bound to org.matter Persistently bound Residue
90Sr
0
20
40
6080
100
A B D REFO-layer
Per
cent
ext
ract
ed

STUK-A168
55
Figure 4.2.9. Relative distribution of 90Sr and 239,240Pu in the differentsteps of sequential extraction of the O-layers from the Russian sites (A, B,D) and the reference site (REF).
At each site most of 239,240Pu, 85-90 %, was bound in organic fraction. Atthe site A there was less exchangeable 239,240Pu (1%) compared to theother sites (4-6%). In the fractions ’bound to oxides’, ’bound to organicmatter’ and ’persistently bound’ no effect of pollution on extracted239,240Pu percentages was found.
The explanation for the lower percentages of exchangeable 239,240Pu, 90Srand 137Cs at site A compared to the other sites is the different composi-tion of organic layer. At this site the organic layer was very thin. Theloss of ignition was only 67 % while at the other sites the loss of ignitionwas over 80 %. It means that there was more mineral material in or-ganic layer at site A, which may result in the decrease of exchangeableradionuclides in the organic layer at this site.Concentration in plant species and transfer factors
Concentrations in plants
239,240Pu
0
20
40
60
80
100
A B D REF
O-layer
Per
cent
ext
ract
ed
Exchangeable Bound to oxides Bound to org.matter Persistently bound
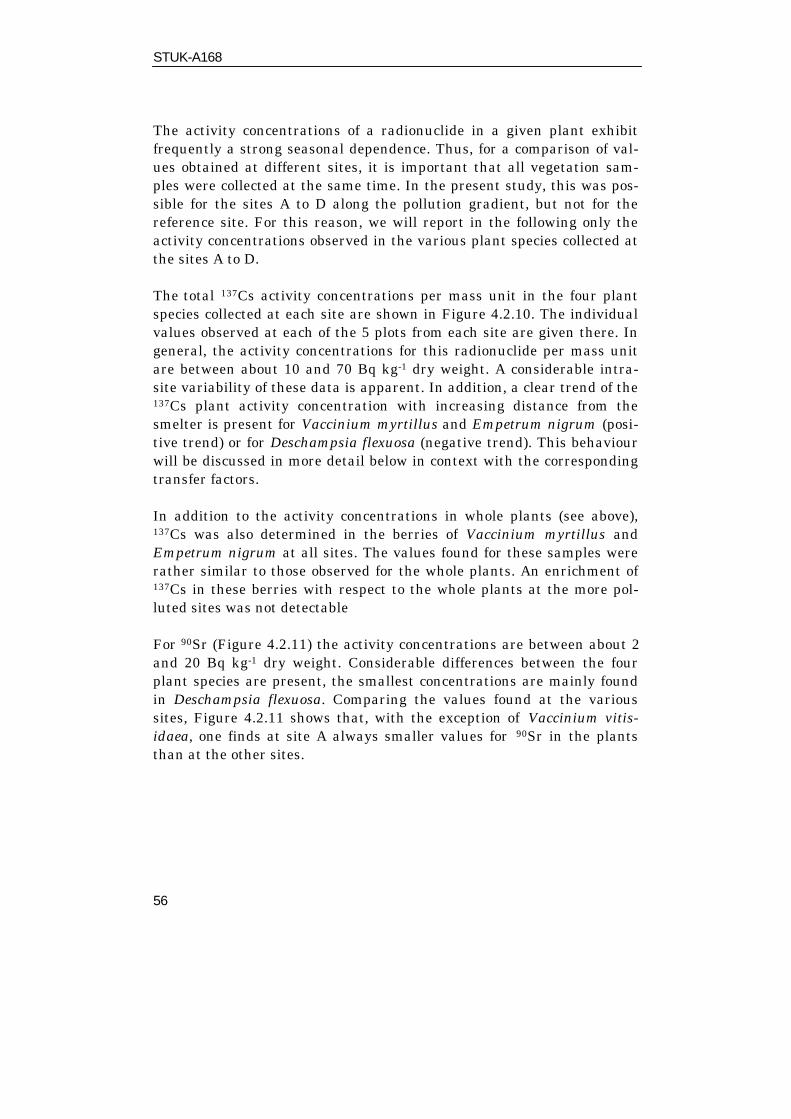
STUK-A168
56
The activity concentrations of a radionuclide in a given plant exhibitfrequently a strong seasonal dependence. Thus, for a comparison of val-ues obtained at different sites, it is important that all vegetation sam-ples were collected at the same time. In the present study, this was pos-sible for the sites A to D along the pollution gradient, but not for thereference site. For this reason, we will report in the following only theactivity concentrations observed in the various plant species collected atthe sites A to D.
The total 137Cs activity concentrations per mass unit in the four plantspecies collected at each site are shown in Figure 4.2.10. The individualvalues observed at each of the 5 plots from each site are given there. Ingeneral, the activity concentrations for this radionuclide per mass unitare between about 10 and 70 Bq kg-1 dry weight. A considerable intra-site variability of these data is apparent. In addition, a clear trend of the137Cs plant activity concentration with increasing distance from thesmelter is present for Vaccinium myrtillus and Empetrum nigrum (posi-tive trend) or for Deschampsia flexuosa (negative trend). This behaviourwill be discussed in more detail below in context with the correspondingtransfer factors.
In addition to the activity concentrations in whole plants (see above),137Cs was also determined in the berries of Vaccinium myrtillus andEmpetrum nigrum at all sites. The values found for these samples wererather similar to those observed for the whole plants. An enrichment of137Cs in these berries with respect to the whole plants at the more pol-luted sites was not detectable
For 90Sr (Figure 4.2.11) the activity concentrations are between about 2and 20 Bq kg-1 dry weight. Considerable differences between the fourplant species are present, the smallest concentrations are mainly foundin Deschampsia flexuosa. Comparing the values found at the varioussites, Figure 4.2.11 shows that, with the exception of Vaccinium vitis-idaea, one finds at site A always smaller values for 90Sr in the plantsthan at the other sites.
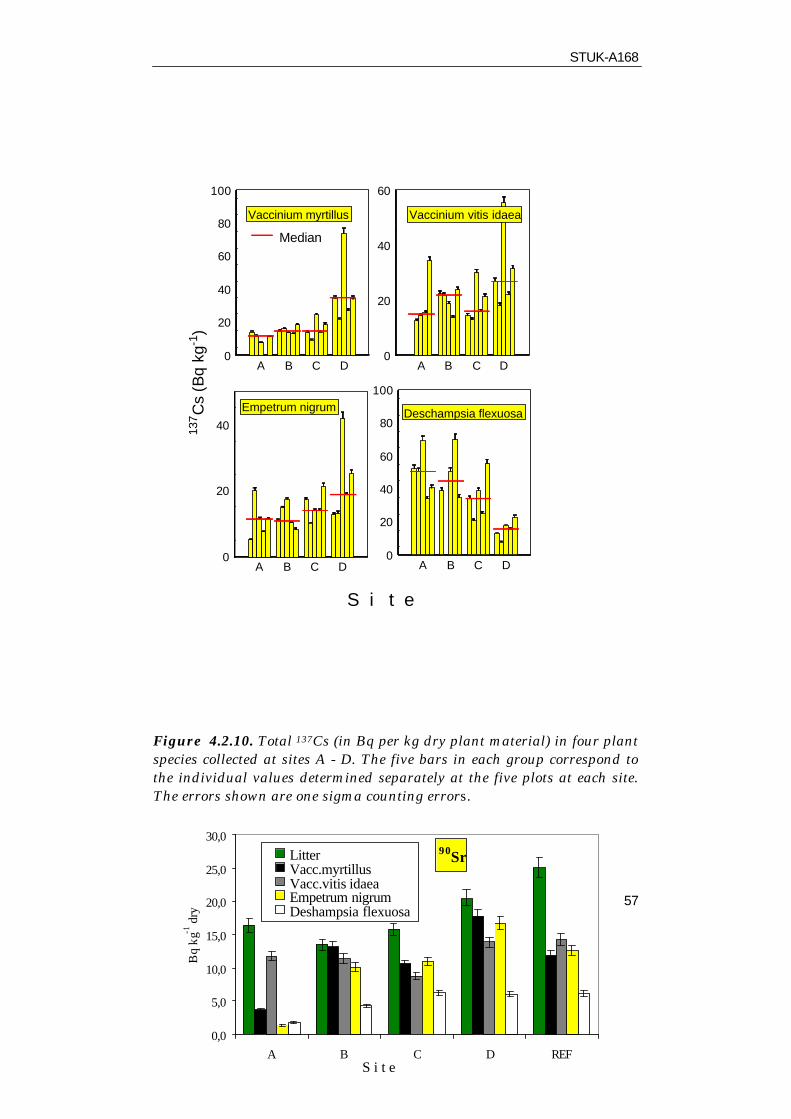
STUK-A168
57
Figure 4.2.10. Total 137Cs (in Bq per kg dry plant material) in four plantspecies collected at sites A - D. The five bars in each group correspond tothe individual values determined separately at the five plots at each site.The errors shown are one sigma counting errors.
A B C D0
20
40
60
80
100
Vaccinium myrtillus
Median
A B C D0
20
40
60
Vaccinium vitis idaea
A B C D
S i t e
0
20
40137C
s (B
q kg
-1)
Empetrum nigrum
A B C D0
20
40
60
80
100
Deschampsia flexuosa
90Sr
0,0
5,0
10,0
15,0
20,0
25,0
30,0
A B C D REFS i t e
Bq
kg-1
dry
LitterVacc.myrtillusVacc.vitis idaeaEmpetrum nigrumDeshampsia flexuosa

STUK-A168
58
Figure 4.2.11. Total 90Sr (in Bq per kg dry plant material) in four plantspecies. To obtain sufficient material for the analysis, these plants werecollected around the plots at each site (P-samples). The errors shown areone sigma counting errors.
Figure 4.2.12. Total 239+240Pu (in mBq per kg dry plant material) in fourplant species. To obtain sufficient material for the analysis, these plantswere collected around the plots at each site (P-samples). The errors shownare one sigma counting errors.For 239+240Pu (see Figure 4.2.12), the activity concentrations vary be-tween about 2 and 20 mBq kg-1. With the exception of Vaccinium vitis-idaea, the concentrations of this radionuclide are higher at the A and B
239+240Pu
0,00
5,00
10,00
15,00
20,00
25,00
A B C D REFS i t e
mB
q kg
-1 d
ry
Vacc.myrtillusVacc.vitis-idaeaEmpetrum nigrumDeshampsia flexuosa
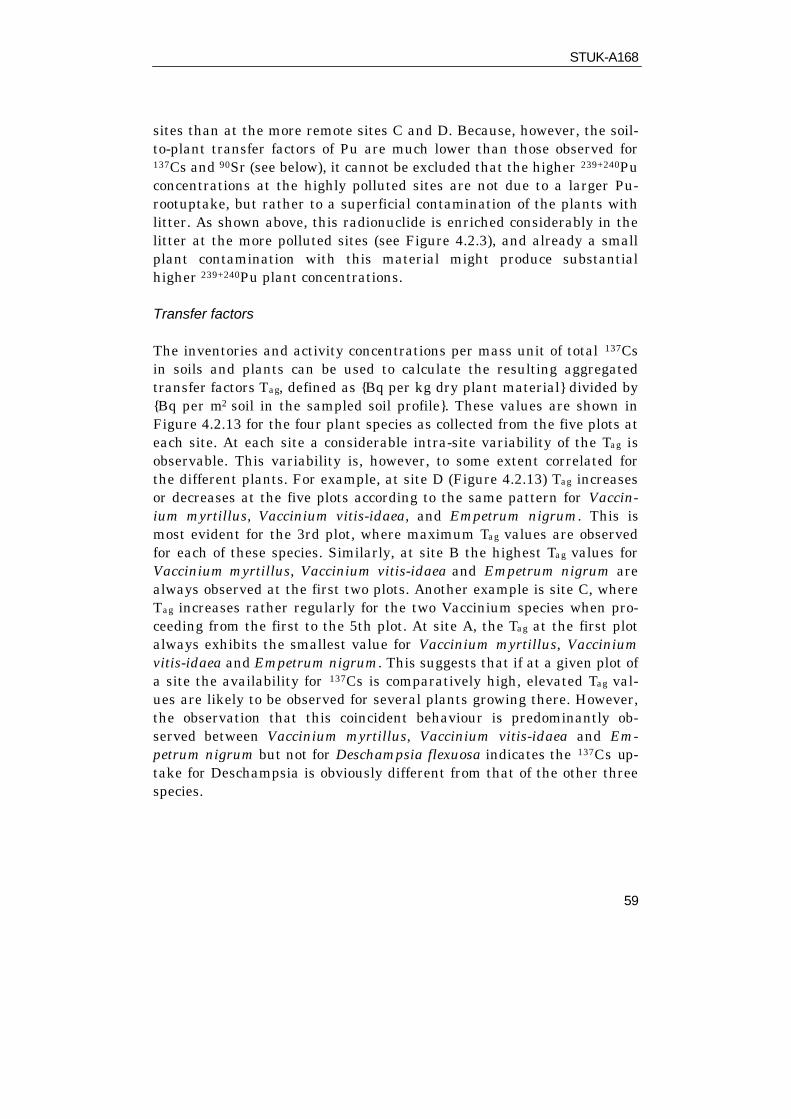
STUK-A168
59
sites than at the more remote sites C and D. Because, however, the soil-to-plant transfer factors of Pu are much lower than those observed for137Cs and 90Sr (see below), it cannot be excluded that the higher 239+240Puconcentrations at the highly polluted sites are not due to a larger Pu-rootuptake, but rather to a superficial contamination of the plants withlitter. As shown above, this radionuclide is enriched considerably in thelitter at the more polluted sites (see Figure 4.2.3), and already a smallplant contamination with this material might produce substantialhigher 239+240Pu plant concentrations.
Transfer factors
The inventories and activity concentrations per mass unit of total 137Csin soils and plants can be used to calculate the resulting aggregatedtransfer factors Tag, defined as {Bq per kg dry plant material} divided by{Bq per m2 soil in the sampled soil profile}. These values are shown inFigure 4.2.13 for the four plant species as collected from the five plots ateach site. At each site a considerable intra-site variability of the Tag isobservable. This variability is, however, to some extent correlated forthe different plants. For example, at site D (Figure 4.2.13) Tag increasesor decreases at the five plots according to the same pattern for Vaccin-ium myrtillus, Vaccinium vitis-idaea, and Empetrum nigrum. This ismost evident for the 3rd plot, where maximum Tag values are observedfor each of these species. Similarly, at site B the highest Tag values forVaccinium myrtillus, Vaccinium vitis-idaea and Empetrum nigrum arealways observed at the first two plots. Another example is site C, whereTag increases rather regularly for the two Vaccinium species when pro-ceeding from the first to the 5th plot. At site A, the Tag at the first plotalways exhibits the smallest value for Vaccinium myrtillus, Vacciniumvitis-idaea and Empetrum nigrum. This suggests that if at a given plot ofa site the availability for 137Cs is comparatively high, elevated Tag val-ues are likely to be observed for several plants growing there. However,the observation that this coincident behaviour is predominantly ob-served between Vaccinium myrtillus, Vaccinium vitis-idaea and Em-petrum nigrum but not for Deschampsia flexuosa indicates the 137Cs up-take for Deschampsia is obviously different from that of the other threespecies.
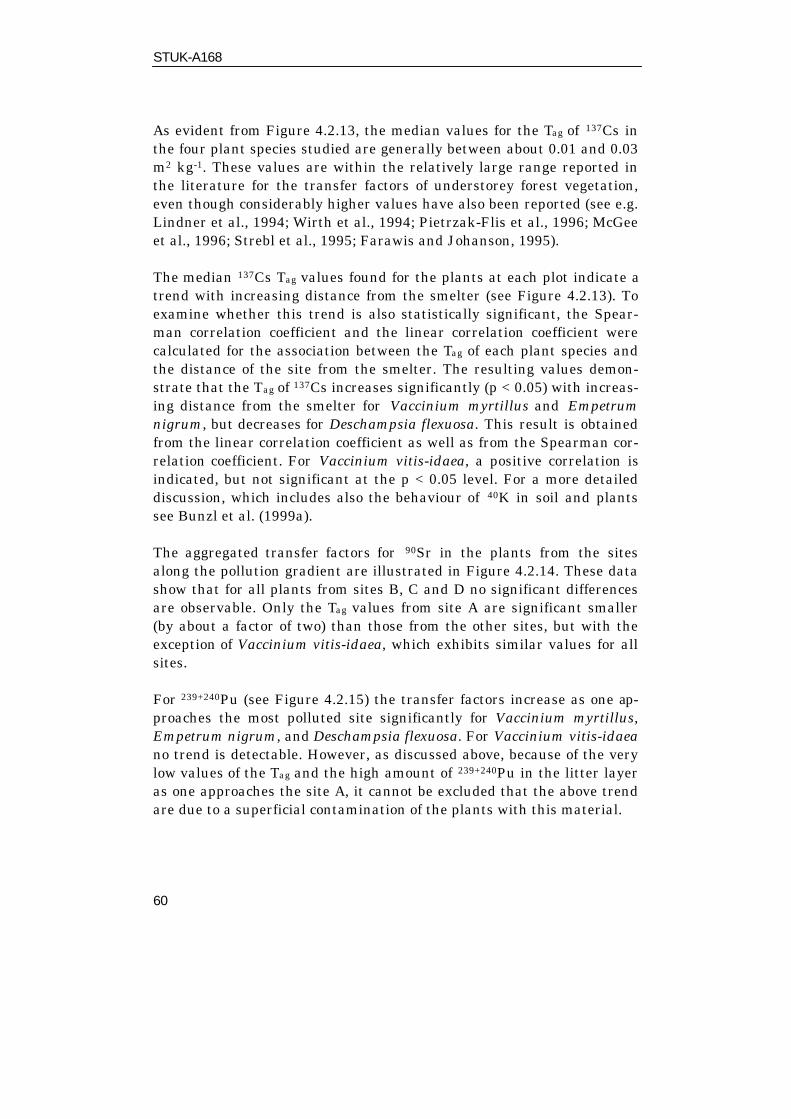
STUK-A168
60
As evident from Figure 4.2.13, the median values for the Tag of 137Cs inthe four plant species studied are generally between about 0.01 and 0.03m2 kg-1. These values are within the relatively large range reported inthe literature for the transfer factors of understorey forest vegetation,even though considerably higher values have also been reported (see e.g.Lindner et al., 1994; Wirth et al., 1994; Pietrzak-Flis et al., 1996; McGeeet al., 1996; Strebl et al., 1995; Farawis and Johanson, 1995).
The median 137Cs Tag values found for the plants at each plot indicate atrend with increasing distance from the smelter (see Figure 4.2.13). Toexamine whether this trend is also statistically significant, the Spear-man correlation coefficient and the linear correlation coefficient werecalculated for the association between the Tag of each plant species andthe distance of the site from the smelter. The resulting values demon-strate that the Tag of 137Cs increases significantly (p < 0.05) with increas-ing distance from the smelter for Vaccinium myrtillus and Empetrumnigrum, but decreases for Deschampsia flexuosa. This result is obtainedfrom the linear correlation coefficient as well as from the Spearman cor-relation coefficient. For Vaccinium vitis-idaea, a positive correlation isindicated, but not significant at the p < 0.05 level. For a more detaileddiscussion, which includes also the behaviour of 40K in soil and plantssee Bunzl et al. (1999a).
The aggregated transfer factors for 90Sr in the plants from the sitesalong the pollution gradient are illustrated in Figure 4.2.14. These datashow that for all plants from sites B, C and D no significant differencesare observable. Only the Tag values from site A are significant smaller(by about a factor of two) than those from the other sites, but with theexception of Vaccinium vitis-idaea, which exhibits similar values for allsites.
For 239+240Pu (see Figure 4.2.15) the transfer factors increase as one ap-proaches the most polluted site significantly for Vaccinium myrtillus,Empetrum nigrum, and Deschampsia flexuosa. For Vaccinium vitis-idaeano trend is detectable. However, as discussed above, because of the verylow values of the Tag and the high amount of 239+240Pu in the litter layeras one approaches the site A, it cannot be excluded that the above trendare due to a superficial contamination of the plants with this material.

STUK-A168
61
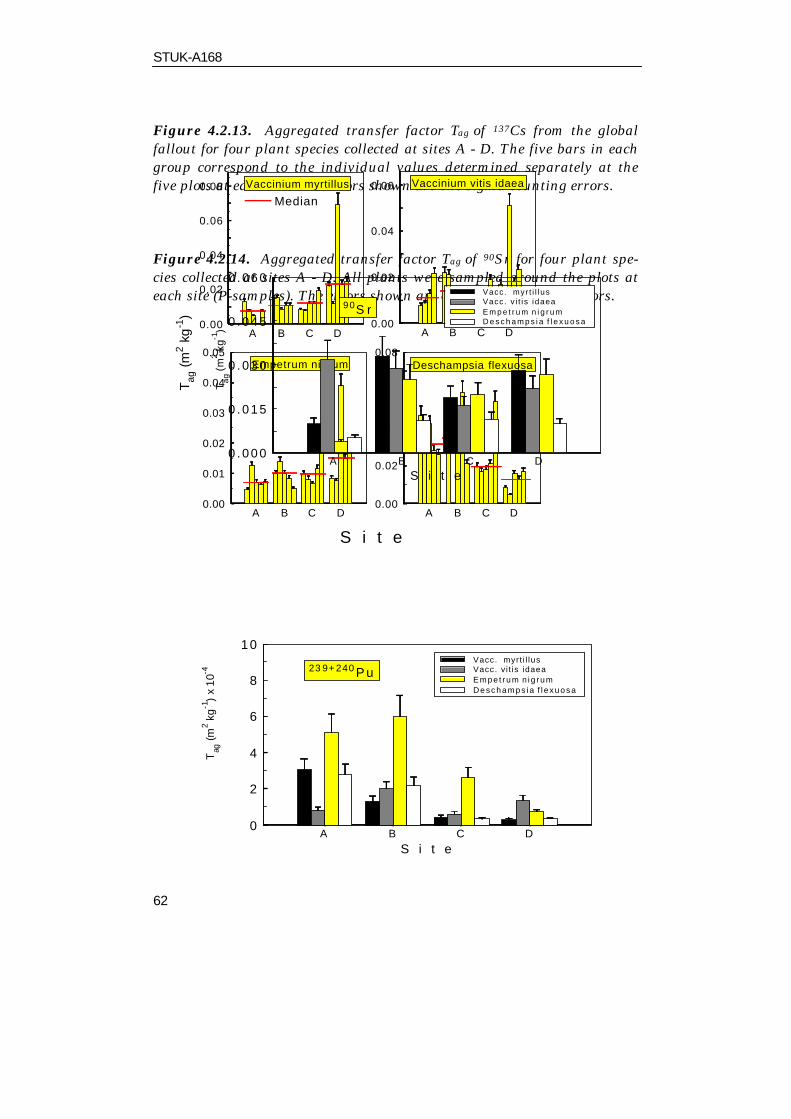
STUK-A168
62
Figure 4.2.13. Aggregated transfer factor Tag of 137Cs from the globalfallout for four plant species collected at sites A - D. The five bars in eachgroup correspond to the individual values determined separately at thefive plots at each site. The errors shown are one sigma counting errors.
Figure 4.2.14. Aggregated transfer factor Tag of 90Sr for four plant spe-cies collected at sites A - D. All plants were sampled around the plots ateach site (P-samples). The errors shown are one sigma counting errors.
A B C DS i t e
0
2
4
6
8
10
Tag
(m2 k
g-1)
x 10
-4
Vacc. myrt i l lusVacc. v i t is idaeaEmpe t rum n ig rumDeschamps ia f l exuosa
23 9+ 240 P u
A B C D0.00
0.02
0.04
0.06
0.08 Vaccinium myrtillus
Median
A B C D0.00
0.02
0.04
0.06 Vaccinium vitis idaea
A B C D
S i t e
0.00
0.01
0.02
0.03
0.04
0.05
T ag (m
2 kg-1
)
Empetrum nigrum
A B C D0.00
0.02
0.04
0.06
0.08Deschampsia flexuosa
A B C DS i t e
0 . 0 0 0
0 . 0 1 5
0 . 0 3 0
0 . 0 4 5
0 . 0 6 0
T ag (
m2 k
g-1)
Vacc. myr t i l lusVacc. v i t i s idaeaE m p e t r u m n i g r u mD e s c h a m p s i a f l e x u o s a
90S r

STUK-A168
63
Figure 4.2.15. Aggregated transfer factor Tag of 239+240Pu for four plantspecies collected at 4 sites A - D. All plants were sampled around the plotsat each site (P-samples). The errors shown are one sigma counting errors.

STUK-A168
64
4.3. Discharge of 90Sr and 137Cs via runoff from Borealcatchments
Distribution in soil and estimated total deposition
The distributions of 137Cs and 90Sr in the two Russian sites RI and RIIand in the Finnish reference site RIII are illustrated in the figure 4.3.1aand 4.3.1b. The amounts of 137Cs and 90Sr in the ten samples of organicand mineral soil taken from the river banks (five on each side of thestream at each catchment area) are shown separately. The levels of in-dustrial pollution at the catchments RI and RII correspond the levels atthe soil/plant sites A and C and that of the reference catchment RIII thelevel at the reference soil/plant site (Ref).
The activity distribution of 137Cs and 90Sr
Horizontal distribution
The mean concentrations of 137Cs calculated using the ten samples oforganic and mineral soil are for the Russian sites RI, RII and the refer-ence site RIII 1.54, 1.42 and 1.86 kBqm-2, respectively. Also the respec-tive coefficients of variation for each of the three sites RI, RII and RIIIare almost the same: 0.35, 0.38 and 0.36. Furthermore, there is no statis-tically significant difference between these average levels, which implythat the effect from industrial pollution on the total 137Cs inventory is ofno significance in the studied areas.
For 90Sr the average activity concentration differ notably between mostpolluted site RI (131 Bq m-2) and the two other sites RII (447 Bq m-2) andRIII (487 Bq m-2). The coefficients of variation for 90Sr: RI=0.73, RII=0.37and RIII=0.24, are strongly related to position in the pollution gradient.The trend in the coefficient of variation indicates a substantial effect ofthe chemical pollution on the horizontal distribution pattern. Further-more, the analysis made below under Vertical distribution indicates thatthis is likely to be concomitant to a progressive loss of 90Sr with increas-ing pollution.
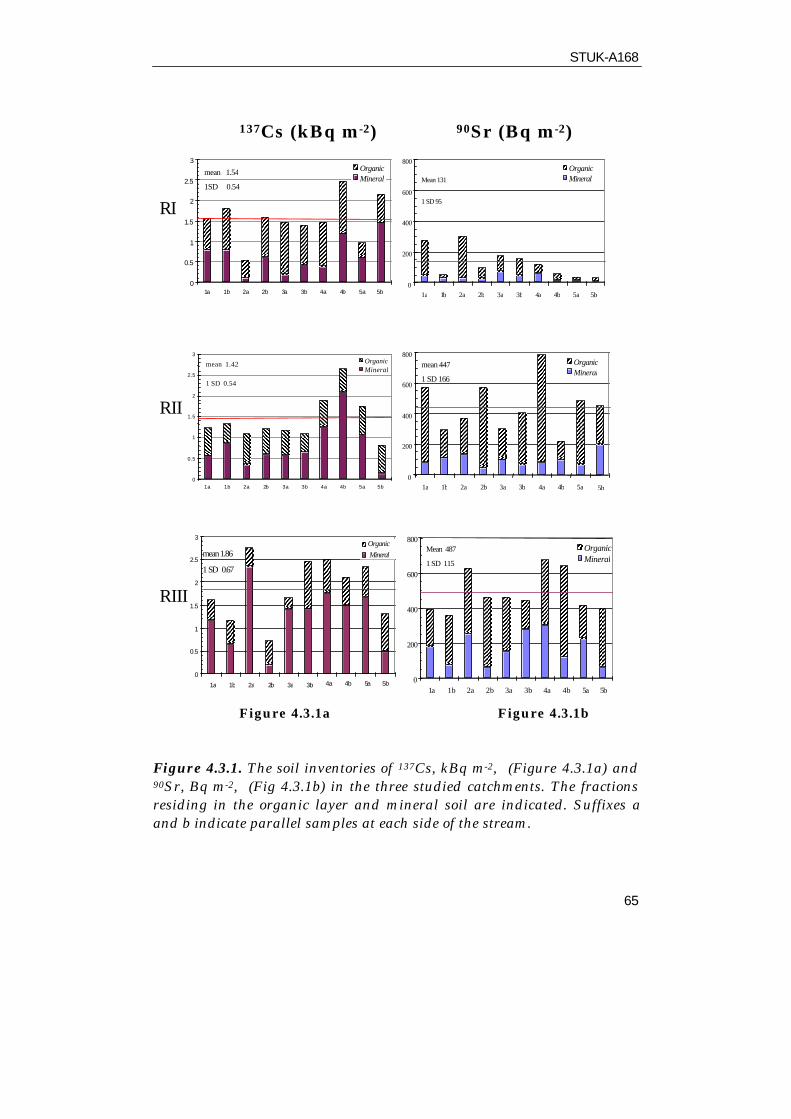
STUK-A168
65
137Cs (kBq m-2) 90Sr (Bq m-2)
Figure 4.3.1a Figure 4.3.1b
Figure 4.3.1. The soil inventories of 137Cs, kBq m-2, (Figure 4.3.1a) and90Sr, Bq m-2, (Fig 4.3.1b) in the three studied catchments. The fractionsresiding in the organic layer and mineral soil are indicated. Suffixes aand b indicate parallel samples at each side of the stream.
0
0.5
1
1.5
2
2.5
3
1a 1b 2a 2b 3a 3b 4a 4b 5a 5b
OrganicMineral
mean 1.54
1SD 0.54
0
200
400
600
800
1a 1b 2a 2b 3a 3b 4a 4b 5a 5b
OrganicMineralMean 131
1 SD 95
0
200
400
600
800
1a 1b 2a 2b 3a 3b 4a 4b 5a 5b
OrganicMineral
mean 447
1 SD 166
0
0.5
1
1.5
2
2.5
3
1a 1b 2a 2b 3a 3b 4a 4b 5a 5b
OrganicMineral
mean 1.42
1 SD 0.54
0
200
400
600
800
1a 1b 2a 2b 3a 3b 4a 4b 5a 5b
OrganicMineral
Mean 487
1 SD 115
0
0.5
1
1.5
2
2.5
3
1a 1b 2a 2b 3a 3b 4a 4b 5a 5b
Organic Mineralmean 1.86
1 SD 0.67
RI
RII
RIII
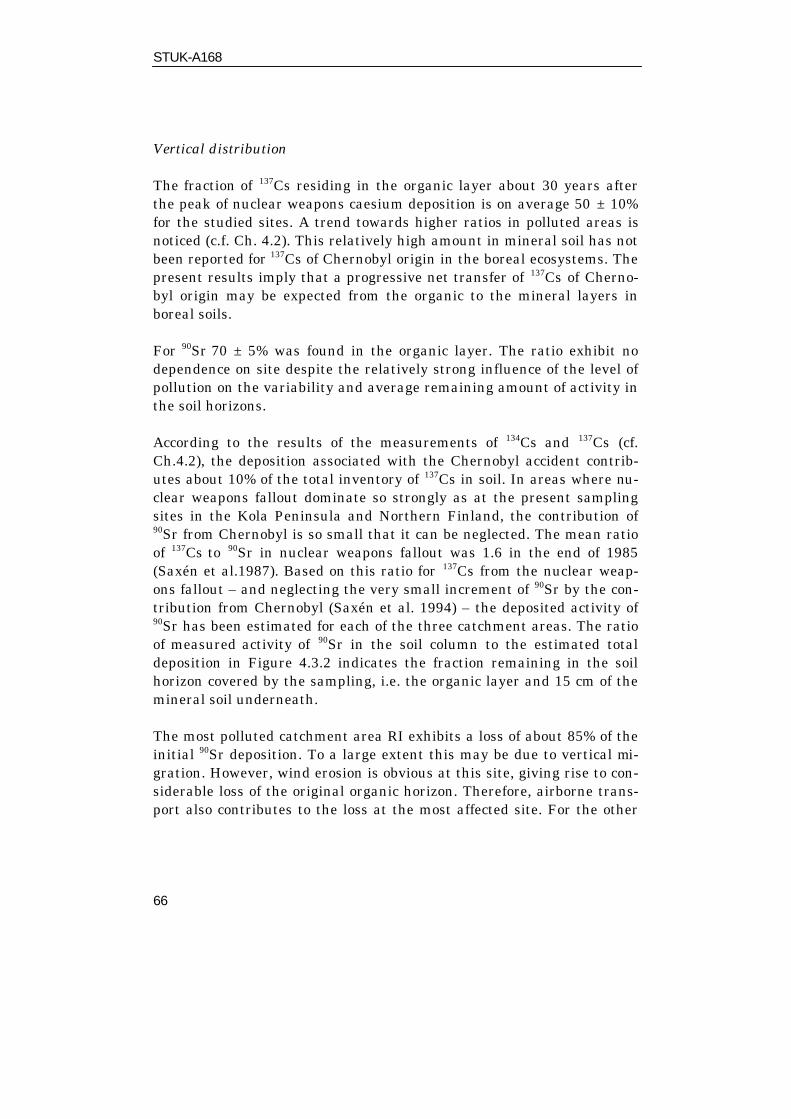
STUK-A168
66
Vertical distribution
The fraction of 137Cs residing in the organic layer about 30 years afterthe peak of nuclear weapons caesium deposition is on average 50 ± 10%for the studied sites. A trend towards higher ratios in polluted areas isnoticed (c.f. Ch. 4.2). This relatively high amount in mineral soil has notbeen reported for 137Cs of Chernobyl origin in the boreal ecosystems. Thepresent results imply that a progressive net transfer of 137Cs of Cherno-byl origin may be expected from the organic to the mineral layers inboreal soils.
For 90Sr 70 ± 5% was found in the organic layer. The ratio exhibit nodependence on site despite the relatively strong influence of the level ofpollution on the variability and average remaining amount of activity inthe soil horizons.
According to the results of the measurements of 134Cs and 137Cs (cf.Ch.4.2), the deposition associated with the Chernobyl accident contrib-utes about 10% of the total inventory of 137Cs in soil. In areas where nu-clear weapons fallout dominate so strongly as at the present samplingsites in the Kola Peninsula and Northern Finland, the contribution of90Sr from Chernobyl is so small that it can be neglected. The mean ratioof 137Cs to 90Sr in nuclear weapons fallout was 1.6 in the end of 1985(Saxén et al.1987). Based on this ratio for 137Cs from the nuclear weap-ons fallout – and neglecting the very small increment of 90Sr by the con-tribution from Chernobyl (Saxén et al. 1994) – the deposited activity of90Sr has been estimated for each of the three catchment areas. The ratioof measured activity of 90Sr in the soil column to the estimated totaldeposition in Figure 4.3.2 indicates the fraction remaining in the soilhorizon covered by the sampling, i.e. the organic layer and 15 cm of themineral soil underneath.
The most polluted catchment area RI exhibits a loss of about 85% of theinitial 90Sr deposition. To a large extent this may be due to vertical mi-gration. However, wind erosion is obvious at this site, giving rise to con-siderable loss of the original organic horizon. Therefore, airborne trans-port also contributes to the loss at the most affected site. For the other
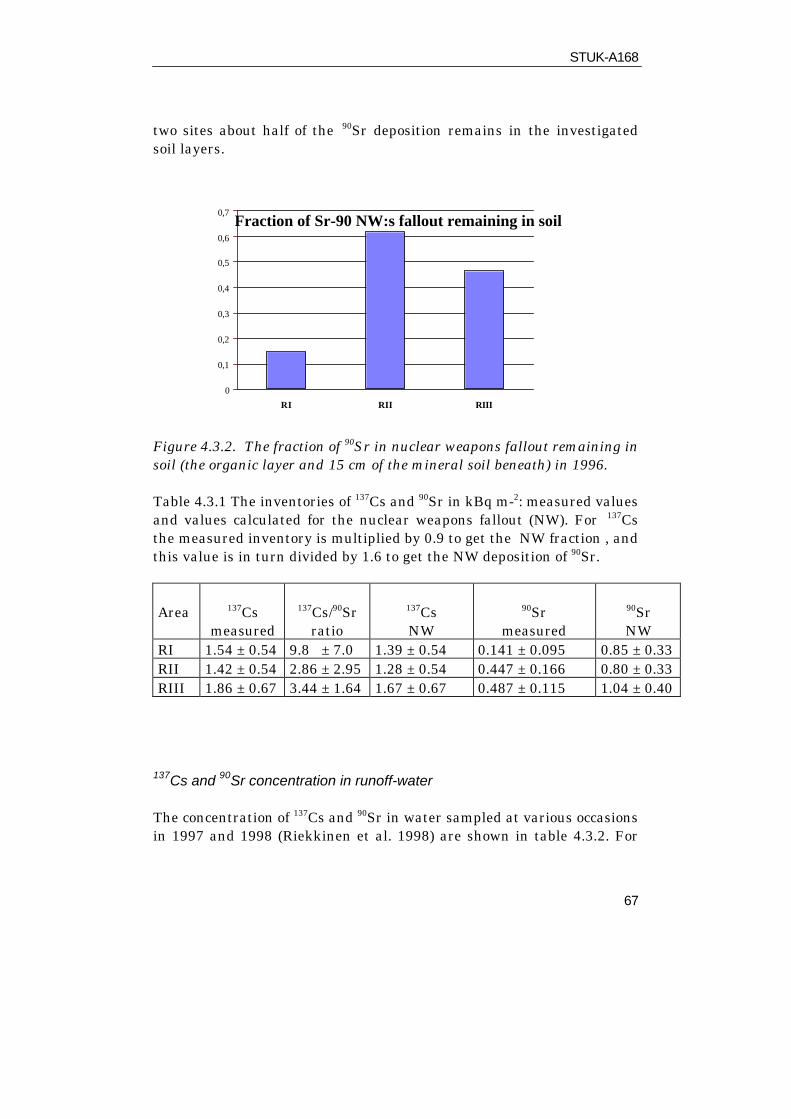
STUK-A168
67
two sites about half of the 90Sr deposition remains in the investigatedsoil layers.
Figure 4.3.2. The fraction of 90Sr in nuclear weapons fallout remaining insoil (the organic layer and 15 cm of the mineral soil beneath) in 1996.
Table 4.3.1 The inventories of 137Cs and 90Sr in kBq m-2: measured valuesand values calculated for the nuclear weapons fallout (NW). For 137Csthe measured inventory is multiplied by 0.9 to get the NW fraction , andthis value is in turn divided by 1.6 to get the NW deposition of 90Sr.
Area 137Csmeasured
137Cs/90Srratio
137CsNW
90Srmeasured
90SrNW
RI 1.54 ± 0.54 9.8 ± 7.0 1.39 ± 0.54 0.141 ± 0.095 0.85 ± 0.33RII 1.42 ± 0.54 2.86 ± 2.95 1.28 ± 0.54 0.447 ± 0.166 0.80 ± 0.33RIII 1.86 ± 0.67 3.44 ± 1.64 1.67 ± 0.67 0.487 ± 0.115 1.04 ± 0.40
137Cs and 90Sr concentration in runoff-water
The concentration of 137Cs and 90Sr in water sampled at various occasionsin 1997 and 1998 (Riekkinen et al. 1998) are shown in table 4.3.2. For
0
0,1
0,2
0,3
0,4
0,5
0,6
0,7
RI RII RIII
Fraction of Sr-90 NW:s fallout remaining in soil1996
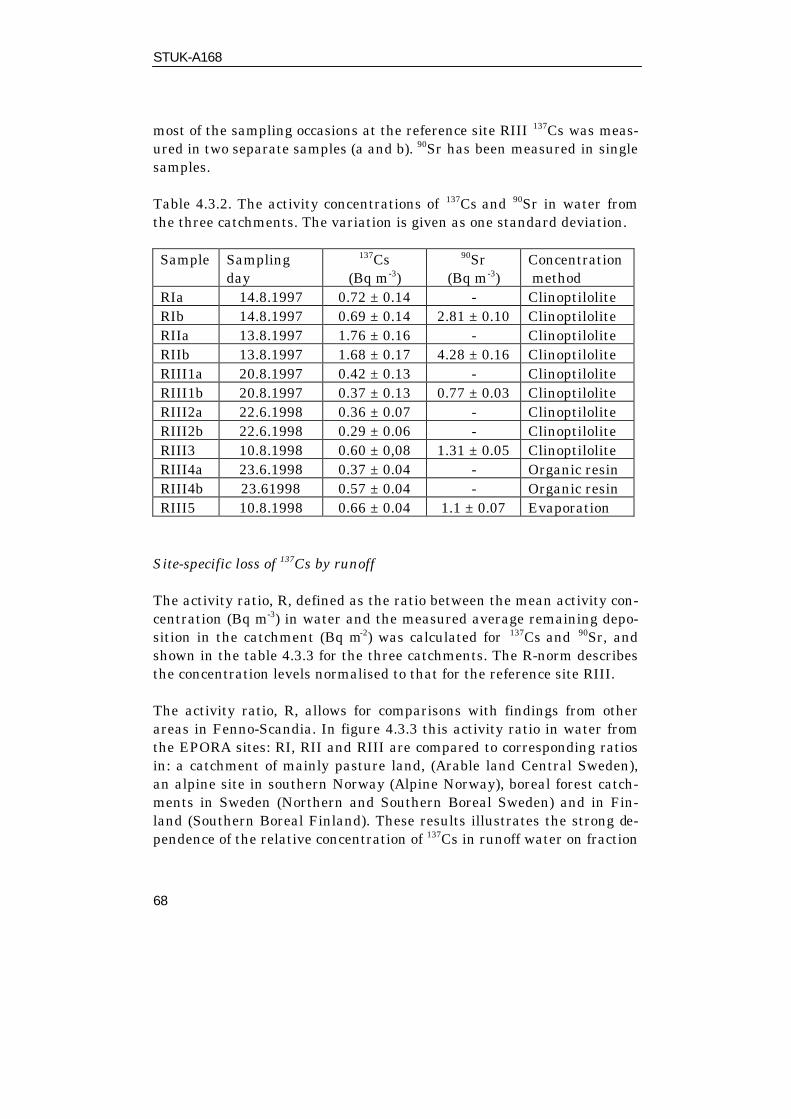
STUK-A168
68
most of the sampling occasions at the reference site RIII 137Cs was meas-ured in two separate samples (a and b). 90Sr has been measured in singlesamples.
Table 4.3.2. The activity concentrations of 137Cs and 90Sr in water fromthe three catchments. The variation is given as one standard deviation.
Sample Samplingday
137Cs(Bq m-3)
90Sr(Bq m-3)
Concentration method
RIa 14.8.1997 0.72 ± 0.14 - ClinoptiloliteRIb 14.8.1997 0.69 ± 0.14 2.81 ± 0.10 ClinoptiloliteRIIa 13.8.1997 1.76 ± 0.16 - ClinoptiloliteRIIb 13.8.1997 1.68 ± 0.17 4.28 ± 0.16 ClinoptiloliteRIII1a 20.8.1997 0.42 ± 0.13 - ClinoptiloliteRIII1b 20.8.1997 0.37 ± 0.13 0.77 ± 0.03 ClinoptiloliteRIII2a 22.6.1998 0.36 ± 0.07 - ClinoptiloliteRIII2b 22.6.1998 0.29 ± 0.06 - ClinoptiloliteRIII3 10.8.1998 0.60 ± 0,08 1.31 ± 0.05 ClinoptiloliteRIII4a 23.6.1998 0.37 ± 0.04 - Organic resinRIII4b 23.61998 0.57 ± 0.04 - Organic resinRIII5 10.8.1998 0.66 ± 0.04 1.1 ± 0.07 Evaporation
Site-specific loss of 137Cs by runoff
The activity ratio, R, defined as the ratio between the mean activity con-centration (Bq m-3) in water and the measured average remaining depo-sition in the catchment (Bq m-2) was calculated for 137Cs and 90Sr, andshown in the table 4.3.3 for the three catchments. The R-norm describesthe concentration levels normalised to that for the reference site RIII.
The activity ratio, R, allows for comparisons with findings from otherareas in Fenno-Scandia. In figure 4.3.3 this activity ratio in water fromthe EPORA sites: RI, RII and RIII are compared to corresponding ratiosin: a catchment of mainly pasture land, (Arable land Central Sweden),an alpine site in southern Norway (Alpine Norway), boreal forest catch-ments in Sweden (Northern and Southern Boreal Sweden) and in Fin-land (Southern Boreal Finland). These results illustrates the strong de-pendence of the relative concentration of 137Cs in runoff water on fraction
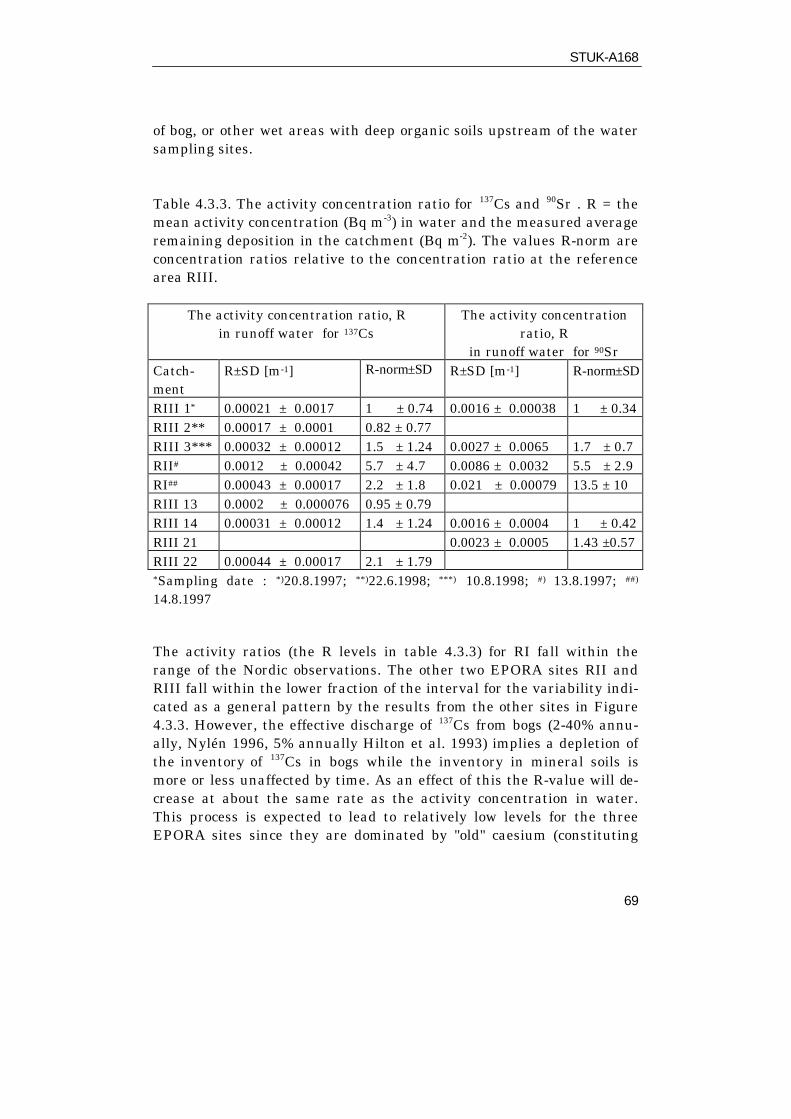
STUK-A168
69
of bog, or other wet areas with deep organic soils upstream of the watersampling sites.
Table 4.3.3. The activity concentration ratio for 137Cs and 90Sr . R = themean activity concentration (Bq m-3) in water and the measured averageremaining deposition in the catchment (Bq m-2). The values R-norm areconcentration ratios relative to the concentration ratio at the referencearea RIII.
The activity concentration ratio, Rin runoff water for 137Cs
The activity concentrationratio, R
in runoff water for 90SrCatch-ment
R±SD [m-1] R-norm±SD R±SD [m-1] R-norm±SD
RIII 1* 0.00021 ± 0.0017 1 ± 0.74 0.0016 ± 0.00038 1 ± 0.34RIII 2** 0.00017 ± 0.0001 0.82 ± 0.77RIII 3*** 0.00032 ± 0.00012 1.5 ± 1.24 0.0027 ± 0.0065 1.7 ± 0.7RII# 0.0012 ± 0.00042 5.7 ± 4.7 0.0086 ± 0.0032 5.5 ± 2.9RI## 0.00043 ± 0.00017 2.2 ± 1.8 0.021 ± 0.00079 13.5 ± 10RIII 13 0.0002 ± 0.000076 0.95 ± 0.79RIII 14 0.00031 ± 0.00012 1.4 ± 1.24 0.0016 ± 0.0004 1 ± 0.42RIII 21 0.0023 ± 0.0005 1.43 ±0.57RIII 22 0.00044 ± 0.00017 2.1 ± 1.79*Sampling date : *)20.8.1997; **)22.6.1998; ***) 10.8.1998; #) 13.8.1997; ##)
14.8.1997
The activity ratios (the R levels in table 4.3.3) for RI fall within therange of the Nordic observations. The other two EPORA sites RII andRIII fall within the lower fraction of the interval for the variability indi-cated as a general pattern by the results from the other sites in Figure4.3.3. However, the effective discharge of 137Cs from bogs (2-40% annu-ally, Nylén 1996, 5% annually Hilton et al. 1993) implies a depletion ofthe inventory of 137Cs in bogs while the inventory in mineral soils ismore or less unaffected by time. As an effect of this the R-value will de-crease at about the same rate as the activity concentration in water.This process is expected to lead to relatively low levels for the threeEPORA sites since they are dominated by "old" caesium (constituting
STUK-A168
70
about 90% of the present level). Levels of RI-corr, RII-corr and RIII-corrin Figure 4.3.3 are the corresponding ratios for the three EPORA catch-ments when corrected for an annual depletion rate 0.5 %. These valuesrepresent a predicted situation after about 30 years from the measure-ments. So they can be compared with the values obtained in the otherNordic studies, which were performed after approximately the samenumber of years from the main fallout period of the nuclear weaponstests. The corrected values are higher than the values calculated directlyfrom the measurements. Thus, with regard to the uncertainties involvedin this assessments there seems to be no notable effect of industrial pol-lution on the discharge of 137Cs in the studied catchments.
Site-specific loss of 90Sr by runoff
The inventory of 90Sr from the samples of organic and underlying 15 cmof mineral soil is much lower in the RI than in the other studied catch-ments (cf. Fig 4.3.2). This is probably not explained by differences indeposition in the catchments, since no significant variation is observedbetween the three catchment areas concerning the measured 137Cs depo-sition. The loss may rather to a large extent be ascribed to catchments(cf. Fig 4.3.2). This is probably not explained by differences in depositionin the catchments, since no significant variation is observed between thethree catchment areas concerning the measured 137Cs deposition. Theloss may rather to a large extent be ascribed to the increased mobility of90Sr under the influence of industrial pollution, allowing penetration todepths in soil below those covered by the sampling. The substantial winderosion at the most affected site (RI) gives evidence of the possible loss atcatchment area also by the atmospheric pathway.

STUK-A168
71
0,00001
0,0001
0,001
0,01
0,1
0 10 20 30 40 50 60
Bog fraction of the catchment area (%)
R (B
q m
-3 /
Bq
m-2
)
RI RI-corr RIIRII-corr RIII RIII-corrSouthern Boreal SF Northern Boreal S Alpine, NArable land, S Southern Boreal S Poly. (all obs)
Figure 4.3.3. The ratios of 137Cs activity concentration in water (Bq m-3) tothe average deposition (Bq m-2) in the catchment. Results for the Finnishreference catchment area RIII and the two Russian catchment areas (RIand RII) are illustrated in relation to the fraction of the catchment areaconsisting of bog. Corresponding results for some catchments in Norway(N), Sweden (S) and Finland (SF) are included for comparison. For ex-planation of the points RI-corr, RII-corr and RIII-corr are given in thetext.
A ratio of 90Sr and 137Cs concentration in runoff water at each catchment(cf. Table 4.3.4) has been used for analysing the site dependent behav-iour of 90Sr in relation to that of 137Cs. This ratio – illustrated in Figure4.3.3 – varied between 1.3 and 2.2 for the reference area in the samplesfrom 1997 and 1998, i.e. reflecting the expected higher mobility forstrontium in comparison with that for cesium. Despite the much highercontent of upstream peat area at the Russian catchment RII – known to
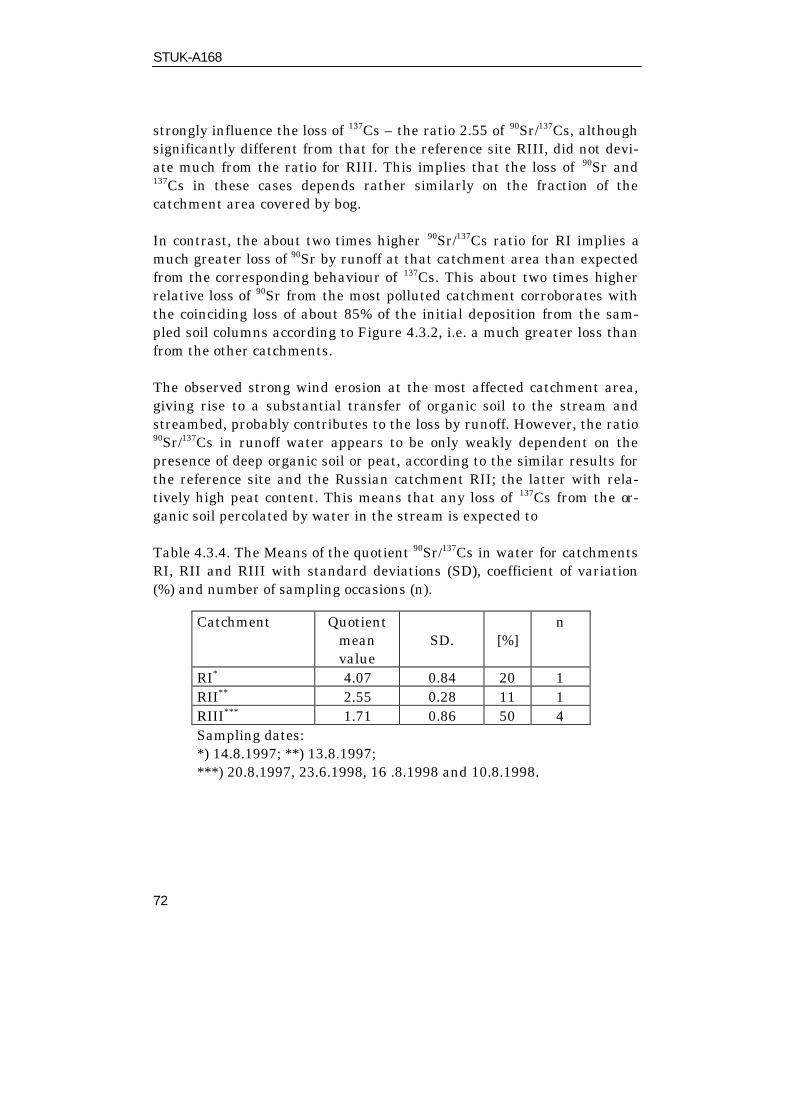
STUK-A168
72
strongly influence the loss of 137Cs – the ratio 2.55 of 90Sr/137Cs, althoughsignificantly different from that for the reference site RIII, did not devi-ate much from the ratio for RIII. This implies that the loss of 90Sr and137Cs in these cases depends rather similarly on the fraction of thecatchment area covered by bog.
In contrast, the about two times higher 90Sr/137Cs ratio for RI implies amuch greater loss of 90Sr by runoff at that catchment area than expectedfrom the corresponding behaviour of 137Cs. This about two times higherrelative loss of 90Sr from the most polluted catchment corroborates withthe coinciding loss of about 85% of the initial deposition from the sam-pled soil columns according to Figure 4.3.2, i.e. a much greater loss thanfrom the other catchments.
The observed strong wind erosion at the most affected catchment area,giving rise to a substantial transfer of organic soil to the stream andstreambed, probably contributes to the loss by runoff. However, the ratio90Sr/137Cs in runoff water appears to be only weakly dependent on thepresence of deep organic soil or peat, according to the similar results forthe reference site and the Russian catchment RII; the latter with rela-tively high peat content. This means that any loss of 137Cs from the or-ganic soil percolated by water in the stream is expected to
Table 4.3.4. The Means of the quotient 90Sr/137Cs in water for catchmentsRI, RII and RIII with standard deviations (SD), coefficient of variation(%) and number of sampling occasions (n).
Catchment Quotientmeanvalue
SD. [%]n
RI* 4.07 0.84 20 1RII** 2.55 0.28 11 1RIII*** 1.71 0.86 50 4Sampling dates:*) 14.8.1997; **) 13.8.1997;***) 20.8.1997, 23.6.1998, 16 .8.1998 and 10.8.1998.

STUK-A168
73
be accompanied by a two times higher loss of 90Sr. Furthermore, the lossof 37Cs according to Fig 4.3.3 does not reveal any influence beside thatlikely to be related to a very small peat area. This indicates that thecontributions of 137Cs and 90Sr from the atmospheric transfer of organicmatter to the stream are not the major cause to the notably changedratio 90Sr/137Cs in water. A more probable explanation for the relativelyhigh loss of 90Sr from the most polluted catchment is, therefore, thetransfer by shallow groundwater in the steep slopes of the stream.
5. MAIN ACHIEVEMENTS
STUK-A168
74
Simultaneous investigations of the extent and composition of industrialpollution and of the distribution and the dynamics of fallout radionu-clides in the same area formed the basis for the main achievements ofthe project. The polluted study area was selected in the surroundings ofthe huge Cu-Ni smelter in Monchegorsk, in the Kola Peninsula and thereference areas in Northern Finland. The prevailing soil type in the se-lected study area is a podzol with a low level of nutrients. For this rea-son, it could be expected that the ecosystem present there should be es-pecially vulnerable to any type of pollution.
Background data on the amount of industrial pollution, on the observ-able damage of the vegetation, and on the level of fallout of radionu-clides in the study area were used to select several sites along a pollu-tion gradient in different distances from the smelter. The main part ofsampling was carried out in the Kola Peninsula with the essential con-tribution of Russian scientists. The details are given in the publicationRahola et al. (1999)
A large amount of valuable and new information concerning the exis-tence and behaviour of heavy metals and sulphur was obtained in theproject. The results and the corresponding conclusions are given in thepublication of Thørring et al. (1999). They corroborate the level of pollu-tion in the study sites, describe its soil chemical characteristics as wellas the amounts of heavy metals and nutrients in soil and plants. Theresults also showed, for example, that when the concentrations of Cu andNi in organic soil layer increased, a similar trend was found in plants,but an opposite trend was noticed in concentrations of nutrients in soil.Especially interesting new information was obtained from the measuredconcentrations of stable Cs (Publication Haugland 1999) and Sr andtheir relations to the corresponding radioactive analogues.
The radionuclides studied in the project were fallout 137Cs, 90Sr and239+240Pu. They are the most important radionuclides when the long-termrisks of nuclear fallout are considered. The analysis of these radionu-clides in different soil layers and plants yielded for the first time infor-mation on their behaviour in the boreal ecosystems as a function of achemical pollution load. The results indicated that in the organic layeras well as in the whole root zone (organic and eluvial horizons), the frac-tion of the activity decreased when the amount of pollution on the site
STUK-A168
75
increased. The opposite behaviour, however, was found in the litterlayer. Main part of the total amounts deposited of 137Cs and 239+240Puwere found in the litter and soil layers sampled. However, at the pol-luted sites, a rather large fraction of 90Sr had percolated to deeper soillayers, and this fraction seemed to be related to the pollution load (Pub-lication Bunzl et al. 1999b).
The results also showed that the residence half-times of the radionu-clides in the root zone decreased when the pollution load at the site in-creased. With respect to the external dose rate in 1 m height from 137Csin the soil, the study revealed no significant differences between the ref-erence site and the polluted sites. Due to the importance of the organiclayer for retaining the 137Cs deposition and the special features of thesoil, the external of gamma radiation was, however, higher than ob-served for typical grasslands, e.g. in Bavaria, Germany, even when thedata were normalised to the same amount of radiocesium deposited. Thisshould be kept in mind when future risks of external radiation in north-ern boreal environment will be predicted after a possible new deposition.A more detailed description is given in publication (Publication Bunzl etal. 1999b).
Sequential extraction studies and radiochemical determinations of ra-diostrontium and plutonium are usually complicated and time consum-ing. As a consequence of the great number of samples to be analysed, thetime between soil sampling and pre-treatment before analysis can some-times be up to several months. Previous experience has shown that thismight affect, however, the results of extraction studies of some tracemetals from soils. Therefore, the effect of air drying and storage timewas also tested for the radionuclides 137Cs and 239+240Pu analysed in thisstudy. Fortunately, the results indicated that this effect was not observ-able in the sequential extractions of the radionuclides (Bunzl et al.1999c). The association studies of radionuclides with soil constituentsindicated that the exchangeable fraction of 137Cs in the organic soil de-creased with pollution load, but that for 90Sr and 239+240Pu the decreasewas not as apparent as for 137Cs. These sequential extraction studies ofthe soil samples gave for the first time information of speciation of ra-dionuclides in the arctic boreal environment (Puhakainen et al 1999).
STUK-A168
76
The effect of industrial pollution on the soil to plant transfer factors ofradionuclides proved to be dependent on both radionuclide and plantspecies studied. For crowberry (Empetrum nigrum) and blueberry (Vac-cinium myrtillus) the aggregated transfer factors decreased for 137Cs (Publication Bunzl et al. 1999a) and 90Sr at most polluted sites but in-creased in the case of 239+240Pu. For the forest hair grass (Deschampsiaflexuosa) the transfer factors decreased with pollution load for 90Sr butincreased for 137Cs and 239+240Pu. For lingonberry (Vaccinium vitis-idaea)no trend was detectable for any of the radionuclides studied
Results from the runoff study supported the soil profile data. The total137Cs inventory in the 0- 25 cm layer is not dependent on pollution load.For 90Sr, however, there is a progressive loss from the upper soil withincreasing pollution, with 85% of the initially deposited 90Sr lost fromthe catchment closest to the pollution source. Comparison of the activityratios of these nuclides in catchment soil samples and in runoff watershows that 90Sr is transferred by shallow groundwater to the streamsand not removed by wind erosion. To enable analysis of the very lowconcentrations of 90Sr and 137Cs in the streamwater a new preconcentra-tion method was developed. The method uses the natural zeolite clinopti-lolite as an ion exchanger. It was tested in the laboratory and used infield conditions.
6. CONCLUSIONS ON EFFECTS OF INDUSTRIAL POLLUTION ON THEDYNAMICS OF RADIONUCLIDES
Effect of pollution on the distribution, migration and associationof radionuclides in soil
STUK-A168
77
Main part of the 137Cs and 239+240Pu deposited by the global fallout wasfound at all sites to be still present in the upper soil layers sampled (0 -25 cm). For 90Sr, however, this is not the case. A considerable fraction ofthis radionuclide has been meanwhile transported to soil layers deeperthan sampled for the project. The extent of this loss to deeper soil layersis site dependent. While at most plots at the reference site 100% of thedeposited 90Sr are still present above the B2 horizon, this amount de-creases continually, the closer to the smelter the sites are located. Thus,at site A, where the soil is most strongly polluted, only about 40% of thedeposited 90Sr is still found in the 0 - 25 cm layer.
A strong dependence on the extent of industrial pollution is also foundfor the partitioning of the radionuclides among the following three soilcompartments: the litter layer, the root zone, and the soil below the rootzone: The contribution of all three radionuclides in the litter layer to thecorresponding total inventory increases continually from the referencesite to the most polluted sites. This effect is most pronounced for239+240Pu and least for 90Sr. For the root zone the opposite effect is ob-served: In this compartment the largest fraction of all radionuclides arefound at the reference site, and only rather small fractions at the morepolluted sites. As a consequence, only a small fractions of 137Cs but es-pecially of 90Sr of the total inventory are found in the layers below theroot zone at the reference site, but rather high fractions at the pollutedsites. Most likely, the main reason for these observations is that in thevicinity of the polluted sites the thickness of the litter layer increaseswhile that of the organic layers and the E-horizon, i.e. the root zone,decreases. Obviously, this is the result of the inhibited conversion of lit-ter into humic substances at the polluted sites.
Using a sequential extraction method to study the association of the ra-dionuclides with the soil constituents, the following conclusions can bedrawn:• A substantial effect of air-drying and subsequent sample storage up
to 30 weeks was not detectable for the sequential extraction of thefallout radionuclides 137Cs and 239+240Pu, and for stable Cs as demon-strated for the first time for the organic forest soil from the studyarea and a typical mineral grassland soil in Germany.
STUK-A168
78
• It is remarkable that quite similar extraction profiles were found forfallout 137Cs and stable Cs, even thought, for a given element, theseprofiles differed substantially in the studied and German soils. Thissuggests that isotopic equilibrium was obviously attained in bothsoils and might also imply that the availability of 137Cs for root up-take can be estimated from the uptake of the stable isotope, as sug-gested recently by Rühm et al. 1999 for fallout 137Cs several years af-ter deposition.
• Association of radionuclides in soil constituents was found to be in-fluenced by industrial pollution. In organic layer the amount of ex-changeable 137Cs decreased with pollution. In mineral layer pollutiondid not have any significant effect on association of 137Cs. Theamount of exchangeable 90Sr and 239+240Pu in organic layer also de-creased with pollution, but the phenomenon was not as significant asin the case of 137Cs. The explanation for the lower percentages of ex-changeable 137Cs, 90Sr and 242Pu might be the different compositionof organic layer. At most polluted sites the organic layer was verythin and contained more mineral material compared to the othersites.
Effect of pollution on the residence half-times of radionuclides inthe soil
The residence half-times of the radionuclides in the root zone of each sitedepend especially for 90Sr, but also for 137Cs and 239+240Pu significantlyon the industrial pollution. For all three radionuclides a considerablereduction of the residence half-times was found as one approaches themore polluted sites. Again, this effect is essentially due to the analogousdecrease of the thickness of the root zone at the more polluted sites.
In the soil layer below the root zone, no effect of the industrial pollutionon the residence half-times was detectable for 90Sr and 239+240Pu, onlythe residence half-time of 137Cs was somewhat longer at the most pol-luted site as compared to all other sites.
STUK-A168
79
Effect of pollution on the transfers of radionuclides from soils toplants
The effect of an industrial pollution on the transfer of fallout radionu-clides from soil to plant depends not only on the radionuclide consideredbut also on the plant species studied:
• The root-uptake of 137Cs, as characterised by the median aggregatedtransfer-factor Tag, decreased significantly with decreasing distancefrom the smelter for the plants Vaccinium myrtillus and Empetrumnigrum, but increased for Deschampsia flexuosa. For Vaccinium vi-tis-idaea a significant trend for the Tag was not observable. The me-dian 40K activity concentrations in these plants decreased also sig-nificantly with decreasing distance from the smelter for Vacciniummyrtillus, Empetrum nigrum, and also for Deschampsia flexuosa.For Vaccinium vitis-idaea such a continuos significant trend was notobservable. The results for the Cu-Ni polluted soils thus show i) thatthe soil-to-plant transfer of radiocesium can be significantly modi-fied, ii) that these modifications are quite plant specific, and iii) thatmodifications of the uptake of potassium do not always correspond tothose of radiocesium.
• The aggregated transfer factors for 90Sr from the sites along the pol-lution gradient show that for all plants from the lesser polluted sitesno significant differences are observable. Only the values from themost polluted site are significantly smaller (by about a factor of two)than those from the other sites, but with the exception of Vacciniumvitis-idaea, which exhibits similar values for all sites.
• For 239+240Pu the transfer factors increase as one approaches the mostpolluted site significantly for Vaccinium myrtillus, Empetrum nig-rum, and Deschampsia flexuosa. For Vaccinium vitis-idaea no trendis detectable. However, because of the very low values of the transferfactor for this element, and the high amount of 239+240Pu in the litterlayer as one approaches the more polluted sites, it cannot be ex-cluded that the above trends are due to a superficial contaminationof the plants with this material.
STUK-A168
80
It is interesting to examine the trends observed above for the radionu-clides along the pollution gradient with those found for the distributionof nutrients and heavy metals. A comparison reveals that not only thetransfer factors of e.g. 137Cs and 90Sr for some plants decrease with anincreased input of chemical pollutants but also the concentrations ofexchangeable nutrient cations K, Ca, and Mg in the Of horizon. Also, atthe more polluted sites, one observes in the organic layer higher con-tents of exchangeable cations Al, Fe, Ni, and Cu and a lower content ofH+ and base cations. One should note, however, that the analogoustrends in the transfer factors mentioned are not observed for the allplants and not for all radionuclides. This demonstrates that the trendsfound for the nutrients and other exchangeable cations can producequite different trends for some other plants and other radionuclides. Atpresent, it is not clear why some plants exhibit so different trends alongthe pollution gradient with respect to their root uptake, even for thesame radionuclide. Plant specific effects are obviously of considerableimportance, and demonstrate that a generalisation of the present resultsto other plants investigated here is hardly possible.
Effect of pollution on the loss from radionuclides from the areadue to run-off
The average deposition of 137Cs in the two catchments close to Monche-gorsk in Russia and in the reference site in Finland are not significantlydifferent according to results obtained and the major contribution (about90%) stems from the atmospheric nuclear weapons tests. The small con-tribution from the Chernobyl accident means that the average deposi-tion of 90Sr should also have been similar in all the studied catchments,and that the ratio of 137Cs to 90Sr deposition should be close to 1.6 forthe about 90% of nuclear weapons origin.
Of the total 90Sr deposition only about half is still present in the organichorizons and the upper 15 cm of the underlying mineral soil in the Fin-nish reference site (RIII) and the Russian catchment (RII) subjected toan intermediate level of chemical pollution. In the most affected catch-ment (RI) close to Monchegorsk only 15% of the estimated total deposi-tion of 90Sr remains at these depths in soil. Yet, the fraction in the or-ganic horizon of the total in the sampled soil is very similar at all three
STUK-A168
81
sites, indicating that loss from the organic fraction probably governs theresidence time and distribution between organic and mineral fractions ofthe sampled soil.
The activity concentrations of 137Cs in streamwater corroborate with arelationship based on the fraction of the upstream catchment area con-taining deep organic soil – found to be valid at several Nordic sites lack-ing significant impact from regional sources of chemical pollution. Thus,no significant influence of chemical pollution on the loss of 137Cs by run-off can be seen. On the contrary, in the most polluted Russian catchmentthe activity concentration of 90Sr in the streamwater is about twice ashigh as expected from the activity ratios 90Sr/137Cs in the Finnish refer-ence area and the Russian catchment subjected to an intermediate levelof chemical pollution. Furthermore, this coincides with a loss of about85% of the initial deposition from the sampled soil columns in the mostaffected Russian site, i.e. a much greater loss than from the othercatchments.
Severe wind erosion of the organic soil is obvious at the most affectedRussian site, giving rise to an airborne transfer to the streamwater.However, the loss of 137Cs in this catchment does not reveal any influ-ence beside that likely to be related to a very small peat area. This indi-cates that the contributions of 137Cs and 90Sr from the atmospherictransfer of organic matter to the streamwater are not the major cause tothe notably changed ratio 90Sr/137Cs in water. A more probable explana-tion for the relatively high loss of 90Sr from the most polluted catchmentis, therefore, the transfer by shallow groundwater in the steep slopes ofthe stream.
The increased rate of 90Sr transfer to the streamwater in the heavilypolluted catchment points to the importance of considering the concomi-tant input to downstream aquatic recipients in landscapes affected bychemical pollution and the potentially increased contamination in freshwater food-chains over fish to man.Effect of pollution on radiation doses
Radiation exposure of man and animals due to fallout radionuclides insoil and plants can result from inhalation of resuspended soil, ingestionof food, and - in the case of radiocesium - also from an external radiation

STUK-A168
82
exposure. While a calculation of the doses resulting from inhalation oringestion was not within the scope of this project, it was studied whetherthe industrial pollution affected the external gamma dose-rate in thestudy area.
The external gamma radiation due to 137Cs in the soil depends on thevertical distribution of this radionuclide in the soil as well as on the wetbulk density of the various soil layers. Because these data were deter-mined at all plots from all sites, we calculated the resulting gammadose-rate in 1 m height above ground according to Jacob et al. (1994).The resulting values are shown in Fig. 6.1 separately for 137Cs from theglobal fallout and from the Chernobyl fallout. For comparison, they aregiven for each site with respect to a total deposition of 1 kBq 137Cs persquare meter. The values shown are for each site the means and stan-dard deviations as obtained by calculating the dose-rates separately foreach of the five plots at each site.
A comparison of the external dose-rates calculated for the four pollutedsites A to D and the reference site shows:
• At each site the dose rate from Chernobyl-derived 137Cs (normalisedto a deposition of 1 kBq per m2) is about 1.6 times higher than thatfrom 137Cs from global fallout. This is not surprising, because Cher-nobyl-derived 137Cs is closer to the soil surface than 137Cs from theglobal fallout. Because, however, the total deposition of Chernobyl-derived 137Cs is only about 10% of the total 137Cs inventory of the soilthe total external dose-rate due to 137Cs in the soil results mainlyfrom 137Cs that has been deposited during the global fallout. Usingthe values determined for the depositions of 137Cs from both sourcesand the normalised dose-rates from Fig 6.1, a total external dose rateof about 1.5 nGy h-1 is obtained for all sites.
• Within local variations at each site, no significant differences for theexternal dose-rates are present at the various sites, although the ver-tical distribution of 137Cs in the soil is site dependent. However, be-cause of the very low wet bulk densities of the litter and the organichorizons in the study area (about 0.1 g cm-3) the attenuation of thegamma rays is quite small and different depth profiles of 137Cs in thesoil produce hardly any changes in the dose-rates at 1 m height
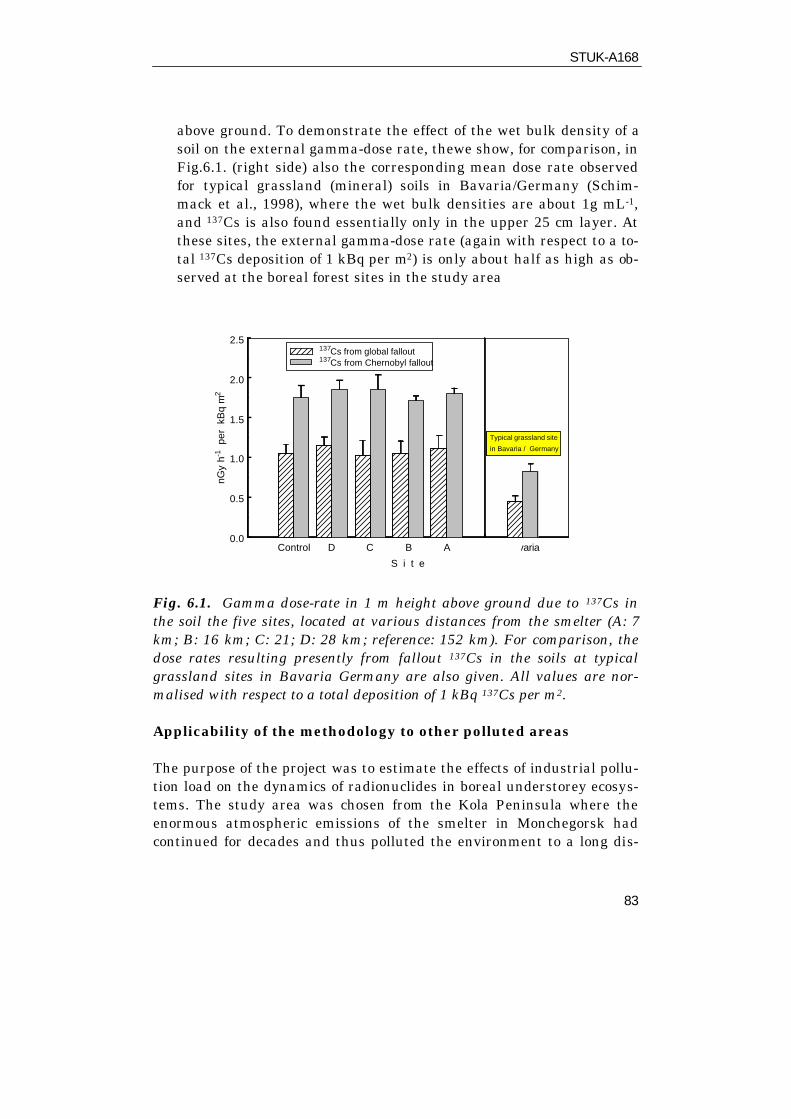
STUK-A168
83
above ground. To demonstrate the effect of the wet bulk density of asoil on the external gamma-dose rate, thewe show, for comparison, inFig.6.1. (right side) also the corresponding mean dose rate observedfor typical grassland (mineral) soils in Bavaria/Germany (Schim-mack et al., 1998), where the wet bulk densities are about 1g mL-1,and 137Cs is also found essentially only in the upper 25 cm layer. Atthese sites, the external gamma-dose rate (again with respect to a to-tal 137Cs deposition of 1 kBq per m2) is only about half as high as ob-served at the boreal forest sites in the study area
Control D C B A Bavaria
S i t e
0.0
0.5
1.0
1.5
2.0
2.5
nGy
h-1 p
er k
Bq
m2
137Cs from global fallout137Cs from Chernobyl fallout
Typical grassland site
in Bavaria / Germany
Fig. 6.1. Gamma dose-rate in 1 m height above ground due to 137Cs inthe soil the five sites, located at various distances from the smelter (A: 7km; B: 16 km; C: 21; D: 28 km; reference: 152 km). For comparison, thedose rates resulting presently from fallout 137Cs in the soils at typicalgrassland sites in Bavaria Germany are also given. All values are nor-malised with respect to a total deposition of 1 kBq 137Cs per m2.
Applicability of the methodology to other polluted areas
The purpose of the project was to estimate the effects of industrial pollu-tion load on the dynamics of radionuclides in boreal understorey ecosys-tems. The study area was chosen from the Kola Peninsula where theenormous atmospheric emissions of the smelter in Monchegorsk hadcontinued for decades and thus polluted the environment to a long dis-

STUK-A168
84
tance. The polluted study areas were chosen at different sites along thedecreasing pollution gradient and thus offered a possibility to study theeffects as a function of pollution load.
The radioecologicalstudies included determination of migration of radio-nuclides in soil, their association into different soil constituents, transferfrom soil to plants and runoff water as well as effects on radiation expo-sure rates. The long-lived radionuclides 137Cs, 90Sr and 239,240Pu from theglobal fallout from the nuclear weapons testing offered the possibility tostudy long-term changes in the ecosystem and as a consequence effectson the long-term radiation risks and are, in principle, as such applicableto other polluted environment. However, although the result showed theeffect of pollution on the radioecological quantities studied, they alsoshowed that the results are dependent on the type soil/plant ecosystemor soil/runoff water system.
Nevertheless, the methodology (i.e. the experimental approach and thedata evaluation) used or developed in thisstudy should be applicablealso for other polluted areas.. In addition, the methodology should bealso useful when evaluating the efficiency of restoration procedures ap-plied to areas which are polluted not only by radionuclides but also bychemicals.
Acknowledgement: This work carried out as part of the EC-project'Effect of industrial pollution on the distribution dynamics of radionu-clides in boreal understorey ecosystems' in the EC-framework 'Nuclearfission safety', Contract N° FI4P-CT96-0039.
7. PUBLICATIONS
Bergman R, Bunzl K, Jaakkola T, Rahola T, Steinnes E, Suomela M.Effect of industrial pollution on the distribution dynamics of radionu-clides in boreal understorey ecosystems. Presented as poster in theNATO workshop in Kiev in June 1998. Abstract available.
STUK-A168
85
Bunzl K, Albers BP, Schimmack W, Rissanen K, Suomela M, Puha-kainen M, Rahola T, Steinnes E. Soil to plan uptake of fallout 137Cs byplants from boreal areas polluted by industrial emissions from smelters.Sci. of the Total Environ.1999a (in print).
Bunzl K, Puhakainen M, Riekkinen I, Karhu P, Schimmack W, Heikki-nen T, Jaakkola T, Nikonov V, Pavlov V, Rahola T, Rissanen K,Suomela M, Tillander M, Äyräs M. Fallout 137Cs, 90Sr and 239+240Pu insoils polluted by heavy metals: Vertical distribution, residence half-times, and external gamma-dose rates. Submitted for publication in Env.Sci. & Tech. 1999c.
Bunzl K, Schimmack W, Schramel P, Suomela M. Effect of sample dry-ing and storage time on the extraction of fallout 239,240Pu, 137Cs andnatural 210Pb as well as of stable Cs, Pb and Mn from soils. Sci. of theTotal Environ.1999b (in print).
Haugland T. Cesium and other elements in a terrestrial ecosystem sub-ject to strong chemical pollution. Master thesis. Trondheim: NorwegianUniversity of Science and Technology, 1999.
Huikuri P. Sorption mechanisms of 90Sr, 137Cs and 239,240Pu in forest soiland transfer of these radionuclides from soil to vegetation in a forestenvironment. University of Helsinki, Laboratory of Radiochemistry,1997, (in Finnish).
Karhu P. Analysis of 90Sr in soil samples. Technical report, Universityof Helsinki, Laboratory of Radiochemistry, 1998. 37pp (in Finnish).
Karhu P. The effects of pH, organic matter and competing ions on themigration of anthropogenic radionuclides in soils and sediments. Masterthesis. University of Helsinki, Laboratory of Radiochemistry, 1998.
Nylén T, Bergman I, Bergman R, Nikonov V. A pilot study on the distri-bution of 137Cs between vegetation and soil in an industrial pollutiongradient at the Kola Peninsula. FOA-R-00402-861-SE. Umeå: NationalDefence Research Establisment, 1997.
STUK-A168
86
Puhakainen M, Heikkinen T, Rissanen K, Suomela M, Riekkinen I,Jaakkola T, Steinnes E, Thørring H. Effect of chemical pollution onforms of 137Cs , 90Sr and 239,240Pu in the artic soil studied by sequentialextraction ( Publication under preparation).
Rahola T, Albers B, Bergman R, Bunzl K, Jaakkola T, Nikonov V, Pav-lov V, Rissanen K, Schimmack W, Steinnes E, Suomela M, Tillander M,Äyräs M. General characterisation of the study area and definition ofexperimental protocols in the project 'Effect of industrial pollution on thedistribution dynamics of radionuclides in boreal understorey ecosys-tems'. STUK- A166, Helsinki: Radiation and Nuclear Safety Authority,1999.
Riekkinen I, Jaakkola T. Effect of industrial pollution on soil to planttransfer of plutonium in boreal forest in field experiment. To be submit-ted for publication.
Suomela M. Description and preliminary results of the project ’Effect ofIndustrial Pollution on the Distribution Dynamics of Radionuclides inBoreal Understorey Ecosystems (EPORA)’, Proceedings of the JointJapanese – Finnish Symposium on Future Problems of EnvironmentalRadiochemistry and Radioecology, Helsinki, Oct 19 – 20, 1998. (Inprint).
Thørring H, Steinnes E, Nikonov V, Rahola T, Rissanen K. A summaryof chemical data from the EPORA project. STUK-A167. Helsinki: Radia-tion and Nuclear Safety Authority, 1999.
8. REFERENCES
AMAP,Arctic Pollution Issues: A State of the Arctic Environment report,Oslo, Norway, 1997.
Arvela H, Markkanen M, Lemmelä H. Mobility survey of environmentalgamma radiation and fall-out levels in Finland after the Chernobyl acci-dent. Radiation Protection Dosimetry 1990; 32 (3): 177-184.

STUK-A168
87
Bartlett R, James B. Studying dried, stored soil samples - some pitfalls.Soil Sci. Soc. Am. J. 1980; 44: 721 – 724.
Bunzl K, Kracke W, Schimmack W. Vertical migration of 239+240Pu,241Am and 137Cs fallout in a forest soil under spruce. Analyst 1992; 117:469-474.
Bunzl K, Schimmack W, Belli M, Riccardi M. Sequential extraction offallout radiocesium from the soil: Small scale and large scale spatialvariability. J. Radioanal. Nucl. Chem. 1997; 226: 47-53.
Bunzl K, Albers BP, Schimmack W, Rissanen K, Suomela M, Puha-kainen M, Rahola T, Steinnes E. Soil to plant uptake of fallout 137Cs byplants from boreal areas polluted by industrial emissions from smelters.Sci. Total Environ. 1999a (in print).
Bunzl K, Puhakainen M, Riekkinen I, Karhu P, Schimmack W, Heikki-nen T, Jaakkola T, Nikonov V, Pavlov V, Rahola T, Rissanen K,Suomela M, Tillander M, Äyräs M. Fallout 137Cs, 90Sr and 239+240Pu insoils polluted by heavy metals: Vertical distribution, residence half-times, and external gamma-dose rates. Submitted for publication in Env.Sci. & Tech. 1999b.
Bunzl K, Schimmack W, Schramel P, Suomela M. Effect of sample dry-ing and storage time on the extraction of fallout 239,240Pu, 137Cs andnatural 210Pb as well as of stable Cs, Pb and Mn from soils. Sci. of theTotal Environ.1999c (in print).
Doudarev A A, Bylinkin SV, Chugunov VV, Miretsky G I, Popov AO,Rahola T, Jaakkola T, Rissanen K, Illukka E, Suomela M, Tillander M.The Radioecological situation in the reindeer herding area of the KolaPeninsula. Environmental Radioactivity in the Arctic, proceedings of theSecond International Conference on Environmental Radioactivity in theArctic. østerås: Scientific Committee of the International Conference onEnvironmental Radioactivity in the Arctic. 1995: 282 - 286.
Fawaris BH, Johanson KJ. A comparative study on radiocesium (137Cs )uptake from coniferous forest soil. J Environ. Radioact. 1995; 28: 313-26.
STUK-A168
88
Hardy EP, Krey PW, Wolchok HL. Global Inventory and Distribution ofFallou Plutonium. Nature 1973; 241 (5390) : 444-445.
Hakanen M, Jaakkola T. Distribution of Fallout Plutonium in Reindeer.In: Radioactive Foodchains in the Subarctic Environment. (Contract NoCH-E-(11-1-3011) of the US ERDA) Progress Report for the period Aug14, 1976 - Nov 14, 1977. Department of Radiochemistry, University ofHelsinki, 1977.
Hilton J, Livens FR, Spezzano P, Leonard DRP. Retention of radioactivecaesium by different soils in the catchment of a small lake. Sci. TotalEnviron. 1993; 129: 253 - 266.
Hinton TG, Malek MA, Sherony C, Clark SB. Operationally definedavailability from sequential extractions compared to plant uptake of137Cs and 90Sr. J. Radioanal. Nucl. Chem.1998; 235: 185-190.
Ikäheimonen TK, Rantavaara A, Moring M, Klemola S. Radionuclideanalysis of environmental field trial samples at STUK/II. Second reporton task FIN A 847 of the Finnish support programme to IAEA safe-guards, STUK-YTO-TR 87. Helsinki: Finnish Centre for Radiation andNuclear Safety, 1995.
Jacob P, Meckbach R, Paretzke HG, Likhtariov I, Los I, Kovgan L, Ko-marikov L. Attenuation effects on the gamma dose rates in air after ce-sium deposition on grasslands. Radiat. Environ. Biophys 1994; 33: 251-267.
Kersten M, Förstner U. Chemical Speciation in the Environment, UreAM, Davidson CM (Ed). London: Blackie Academic & Professional, 1995:Chapter 9.
Lindner G, Drissner J, Herrmann T, Hund M, Zech W, Zibold G, Zim-merer R. Seasonal and regional variations in the transfer of caesiumradionuclides from soil to roe deer and plants in a prealpine forest. SciTotal Environ 1994; 157: 189-196.
Lukina N, Nikonov V. Biogeochemical cycles in the northern forestssubjected to air pollution. Zergey V. Zonn (Ed). Apatity: Russian Acad-
STUK-A168
89
emy of Science, Kola Science centre, Institute of North Industrial Ecol-ogy Problems, 1996: Parts 1 and 2. (In Russian).
McGee EJ, Johanson KJ, Keatinge MJ, Synnott HJ, Colgan PA. Anevaluation of ratio systems in radioecological studies. Health Phys.1996; 70:215-221.
Miettinen JK. Radioactive foodchains in the subarctic environment. Fi-nal report. COO--3011-11, 1979. 31p.
Mäkinen A. Biomonitoring of atmospheric deposition in the Kola Penin-sula (Russia) and Finnish Lapland, based on the chemical analysis ofmosses. Helsinki: Ministry of Environment, Environmental Policy De-partment, 1994: Report 4.
Nylén T. Uptake, turnover and transport of radiocaesium in borealforest ecosystems. Thesis. FOA-R--96-00242-4.3--SE. Umeå: NationalDefence Research Establisment, 1996.
Nylén T, Bergman I, Bergman R, Nikonov V. A pilot study on the distri-bution of 137Cs between vegetation and soil in an industrial pollutiongradient at the Kola Peninsula. FOA-R--00402-861--SE. Umeå: NationalDefence Research Establisment, 1997.
Pietrzak-Flis Z, Radwan I, Rosiak L, Wirth E. Migration of 137Cs in soilsand its transfer to mushrooms and vascular plants in mixed forest. SciTotal Environ. 1996; 186: 243-250.
Rahola T, Albers B, Bergman R, Bunzl K, Jaakkola T, Nikonov V, Pav-lov V, Rissanen K, Schimmack W, Steinnes E, Suomela M, Tillander M,Äyräs M. General characterisation of the study area and definition ofexperimental protocols in the project 'Effect of industrial pollution on thedistribution dynamics of radionuclides in boreal understorey ecosys-tems'. STUK- A166. Helsinki: Radiation and Nuclear Safety Authority,1999.
Rantavaara A, Klemola S, Saxén R, Ikäheimonen TK, Moring M. Radio-nuclide analysis of environmental field trial samples at STUK. Reporton Task FIN A 847 of the Finnish Support Programme to IAEA Safe-
STUK-A168
90
guards, STUK-YTO-TR 75. Helsinki: Finnish Centre for Radiation andNuclear Safety, 1994.
Reponen A, Jantunen M, Paatero J, Jaakkola T. Plutonium fallout insouthern Finland after the Chernobyl accident. J.Environ. Radioactivity1993; 21: 119-130.
Reimann C, Äyräs M, Chekushin V, Bogatyrev I, Boyd R, de Caritat P,Dutter R, Finne TE, Halleraker JH, Jaeger OE, Kashulina G, Lehto O,Niskavaara H, Pavlov V, Räisänen ML, Strand T, Volden T. Environ-mental Geochemical Atlas of the Central Barents Region, 1998.
Riekkinen I, Tillander M. EPORA WP1: Sampling and pre-concentrationof water samples for WP4. Progress and base data report. 1998.
Riekkinen I, Jaakkola T, Tillander M. EPORA WP4, Preconcentration of137Cs and 90Sr in surface water samples in field conditions. Preliminaryreport. 1998.
Rigol A, Roig M, Vidal M, Rauret G. Sequential extractions for the studyof radiocesium and radiostrontium dynamics in mineral and organicsoils from Western Europe and Chernobyl. Environ. Sci. Technol.1999;33: 887 - 895.
Rissanen K, Matishov D. Radiocesium in lichen samples collected fromKola Peninsula and Russian arctic islands. Proceedings of the ThirdFinnish-Russian Symposium on Radiochemistry. Helsinki: Commissionof Scientific-Technological Co-operation between Finland and Russia,1994; 31: 146-148.
Ruhling Å, Steiness E, Berg T. Atmospheric heavy metal deposition innorthern Europe 1995. Report Nord 1996: 37, Copenhagen: Nordic coun-cil of Ministers, 1997.
Rühm W, Yoshida S, Muramatsu Y, Steiner M, Wirth E. Distributionpatterns of stable 133Cs and their implications with respect to the long-term fate of radioactive 134Cs and 137Cs in a semi-natural ecosystem. J.Environ. Radioact. 1999; 45: 253-270.
STUK-A168
91
Saxén R, Taipale TK, Aaltonen H. Radioactivity of wet and dry deposi-tion and soil in Finland after the Chernobyl accident in 1986. STUK-A57. Helsinki: Finnish Centre for Radiation and Nuclear Safety, 1987.
Saxén R, Aaltonen H, Ikäheimonen TK. Airborne and deposited radionu-clides in Finland in 1998 -1990. STUK-A109. Helsinki: Finnish Centrefor Radiation and Nuclear Safety, 1994.
Schimmack W, Steindl H, Bunzl K. Variability of water content and ofdepth profiles of global fallout 137Cs in grassland soils and the resultingexternal gamma-dose rates. Radiat. Environ. Biophys. 1998; 37: 27-33.
Schultz MK, Burnett WC, Inn KGW, Smith G J. Geochemical partition-ing of actinides using sequential chemical extractions. Comparison tostable elements. Radioanal. Nucl. Chem. 1998; 234: 251- 256.
Suomela M, Blomqvist L, Rahola T, Rantavaara A. Studies of environ-mental radioactivity in Finland in 1987. STUK-A74. Helsinki: FinnishCentre for Radiation and Nuclear Safety, 1991
Steinnes E. Environmental Pollution in the Arctic. The AMAP Interna-tional Symposium. Extended Abstracts Vol 1. Tromsø, Norway, 1997,pp.151.
Steinnes E. Flaten TP, Varskog P, Låg J, Bølviken B. Acidificationstatus of Norwegian forest soils as evident from large scale studies oforganic samples. Scand. J. Forest 1993; 8: 291-304.
Strebl F, Gerzabek MH, Karg V. Soil-Plant transfer in forest ecosystems.In: Proceedings of International Symposium on Environmental Impact ofRadioactive Releases. Österreichisches Forschungszentrum Seibersdorf,Bericht OEFZS-4746,Seibersdorf, Austria; 1995. 1-8.
Studies on Environmental Radioactivity in Finland 1984-1985. AnnualReport. STUK-A54, Helsinki: Finnish Centre for Radiation and NuclearSafety, 1987.
STUK-A168
92
Tessier A, Campbell PGC, Bisson M. Sequential extraction procedure forthe speciation of particulate trace metals. Anal. Chem. 1979; 51: 844 -851.
Thørring H, Steinnes E, Nikonov V, Rahola T, Rissanen K. Asummary ofchemical data from the EPORA project. STUK- A167. Helsinki: Radia-tion and Nuclear Safety Authority, 1999.
Wirth E, Hiersche L, Kammerer L, Krajewska G, Krestel R, Mahler S,Römmelt R. Transfer equations for caesium-137 for coniferous forestunderstorey plant species. Sci. Total Environ. 1994; 157: 163-170.
LIST OF PARTICIPANTS IN THE EPORA PROJECT
Matti Suomela, STUK – Radiation and NuclearTua Rahola, Safety Authority,Kristina Rissanen, P.O. Box 14, FIN-00881Marketta Puhakainen, HELSINKI, FinlandTarja Heikkinen
Ronny Bergman, National Defence ResearchThorbjörn Nylén Establishment, S-901 82 UMEÅ, Sweden
Kurt Bunzl, National Research Center for
STUK-A168
93
Wolfgang Schimmack Environment and Health,D-85764 NEUHERBERG,Germany
Timo Jaakkola, University of Helsinki, Iisa Riekkinen, FIN-00014 UNIVERSITY OFMichael Tillander HELSINKI, Finland
Eiliv Steinnes, Norwegian University of ScienceHåvard Thørring and Technology,
N-7491 TRONDHEIM, Norway.
Vyacheslav Nikonov Institute of North IndustrialEcology Problems, APATITY 184200
Russia
Vladimir Pavlov Central Kola Expedition184280 MONCHEGORSKRussia
Matti Äyräs Geological Survey of Finland (GTK), FIN-96101 ROVANIEMIFinland