effect of hydrothermal pre-treatment on methane production
TRANSCRIPT

Effect of hydrothermal pre-treatment on methane production during anaerobic digestion of thickened waste activated sludge
By
Suleman Khan
BSc Civil Engineering, Cecos university, 2012
A Major Research Project
presented to Ryerson University
in partial fulfillment of the
requirements for the degree of
Master of Engineering
in the program of
Civil Engineering
Toronto, Ontario, Canada, 2019
© Suleman Khan, 2019
ii
Author’s Declaration
I hereby declare that I am the sole author of this MRP. This is a true copy of the MRP, including
any required final revisions.
I authorize Ryerson University to lend this MRP to other institutions or individuals for scholarly
research.
I further authorize Ryerson University to reproduce this MRP by photocopying or by other means,
in total or in part, at the request of other institutions or individuals for scholarly research.
I understand that my MRP may be made electronically available to the public.

iii
Abstract
Effect of hydrothermal pre-treatment on methane production during anaerobic digestion of thickened waste activated sludge
Master of Engineering, 2019
Suleman Khan
Civil Engineering
Ryerson University
The effects of hydrothermal pre-treatment on the production of methane and biogas on thickened
waste activated sludge was investigated. This paper reviews the anaerobic digestion process and
its complexities, provides an overview of the different stages of the anaerobic digestion process,
different kinds of feedstocks and the essential and influential operating parameters such as
temperature, pH, organic loading rate, solid retention time and particle size.
This paper also demonstrates an overview of the natural and anthropogenic sources contributing
to methane in the atmosphere. It further provides a recommendation on essential practices and
methods required to enhance methane capture in the atmosphere.
Furthermore, an experimental setup consisting of batch anaerobic digestion was employed for
the sample analysis the purpose of this experimental research was to conduct a comprehensive
assessment of the effect of the hydrothermal pre-treatment on thickened waste activated sludge
and to determine the most optimum conditions to produce methane.
Keywords: Anaerobic digestion, Thickened waste-activated sludge, Hydrothermal Pre-treatment

iv
Acknowledgments
I would thank Almighty ALLAH, for all his blessings.
I want to thank Dr. Elsayed Elbeshbishy for his patient guidance, support, and advice throughout this
project. His expertise was the key to understanding and overcoming many of the difficulties I encountered
during my research.
I would also like to extend my gratitude to Dr. Ehssan Hosseini Koupaie for providing timely and accurate
knowledge that was paramount to the experimental work of this research.
I am grateful to Shabir Razvi, Farokh Laqa Kakar and Raman Sharma for the invaluable help with my
training and experimental set up and their insights for the analytical methods used in this study. Finally, to
my family, thank you for sharing this journey with me. You are the source of all inspiration.

v
Table of contents
AUTHOR’S DECLARATION ..................................................................................................... II
ABSTRACT ...............................................................................................................................III
ACKNOWLEDGMENTS ........................................................................................................... IV
LISTS OF TABLES .................................................................................................................. IX
LISTS OF FIGURES .................................................................................................................. X
1 INTRODUCTION ................................................................................................................ 1
1.1 Problem statement ........................................................................................................ 2
1.2 Aims and objective ........................................................................................................ 2
2 LITERATURE REVIEW ...................................................................................................... 2
2.1 Anaerobic digestion & impact on global warming ...................................................... 2
2.2 General process ............................................................................................................ 3
2.3 Pre-treatment methods in the AD process .................................................................. 5
2.3.1 Mechanical pre-treatment ............................................................................................ 5
2.3.2 Chemical pre-treatment ............................................................................................... 5
2.3.3 Biological pre-treatment ............................................................................................... 5
2.3.4 Thermal pre-treatment ................................................................................................. 5
3 BIOCHEMICAL PROCESS ................................................................................................ 6
3.1 Hydrolysis ...................................................................................................................... 7
3.2 Acidogenesis ................................................................................................................. 8

vi
3.3 Acetogenesis ................................................................................................................10
3.4 Methanogenesis ...........................................................................................................10
4 FACTORS AFFECTING AD ..............................................................................................11
4.1 Temperature..................................................................................................................11
4.2 pH ..................................................................................................................................12
4.3 Solid retention time ......................................................................................................12
4.4 Carbon to nitrogen ratio (C/N) .....................................................................................12
4.5 Organic loading rate (OLR) ..........................................................................................13
4.6 Effect of particle size ....................................................................................................13
4.7 Feedstock .....................................................................................................................13
4.8 Moisture content ..........................................................................................................13
4.9 Digester mixing ............................................................................................................14
5 SUITABLE WASTES AD ...................................................................................................14
5.1 The organic fraction of municipal solid wastes .........................................................15
5.2 Sewage sludge .............................................................................................................15
5.3 Industrial wastes and wastewater ...............................................................................15
5.4 Manure ..........................................................................................................................16
6 BY PRODUCT ...................................................................................................................16
6.1 Biogas composition .....................................................................................................17
6.2 Gas utilization ...............................................................................................................18

vii
6.3 Gas upgrading technologies .......................................................................................18
6.4 Digestate and utilization ..............................................................................................19
7 GLOBAL WARMING AND AD ..........................................................................................20
7.1 Biogas and global warming .........................................................................................21
7.2 Sources of methane .....................................................................................................22
7.3 Causes of methane.......................................................................................................25
7.3.1 Landfills ......................................................................................................................25
7.3.2 Natural gas and petroleum systems ............................................................................25
7.3.3 Methane released by coal mining ................................................................................25
7.3.4 Enteric fermentation ....................................................................................................25
7.3.5 Wastewater treatment .................................................................................................25
7.3.6 Handling manure management ...................................................................................26
7.3.7 Agriculture ..................................................................................................................26
7.4 Opportunities for methane capture .............................................................................26
8 EXPERIMENTAL WORK AND ANALYSIS .......................................................................27
8.1 Batch anaerobic digestion study ................................................................................27
8.2 Hydrothermal Pre-treatment ........................................................................................27
9 EXPERIMENTAL DESIGN AND PROCEDURE ................................................................29
9.1 Experiment groups .......................................................................................................29
9.2 Solubilization study ......................................................................................................29
9.3 Sample analyses ..........................................................................................................31
9.3.1 TS/VS .........................................................................................................................31
9.3.2 TSS/VSS ....................................................................................................................31
9.3.3 Chemical oxygen demand (Total / Soluble) .................................................................31
9.3.4 Ammonia ....................................................................................................................32

viii
9.3.5 Alkalinity .....................................................................................................................32
9.3.6 pH ...............................................................................................................................32
9.3.7 Carbohydrates (Total / Soluble) ..................................................................................33
10 RESULTS AND DISCUSSION .......................................................................................34
10.1 Effect of hydrothermal pre-treatment on methane production .................................41
11 CONCLUSION ...............................................................................................................44
REFERENCES .........................................................................................................................45
GLOSSARY ..............................................................................................................................49

ix
LISTS OF TABLES
TABLE 1: MAJOR ACIDS PRODUCE IN ACIDOGENESIS STAGE ............................................................ 8
TABLE 2: ACIDS, ALCOHOLS AND NITROGENOUS COMPOUNDS SUITABLE FOR DIRECT UTILIZATION BY
METHANOGENS ..................................................................................................................... 9
TABLE 3: FERMENTATION PRODUCTS USED INDIRECTLY AS SUBSTRATE BY METHANOGENS ..............10
TABLE 4: METHANE YIELD THROUGH AN AD OF MANURE ................................................................16
TABLE 5: COMPOSITION OF BIOGAS, NATURAL GAS AND LANDFILL GAS ...........................................17
TABLE 6: CONTRIBUTION OF DIFFERENT GHGS ............................................................................21
TABLE 7: COMPARISON OF CALORIFIC VALUES OF VARIOUS FUELS .................................................22
TABLE 8: GLOBAL ESTIMATES OF NATURAL METHANE SOURCE .......................................................23
TABLE 9: PROJECTIONS FOR GLOBAL ANTHROPOGENIC METHANE EMISSION BASED ON DATA FROM ..24
TABLE 10: EXPLANATION OF EXPERIMENTAL DESIGN .....................................................................29
x
LISTS OF FIGURES
FIGURE 1: GENERAL PROCESS OF ANAEROBIC DIGESTION .............................................................. 4
FIGURE 2: ANAEROBIC DIGESTION PATHWAY (BAJPAI, 2017) .......................................................... 7
FIGURE 3: METHANE PRODUCTION PATHWAYS (GERARDI, 2003) ...................................................11
FIGURE 4: TYPES OF MIXING METHODS FOR DIGESTORS (A) EXTERNAL, PUMPED RECIRCULATION
MIXING (B) INTERNAL MECHANICAL MIXING (C) EXTERNAL GAS RECIRCULATION MIXING ..............14
FIGURE 5: PARR 4848 PRESSURE REACTOR .................................................................................28
FIGURE 6: PARR 4848 CONTROLLER SHOWING TEMPERATURE GRAPH ...........................................28
FIGURE 7: EXPERIMENTAL ANAEROBIC DIGESTOR SETUP ...............................................................30
FIGURE 8: THERMO FISHER SCIENTIFIC CENTRIFUGE MACHINE .......................................................31
FIGURE 9: PH METER FISHER SCIENTIFIC MODEL AB 15 .................................................................32
FIGURE 10: TOTAL AND VOLATILE SUSPENDED SOLID OF RAW AND PRE-TREATED TWAS .................34
FIGURE 11: GRAPH FOR TCOD OF RAW AND PRE-TREATED TWAS ................................................36
FIGURE 12: GRAPH OR SCOD OF RAW AND PRE-TREATED TWAS .................................................37
FIGURE 13: GRAPH FOR T-CARBOHYDRATES OF RAW AND PRE-TREATED TWAS ............................38
FIGURE 14: GRAPH FOR S-CARBOHYDRATES OF RAW AND PRE-TREATED TWAS ............................39
FIGURE 15: FIGURE SHOWING DEGREE OF SOLUBILIZATION ...........................................................40
FIGURE 16: LINE GRAPH SHOWING THE CUMULATIVE METHANE YIELDS ...........................................42
FIGURE 17: BAR GRAPH SHOWING THE IMPROVEMENT OF METHANE ..............................................42

1
1 Introduction
Due to high water demand by growing population, industrialization, expansion and due to the
higher level of wastewater treatment an uncontrollable quantity of sludge is produced in the 21st
century from wastewater treatment plants (WWTP). It is reported about 230,000 megagrams per
year (Mg/yr.) of dry sludge is generated from the existing 700 municipal WWTPS in the province
of Quebec in Canada, and the production rate is expected to increase in the future. Sludge
management (treatment and disposal) is responsible for 60% of the total WWTP operation cost.
Furthermore, sludge is also a significant problem as it is a different medium mainly consisting of
water (>90%) and solids (<10%) (Sridhar Pilli., 2015).
The common sludge disposal techniques such as incineration, landfill, and land application used
over the years are neither economical nor sustainable and generate vast amounts of greenhouse
gases (GHGs). From the extensive research many researchers concluded that anaerobic
digestion (AD) is efficient and sustainable technology for sludge treatment/disposal (Pilli et al.,
2011). The benefits associated with AD technology is the renewable source of energy such as
biogas (Appels, 2011). AD is a course of the biological process which occurs in the absence of
oxygen through four sequential stages including hydrolysis, acidogenesis, acetogenesis, and
methanogenesis. Significant attention has been aroused due to the application of the biological
process for the treatment and conversation off Organic Fraction of Municipal Solid Waste to the
value-added product, because of the less environmental impact and for this reason, has grabbed
much attention in today's world. (Zhang, 2014)
Extensive research has been carried out around the world to establish an economically feasible
pre-treatment technology for enhancing the sludge degradability and to increase its soluble
fraction before AD. Among various methods of pre-treatment such as chemical, mechanical,
biological, physical and several combinations such as thermochemical, physiochemical and
mechanical-chemical the application of hydrothermal pre-treatment has shown to be more
promising in converting the particulate fraction of organic matter to the soluble phase (Cesaro,
2014) (Ariunbaatar J. P., 2014). The effectiveness of the hydrothermal pre-treatment for
enhanced solubilization and digestibility of various organic waste such as municipal sludge,
animal manure, and plant-based biomass has been proven in previous studies (Parthiba, 2017)
(Li, 2015).

2
1.1 Problem statement
Energy is a vital need for most living beings. The unsustainability of conventional energy together
with their pollutions to the earth made renewable energy as the prime need for the time being.
Renewable energy has a high value of commerciality as it can be used as a substitution for fuel
to generate electricity. Development of industrialisation and urbanisation and the overall increase
in population is trending to tremendously increase municipal waste generation. Municipal waste
is being a nuisance to the earth by volatile organic compounds. Emission, Leachate formation
and being jeopardy to the public health. As mention above, the municipal wastes are dumped too
many landfills which causes space constraints in small countries and losses of valuable lands
which are potential for other commercial activities. Air pollution issues are caused by other waste
management methods such as incineration and pyrolysis. The attempt of this study is to present
a comprehensive assessment of the effect of the hydrothermal pre-treatment on thickened waste
activated sludge, consequent impact on AD and to determine the optimum conditions to produce
biogas or methane.
1.2 Aims and objective
The aim of the study is to evaluate the pre-treatment, its effect on AD and determine the optimal
pre-treatment condition for methane from the thickened waste activated sludge (TWAS)
incoherence to solving the waste management. Furthermore, to design a lab anaerobic digester.
2 Literature review
2.1 Anaerobic digestion & impact on global warming
An AD is a biological process that occurs in the absence of oxygen and the occurrence of organic
material. The AD process is completed with the right association and grouping of microorganisms
such as fermentative bacterial, hydrogen-producing acetogenic bacterial, hydrogen consuming
acetogenic bacterial, carbon dioxide reducing methanogens and acetolactic methanogens
(Appels, 2011). The process uses these anaerobes to break down organic substances to biogas,
composed of methane CH4 and carbon dioxide CO2 and the contribution percentage of these are
60-70% methane, 30-40% carbon dioxide and <1% nitrogen as well some hydrogen sulfide and
ammonia are also produced. There is a rapid growth in the global energy demand an estimated
88% of the energy demand is met by fossil fuels; this demand will increase by a factor of two or
three as estimated (International Energy Agency, 2006). With the increase in demand for energy,
the concentration of greenhouse gases in the atmosphere is rapidly rising; fossil fuel derived CO2
emission being a significantly vital contributor. To support in minimizing the global warming and

3
impact of climate changes greenhouse gases emissions is recommended to be reduced to less
than half of global emission levels of 1990 (IPCC , 2000). Other global challenges such as the
security of energy supply, due to most undiscovered conventional oil and gas reserve being
concentrated in unstable regions; biogas waste, residue, and energy crops play an important role
in future. Biogas is a multipurpose renewable energy source, used for replacement of fossil fuels
in power and heat production, also used as gaseous vehicle fuel. Methane-rich biogas
(biomethane) replace natural gas as feedstock for producing chemical and material. Biogas
production through AD provides been assessed as the most energy efficient and environmentally
beneficial technology for bioenergy production and offers significant advantages over other forms
of bioenergy production. It can also significantly reduce greenhouse gases emissions in
comparison to fossil fuels by usages of other resources. An improved fertilizer available to crops
substituted for mineral fertilizer is a digestate. It is noted that in the year 2007, European energy
production from biogas reached 6 million tons of equivalent oil (Mtoe), and yearly increased by
more than 20% (EurObserv'er, 2008). Many countries around the world are producing biogas
energy, Germany has become the largest biogas producing country in the world due to the robust
development of agriculture biogas plants and farms. It is worth noting that approximately 4,000
agriculture biogas production units were operated on farms in Germany at the end of 2008.
Furthermore, in the European Union, 1, 500 million tons of biomass is digested anaerobically
every year, half of which is accounted for energy crops (Weiland, 2010).
2.2 General process
The anaerobic digestion process is used in the treatment of domestic and industrial wastewater.
In the process, both solid wastes, as well as liquid organic waste, can be anaerobically treated.
The aim of this process is not only to produce the methane but also reduce the volume of solid
waste. The organic waste that feeds the anaerobic process is composed of carbon, nitrogen, and
oxygen. Microorganism uses those organics as a substrate for growth and accommodates with
water to form carbon dioxide and methane (Jarvie, 2017). The actual breakdown of organics to
its end product methane is not performed by a single process but occurs in different steps which
were already described above.
The process of the AD is divided into four stages: I. Pre-treatment
II. Digestion
III. Gas upgrading
IV. Digestate treatment

4
The pre-treatment depends upon the type of feedstock like manures are mixed whereas MSW is
separated and sorted. In the second stage, different kind of digester depending on the solid
content, the digester can be dry or wet with different temperature and mixing devices. The
temperature plays a crucial role here as the efficiency of the digester depends on the temperature.
In the third stage, the impurities present can damage boilers and engine, so the gas was
upgraded. For the upgradation, hydrogen sulphide and water vapours are removed from the
boilers. The figure 4 below shows the process of digestion when two different types of waste are
mixed in digestion plant (Monnet, 2003).
Figure 1: General process of anaerobic digestion

5
2.3 Pre-treatment methods in the AD process
Pre-treatment aids in enhancing anaerobic digestion process and helps in reducing the overall
cost for post treatment of digestates. However, there are many methods used for pre-treatment,
but only a few are successfully applied at full scale and the most efficient method of pre-treatment
depends on the substrate’s characteristics.
2.3.1 Mechanical pre-treatment
In this treatment method, solid particles of the substrates are the breakdown in smaller particles.
So, it releases the cell compounds and increases the surface area for microbes’ activities. It
provides better contact between microbes and the substrate, thus enhances the AD process. It
also increases the methane production rate. Therefore, mechanical pre-treatments such as
sonication, lysis-centrifuge, fluid shear, collision, a high-pressure homogenizer, maceration, and
liquefaction are conducted to reduce the substrate particle size. (Ariunbaatar J. P., 2014).
2.3.2 Chemical pre-treatment
In this method, strong acids, alkalis, and oxidants are used to achieve the demolition of the organic
compounds of the substrates. AD process requires an adjustment in pH value for a smooth and
effective process. It can be achieved by increasing alkalinity. Thus, alkali pre-treatment is
preferred as a chemical method of pre-treatment. Acidic and oxidative pre-treatment methods
such as ozonation are used to improve the biogas production and increase the hydrolysis rate.
Chemical pre-treatments are not appropriate for easily biodegradable substrates. (Ariunbaatar J.
P., 2014).
2.3.3 Biological pre-treatment
Biological pre-treatment comprises both anaerobic and aerobic methods, as well as the addition
of specific enzymes such as peptidase, carbohydrate, and lipase to the AD system. Such
conventional pre-treatment methods are not very popular with Organic Fraction of Municipal Solid
Waste but have been applied widely on other types of Organic Solid Wastes such as Wastewater
Treatment Plants’ sludge and pulp and paper industries. (Ariunbaatar J. P., 2014).
2.3.4 Thermal pre-treatment
Thermal pre-treatment has been successfully applied at industrial scale. It leads to pathogen
removal, enhances dewatering performance and decreases the viscosity of the digestate. It also
improves the digestate handling. The critical impact of this pre-treatment is the disintegration of
the cell membranes, which results in solubilization of the organic compounds of the substrates. If

6
the temperature is higher, higher solubilization can be achieved in shorter treatment time. Some
of the thermal pre-treatment methods are steam heating, electric heating, and microwave heating.
If the temperature during this pre-treatment is higher than 170°C; it might lead to the creation of
chemical bonds between the particles. Higher temperature may result in the loss of volatile
organics and potential biomethane production from readily biodegradable substrates.
(Ariunbaatar J. P., 2014).
3 Biochemical process
The AD is a complicated and natural microbiological process where bacteria break down organic
matter in the absence of oxygen and yield biogas and digestate which mainly consist of methane
(CH4), 60-70% and carbon dioxide (CO2), 30-40% along with small amount of hydrogen sulfide
(H2S) by volume. Biogas is a renewable source of energy which can be used for heat production,
generating electricity and natural gas (Chen & Neibling, 2014). It can be classified into four stages
including hydrolysis, acidogenesis, acetogenesis, and methanogenesis; these processes occur
at the same time however with a different percentage of conversions. The total mass of waste is
significantly reducing by anaerobic fermentation and yields solid or liquid fertilizer and energy. It
can be maintained at different conditions depending on temperature, e.g., psychrophilic conditions
for landfill or sediments ranging from 12-16 °C, mesophilic conditions in anaerobic digestor
ranging from 35-37 °C and thermophilic conditions ranging from 55-60 °C. Disadvantages of
thermophilic anaerobic fermentation include a reduction in the process stability and dewatering
prosperities of fermented sludge as well as the destruction of pathogenic bacteria at elevated
temperature (Molino, 2013).

7
3.1 Hydrolysis
The first phase is referred to as hydrolysis or liquefaction and is an essential phase because of
its large organic molecules which are trying to be directly absorbed by a microorganism and used
as a food source. In hydrolysis or liquefaction phase fermentative bacteria transforms insoluble
complex organic matters such as cellulose into soluble molecules such as sugar, amino acid, and
fatty acid. Anaerobes such as bactericides, clostridia, and facultative bacteria are involved in this
phase. The complicated polymeric matter, e.g., cellulose hydrolyzes monomers to sugars or
peptides and amino acids from alcohols and proteins by hydrolytic enzymes (lipases, proteases,
cellulases, amylases, etc.) secreted by microbes. The hydrolytic activity plays an essential role in
the high organic content waste and may become rate limiting.
These limitations are overcoming by using some chemical reagents for industrial operation, to
improve the performance of the hydrolysis process. The chemicals used to enhance the first step
results in a shorter digestion time also provides high methane CH4 (Molino, 2013).
The chemical reaction of hydrolysis/liquefaction phase is:
Figure 2: Anaerobic digestion pathway (Bajpai, 2017)

8
Lipids Fatty acids Polysaccharides Monosaccharides Protein Amino Acids Nucleic Acids Purines & Pyrimidines
In summary, the hydrolysis process is the conversion of primary organic matter (proteins, fats,
and polysaccharides) into simpler monomers of amino acids, volatile fatty acid (VFA) and
monosaccharide.
3.2 Acidogenesis
Acidogenesis is also known as fermentation process is a process where the products from
hydrolysis stage (monosaccharides, amino acids, and volatile fatty acids) are transferred into
acetate, hydrogen, and CO2 comprising an estimate of 70% pool and the remaining pool
consisting of 30% is organic acid and alcohols. This process is known as acidogenesis due to the
main dominant product being acids and the foremost significant acetate that can be directly used
by the methanogenic microorganisms in methane production. Essential volatile fatty acids
produced in this stage are propionic, butyric, lactic and formic acid and a small amount of valeric
acid. Degrading complicated organic matter acetic acid and propionic acid add with 85% of
organic matter transformed into methane gas and the remaining 15 % results from degradation
of formic and butyric acid (Chernicharo, 2007); (Gerardi, 2003).
Table 1: Major acids produce in acidogenesis stage (Gerardi, 2003)
Name Formula
Acetate CH3COOH
Butanol CH3(CH2)2CH2OH
Butyrate CH3(CH2)2CH2COOH
Caproic acid CH3(CH2)4COOH
Formate HCOOH
Ethanol CH3CH2OH
Lactate CH3CHOHCOOH
Methanol CH3OH

9
Propanol CH3CH2CH2OH
Propionate CH3CH2COOH
Succinate HOOCCH2CH2COOH
Table 2: Acids, alcohols and nitrogenous compounds suitable for direct utilization by methanogens (Gerardi, 2003)
Substrate Chemical formula
Acetate CH3COOH
Formate HCOOH
Methanol CH3OH
Methylamine CH3NH2

10
3.3 Acetogenesis
Methanogenic microorganisms utilize some of the fermentation products. However, products like
propionic and butyric acids are transformed into acetate and then consumed by the methanogens.
Some of the fermentative substrate utilized by acetogens is converted into new acetogenic
biomass. Volatile fatty acids with longer carbon chain and ethanol including alcohols with longer
carbon chain, into acetate, hydrogen, and CO2 is the process of acetogenesis. Table 3
summarizes the central intermediates derived in the fermentation process for acetate production
in this stage.
Table 3: Fermentation products used indirectly as substrate by methanogens (Gerardi, 2003)
3.4 Methanogenesis
The end of the biochemical transformation of the organic substrate occurs in this stage where the
conversion of methane gas and newly synthesized biomass by both methanogens (acetoclastic
and hydrogenotrophic). The former group contributes with around 65% of the methane produced
and the later one with the rest 26% and the rest amount from methanol (Figure 4.), (Gerardi, 2003)
The final stage of the AD is acetoclastic methanogenesis in which acetoclastic methanogens
convert acetic acid into CH4 and CO2. This process generates two third of methane as described
below (Cavinato C, 2011). The production of CH4 from dissolved H2 and CO2 by slow-growing
hydrogenotrophic methanogens is called hydrogenotrophic methanogenesis. The remaining one-
third of methane is produced by methanogens as shown in the reaction below (Eq 8). (Cavinato
C, 2011); (Ostrem).
Substrate Chemical Formula
Ethanol CH3CH2OH
Butyrate CH3CH2CH2COOH
Propionate CH3CH2COOH

11
4 Factors affecting AD
Many factors are affecting the rate of the AD, some of the main elements include temperature,
pH, solid retention time, mixing, Carbon to Nitrogen ratio (C/N) (Havukainen, Anaerobic digestion:
Factors affecting anaerobic digestion process, 2018). These factors as described below in detail:
4.1 Temperature
Temperature is one of the primary elements influencing AD. The anaerobic process occurs in
three stages of temperature such as psychrophilic <20°C, mesophilic 25-40°C and thermophilic
45-60°C (Havukainen, Anaerobic digestion: Factors affecting anaerobic digestion process, 2018).
Most of the full-scale AD are operate at mesophilic temperature due to several advantages like
high organic removal rate, a high degree of degradation, and substantial stabilization. Increasing
the temperature range has several benefits such as increasing hydrolyzed soluble products
makes it accessible for microorganism, increasing dynamic chemical and biological process
makes physical and chemical properties favorable and improves diffusivity. Increasing liquid to
gas transfer enhances liquid to solid biomass separation, and rising temperature increases the
death rate of pathogenic bacteria and therefore reducing the time required for pathogen
destruction in the AD process. Important to note that high temperature (thermophilic) can have a
negative impact as well, such as increasing temperature can result in process disturbance in a
Figure 3: Methane production pathways (Gerardi, 2003)

12
thermophilic process (Havukainen, Anaerobic Digestion: Factors Affecting Anaerobic Digestion
Process) (Azeem khalid et., 2011).
4.2 pH
Another important factor impacting AD is the pH (power of Hydrogen). A pH value less than 7 is
an acidic solution, alkaline solution has a pH value higher than 7, and the neutral condition has a
pH value of 7. The AD requires two different pH values for the acidification process and
methanogenic process. Acidogenesis leads to accumulation of acid which causes the drop in pH
during fermentation, as digestion reaches Methanogenesis stage, pH value reaches above 8, and
once methane production stabilizes, pH remains between (7.2 – 8.2) (Shefali, 2002). Biogas
production requires three principal bacteria types such as bacteria responsible for hydrolysis,
fermentative bacteria, and methane-producing archaea. All these bacteria types need a different
range of pH; methanogenic archaea function at the pH range of 5.5 – 8.5 whereas fermentative
bacteria functions at the range of 8.5 down to pH 4. Acid accumulation occurs if volatile solids
loaded into digester increases sharply, this can cause more significant risk for digester failure the
acidogenic bacteria producing a high volume of organic acid lower the pH to below 5.
4.3 Solid retention time
The Solids Retention Time (SRT) is the average time the activated-sludge solids are in the
system. The SRT is an essential parameter for the activated-sludge to complete the degradation
process. The SRT is usually expressed in days, the retention time for waste treated ranges from
12 – 14 days for thermophilic digester and 15-30 days for the mesophilic digester.
4.4 Carbon to nitrogen ratio (C/N)
The presence of carbon and nitrogen in organic material is represented by C/N ratio. Carbon to
Nitrogen ration in anaerobic digesters is between 16:1- 15:1. Significantly variation of (C/N) ratio
could lead to deficiency of buffering capacity or insufficient nutrients for microorganism growth.
Higher the rate represents rapid consumption of nitrogen by methanogens and therefore results
in lower gas production, however, lower carbon to nitrogen ratio causes ammonia accumulation
causing it to be toxic to methanogenic bacteria (with pH value exceeding 8). Ideal carbon to
nitrogen ration can be achieved by mixing waste of low and high carbon to nitrogen ratio.

13
4.5 Organic loading rate (OLR)
Organic loading rate (OLR) is a measure of biological conversation capacity of the AD system.
Fast microbial growth occurs as a high OLR whereas microorganism starvation takes place at a
low OLR. OLR is a particularly important control parameter in continuous operations. Many plants
have reported system failure due to overloading. It is linked with retention time for any particular
feedstock and anaerobic reactor volume (Shefali, 2002). The degree of starvation of
microorganisms in biological systems is dependent on the OLR. At a high OLR, a fast-microbial
growth (but intoxication may occur with high quantities of organic matter) takes place whereas at
a low OLR microorganism starvation takes place. However, if the applied OLR is too high,
microorganism could not use up all produced organic acids and causes an acidic state of the
digester (Liu & Joo hwa, 2004).OLR is mainly determined based on feeding materials and reactor
temperature.
4.6 Effect of particle size
In the process of the AD, particle size has a strong influence. It is reported by a study conducted
by (Havukainen, Anaerobic Digestion: Factors Affecting Anaerobic Digestion Process) that the
particle size increased from 1.02 to 2.14 on anaerobic thermophilic food waste digestion. This
result indicates that smaller particle size yields to better dynamic process and methane.
4.7 Feedstock
Feedstocks are substances that are converted to methane through the process of anaerobic
digestion. The main components of organic wastes (feedstock) are carbon, oxygen, nitrogen,
hydrogen, and phosphorus. Feedstocks can be a range of different waste materials from easily
degradable wastewater to complex high-solid waste (Weiland, 2010).
4.8 Moisture content
Moisture content is the most crucial parameter of the process; because the process is designed
as per a certain range of moisture content in the digester. To keep the system working properly,
it is to maintain the right range of moisture content as per the type of the digester. Moisture content
of about 80% must be added to dry waste in order to meet the requirement for wet digesters.
Mass balance rather then direct measurement is used to determine moisture content at each step
in the process (Azeem khalid et., 2011).

14
4.9 Digester mixing
To achieve optimal performance for the AD, it is important to maintain a proper mixing. Mixing
cause near contact between the feed sludge and active biomass, yielding uniformity of different
parameters including temperature, substrate concentration, other chemicals, physical and
biological aspects all through the digester. Mixing also avoids the formation of surface scum layers
and the sludge deposition on the bottom of the tank. There are some methods of auxiliary mixing
including external pumped recirculation, internal mechanical mixing and internal gas mixing as it.
(Lise Appels J. B., 2008).
5 Suitable wastes AD
Feedstock consistent of AD comprises of organic matter. The suitable waste for AD includes solid
waste, sewage sludge, green waste, and organic industrial and commercial waste. Characteristic
of feedstock is vital to produce biogas and digested in the AD. Nitrogen, Carbon, COD, BOD,
volatile solids and total solids are the essential components of the feedstock. It is important to
note that toxicity may cause high concentration of BFAs and ammonia (NH3) which will further
leads to failure of AD.
Figure 4: Types of mixing methods for digestors (a) external, pumped recirculation mixing (b) internal mechanical mixing (c) external gas
recirculation mixing

15
5.1 The organic fraction of municipal solid wastes
Municipal food waste is undervalued biomass that requires disposal into landfill. It is reported that
about 60% of moisture is present in food waste which makes it most suitable for the AD.
Therefore, it is essential to use municipal food waste in the AD. Disposed municipal food waste
creates greenhouse gases in a landfill; it is estimated that 30% - 50% of global food becomes
wastes which are expected to 1.2-2 Gt y-1. Every Canadian family throws 1000 $ y-1 in the kitchen
trash which goes finally into landfill and produces GHGs. Due to decomposition of food waste,
GHGs are produced in landfill which creates an opportunity to generate biogas in the AD. The
collection new era of urbanization is increasing municipal food waste generation. In Ontario, the
majority of the cities are using municipal food waste as a resource for biogas and compost
production. In the year 2013, the government of Ontario initiated the FIT program (feed-in tariff),
which is a subsidy to farm AD. After that, 36 AD plants have been installed in Ontario. To further
strengthen and support this initiative, the government of Ontario passed the resource recovery
and circular economy Act (Bill 151). This bill created more opportunities to process municipal food
waste into the AD to produce bioenergy (Subhash Paul, 2018).
5.2 Sewage sludge
Sewage sludge is the residual, semiliquid material produced during sewage treatment of industrial
or municipal wastewater. It is often referred to as fertilizer and is connected to a simple onsite
sanitation system such as septic tanks. Sewage sludge is a well-established technology used in
the AD. The AD is the utmost vital technique for treating sewage sludge, and it is reported that
the majority of the mud and slurry is processed through the AD. Sewage sludge is highly active
material produced from biological treatment plants which start fermenting on anaerobic
conditions. Sewage sludge is delivered in liquid form at 5% TS or dried to 20-25% TS. Due to the
lower operational costs associated, the AD has become a standard for treatment of sewage
sludge. Other benefits of sewage sludge are the improve dewatering capabilities and to obtain
energy.
5.3 Industrial wastes and wastewater
Industrial wastes come from many sources such as food/beverage industry, starch industry, sugar
industry, paper processing, slaughterhouse (gastrointestinal wastes), chemical industry and
pharmaceutical industry. Suitable feedstock for AD includes a range of waste material from
industrial and commercial operating, among these waste, high moisture content is ideal for the
AD. Commercial sources such as catering wastes forms hotels and restaurants make the potential
feedstock due to the high moisture content in these constituents, they are suitable for the AD,

16
however, courses problems in incineration. Many industries have been researched to be identified
as amenable for the AD they are determining to be suitable for industrial wastewater with COD
content up to 50,000 mg/l, and no oxygen supply is required for the treatment (Monnet, 2003).
The AD can be used as a pre-treatment step to lower the sludge costs, control odors and reduce
the cost of final treatment at the wastewater treatment plant as less energy is required in the
anaerobic treatment to meet the discharge standards.
5.4 Manure
One of the new technologies used for producing renewable energy (biogas) is the treatment of
animal manures. The benefit of the AD for manure treatment includes an odorless digestate,
which spread on the land without odor nuisance. Also, it contains rich fertilizer which can be used
in the soil. Poultry animals’ manure such as that from a pig, beef, and dairy are considered critical
organic fertilizers however they consist of bacteria virus and parasitic pathogens which can be
transferred to bioaerosols during land-spreading.
An additional motivation for the AD of manure is the fact that natural degradation of manure leads
to the uncontrolled emission of CH4 during storage, which is undesirable because of its global
warming effects. Controlled AD of manure prevents this unchecked release (Lise Appels e. a.,
2011) presents some values for the methane yield obtained through anaerobic digestion of
different kinds of manure their results are summarized in Table 4.
Table 4: Methane yield through an AD of manure (Appels, 2011)
Type of manure Methane yield (m
Pig 0.36
Sow 0.28
Dairy cattle 0.15
6 By product
By-products are generated as part of the AD process; these are used by farmers for farming
operations to improve the performance of soil for cultivation. It also produces a gas composed of
methane (CH4) and carbon dioxide (CO2) also knowns as biogas, used for generating electricity
or fuel. By-products such as biogas and digestate produced by AD are a cost-effective way to

17
manage biodegradable waste. The use of both this bi-product can be used as a source of financial
income. However further processing may be required to obtain the maximum value for these
products. Key factors of the process vary depending on the purpose and usage, e.g., if the goal
is to produce the possible biogas, essential elements must be total solid content.
6.1 Biogas composition
Primary biogas produced as part of AD is composed of methane (CH4) and carbon dioxide (CO2)
and small amount of hydrogen (H2), ammonia (NH3) as well particles of hydrogen (H2), nitrogen
(N2), carbon monoxide (CO), saturated or halogenated carbohydrates and oxygen (O2). The
composition of biogas is similar to landfill gas but different from one of the natural biogases.
Landfill gas is composed of halogenated compounds and high content of oxygen when too much
air is sucked during collection on landfill. The calorific value is 36.14 MJ/m3 for natural gas and
21.48 MJ/m3 for biogas.
Table 5: Composition of biogas, natural gas and landfill gas (Monnet, 2003)
Constituents Units Natural Gas Biogas Landfill gas
Methane Vol % 9.1 55-70 45-58
Ethane Vol % 5.1 0 0
Propane Vol % 1.8 0 0
Butane Vol % 0.9 0 0
Pentane Vol % 0.3 0 0
Carbon dioxide Vol % 0.61 30-45 32-45
Nitrogen Vol % 0.32 0-2 0-3
Volatile Organic
compound (VOC)
Vol % 0 0 0.25-0.50
Hydrogen (H2) Vol % 0 0 Trace to less
than 1%
Hydrogen sulphide
(H2S)
ppm -1 -500 10-200
Ammonia ppm 0 -100 0
Carbon Monoxide
(CO)
ppm 0 0 Trace

18
6.2 Gas utilization
Biogas has many usages such as its use for heating using boilers and furthermore used in
Combined Heat Power (CHP) units. The heat produced by boiler has many applications such as
its usage in a plant or producing water vapor for industrial processes. High-quality gas is not
required for the use in furnaces, and therefore it is desirable to remove hydrogen sulfide due to
its forms sulfurous acid in condensate which is highly corrosive. Water vapors can cause
problems in the gas nozzle. Therefore, it is recommended to remove a significant proportion of
H2S. Biogas for the usage of CHP units also requires the same quality of gas for gas engines as
boilers except that H2S content must be lower. CHP units are good sources to product efficient
electricity and heat for AD plant, e.g., This heat can be used for the digester and sterilization of
digestate, and the remaining power can be used as a source of finance. It is important to note, for
the use of raw biogas the distance from the plant and the gas must be considered. Biogas for the
usage of fuel for vehicle requires the same quality of gas for gas engines as a natural gas except
that gas quality demands are strict. Therefore, biogas is needed to be upgraded to obtain a higher
calorific value, consistent gas quality for safe driving and engine operation, a gas without
mechanically damaging particles and no enhancement of rust and deterioration due to high levels
of hydrogen sulfide, ammonia, and water this corresponds that methane content must be
increased to 95% and gas must be compressed. The cleanest fuels with minimal impact on the
environment and human health are the upgraded biogas however it can involve high cost.
Methane contained in the biogas can also be used as a fuel for Fuel cells. Fuel cells are power
generating systems that produce DC electricity by combing fuel and Oxygen (from the air) in
electrochemical reactions (Weiland, 2010).
6.3 Gas upgrading technologies
Due to the associated price and environmental concerns, not all upgrading technologies are
considered for the application of biogas treatment of natural gas, town gas, landfill gas. Biogas
injection into the natural gas grid has become increasingly important due to its usage as a more
energy efficient way; it is utilized as a vehicle fuel by many countries around the world. Many
states have developed a quality standard for biogas injection into the natural gas grid. To enhance
the energy of the gas carbon dioxide is required to be removed and upgraded gas must have a
methane content of more than 95%.
In Sweden and Switzerland, the utilized methane is widely distributed for the transport sector, and
the upgraded methane is stored at 200-250 bars in gas bottles. At present, a different method is
used to increase the methane content the most common process of removing carbon dioxide from

19
biogas are water scrubbing or scrubbing with organic solvents like polyethylene glycol as well as
pressure swing adsorption using activated carbon molecular sieve as well membrane separation
technology. It is essential to remove hydrogen sulfide from biogas to prevent corrosion, by using
the most common methods including iron chloride dosing to digester slurry. It is useful in reducing
the high H2S level, however, is less useful to attain low and stable levels for vehicle fuel demands,
using iron oxide method which is a highly exothermic process and activated carbon is also used
for the absorption of H2S to be converted before into sulfur and water. Halogenated hydrocarbon
causes corrosion in CHP engines, and therefore manufacturers ensure the maximum limit of
halogenated carbon in biogas is specified. The halogenated hydrocarbon can be removed by
using a pressure tube exchanger with specific activated carbon (Monnet, 2003).
6.4 Digestate and utilization
The AD is the most widely used methods to treat the organic wastes, however, to use the waste
as a resource the production should be derived from digestate, with high nutrient content and
acceptable quality for soil amendment or landscaping. The quality of digestate can be evaluated
based on three criteria including chemical, biological and physical aspects. The result of the AD
is mineralization of organically bounded nutrients such as nitrogen in a lowering of C/N ratio.
Digestate supports in allowing accurate dosage and integration in fertilization plan and reduces
the application of additional mineral nitrogen fertilizers. It is noted that the increases in ammonia
nitrogen content may occur by a factor of three if energy crops are used as the only substrate.
The AD also results in a significant reduction of odors and reflects a positive change in the
composition of odors. It is reported that about 80% of the odors in feedstock can be reduced with
the AD. The decay rate of the AD is dependent on temperature, treatment time, pH and volatile
fatty acids concentration. Concerning the survival of pathogens during the AD, temperate is the
most critical factor, and it is noted that the best sanitation effect is obtained at the thermophilic
temperature above 50 range and long retention time. Animal By-products Regulation Act (EC
1774/2002) has been developed by the European Union recommending separate pasteurization
before and after AD at 70 °C for 60 min. The most effective way of the heat treatment is
pasteurization however bacteria pores are not reduced. Pasteurization after digestion is effective
but digestate, however, digestate is prone to recontamination.
For specific wastes, separate pasteurization before or after AD at 70 °C for 60 min is stipulated
by the European Union Animal By-Products Regulation (EC 1774/2002). Pasteurization is an
effective way of heat treatment; however, bacterial spores are not reduced. Pasteurization after

20
digestion is more effective, but the digestate is particularly prone to recontamination (Weiland,
2010).
7 Global warming and AD
Global warming is one of the most widely recognized and devastating potentials threats to our
environment. This problem has become widely known as it is one of the priority political agendas
for many politicians around the world. Many efforts have been focused on addressing this
problem. To support resolving this issue, an international treaty namely the Kyoto Protocol has
been implemented committed to reducing greenhouse gas emission and overall reducing global
warming. The main agenda of the Kyoto Protocol is to fight global warming and reduce
greenhouse gas concentrations in the atmosphere to an acceptable level. The greenhouse effect
is a natural process that increases the earth's temperature through gradual heating, primary gases
including carbon dioxide, methane, nitrogen oxide, and water vapor. Climate on earth is greatly
influenced by changes in the atmospheric concentration such that some gases trap infrared
radiation from the land known as the greenhouse effect. A significant increase has been noticed
in the level of greenhouse gases and pollution in the atmosphere since the last century, mainly
due to human activities (MNRE- Ministry of new and renewable energy. , 2012). To name a few,
these activities include burning of fossil fuels, deforestation, land use changes, livestock, and
fertilization, etc. also known as the anthropogenic emission of greenhouse gases, leading to
overall increase in emissions and hence resulting in increasing the temperature on earth. The rise
of global warming is expected to have widespread consequences including sea-level rise and
therefore flooding, melting of glaciers, variation in the pattern of rainfall causing floods and
droughts, the incidence of climate extremes, etc. These changes have an adverse impact on our
atmosphere, ecosystem, health, water resources, and vital economic sectors. While there are
challenges to sustaining the climate change, it is critical to control greenhouse gas emissions and
global warming. It is crucial to identify and recognize the extent to minimize the harmful
consequences of climate change by adaptation. See below table 6, which outlines the contribution
of different GHGs to global warming (EurObserv'er, 2008) (al.) (Abbasi & Tauseef, 2012).

21
Table 6: Contribution of different GHGs (Abbasi & Tauseef, 2012)
As observed from the above table, methane is one of the main contributors to greenhouse gases.
It is reported that each molecule of methane causes estimates 25 times more global warming in
comparison to the molecule of carbon dioxide (Abbasi & Tauseef, 2012).
7.1 Biogas and global warming
Human activities such as the rotting of food waste in the open air, dung lying in the open and
biodegradable municipal waste dumped in the open air, human excreta or sewage disposed on
land, etc. causes the escape of methane in the atmosphere thereby leading to global warming.
Methane is anyways generated in nature as for result of the decay of plant and animal matter, but
there is also a natural sink which removes excess methane. There is a natural balance between
the source and drains of methane which keeps the level at around 700 parts per billions for many
years. However the extra methane generated due to human activities through anthropogenic
activities over the years has caused the rise of overall tropospheric methane level by 150%
(Abbasi & Tauseef, 2012) It is also reported that China is the leading country in the world in
methane emission, followed by India and the USA. As shown in the table below, the involvement
of different sources of methane to global warming in comparison to carbon dioxide and nitrogen
oxide (IPCC , 2000) (USEPA. Global anthropogenic non-CO2 greenhouse gas emissions, 2011)
The contribution of different GHGs
(%)
IPCC
(1996)
USDOE
(1993)
CO2 65 66
CH4 20 18
CFCs 10 11
N2O 5 5

22
Table 7: Comparison of calorific values of various fuels (Hill N, 2011)
Fuel Calorific value (CV)
(approximate)
indirect emission factor
(kgCO2e/G), net CV basis
Petrol 10800 kcal/kg 12.51
Natural gas 8600 kcal/m3 5.55
Liquefied natural gas 13140 kcal/kg 20
Liquefied petroleum gas 10800 kcal/kg 8
Kerosene 10300 kcal/kg 13.24
Diesel 10700 kcal/kg 14.13
CNG 8600 kcal/m3 8.36
Biogas 5000 kcal/m3 0.246
7.2 Sources of methane
Emission of methane in the natural atmosphere is through many sources such as anthropogenic
activities namely fossil fuel production, fermentation in livestock, handling of manure, agriculture,
biomass burning, disposal/treatment system for biodegradable waste or as a component of
biogas. Anthropogenic activities account for about 60% of global methane emission. The global
estimation of methane sources from natural sources and different sectors can be viewed in table
8 and 9 below.

23
Table 8: Global estimates of natural methane source (Abbasi & Tauseef, 2012)
Natural sources Average methane flux (Tg
CH4/yr.)
Range
Wetlands 174 100-231
Lakes 30 10-50
Termites 22 20-29
Oceans, rivers 9.1 2.3-15.6
Geological 9 4-14
Wild animals 8 2-15
Hydrates 5 4-5
Wildfires 3 2-5
Permafrost 0.5 0-1
Total 260.6 157.3-352.6

24
Table 9: Projections for global anthropogenic methane emission based on data from (USEPA. Global anthropogenic non-CO2 greenhouse gas emissions, 2011)
Sectors Methane emission (TgCH4)
2010 2020 2030
Energy
Fugitives from natural gas and
oil systems
75.96 85.19 93.89
Fugitives from coal mining
activities
24.54 32.08 37.63
Stationary and Mobil
combustion
11.65 13.8 16.92
Biomass combustion 9.7 10.24 10.91
Other energy sources 0.02 0.02 0.02
Agriculture 90.74 100.15 108.98
Enteric fermentation 34.87 34.88 35.2
Rice cultivation 11.28 11.87 12.55
Manure management 20.02 20.02 20.02
Other agriculture
Industrial process 0.32 0.32 0.32
industrial processes
wastes
landfilling of solid waste 38.05 40.72 43.34
wastewater 21.42 23.54 25.3
Other waste sources 0.73 0.73 0.73
Total 339.3 373.56 405.81
Emission of methane extent varies significantly from country to country and region to region
depending on the factors such as climate, agricultural and waste management practices and
degree of provision available for methane capture. The AD process is significantly impacted by
temperature and moisture and is one of the critical biological process causing methane emissions

25
in both human and natural sources (Abbasi & Tauseef, 2012). Technologies to utilize and capture
methane from sources have an impact on the emission levels of these sources.
7.3 Causes of methane
7.3.1 Landfills
Biodegradable component of waste decomposes in landfills and open dumps, in the absence of
oxygen, methane is produced. The quantity, the moisture content of waste as well as the design
and management practices have a significant effect on the amount of methane evolved. In most
developing countries such as the USA, the most significant source of methane is landfilled and
accounts for 34% of all methane emissions. (Abbasi & Tauseef, 2012).
7.3.2 Natural gas and petroleum systems
Methane is mostly used in natural gas and is lost in the production, processing, storage,
transmission and distribution of natural gas. Due to methane usage in natural gas, which is often
found in the production, refinement, and transformation as well as the storage of crude oil,
therefore there is a significant risk of methane emission into the environment. (Sisani, 2017).
7.3.3 Methane released by coal mining
Coal mining is a dominant source of methane and has an impact on global warming it accounts
for about 10% of methane release in the USA and is the fourth most abundant source of methane.
Surface mining releases about 1.9 grams of methane per kg of surface mined coal as well mining
releases 4.23 grams of methane per kg of underground coal mined coal, as reported by the
National Renewable Energy Laboratory. (Sisani, 2017).
7.3.4 Enteric fermentation
Enteric fermentation is the process that causes methane as a by-product. It is the natural digestive
process which breaks down carbohydrates by microorganisms into the simple molecule and gets
absorbed into the bloodstream of animals. Enteric fermentation is one of the sources of increased
methane emission. The number of methane emissions by livestock was 1 million as estimated in
2004.
7.3.5 Wastewater treatment
Methane is produced as a by-product as part of treating biodegradable wastewater from domestic
and industrial sources for removing soluble organic matters and applying anaerobic processes.
(Ostrem).

26
7.3.6 Handling manure management
Livestock manure releases methane due to anaerobic decomposition of organic material
contained in the slurry by bacteria exited along with the manure by the animal. Manure generates
a significant amount of methane, as well as manure lagoons, holding tanks, large dairy and swine
operations also release a considerable amount of methane. (Soriano, 2000).
7.3.7 Agriculture
Rice agriculture is also a source of methane emission. The production of rice such as high
moisture content, oxygen reduction and the usage of organic material creates an environment for
methane-producing microbes that decompose the organic material. The whole process releases
methane into the atmosphere, and it is estimated that about 9% of methane emission is generated
through rice crops and 31 million tones of methane are produced per year. (Soriano, 2000)
7.4 Opportunities for methane capture
Anthropogenic activities produce methane usually called biogas, some of these activities is
challenging to control the quantities of biogas while other activities like agriculture can be made
in such a way to reduce the emitter of methane using proper soil, water management and
adequate choice of cultivation. Researchers nowadays have invented new cost-effective ways to
capture methane and apply it to different sources of energy such as fuel or chemical feedstocks.
Instead of releasing it into the atmosphere and thereby face adverse consequences, this new
technology can support the use of wasted methane for a variety of purposeful activities. There
are several types of reactors/digesters/fermenters available to obtain biogas through
anaerobically digesting different types of biodegradable waste, manure, and wastewater sludge.
Through careful management and use of technology, biogas emission can be reduced
significantly and can be captured for usage as a resource.

27
8 Experimental work and analysis
8.1 Batch anaerobic digestion study
This experimental research’s purpose was to conduct a comprehensive assessment of the effect
of the hydrothermal pre-treatment (discussed in section 8.2) on Thickened Waste Activated
Sludge (TWAS) and determine the optimum condition for methane production. Hydrothermal pre-
treatment of thickened waste activated sludge within five different severity index (SI) ranged from
3 to 5 have been studied to evaluate its influence on solubilization and bio-methane production
during anaerobic digestion. The mesophilic batch assay was sited up for all fifteen different
hydrothermal pre-treated TWAS Samples were extracted from the Ashbridge’s Bay Wastewater
Treatment Plant, the city of Toronto's main sewage treatment facility with a working capacity of
818,000 m3/d and the second most abundant plant in Canada after Montreal's Jean-R. Marcotte
facility (City of Toronto, Ontario, Canada). TWAS, the substrate, was collected, and the inoculum
was taken from the effluent of the anaerobic digester (AD) from this plant.
8.2 Hydrothermal Pre-treatment
Hydrothermal pre-treatment is a process where the temperature of sludge is raised to the desired
temperature to increase the disintegration and solubilization of sludge solids significantly. A Parr
4848 stirred reactor (Parr Instrument Company, IL, US) was utilized for the hydrothermal pre-
treatment of the TWAS. The Parr 4848 offers features of operation ideal for this study: precise
control of temperature, pressure, heating ramp and soak (retention time), separate heating and
cooling control loops, motor speed controller, and high or low power switch. Besides, the 4848
provides an automatic controller having proportional integral derivative (PID) programme which
adjusts automatically. To allow a homogeneous mixing during the heating process, the reactor
consists of a mechanical mixer connected to a speed controller and a Spec View software figure
5 below shows the hydro-thermal setup. For each of the rounds of pre-treatment, one liter of
TWAS was placed into the reactor vessel. The reactor was sealed, and the mechanical mixer was
set to 150 RPM. The mechanical mixer stirred the TWAS consistently until the end of the cooling
cycle. The TWAS heating started with a ramp of 3 °C/min until the reactor temperature reached
30°C below the target temperature of 150°C (Cycle 1). Afterward, the heating was continued at
the lower ramp of 1 °C/min until the reactor temperature reached the target temperature (Cycle
2). Then, the parr 4848 maintained a constant temperature for the desired retention time (Cycle
3). In the final step, the heater switched off, but the mechanical mixing was still operating, and the
cooling system was connected to the hydrothermal reactor. The cooling system operate with cold
water cycling inside the vessel in a closed environment and decreased the temperature to 30°C

28
(Cycle 4). It is noteworthy that the heating rate was reduced from 3 °C/min in Cycle 1 to 1 °C/min
in Cycle 2 to avoid increasing the temperature above the target temperature due to the thermal
transitional lag.
Figure 5: Parr 4848 pressure reactor
Figure 6: Parr 4848 controller showing temperature graph

29
9 Experimental design and procedure
9.1 Experiment groups
Forty-five mesophilic batch anaerobic digesters were grouped (in triplicate) using the 15 pre-
treatment scenarios summarized in Table 10, and, one triplicate set of non-pre-treated substance
served as the control group, three additional digesters were set up with the only inoculum (no
substrate). Therefore, a total number of 51 batch digesters were operated simultaneously.
9.2 Solubilization study
To investigate the effect of the hydrothermal pre-treatment on AD, Table 10 contains an
explanation of the experimental design. Furthermore, the calculations were performed using five
different severity index (SI) values: 3.0, 3.5, 4.0, 4.5, and 5.0. The SI has calculated vis Eq. Given
below, a standard research calculation method.
Severity Index (SI) = log exp[(T − 100
14.75) × t]
where T is the pre-treatment temperature (°C), and t is the retention time (min).
Three different pre-treatment scenarios were defined using different combinations of temperature,
pressure and retention time ranging from 150-240°C, 69-488 psi, and 5-30 min, respectively. The
parameters for the rounds, one control (non-pretreated) scenario, and three experimental
(treated) TWAS are noted in Table 10 below.
Table 10: Explanation of experimental design
Severity Index (SI)
3.0 3.5 4.0 4.5 5.0
Pre-treatment pressure (psi), temperature (ᵒC), retention time (min)
Pre-treatment Scenarios 1
69, 150, 30 114, 170, 30 181, 190, 20 227, 210, 20 337, 220, 30
Pre-treatment Scenarios 2
89, 160, 20 145, 180, 15 225, 200, 10 337, 220, 10 407, 230, 15
Pre-treatment Scenarios 3
114, 170, 10 181, 190, 10 277, 210, 5 407, 230, 5 488, 240, 8

30
Figure 7 below displays the experimental set-up of the batch digesters, specifying the amount of
pretreated and non-pretreated substrates TWAS added with the volume of 300 mL along with the
mesophilic inoculum. The amount of the added TWAS and its ratio to the inoculum were
calculated considering the food to microorganism (F/M) ratio of 1 g-TCOD (Total chemical oxygen
demand)/g-VSS. The digesters were finally placed in a swirling-action shaker (Max Q4000,
Incubated and refrigerated shaker, Thermo Scientific, CA) operating at 180 rpm and set at a
mesophilic temperature of 38°C.
Figure 7: Experimental anaerobic digestor setup
31
9.3 Sample analyses
9.3.1 TS/VS
The standard guidelines were followed provided in 2540B and 2540E for TS and VS respectively.
9.3.2 TSS/VSS
Standard methods 2540D and 2540E was employed to measure TSS and VSS respectively. 2 ml
of each sample using 1.5 m glass microfiber filter paper for filtration and then drying in the oven
at 1050 C for 1 hour for TSS. The mass of the samples was measured and was placed in a furnace
for 20 minutes at 5500 C. After combustion, plates were measured, and the weight loss
represented as VSS.
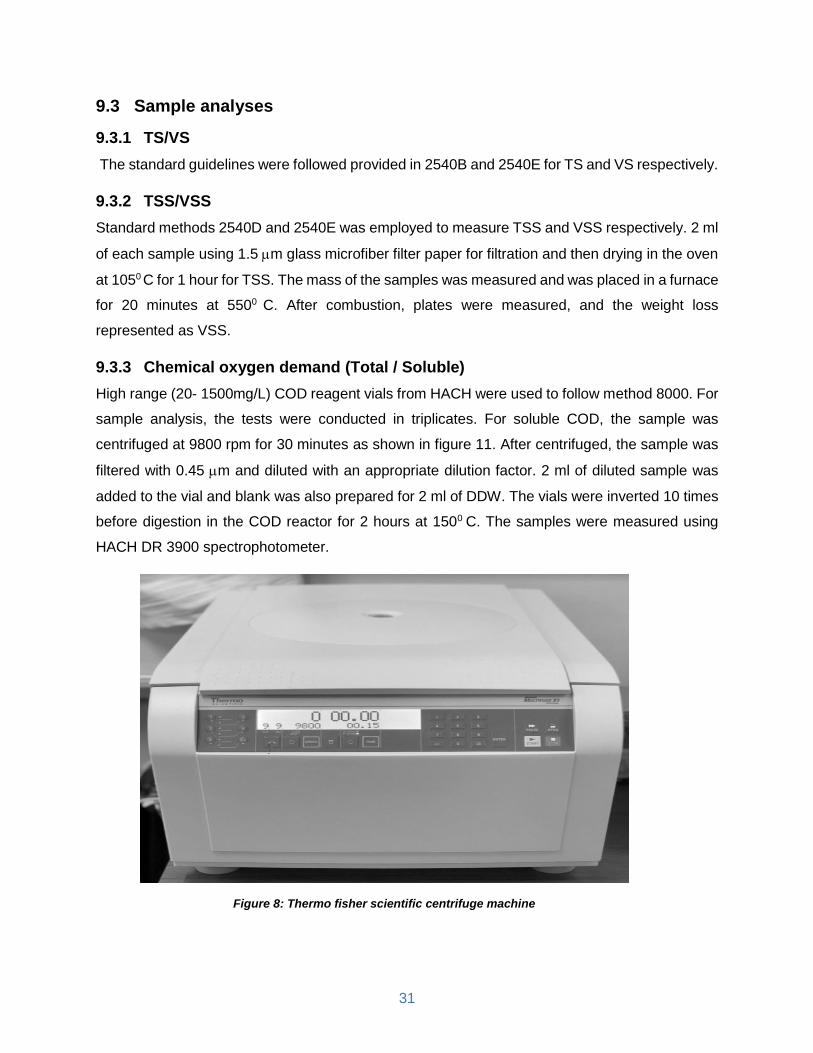
9.3.3 Chemical oxygen demand (Total / Soluble)
High range (20- 1500mg/L) COD reagent vials from HACH were used to follow method 8000. For
sample analysis, the tests were conducted in triplicates. For soluble COD, the sample was
centrifuged at 9800 rpm for 30 minutes as shown in figure 11. After centrifuged, the sample was
filtered with 0.45 m and diluted with an appropriate dilution factor. 2 ml of diluted sample was
added to the vial and blank was also prepared for 2 ml of DDW. The vials were inverted 10 times
before digestion in the COD reactor for 2 hours at 1500 C. The samples were measured using
HACH DR 3900 spectrophotometer.
Figure 8: Thermo fisher scientific centrifuge machine

32
9.3.4 Ammonia
High range (0.4 – 50 mg/L) Amver Ammonia reagent set were used as per Method 10031, the
Salicylate method. Concentrations of ammonia were determined using the HACH DR3900
spectrophotometer.
9.3.5 Alkalinity
High range (25 - 400 mg/L CaCO3) total Alkalinity TNT 870 reagent set were used as per method
10239. Moreover, the concentration of Alkalinity was determined using Hach DR3900
spectrophotometer.
9.3.6 pH
The pH of each sample was measured immediately; it was collected using VWR Benchtop pH
Meter and refillable glass probe, model AB15 as shown in figure 10 was employed to measure
pH for all the samples. This meter was calibrated twice a week with pH reference standards.
Figure 9: pH meter fisher scientific model AB 15

33
9.3.7 Carbohydrates (Total / Soluble)
The carbohydrates concentration is measured calorimetrically as glucose, using the phenol-
sulfuric method. A standard calibration curve with glucose at concentrations of 5-1000 mg /L must
be prepared. Deionized water is used as blanked. The reagent used was standard glucose,
concentrated sulfuric acid, phenol 5 % w/v (weight/volume)

34
10 Results and discussion
In this experiment, TWAS and inoculum were collected. The TWAS was pre-treated under 15
various scenarios to determine the optimum conditions for the pre-treatment of TWAS. The 15
pre-treated samples are compared to the control group, the untreated TWAS. TSS and VSS,
calculated as ratios, helps to interpret the effectiveness of the pre-treatments on the TWAS. A
high VSS/TSS ratio signifies the absolute digestion of solids in the TWAS, whereas samples with
low VSS/TSS ratio contain undigested solids in the pretreated conditions. During hydro thermal
pre-treatment, reactions occur that degrade fats to glycerol and fatty acids, carbohydrates to three
types of sugars, monosaccharides, disaccharides and polysaccharides, and proteins too small
peptides and amino acids (Jin, Li, and Li 2016).
Figure 10 Graph shows the average result of TSS and VSS which was done in triplicate for the
raw and pre-treated samples.
Figure 10: Total and volatile suspended solid of raw and pre-treated TWAS
0.0
5.0
10.0
15.0
20.0
25.0
30.0
35.0
40.0
15
0-3
0
16
0-2
0
17
0-1
0
17
0-3
0
18
0-1
5
19
0-1
0
19
0-2
0
20
0-1
0
21
0-1
0
21
0-2
0
22
0-1
0
23
0-5
22
0-3
0
23
0-1
5
24
0-2
0
Raw
SI=3 SI=3.5 SI=4 SI=4.5 SI=5
mg/
L
Pretreated Conditions
Chart Title
VSS
TSS

35
Hydrothermal pre-treatment had a direct impact on total suspended solids (TSS) and volatile
suspended solids (VSS). All the pretreated conditions demonstrate the impact of hydrothermal
pre-treatment on declining TSS concentration. For the TSS concentration in pre-treated TWAS,
from 150°C with SI of 3, the graph decreases to SI 4 steadily. As indicated in the above graphs,
with temperature 210°C and 220°C within the severity index of 4.5, it decreases significantly and
become steady to 17mg/L and 11mg/L respectively, showing that the optimum temperature of
220°C with a retention time of 10 minutes was the ideal conditions for the reduction of the total
suspended solids in the TWAS. The increasing of temperature, PSI, and retention time did not
increase effectiveness, and the values of TSS start increases from severity index 4.5 to severity
index 5 at a temperature 230°C and 220°C with retention time 5 and 30 minutes to 20mg/L and
20mg/L respectively but the graph decreased again when the temperature increase to 230°C with
retention time 30 minute the value of TSS was spotted 16 mg/L at this point, and again the value
of TSS jumped to 22 mg/L as the temperature increased to 240°C with 20 minute retention time.
It can be argued that the total solid and high temperature is due to the fact that at high
temperature, complex polymers reduces the soluble content and increases the solid content. Pre-
treated conditions had a positive effect on TSS reduction, but the graphs show that temperature
played a vital role in the reduction of total suspended solids. Furthermore, the same trend was
noticed in the reduction of VSS as at a temperature of 150°C with retention time of 30 minutes
the values of VSS was 13.9 mg/L and it rises as temperature increases until it reaches to severity
index 3.5 at temperature 170°C with retention time the value documented at this point was 18.4
mg/L and then the graph start declines and it becomes reasonably steady until it reaches to
severity index 4.5 with temperature 210°C and 20 minutes retention time the value was 7.2mg/L
showing the optimum temperature 210°C and 220°C with retention time 20 and 10 minute
respectively. Results depict that temperature and retention time had impacts on the dissolution of
TWAS and solid contents were degraded into smaller dissolved molecules. Finally, the graphs
demonstrate that pre-treatment of the TWAS is preferable to the untreated TWAS under any
circumstances, as all treatments had an impact on the TSS/VSS ratio, with the raw TWAS
containing the highest values for TSS and VSS 34 mg/L and 22.7 mg/L respectively.

36
Figure 12 contains the information for the TCOD. The TCOD is calculated in conditions where
effluent is treated with a potent chemical oxidant under specific temperatures and retention time.
The TCOD in a sample is the number of oxygen units digested while agents, such as dichromate
or permanganate, oxidize the organic compounds, expressed in milligrams per liter (mg/L). TCOD
is a measure of pollutants in the sample, showing the mass of oxygen demand. The results
displayed in Figure 12 specify that pre-treatment did not have a tremendous impact in the TCOD
for the experimental and control samples. It is noted from the graph that there is no overall
significant change in the pretreated sample from the raw sample except in SI 5, although the data
TCOD concentration for SI 3, SI 3.5, SI 4 and SI 4.5 contain lower values from the raw sample.
In SI 3 the highest concentration is at 170°C-10 min (49567 mg/L) is very close to the raw value
of 49600 mg/L and SI 3.5 the highest concentration is at 190°C-10 min (48300 mg/L). In SI 4 the
highest concentration is at 200°C-10 min (51067 mg/L), and the lowest concentration is at 210°C-
10 min which is (42033 mg/L). For SI 4.5 the lowest concentration is at 210°C-20 min (42500
mg/L). In SI 5, the pattern varies from the other SI values: the concentration of TCOD first
decreases 56467 mg/L to 44367 mg/L then increases to 57233 mg/L.
0
10000
20000
30000
40000
50000
60000
70000
15
0-3
0
16
0-2
0
17
0-1
0
17
0-3
0
18
0-1
5
19
0-1
0
19
0-2
0
20
0-1
0
21
0-1
0
21
0-2
0
22
0-1
0
23
0-5
22
0-3
0
23
0-1
5
24
0-2
0
Raw
SI=3 SI=3.5 SI=4 SI=4.5 SI=5
mg/
L
Pretreated Conditions
TCOD
TCOD
Figure 11: Graph for TCOD of raw and pre-treated TWAS

37
Figure 12 describes the concentration of the soluble chemical oxygen demand (SCOD) for TWAS
after pre-treated conditions under the conditions described in Table 10. The SCOD is a
measurement to derive the amount of organic matter in sludge samples, evidence of the soluble
organic matter consuming the oxidant. As the data shows, when SI increases from 3 to 5, there
is a significant rise in concentration, with the highest values contained in an SI of 4.5.
In SI 4, the highest concentration value of SCOD is 210°C-10 min (24417 mg/L) which is
significantly higher than raw TWAS value which is (2583 mg/L). In SI 3.5, the highest
concentration value is 190°C-10 min (21633 mg/L). In SI 4, the highest concentration value is
210°C-10 min (24417 mg/L). For SI 4.5, the lowest concentration is at 230°C-5 min (42275 mg/L).
In SI 5, the concentration is higher than the raw sample but is less than SI 4.5. The optimum level,
we can conclude, is SI 4.5 is the maximum yield.
0
5000
10000
15000
20000
25000
30000
15
0-3
0
16
0-2
0
17
0-1
0
17
0-3
0
18
0-1
5
19
0-1
0
19
0-2
0
20
0-1
0
21
0-1
0
21
0-2
0
22
0-1
0
23
0-5
22
0-3
0
23
0-1
5
24
0-2
0
Raw
SI=3 SI=3.5 SI=4 SI=4.5 SI=5
mg/
L
Pretreated Conditions
SCOD
SCOD
Figure 12: Graph or SCOD of raw and pre-treated TWAS

38
Figure 13: Graph for T-carbohydrates of raw and pre-treated TWAS
Figure 13 Graph demonstrates the effect of the experimental conditions on the presence of T-
carbohydrates in the pretreated samples versus the raw sample. Higher rates of fermentation of
the T-carbohydrates will produce samples with a lower presence of the T-carbohydrates. An initial
rise in temperature creates a rise in the presence of carbohydrate-related substances in the
samples. A change of ten degrees with the SI as 3, from 150°C-30 min to 160°C-20 min, the value
nearly double rises from 1829 mg/L to 3245 mg/L respectively. However, the concentration of T-
carbohydrates decreases as the temperature and SI rise until the lowest value for T-
carbohydrates is attainted at SI 5, 240°C-20 min with a value of 502 mg/L. However, overall, a
downward trend can be observed. As the pre-treated conditions increase from 170°C- 30 min all
the way to 240°C-20 minute the bar graph continuously declined from SI 3 to SI 5. Only one point
at 170°C- 30 min shows a value above the Raw non-pre-treated. The higher the SI and
temperature, the lower the T-carbohydrates, with optimum conditions achieved at SI 5 between
230- 30 min and 240°C and a time value between 15 and 20 minutes for retention time.
0
500
1000
1500
2000
2500
3000
3500
4000
4500
15
0-3
0
16
0-2
0
17
0-1
0
17
0-3
0
18
0-1
5
19
0-1
0
19
0-2
0
20
0-1
0
21
0-1
0
21
0-2
0
22
0-1
0
23
0-5
22
0-3
0
23
0-1
5
24
0-2
0
Raw
SI=3 SI=3.5 SI=4 SI=4.5 SI=5
mg/
L
Pretreated Conditions
T-Carbohydrate
T-Carbohydrates

39
Figure 14: Graph for S-carbohydrates of raw and pre-treated TWAS
Figure 14 shows the graph for the S-carbohydrates, the rate of fermentation decreases the
presence of S-carbohydrates in the samples. A similar trend can be observed as with the T-
carbohydrates: an increase in temperature, retention time, and SI lead to the ultimate conditions
of the fermentation process of carbohydrates in pre-treated samples. However, a significant
difference between the T-carbohydrates and S-carbohydrates should be noted here. The S-
carbohydrate value for the raw sample is lower than any of the pretreated samples. However,
given that pre-treatment improves the solubility and carbohydrates are converted into VFA in large
amount, the difference between the values of the optimum S-carbohydrate pre-treated conditions,
(240-20 at SI 5) and the raw sample values are negligible, pre-treatment of the TWAS is the
preferable option.
0
500
1000
1500
2000
2500
15
0-3
0
16
0-2
0
17
0-1
0
17
0-3
0
18
0-1
5
19
0-1
0
19
0-2
0
20
0-1
0
21
0-1
0
21
0-2
0
22
0-1
0
23
0-5
22
0-3
0
23
0-1
5
24
0-2
0
Raw
SI=3 SI=3.5 SI=4 SI=4.5 SI=5
mg/
L
Pretreated Conditions
S-Carbohydrate
S-Carbohydrates
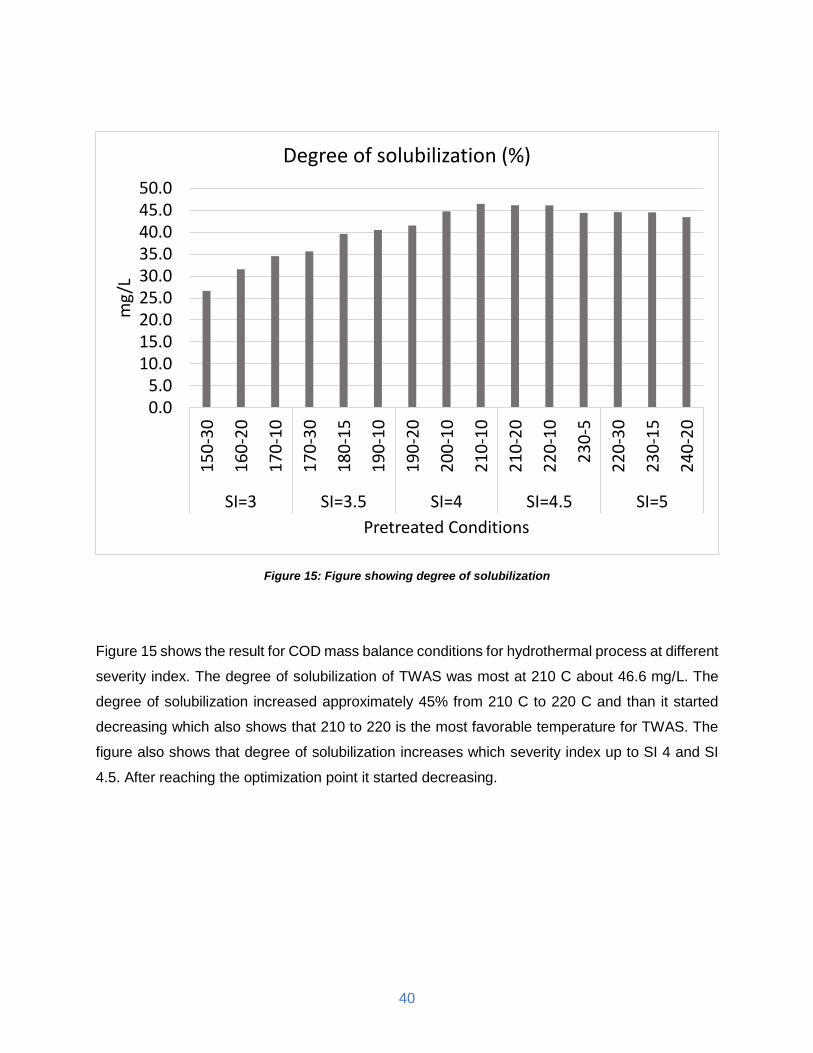
40
Figure 15 shows the result for COD mass balance conditions for hydrothermal process at different
severity index. The degree of solubilization of TWAS was most at 210 C about 46.6 mg/L. The
degree of solubilization increased approximately 45% from 210 C to 220 C and than it started
decreasing which also shows that 210 to 220 is the most favorable temperature for TWAS. The
figure also shows that degree of solubilization increases which severity index up to SI 4 and SI
4.5. After reaching the optimization point it started decreasing.
0.05.0
10.015.020.025.030.035.040.045.050.0
15
0-3
0
16
0-2
0
17
0-1
0
17
0-3
0
18
0-1
5
19
0-1
0
19
0-2
0
20
0-1
0
21
0-1
0
21
0-2
0
22
0-1
0
23
0-5
22
0-3
0
23
0-1
5
24
0-2
0
SI=3 SI=3.5 SI=4 SI=4.5 SI=5
mg
/L
Pretreated Conditions
Degree of solubilization (%)
Figure 15: Figure showing degree of solubilization

41
10.1 Effect of hydrothermal pre-treatment on methane production
In figure 16 below illustrates the cumulative methane yield in standard temperature and pressure
of all pre-treatment conditions. Production of volatile fatty acids (VFA) and long chain fatty acids
might cause the lag phase (Salminen, 2002). Although the trend of methane production is similar
between all conditions, the cumulative amount of methane produced varied. Some of the thermal
pre-treated TWAS generated higher methane amounts compared to non-pre-treated, raw sample,
indicated as the black line in the graph below. It can be concluded that different hydrothermal Pre-
treatment conditions of TWAS can either enhance the methane production, to an extent, and it
can negatively affect methane production if the temperature gets higher. The pre-treated condition
of 160°C produced the maximum amount of methane, with 20-minute retention time and 251.04
mL/g TCOD in standard temperature and pressure. The next high-yielding methane data are the
pre-treated conditions of 150-°C and 170°C with 30-minutes and 10-minutes retention time with
247 mL/gTCOD and 245 mL/gTCOD respectively. Yet, the findings show that the cumulative
methane production for non-pre-treated TWAS (RAW) is 187.38 mL/gTCOD which is higher from
pre-treated condition of 220°C with 30min, 230°C with 5 min, 240°C with 20 min and 230 °C with
15 min, which were observed as 182.88 mL/g TCOD, 147.86 mL/g TCOD, 177.80 mL/g TCOD
and 160 mL/g TCOD respectively. It can be concluded that the hydrothermal pre-treatment can
have a negative impact on biogas production when hydrothermal conditions are in the rages of
230°C at 5 minute to 240°C at 20 minute, however, have a positive biogas enhancement of
methane yield when hydrothermal conditions are in the ranges of 150°C at 30 minute to 220°C at
10 minute. Also, the 150°C at 30-minute condition is the optimum pre-treated condition for
methane production. This result was also presented by many other studies exploring the thermal
pre-treatment of substrates before AD (Ariunbaatar J. P., 2014). These findings also reveal that
not only temperature but also retention time has effects on methane production as pre-treated
conditions vary.

42
Figure 16: Line graph showing the cumulative methane yields
Figure 17: Bar graph showing the improvement of methaneFigure 18: Line graph showing the cumulative methane lds
0
50
100
150
200
250
300
0 2 3 5 7 9 11 14 15 17 21 24 29 32
Gas
Vo
lum
e/m
l
Time / Day
Cumulative methane yield
150-30
160-20
170-10
170-30
180-15
190-10
190-20
200-10
210-10
210-20
220-10
230-5
220-30
230-15

43
In figure 17 the bar graph illustrates the improvement of methane production of pretreated TWAS
comparing to its non-pretreated sample. Some of the pretreated conditions show improvement in
methane production in a range of 1.2% to 34%. The most effective pre-treatment of TWAS spotted
in the pretreated condition of 160°C -20 minute shows a 34% improvement in comparison to the
others, and it was followed by 150°C -30 minute and 170°C -10 minutes with 31% and 32%
respectively. The improvement in methane production shows an increasing trend starting from SI
4 and peaked at SI 1. However, SI 4.5 and SI 5 pre-treated TWAS shows a negative impact on
methane production during AD. The formula used to calculate the percentage for SI is:
SI = (Cumulative biogas - raw TWAS / Raw TWAS) x 100
e.g. SI 3.0 = (247 - 187.38)/189.38) x 100
SI 3.0 = 31.94%
Figure 17: Bar graph showing the improvement of methane
-20
-10
0
10
20
30
40
15
0-3
0
16
0-2
0
17
0-1
0
17
0-3
0
18
0-1
5
19
0-1
0
19
0-2
0
20
0-1
0
2
10
-10
21
0-2
0
22
0-1
0
23
0-0
5
22
0-3
0
23
0-1
5
2
40
-20
SI=3.0 SI=3.5 SI=4.0 SI=4.5 SI=5.0
Perc
enta
ge
Severity Index
Percentage of methane yeild improvement through hydrothermal pretreatment

44
The solubilization rate and biogas production of pre-treated TWAS shows that the relation
between them is not following the same trend. The reason behind this result might relate to the
formation of inhibitor or refractory matters produced during pre-treatment (Ma et al. 2011). It can
also be related to the mechanism of thermal pre-treatment that thermal pre-treatment increase
the solubilization by disintegrating cell membrane but biodegradability of hydrolysates might be
limited (Ariunbaatar, Panico, Esposito, et al. 2014). It can also be concluded that pre-treatment
with higher SI can result to degradation of complex organic matters and converting them to soluble
phase and might cause the Millard reaction and produce melanoidins, which is difficult to degrade
by anaerobic digestion (Ariunbaatar J. P., 2014). It can be concluded that although cumulative
methane production was spotted in pre-treated conditions with an SI of 4, the percentage of
methane production rate is higher in pre-treated conditions with a smaller SI value.
11 Conclusion
Hydrothermal pre-treatment of TWAS has a significant effect on enchaining methane generation.
Lab-scale studies have concluded that 160°C with a 20-minute retention time is the optimum
temperature and retention time for better methane production. The optimum pre-treatment
temperature and retention time for higher methane production are in the range from 150 to 170
and 10 to 30 min, respectively. It can be said, then, that different thermal pre-treatment conditions
of TWAS can either enhance the methane production, to an extent, and it can negatively affect
methane production if the temperature gets higher.

45
References
1. Abbasi, T., & Tauseef, S. &. (2012). Anaerobic digestion for Global warming and energy
generation. Renewable and sustainable energy reviews, 3228-42.
2. Adekunle, e. a. (2015). A Review of Biochemical Process of Anaerobic Digestion.
Advances in Bioscience and Biotechnology, 205-212.
3. al., A. B. (n.d.). Methane and nitrous oxide emission from natural sources, DC: Office of
atomspheric programs, US EPA 2010.
4. Appels, L. e. (2011). Anaerobic digestion in global bio-energy production: Potential and
research challenges. Renewable and sustainable energy reviews 15 (2011) , 4295-4301.
5. Ariunbaatar, J. P. (2014). Enhanced anaerobic digestion of food waste by thermal and
ozonation pretreatment methods. Journal of Environmental Management.
6. Ariunbaatar, J. P. (2014). Pretreatment methods to enhance anaerobic digestion of
organic solid waste. Applied Energy.
7. Azeem khalid et., a. (2011). The anaerobic digestion of solid organic waste. Pakistan.
8. Azeem Khalid, e. a. (2011). Anaerobic Technology in Pulp and Paper Industry. Waste
Management, 1737-1744.
9. Bajpai, P. (2017). Basics of Anaerobic Digestion Process. Anaerobic Technology in Pulp
and Paper Industry, 7-13.
10. Cavinato C, e. a. (2011). Optimization of two-phase thermophilic anaerobic digestion of
biowaste for hydrogen and methane production through reject water recirculation .
Bioresource Technology , (18), 8605-8611.
11. Cesaro, A. &. (2014). Pretreatment methods to improve anaerobic biodegradability of
organic municipal solid waste fractions. Chemical Engineering Journal.
12. Chen, L., & Neibling, H. (2014). Anaerobic Digestion Basics. University of Idaho
Extension, 1-6.

46
13. Chernicharo, C. (2007). Anaerobic Reactors. Biological Wastewater Treatment, 04, 175.
14. EurObserv'er. (2008). Report The state of renewable energies in Europe pp 47-51.
15. Gerardi, M. H. (2003). The Microbiology of anaerobic digesters. New Jersey: John Wiley
& Sons, Inc.,.
16. Havukainen, S. P. (2018). Anaerobic digestion: Factors affecting anaerobic digestion
process. In Waste Bioremediation (pp. 343-359).
17. Havukainen, S. P. (n.d.). Anaerobic Digestion: Factors Affecting Anaerobic Digestion
Process. Springer Nature Singapore Pte Ltd. 2018 S. J. Varjani et al. (eds.), Waste
Bioremediation, Energy, Environment, and Sustainability, https://doi.org/10.1007/978-
981-10-7413-4_18.
18. Hill N, W. H. (2011). Guidelines to Defra/DECC’s GHG Conversation Factors for Company
Reporting: Methodology Paper/for Emission Factors. London: Department for
Enviromental, Food and Rural Affairs; 2011. Available:
http://www.defra.gov.uk/publications/files/pb13625-emissionfac.
19. Holm-Nielsen, J., Seadi, T., & Oleskowicz-Popiel, P. (2009). The future of anaerobic
digestion and biogas utilization. Bioresource Technology, 5478-5484.
20. (2006). International Energy Agency. Paris: World energy outlook.
21. (2000). IPCC . Special report on emission scenarios, Intergovernmental Panel on Climate
Change.
22. Li, Y. &. (2015). Effects of thermal pretreatment on acidification phase during two-phase
batch anaerobic digestion of kitchen waste. Renewable Energy.
23. Lise Appels, e. a. (2011). Anaerobic digestion in global bio-energy production: Potential
and research challenges. Renewable and Sustainable Energy Reviews, 4295-4301.
24. Lise Appels, J. B. (2008). Principal and potential of the anaerobic digestion of waste
activated sludge.

47
25. Liu, Y., & Joo hwa, T. (2004). State of the art of biogranulation technology for wastewater
treatment. Biotechnology Advances, 533-5563.
26. Macias-Corral, e. a. (2008). Anaerobic digestion of municipal solid waste and agricultural
waste and the effect of co-digestion with dairy cow manure. Bioresource Technology,
8288-8293.
27. Madsen, M., Holm-Nielsen, J. B., & Esbesen, K. H. (2011). Monitoring of anaerobic
digestion processes: A review perspective. Renewable and Sustainable Energy Reviews,
3141-3155.
28. MNRE- Ministry of new and renewable energy. . (2012). Booklets on renewable energy.
MNRE;Available: http://mnre.gov.in/re-booklets.htm(accessed04.02.12).
29. Molino, A. e. (2013). Biomethane production by anaerobic digestion of organic waste.
Fuel, 1003-1009.
30. Monnet, F. (2003). An Introduction to Anaerobic Digestion of Organic Wastes. Carbon, 1-
48.
31. Ostrem, K. &. (n.d.). "Greening waste: anaerobic digestion for treating the organic fraction
of municipal solid wastes".
http://www.seas.columbia.edu/earth/wtert/sofos/Ostrem_Thesis_final.pdf.
32. Parthiba, O. T. (2017). Pretreatment of Food Waste for Methane and Hydrogen Recovery:
A review. Bioresource Technology.
33. Salminen, E. &. (2002). Anaerobic digestion of organic solid poultry slaughterhouse waste
- A review. Bioresource Technology.
34. Shefali, V. (2002). Biodegradable Organics in Municipal Solid Wastes. Master's thesis., 1-
56.
35. Sisani, F. D. (2017). Greenhouse Gas Emissions and Environmental Impact from
Recycling the Organic Fraction of Solid Waste: Comparison of Different Treatment
Schemes from a Life Cycle Perspective. Recycling, 1-13.

48
36. Soriano, J. B. (2000). Emission of greenhouse gases from anaerobic digestion processes:
Comparison with other municipal solid waste treatments. Water Science and Technology,
275-282.
37. Sridhar Pilli., S. Y. (2015). Thermal pretreatment of sewage sludge to enchance anaerobic
digestion . Environmental science and technology .
38. Subhash Paul, e. a. (2018). Municipal Food Waste to Biomethane and Biofertilizer: A
Circular Economy Concept. Waste and Biomass Valorization, 601-611.
39. (2011). USEPA. Global anthropogenic non-CO2 greenhouse gas emissions. Washington:
Office of Atompsheric Programs Climate Change Division, U.S EPA;274pp.
40. Vhutshilo Nekhubvi, D. T. (2017). Methane Capturing Using Anaerobic Digestion
Technology: A Way Towards Mitigating Green House Gases in Limpopo Province, South
Afric. Nature Environment and Pollution Technology, 1243-1247.
41. Virdis, D. J. (2014). The role of anaerobic digestion in the emerging energy economy.
Current Opinion in Biotechnology, 142-149.
42. Weiland, P. (2010). Biogas production: Current state and perspectives. Applied
Microbiology and Biotechnology, 849-860.
43. Whiting, A., & Azapagic, A. (2014). Life cycle environmental impacts of generating
electricity and heat from biogas produced by anaerobic digestion. Energy, 181-193.
44. Zhang, e. a. (2014). Reviewing the anaerobic digestion of food waste for biogas
production. Renewable and Sustainable Energy Reviews, 383-392.
45. Zlatko, S. (2012). Investigation of co-digestion of food waste and primary sludge at SNJ-
wastewater treatment plant. In Master's Thesis (pp. 1-70).

49
Glossary
AD - Anaerobic Digestion
WWTP - Wastewater treatment plant
TWAS - Thickened waste activated sludge
BOD - Biochemical Oxygen Demand
CHP - Combined Heat and Power
COD - Chemical Oxygen Demand
HRT - Hydraulic Retention Time
MSW - Municipal Solid Waste
OLR - Organic Loading rate
pH - power of Hydrogen
SCOD - Soluble Chemical Oxygen Demand
SRT - Solid Retention Time
TCOD - Total Chemical Oxygen Demand
TS - Total solid
TSS - Total Suspended Solid
VFA - Volatile Fatty Acid
VSS - Volatile Suspended Solid