effect of human activities on the ecosystem of areas
TRANSCRIPT

i
EFFECT OF HUMAN ACTIVITIES ON THE ECOSYSTEM OF AREAS SURROUNDING
LAKE ELEMENTAITA, NAIVASHA SUB COUNTY, KENYA
MWENDWA EDWARD
NM12/0639/02
A Thesis Submitted to the Graduate School in Partial Fulfillment for the Requirements of the
award of Master of Science Degree in Environmental Science of Egerton University
EGERTON UNIVERSITY
MAY, 2014

i
DECLARATION AND RECOMMENDATION
This Thesis is my original work and to the best of my knowledge it has not been presented for
a degree or diploma in any other university.
Candidate’s Name:
Mwendwa Edward
Reg. No. NM12/0639/02
Sign:……………………………………………Date:……..…………………………………
Approval:
This Thesis has been submitted to the graduate school with our approval as the University
supervisors.
Prof. Francis K. Lelo
Laikipia University
Sign:……………………………………………Date:……..…………………………………
Prof. Samuel T. Kariuki
Department of Biological Sciences
Sign:……………………………………………Date:……..…………………………………

ii
COPYRIGHT
No part of this work may be produced, stored, retrieved or transmitted in any form or means;
electronically, mechanically, photocopying or otherwise without a prior permission of the
author or Egerton University.
© Copyright 2014, Mwendwa Edward

iii
DEDICATION
This work is dedicated to my wife Pauline and children Joe, Rose and Lynette.
iv
ACKNOWLEDGEMENT
First and foremost I thank the Almighty God for giving me the health, time and energy to
pursue and complete this study.
There are many people who supported and encouraged me during the course of this study. I
acknowledge with many thanks the useful discussions on this research that I have had with
Dr. Sarah Ogalleh, Dr Moses Esilaba of Environmental Science Department, Dr Erustus
Kanga Assistant Director and Head of Ecosystems and Landscape Conservation Kenya
Wildlife Service, Prof..S. T. Kariuki of Biological Sciences Department and Mr.S. Ojode of
Geography Department.
Special thanks go to my National Coordinator of Wildlife Clubs of Kenya Mrs. Margaret
Otieno for the support and by allowing me time to undertake the research. I also wish to
sincerely thank Mr.Kamau the Gilgil location area chief and Mr.Thuku the Assistant Chief
and local elders of Elementaita for mobilizing the community who gave me invaluable
support during the research period.
My wife Pauline played an important role in this work. Her support and encouragement gave
me much confidence and will to pursue the research and complete my studies.
Last but not least and above all I wish to thank my supervisors Prof. Francis Lelo, Prof Lois
Chiuri and Prof. S. T. Kariuki for their support, patience and understanding that enabled me
to complete this research.
v
ABSTRACT
The environmental degradation of areas surrounding Lake Elementaita arise from the
livelihood activities of the residents. Uncontrolled extraction of resources such as trees, grass
and soda/salt contrasts with conservation. This is further compounded by the free access to
the resources as a result of absentee landlords. This situation leads to lack of control and
management of resources thus exacerbating degradation activities around the Lake and its
riparian ecosystem. This study focused on the potential role of local communities in
addressing ecological problems around Lake Elementaita ecosystem. The objective of the
study was to identify human activities that cause environmental degradation around Lake
Elementaita. The study was carried out around Lake Elementaita riparian zone and data
collection was through the administration of a structured questionnaire among 183
households that were randomly selected. The data was analysed using Statistical Package for
Social Sciences (SPSS).Descriptive statistics was used to determine the mean and standard
deviations,’ inferential statistics was used to determine the relationship among variables and
between dependent and independent variables A focus group discussion was conducted and it
included a one day seminar organized for different stakeholders, local community leaders,
large scale ranchers, conservation groups, community based organizations and Kenya
Wildlife Services to share the research findings. The results from the research confirm that
rapid population growth, overstocking, poor farming practices coupled with low
understanding by the community of the interrelatedness between societal needs, economic
drivers and the environment is leading to negative impacts like increased soil erosion,
pollution, loss of habitats and biodiversity around Lake Elementaita riparian zone. This will
lead to serious environmental degradation that inevitably exacerbates poverty among the
community around Lake Elementaita. There is an urgent need for the government together
with all stakeholders to come up with a comprehensive participatory management wetland
policy .There will also be need to strengthen and coordinate agencies or government
departments whose mandate includes wetlands management. There is also need to carry out
education for sustainable development awareness and implement alternative livelihoods
programmes such as beekeeping, ecotourism and organic farming in areas where we have
wetlands.

vi
TABLE OF CONTENTS
DECLARATION AND RECOMMENDATION ................................................................. i
COPYRIGHT ....................................................................................................................... ii
DEDICATION .................................................................................................................... iii
ACKNOWLEDGEMENT ................................................................................................... iv
ABSTRACT ..........................................................................................................................v
TABLE OF CONTENTS .................................................................................................... vi
LIST OF TABLES .............................................................................................................. ix
LIST OF FIGURES ...............................................................................................................x
LIST OF ABBREVIATIONS AND ACRONYMS ............................................................ xi
CHAPTER ONE ....................................................................................................................1
INTRODUCTION .................................................................................................................1
1.1 Background Information .................................................................................................. 1
1.2 Statement of the Problem ................................................................................................. 4
1.3 Objectives ........................................................................................................................ 4
1.3.1 Broad Objective ............................................................................................................ 4
1.3.2 Specific Objectives ....................................................................................................... 4
1.3.3 Research Questions ....................................................................................................... 4
1.4 Justification ...................................................................................................................... 5
1.5 Scope and Limitations...................................................................................................... 6
1.6 Assumptions ..................................................................................................................... 6
1.7 Definition of Terms.......................................................................................................... 6
1.8 Operationalization of Variables ....................................................................................... 7
CHAPTER TWO ...................................................................................................................9
LITERATURE REVIEW ......................................................................................................9
2.1 Wetland ecosystems ......................................................................................................... 9

vii
2.2 Wetlands of Kenya ......................................................................................................... 10
2.3 Lake Elementaita Ecosystem ......................................................................................... 12
2.4 Causes of Wetlands Degradation ................................................................................... 13
2.5 Community Participation in Natural Resources Conservation ...................................... 15
2.6 Conceptual Framework .................................................................................................. 16
CHAPTER THREE .............................................................................................................19
METHODOLOGY ..............................................................................................................19
3.1 Description of the Study Area ........................................................................................ 19
3.1.1 Climate ........................................................................................................................ 19
3.1.3 Population and Human Settlement.............................................................................. 22
3.2 Research Design............................................................................................................. 22
3.3 Data collection ............................................................................................................... 22
3.3.1 Questionnaire .............................................................................................................. 23
3.4 Sampling Procedure ....................................................................................................... 23
3.5 Data Analysis ................................................................................................................. 24
CHAPTER FOUR ...............................................................................................................25
RESULTS AND DISCUSSION .........................................................................................25
4.2 Land tenure .................................................................................................................... 30
4.3 Human activities ............................................................................................................ 33
4.4 Resources around Lake Elementaita .............................................................................. 35
4.5 Pollution in the Lake Elementaita Riparian Zone .......................................................... 38
4.6 Perception on conservation issues in the lake Elementaita riparian zone ...................... 40
4.7 Chi-Square Test ............................................................................................................. 45
CHAPTER FIVE .................................................................................................................46
CONCLUSION AND RECOMMENDATIONS ................................................................46
5.1 Conclusion ..................................................................................................................... 46
viii
5.2 Recommendations .......................................................................................................... 46
REFERENCES ....................................................................................................................48
APPENDIX 1 ......................................................................................................................55
ix
LIST OF TABLES
Table1:Acreage of Land owned and used ………………………………………………….32
Table 2:Statiscal tools used in Data anlysis………………………... ………………………..33
Table 3: Resource useage around Lake Elementaita riparian zone ………………………..34
Table 4 Income generated from the various human activities around the Lake ………..38
Table 5: Perception of conservation issues ………………………………………………..41
x
LIST OF FIGURES
Figure 1: Conceptual framework……………………………………………………………..18
Figure 2: Map of Naivasha District showing the study site ………………………………..20
Figure 3:Map of Lake Elementaita showing the study area ………………………………..21
Figure 4: Distribution of respondents by village……………………………………………..25
Figure 5: Distribution of respondent by age ……………………………………………….26
Figure 6: Gender distribution of respondents ………………………………………………..27
Figure 7 : Education level of the respondent ………………………………………………..28
Figure 8: Marital status of the respondents ………………………………………………..29
Figure 9 : Number of dependents in the household ………………………………………..30
Figure 10 : Land tenure system of the land occupied by respondents……………………….31
Figure 11: Resources use in the Lake Elementaita riparian zone ……………………………37
Figure 12: Respondent's perception on soil erosion…….……………………………………39
Figure 13: Pollution source ……………………… ………………………………………39
xi
LIST OF ABBREVIATIONS AND ACRONYMS
DPP District Development Plan
FNLE Friends of Lakes Nakuru and Elementaita
GEMA Gikuyu Embu Meru Association
GoK Government of Kenya
IBA Important Bird Area
KWF Kenya Wetlands Forum
KWS Kenya Wildlife Service
LNDP Lake Nakuru Development Programme
MENR Ministry of Environment and Natural Resources
NDDP Nakuru District Development Plan
NGO Non Governmental Organization
NWP Naivasha Wetlands Program
PRSP Poverty Reduction Strategy Paper
UNDP United Nations Development Programme
UNEP United Nations Environment Programme
UNRISD United National Research Institute and Strategic Development
WCK Wildlife Clubs of Kenya
WWF World Wide Fund for Nature
WCMC World Conservation Monitoring Centre

1
CHAPTER ONE
INTRODUCTION
1.1 Background Information
Societies all over the world are closely linked to the natural environment in which
they are embedded. Human productive and social activities are shaped to a significant degree
by the natural resource mix available: physical geography, weather patterns, amenability of
natural conditions to transformation, and by a variety of other characteristics of the
environment like soil type, prevailing temperatures, air quality and water quality and
quantity. Environmental degradation, including depletion of renewable and non-renewable
resources, air and water pollution and solid wastes, can be significant sources of stress upon
societies. It may induce changes in settlement patterns and disrupt established social
relations (UNRISD, 1994). Awareness and concern about environmental degradation have
grown around the world over the last few decades. The concerns are shared by people of
different nations, cultures, religion and social classes.
Environmental degradation is a process induced by human behavior and activities that
damage the natural environment (Anon, 2007). High human population growth rates and
economic development have led to degradation of wetlands, forests, habitats and air quality
(Mennonite, 1999). High poverty levels amongst most developing countries have accelerated
the rate of natural resources destruction, since the poor depend on natural resources directly
for their livelihood (IUCN, 1999).
Degradation of wetlands affects both developing and developed countries. Since
1990, half of the world’s wetlands have disappeared. For example, in the United States, an
estimated 54% of its original wetlands no longer exist (UNEP, 1990). There is evidence that
a similar pattern of wetland degradation is taking place in developing countries. Degradation
of wetlands has been aggravated by the insatiable demand to meet the needs of an ever-
increasing human population. Environmental degradation within the wetland ecosystems
shows a diminishing natural resource base whose effect and impact is measured by the ever-
increasing levels of poverty of the catchment and riparian communities (UNEP, 1992).
However, the decline of wetlands globally and an appreciation of their ecological and

2
economic functions and values has recently generated concern from international and
regional communities (Pyrovertsi and Dautopoulos, 1999).
In Kenya, the Ministry of Environment and Natural Resources (MENR) estimates that
wetland ecosystems (freshwater and saline) cover only 2-3% of the country’s surface area
and are found mostly within the Great Rift Valley they include: Lake Nakuru, Lake
Elementaita, Lake Baringo, Lake Naivasha, Lake Bogoria and Lake Magadi (NWP, 2001).
Destructive and exploitative human activities are evident in the surrounding areas. These
unsustainable human activities are visible in Mau escarpment, Bahati and Ndondori forests,
which are the main catchment areas for Lake Nakuru, Lake Bogoria and Lake Elementaita
respectively. Research on the relationships between farmers activities and wetlands is nearly
nonexistent in Kenya and rather limited internationally (Wilson, G.A.1996).Similarly,
quantitative analysis of the effects and impacts of agriculture on wetlands is limited
(Beopoulous,N.1996) due to insufficient environmental monitoring.
Increased awareness about the adverse environmental and socio-economic
consequences of the unwise exploitation of wetlands has resulted in worldwide calls for the
sustainable management of fragile resources. However the unsustainable use of wetland
resources has increasingly proven to be an extremely difficult and frustrating task in many
developing countries. A substantial amount of literature that has appeared on this issue tends
to carry the undertone that poverty is one of the major factors that make it difficult to achieve
the sustainable use of wetlands. Some writers note that modern approaches to natural
resource conservation are simply conflicting with the survival strategies of the poor in
developing world that are dependent on wetland resources.(Mironga,J.M.2003).There has
been a growth of interest in wetlands and accompanying change of attitude (
William,M.1991),In some countries the rates of wetland degradation is slowing down while
at international level, the protection of wetlands is clearly reflected in the Ramsar convention
( Hollis et al,1994).This convention plays an important role in facilitating the protection of
wetlands of international significance and Lake Elementaita is one of them.
Increased uses of chemicals like fertilizers and pesticides in agricultural activities in
the catchment area are impacting negatively on the wetland ecosystems. Kenya Wildlife
Service (KWS), World Wide Fund for Nature (WWF) from independent researches carried
out at different time spans on lesser flamingoes in Lakes Elementaita and Nakuru established

3
that the Lakes were threatened by sedimentation, livestock wastes and toxic wastes (KWS
,2002 WWF 2006).Human activities like agriculture have both primary and secondary
environmental effects. Primary effects arise where agricultural activities take place, for
example soil erosion. Secondary effects are those effects on the environment away from
agricultural sites, for example the use of pesticides or fertilizers in the watersheds. These are
washed off the land through erosion and end up in rivers, streams, lakes and oceans causing
ecosystems to be highly eutrophicated thus destroying food chains and aquatic life.
Reports by various authors’ document that environmental degradation can be
worsened in situations where ownership of natural resources is undefined. For example,
Bromley, (1989) states that ownership of natural resources such as freehold or free access
leads to unsustainable exploitation of natural resources and hence degradation. More often,
free access is a result of ineffective resource rights regime which claim rights over a resource
but lack the means to fulfill the responsibilities involved. The vacuum in control and
management leads to uncontrolled exploitation, which is highly threatening to sustainability
(Berkes, 1989). This situation in Kenya’s Rift Valley lakes that is home to flamingos is
posing a serious threat to this rare birds survival since they frequent these lakes in large
numbers either to breed or feed. The lakes are also important stopovers for other migratory
birds like Spoon Billed Sand Piper, Great White Pelican and the Eurasian Marsh Harrier.
(WWF – Lake Bogoria, 2002).
In industrialized countries, the consequences of loss and degradation of wetlands have
often been mitigated with expensive artificial constructions, such as major flood protection
schemes or water purification plants which is not the case in developing countries because
mitigation measures may take too long to be implemented mostly due to financial and
technical constraints (Kotze et al, 1995). It is from this background that this study was
conducted to investigate the impact of human activities around Lake Elementaita ecosystem
and look for feasible solutions for sustainable management of its riparian area as well as to
seek possible livelihood alternatives for the adjacent community. The findings could provide
long term reprieve for the other Rift Valley lakes facing similar challenges.

4
1.2 Statement of the Problem
The area surrounding Lake Elementaita is partly private land, with a large part
surrounded by small parcels of land that have been settled but some owners are not resident
thus exposing their land to free access. The area surrounding Lake Elementaita is rich in
biodiversity and is a habitat for numerous species of waterbirds some of which like the lesser
flamingoes are threatened due to habitats being compromised. Anthropogenic activities such
as catchment degradation, deforestation, charcoal burning, settlement, siltation, overgrazing,
introduction of alien species, pollution and water abstraction are threatening the Lakes
ecosystem, values, functions, and ecological integrity. The increasing human population in
the area, the current land use practices in this water deficit area only compounds the fragile
ecosystem. There is therefore need to establish the effect of diverse human activities being
carried out on the ecosystem of areas surrounding Lake Elementaita so that informed
decisions can be made so as to mitigate against its degradation.
1.3 Objectives
1.3.1 Broad Objective
To determine the effect of human activities on the ecosystem of areas surrounding Lake
Elementaita in Naivasha Sub-County.
1.3.2 Specific Objectives
1. To identify major human activities around the Lake Elementaita riparian zone
2. To identify the resources that are exploited by communities within lower and upper
viewpoint of Lake Elementaita
3. To identify and characterize the sources of pollution around Lake Elementaita
riparian zone
4. To determine the local communities’ perception on the conservation issues within
their ecosystem
1.3.3 Research Questions
1. What are the major human activities practiced in the Lake Elementaita riparian zone?
2. Which resources are exploited by communities within the lower and upper viewpoints
of Lake Elementaita?

5
3. What are the major sources of pollution affecting the riparian zone of Lake
Elementaita?
4. What is the local community perception towards conservation issues?
1.4 Justification
Over the years there has been diminishing vegetation cover, through deforestation and
overgrazing in areas surrounding Lake Elementaita. While most deforestation is done by
cutting of trees for fuel wood and charcoal production, overgrazing is done by migratory
livestock (KWS, 2000). There is uncontrolled charcoal burning, soda/salt mining around the
shores of the lake and overgrazing in the surrounding rangelands leading to diminishing
vegetation and soil erosion.
The problem is compounded by the fact that the area lies in a semi-arid area where
rainfall is low and also unreliable. This has led to situations where the lake has almost dried
up completely, a manifestation of catchment destruction and water abstraction from rivers
leading to reduced flow of water reaching Lake Elementaita. The depth of the lake fluctuates
between 0.7-1.0metres (KWS, 2010).This only confirms the need to reduce activities that
may lead to the death of this ecosystem. As a result of frequent dry spells and poor crop
yields from their land the surrounding communities eke their living through exploitation of
the natural resources within their ecosystem. These activities enhance environmental
degradation. A review of secondary information about Lake Elementaita shows that little
information exists about the potential of Lake Elementaita and no research has been done to
ascertain the effects of human activities on the ecosystem of areas surrounding the Lake.
Lake Elementaita was designated as the 5th Ramsar site in Kenya in 2005 when it was
enlisted as a wetland of international importance due to its role as a refuge for threatened,
vulnerable and endangered bird species. The environs surrounding the Lake are rich in
biodiversity and were designated as one of the Important Bird Areas in Kenya in 1999. Lake
Elementaita and its surrounding riparian lands was also proclaimed as a National Wildlife
Sanctuary in 2010.In 2011,Lake Elementaita,Lake Nakuru and Lake Bogoria were all
inscribed by UNESCO as part of Kenya Lakes System in the Great Rift Valley Heritage Site.
The international status bestowed on this ecosystem makes it imperative to protect and
conserve it for posterity. The research was purposed at integrating the local people’s needs,

6
their valued resource base within the ecosystem and perceptions about the future of the
riparian area. The results from the study will provide .essential information to policy makers,
implementing agencies, researchers, communities and other interested stakeholders to
understand the need for community participation in identification, analysis, mitigation of
environmental degradation around Lake Elementaita ecosystem.The results from the research
will be useful in finding long term integrated approach to the conservation of natural
resources around Lake Elementaita and other parts of the country facing similar challenges.
From the aforementioned, areas surrounding Lake Elementaita formed an ideal study site to
do research on effects of human activities.
1.5 Scope and Limitations
The research was carried out around the riparian zone of Lake Elementaita but
confined to not more than 3km from the lake shore areas under settlement :to the North east,
North West and South East. The main limitation to the research was the inability to establish
the effect of the pastoralists grazing in the area and the effect of other activities being carried
out beyond the 3km from the Lake shore.
1.6 Assumptions
The main assumptions were that the weather conditions prevailing during the research
would not change drastically, the population of the area will remain fairly constant and their
would be no sub division of land or new settlements in the area
1.7 Definition of Terms
Community: This is a sociological group of people with their animals, plant organisms
sharing an environment
Lake: a lake is a hollow depression or a basin on the earth surface where water has
accumulated or collected. Lakes vary in size, depth and performance
Degradation: This is the deterioration of any of the environmental resources such as water,
air, soil, and biological resources
Independent Variables: These are controlled or selected by the researcher to determine
their relationship to an observed phenomenon. In this study, the independent variables are
the socio-economic activities carried out by the community around Lake Elementaita.

7
Dependent Variables: The dependent variable usually cannot be directly controlled.
According to the study, the dependent variable is degradation of the Lake Elementaita, which
will solely depend on the socio-economic activities of the households living around the lake.
Intervening Variables: These were assumed to be manifestations of the on-going
degradation around the lake. These included soil erosion, depletion of the environmental
resources around the lake that lead to loss of biodiversity and threat to livelihoods.
Socio-economic activities: These are activities carried out by people for the purpose of
earning a living. Around Lake Elementaita, the activities include charcoal burning, salt
harvesting, agriculture and livestock rearing.
Status: This is the environmental position or situation in terms of conservation and
degradation of an ecosystem, in this case, the areas surrounding Lake Elementaita.
Absentee Land Owners: These are people who own land around lake Elementaita but they
are not physically present thus enabling free accessibility to their parcels of land and
resources around the lake.
1.8 Operationalization of Variables
Human activities: These are activities done by individual community members to meet their
daily needs and will be achieved by response to the question “what are your main sources of
income?”
Soil erosion: This was verified by the observable degradation and perceptions of land
degradation, the level of bareness of the land by both the respondent and the interviewer. It
will be achieved by the response to the question ‘how do you rate the level of soil erosion in
both the respondent’s home and surrounding?’. Also, the interviewer will have a checklist of
observable topographical characteristics within the Lake and its environs.
Depletion of resources: This was the deteriorating state of the natural resources both in
quality and quantity. This was achieved by the response to the question ‘are the natural
resources increasing within the lake? And ‘Is the quality of the resources within the lake
increasing?’

8
Threatened household livelihoods: This was verified by the economic status of the
households in terms of their socio-economic activities within the Lake. It was achieved by
the response to the question ‘How much income do you get from the agricultural produce?
How much income do you get from the resources harvested from the lakes environ? How do
you rate your household well being since you settled in the environ?
Loss of biodiversity: This was the diminishing state and numbers of the biodiversity within
the ecosystem and its environs. It was achieved by response to the question, has the number
of flamingoes and other wildlife been increasing? Rate the status of the environment for
biodiversity within the Lake?
Degradation of the lake: This was the degraded Lake’s environ and it was achieved by the
response to the question ‘has the size of the lake diminished? Is the lake water polluted? Has
vegetation cover within the lake diminished? Has the bird population diminished?
Community participation: This was the direct involvement of the community in identifying
environmental issues within the lake and its environs, stating how the issues could be
addressed and commitment to implement the research findings. This was gauged by the
response to questions ‘What mitigation measures do you propose to be implemented at the
household level to conserve the lake? ‘Would you and your household be willing to
participate in the conservation of Lake Elementaita ecosystem?’

9
CHAPTER TWO
LITERATURE REVIEW
2.1 Wetland ecosystems
The Ramsar convention on wetlands of international importance defines wetlands as
“areas of marsh, fern, peat land or water, whether natural or artificial, permanent or
temporary, that is static, flowing, fresh, brackish or salty including areas of marine whose
depth at low tide does not exceed six meters” (Ramsar, 2003). Wetland ecosystems were the
first to receive international attention through the “Convention on Wetlands of International
Importance” especially as habitats for waterfowls opened for signature at Ramsar, Iran in
February 1971. According to Williams (1990), Barbier and Edward (1994), since 1990 over
half of the world’s wetlands have disappeared. Although wetlands had earlier been
considered to be wastelands and therefore worthless, today their value in sustaining
ecological integrity is appreciated. Their hydrological-physical, chemical, biological and
socio-economic benefits are acknowledged. For example, according to Doust & Doust
(1995), wetlands have been described as nature’s kidneys. They also describe wetlands as
nature’s womb (nursery for organisms) and liver (detoxification centre for pollutants and
excess nutrients). It is estimated that as many as 45% of the endangered animals and 26% of
plants either live in wetlands or depend on them for their continued existence (Botkin &
Keller, 1995). Many ecologically and economically important species call wetlands home for
at least part of their lives. For instance, commercially important fishes and shellfish,
including shrimp, bluecrab, oysters, salmon, trout and seastrout rely on or are associated with
wetlands. Wetlands are also critical habitats for migratory birds and waterfowl, including
ducks, egrets and geese. In fact more than one-third of the species listed as threatened or
endangered in the United states live solely in wetlands and nearly half use wetlands at some
point in their lives (USEPA, 1995).As such many wetlands are often recognized as important
conservation or restoration targets
Wetlands also act as carbon sinks; provide protection to coast fronted by salt marshes
and mangrove (Berry, 1994). They are also important in removal of non-point sources of
pollution as they are capable of removing up to 90% of sediments and nitrates and up to 50%
of phosphates entering wetlands (Gilliam, 1994).While covering only 6% of the Earth’s

10
surface, wetlands provide a disproportionately high number of ecosystem services, in
addition to maintaining biodiversity. For instance wetlands also mitigate floods, protect
coastal areas from storms, improve water quality, recharge underground aquifers, serve as
sinks, sources or transformers of materials and produce food and goods for human use. When
evaluating economic value of these various functions, Constanza et al.(1997) concluded that
the economic value provided by wetlands ecosystems exceeded that provided by
lakes,streams,forests and grasslands and was second only to that provided by coastal
estuaries. Wetlands therefore, constitute some of the most important biological and ecological
ecosystems on the face of the earth.
2.2 Wetlands of Kenya
Kenya ratified RAMSAR convention in 1990. Since then, the country has designated
Lakes Nakuru,Bogoria,Elementaita and Naivasha as wetlands of international importance
(Ramsar sites) in accordance with the requirements thereof (Kiai and Maillu, 1992).
According to the Kenya National Environment Action Plan (NEAP), a substantial proportion
of Kenya’s water resources are found in wetlands, which cover 2% to 3% of the country’s
surface area (Government of Kenya, 1994).Wetland ecosystems in Kenya are diverse and
important natural resources which include areas of ecological importance and conservation
value both nationally and internationally. They are vital components of the hydrological cycle
and essential breeding, rearing and feeding habitats for many species of fish, waterfowl and
other wildlife. Kenya wetlands are exploited on both seasonal and long term sustained basis
through grazing, direct harvesting of plant material and fishing. They provide opportunities
for recreation and tourism besides being major sources of water for industrial works,
domestic, livestock and agricultural uses (Mavuti, 1989).
Most natural wetlands ecosystems in Kenya and other tropical countries are
threatened by hydrological, agricultural and other human activities (Mavuti, 1989).
Increasing national and international recognition of the values of wetlands has intensified the
need for reliable information on the status and extent of these natural resources. Some of
the larger wetlands of Kenya include the shallow Lakes: Nakuru, Naivasha, Magadi,
Kanyaboli, Jipe, Chala, Elementaita, Baringo, Ol Bolossat, Amboseli, the edges of Lake
Victoria, Lorian, Saiwa, Yala, Shampole swamps; Lotakipi, Kano Plains, Kisii valley
bottoms, Tana delta, coastal wetlands including the mangrove swamps, sandy beaches, sea

11
grasses and coral reefs. The Kenyan wetlands play a fundamental ecological role and have
potential as resources of great economic, cultural and scientific value. Among the critical
values are:
Wetlands provide critical habitats for a wide range of flora and fauna. Their
biodiversity includes a large number of aquatic plants, fish, herbivores and avifauna
of resident and migratory birds;
Wetlands are important sources of water for human consumption, agriculture and
watering of livestock. They recharge wells and springs that are often the only source
of water to some rural communities, for livestock watering and for wildlife support
systems. The recharging of aquifers, raises the water table making groundwater easily
accessible. This has been the case in western Kenya, along the Tana river corridor and
in the Chyulu hills catchment area for Mzima springs and the Nol-Turesh water
supply system.
Wetlands provide economic benefits through fisheries and generation of products
such as fuelwood, building material, medicine, honey and various types of natural
foods;
Wetlands are important grazing areas. They are the only sources of water and
pasture/fodder for the pastoral communities during drought in the ASALs;
Wetlands serve a wide variety of ecosystem functions including flood control, water
purification, shoreline stabilization and sequestration of carbon dioxide;
Wetlands are areas of great scenic beauty. They are a tourist attraction, form
important recreation sites for game and birds watching, swimming, photography and
sailing;
Wetlands have great potential for multiple uses (including agricultural) so long as
precautionary measures are taken for sustainable development.(GOK,1994)
By 1990, when Kenya ratified the Ramsar convention, most of the country’s wetlands had
been degraded. Drainage, land reclamation, overgrazing, eutrophication of inland waters
caused by agricultural pollution are among the impacts of agriculture on Kenya’s wetlands.
12
2.3 Lake Elementaita Ecosystem
Lake Elementaita ecosystem provides habitat for both endangered birds like the lesser
and greater flamingo. These species are threatened because of their habitat specificity . The
world famed flamingoes have made the Lake their alternate “home” especially after the 1994
severe drought that caused Lake Nakuru to dry up. Other birds like the Black Heron, Little
Bittern, White Backed Duck, Maccao Duck, African Marsh Harrier, Allen’s Gallinule, Black
tailed Godwit and , migratory species like Eurasian Marsh Harrier, Spoon Billed Sand Piper
and various species of Avocets are also found in the locality. The lake is also a breeding site
for a number of bird species among them the white backed pelicans, Red-knobbed Coot the
African Jacana, the Blacksmith Plover and the African Snipe (KWS & NWP, 2000).
The riparian land around Lake Elementaita functions as an important grazing area for
local people and migrant pastoralists from as far as Narok County. The pastoralists have
annual cycles of transhumance (Aboud, 1992), where they move with their livestock in
search of pastures. The free access to Lake Elementaita riparian land makes it an ideal fall
back for dry season grazing for migrant pastoralists. Lake Elementaita and other lakes like
Nakuru, Bogoria, Magadi and Shampole wetland attract both local and foreign tourists, being
alkaline in nature they form important habitats ecosystems for the world famed birds; the
flamingoes. Lake Elementaita’s uniqueness lies in the fact that it is very shallow and the
presence of the extensive stand of pristine acacia woodland at its northern end; a habitat for
different woodland birds (Mwaura and Ogendo, 1993). The intricate relationship between
these alkaline lakes offers perfect balance of food availability in times of drastic weather
fluctuations that is common in rift valley lakes (Harper et al, 2003). These alkaline lake
ecosystems are valued for their aesthetics, recreational areas, nature reserves or national parks
(Williams, 1990). However, these benefits are threatened by unsustainable anthropogenic
activities within the riparian land and the catchments. Moreover, due to its outstanding
scenic beauty, coupled with the spectacle of mass bird movements and the unique ecology of
its harsh saline lake ecosystems, Lake Elementaita was recommended for inscription on the
world heritage list. This lends credence for this study to develop a feasible programme suited
for its conservation.

13
2.4 Causes of Wetlands Degradation
Wetlands are among the most productive ecosystems due to their functions and
attributes despite the fact that they have the potential of contributing significantly to the
socio-economic development of Kenya, they face diverse and severe threats. These threats
include among others inappropriate human activities within the catchments and in the
wetlands, lack of coordinated and holistic policy guidelines and climate change (KWF,
2010).The threats have induced changes that have eroded the ecological and socio-economic
values and services derived from wetlands. The underlying threat remains lack of recognition
of the importance of these wetlands.
Environmental degradation entails deterioration of any of the environmental
resources, water, air, soil and biological resources. Agriculture is the biggest land use in
terms of area globally and also the most significant in terms of impacts (Mathus, 1986). For
example, intensive agricultural activities in the catchment areas such as the Mau complex,
Mt.Kenya, Cherangani Hills, Aberdares ranges and Mt Elgon have increased since the early
1990”s.when uncontrolled human encroachment and settlement took place. These activities
have led to increased use of chemicals such as fertilizers and pesticides. Through surface run
off, these chemicals are washed to the wetlands thus affecting biodiversity and impacting
negatively on Lake Ecosystem. For instance, in the period 1994-1995, it was found that there
were massive flamingo deaths caused by heavy metals and toxins in Lake Nakuru. These
metals and other toxic substances were from Nakuru town resulting in the overgrowth of
cyanobacteria species and toxic blue-green algae species in the lake (L.N.D.P-WWF, 1995).
On the other hand Raini, (1995).shows that soil erosion is the major cause of degradation
from agricultural lands causing siltation of dams, rivers and lakes. In the early 1980s the
recorded depth of Lake Baringo was 8.9m, Lake Nakuru was 4.5m and Elementaita was
2.0m, while today are usually less that 2m for Lake Baringo, less than 2.0m for Lake Nakuru
and less than 1.0m for Lake Elementaita.(WWF,1995).
Moreover, between 1970-1986, more than 400 sq.km of forest and areas under natural
vegetation within Lake Nakuru catchment were estimated to have been cleared for cultivation
and settlement. Large farm holdings purchased from European owners were fragmented into
smaller individually owned parcels of land. (Nakuru District Environment Report,1987). In
the catchment, rural population densities were lower, but have continued to raise from 164

14
sq.km in 1979 to more than 375 persons per square km in 1999 .The population increase
inevitably leads to more land being cleared for settlement and agricultural activities thus
exacerbating soil erosion. The depletion of natural ground cover is also thought to have
altered the hydrological regime of the catchment thus leading to more repository of sediment
and nutrient loads carried by feed rivers.( Kimani et al, 1992).
Lake Naivasha which is the only freshwater lake in the rift valley is threatened by the
land use transformation in the watershed. The population of the areas surrounding the lake
has rapidly grown from 43,867 in 1969 to the current figure of about 250,000.Since
independence in 1963, the area around the lake has witnessed rapid land use transformation
from commercial ranching to a mixture of rapidly growing smallholder agriculture activities
around the riparian area..The poor farming activities result in surface run off that is loaded
with a lot of nutrients that cause eutrophication of Lake Naivasha as evidenced by the lash
growth of hyacinth .This is posing a negative impact on the sustainability of the lake
(Mireri,2005).
Lake Elementaita is located in a water deficit area and this is due to the semi arid
conditions that characterize the area. The erratic and unreliable rainfall creates a very fragile
ecosystem around the riparian zone. The human encroachment and resultant deforestation of
the catchment areas such as Mau, Nyandarua, Ndondori and Bahati forests has compounded
the already delicate situation by reducing the volume of water flowing into the lake (KWWG,
2000). This has led to the water level going down. For example, the lake declined from 40
sq.km in 1995 to 36.5 km square in 2000 (WWF, 2002).
Livestock keeping is one of the agricultural activities that contribute significantly to
the economy and livelihood of the people in semi arid areas. However, livestock keeping are
among the main causes of land degradation in areas of rainfall deficit especially around
wetlands. The situation is compounded during the dry seasons when wetlands traditionally
become fallback areas for livestock and wild herbivores. For example, Fisher et al, (2005)
while carrying water quality and solute concentration in the rivers that drain into Lake
Naivasha found out that the levels of nitrate-nitrogen concentration in a river correlate highly
to the stocking density in a given catchment. Even the amount of coliforms present in water
has been found to relate to livestock activities in a given watershed (Fisher et al, 2005).
According to Kenya Wildlife Service and Naivasha Wetland Programme, livestock grazing in

15
the wetland destroys nests for ground nesting birds. Livestock also accelerates the process of
soil erosion through trampling and removal of vegetation cover especially where the land’s
carrying capacity has been exceeded, leading to overgrazing.
2.5 Community Participation in Natural Resources Conservation
Since the early 1990s there has been a significant paradigm shift in conservation and
natural resource management away from state centred control towards approaches in which
local people play a much more active role - often referred to as devolved, or community
based natural resource management. This shift in thinking has been brought about by
increasing recognition that centralized decision making, control and enforcement of natural
resource management through government agencies, have often proven ineffective and
brought about resource degradation rather than sustainable use (Wyckoff-Baird, 1997). The
main assumption underpinning participatory natural resource management is that greater
participation in decision-making is a positive good in itself, and has multiple benefits. Such
decentralized arrangements allow more community participation, leading to better
representation and empowerment. Participation and decentralization have been shown to
promote equity and social development through greater retention and sharing of the benefits
derived from natural resources at the local level (Ribot, 1999). A further assumption is that if
resources are managed at the local level by communities, they will be looked after better, and
more efficiently, resulting in improved opportunities for sustainable livelihoods (SLSA,
2003). This increases the likelihood of positive outcomes for the natural environment - the
argument that people are less likely to degrade their resource base if they feel a sense of
ownership in decision making and see positive returns from the careful use of available
natural capital.
The need to ensure sustainable human activities and improved community livelihood
is a national goal in Kenya (PRSP, 2004). However, most development projects have not
improved the living standards of the target groups. This has been attributed to the fact that
most of the projects were top-down with no input from would be beneficiaries. This scenario
led to failure of the projects since people felt completely alienated (Mathus, 1986). The
involvement of the community in decision-making process on the use and management of
natural resources leads to a change of attitude (Martin, 1986).
16
A good example is the Communal Areas Management Program for Indigenous
Resources (CAMPFIRE) project that was started in Zimbabwe in the 1980s.This project is
credited for transforming community attitudes towards wildlife conservation on communal
lands. Previously, wildlife was under the exclusive protection of the government and the
legalized hunting a preserve of the few rich. This brought about intense human wildlife
conflict and increased poaching activities. The local community who lived with this wildlife
felt ignored and saw no economic benefit of the wildlife resource. The CAMPFIRE project
was started to give full control of wildlife management to rural communities by creating
appropriate institutions under which natural resources would be utilized in a sustainable
manner. The nature based enterprises set up by the communities brought about benefits which
were shared to individual households. This changed the community attitudes and they
became good wildlife managers and cases of human-wildlife-government conflict reduced
drastically. The success was because the community were involved in decision making
process (Jansen,1980) .
Arabuko Sokoke Kipepeo Project (ASKP) is a successful initiative of community
participation in the management and use of Arabuko’s natural forest. The forest is of
international importance because of the endemic and endangered bird species (Ashley, 1998).
The forest was faced with threats arising from illegal invasion of squatters, unsustainable
resource harvesting and pressure for degazettement to give room for agricultural activities
and human settlement. The change of attitude arose through training community members on
how to rear pupae within the forest for export. The once “unfriendly” community became
ardent crusaders for the conservation of Arabuko Sokoke forest since they were getting
financial benefits from the Kipepeo project. The experience from Kipepeo project
demonstrates that communities are not averse to conservation (Lelo, 1994). Failure to
consider community interests in conservation can lead to more degradation as people struggle
to meet their livelihood needs.
2.6 Conceptual Framework
The conceptual framework (Figure 1) demonstrates the relationship of the study
variables. Human activities form the independent variable that results in the intervening
variables such as soil erosion, depletion of environmental resources such as water, forest
products; threatened livelihoods due to degrading and declining resources (land), loss of

17
biodiversity among other loses. The intervening variables are the manifestations of Lake
Elementaita”s degradation; which is the dependent variable of the study. The ecosystem
degradation is also the resultant effect of all the aforementioned activities on the
environment.
The present situation is such that there is free access to Lake Elementaita ecosystem
and this has created a situation where exploitative human activities like salt/sand mining,
charcoal burning and overgrazing are carried out with little regard to the integrity of Lake
Elementaita. The study aims to develop feasible programme that would be adopted by the
households within the ecosystem in order to conserve the lake. Once the programmes are
adopted, it is anticipated to mitigate most of the degradation that is within the area.

18
Figure 1: Conceptual framework
Human activities
Around Lake
Elementaita Riparian
ecosystem
Soil
Erosion
Depletion of
Resources
Threatened
Household
livelihood
Degradation of
Riparian Zone
Loss of
Biodiversity

19
CHAPTER THREE
METHODOLOGY
3.1 Description of the Study Area
Lake Elementaita is situated in Gilgil location, Naivasha District (Figure 2) and is 00
27”S and 360 15E. in Naivasha District was curved from the greater Nakuru District in 2007.
It lies on the Eastern floor of the Great Rift Valley within the Rift Valley province of Kenya.
Geographically, it is surrounded by Nyandarua hills to the North East and Eburru hills to the
south. The Nakuru – Nairobi highway dissects the division. The Lake (Figure 3) is 1772
meters above sea level and is served by rivers Meroroni, Mbaruk and Kariandusi. The Lake
has a maximum depth of one metre and occupies an area of 36.5 sq. km (NDDP, 2002). The
study covered the area from the lake shore and its environs as shown on figure 3. A distance
of about 3km on the northeastern side, the acacia woodlands and the settlement bordering
Soysambu farm.
3.1.1 Climate
Lake Elementaita is located in ecological zone IV, which is classified as semi-arid,
characterized by low and erratic rainfall. Climatic conditions around Lake Elementaita are
strongly influenced by altitude and physical features. The maximum temperatures are about
30oC, December to January being the hottest months. The area receives an annual rainfall of
less than 750 mm per annum with evaporation rate of 46%. The main economic activity is
livestock keeping and subsistence farming. Most of the livestock are local indigenous breeds
of cattle, sheep and goats. (NDDP, 2002).,that include Acacia woodland, dry bush land, lake-
side grasslands and swamps (Mwaura and Ogendo, 1993). The woodland vegetation is
concentrated around the rivers with the Acacia xanthophloea as the dominant species. The
dry bushland covers part of the eastern and much of the southern part of the southern part of
the lake. The main tree species are Acacia xanthophloea and Euphorbia candelabrum. Bush
species are dominated by Rhus natalensis and Sesbania sesban.

20
Fig. 2 Map of Naivasha District showing the study site

21
Fig 3 Map of Lake Elementaita showing the study site

22
The area around the lake is surrounded by short salt tolerant grass, sporobolus spicatus
(Mwaura and Ogendo, 1993). Swamps cover part of the south eastern area of the lake. These
comprise mainly of Typha spp and Cyperus papyrus. The Cyperus species is widespread
over the northern and other parts of the lake.
3.1.3 Population and Human Settlement
The area around Lake Elementaita was settled in the early 1990’s when the land was
sub-divided by Gikuyu, Embu and Meru Association (GEMA), a land buying company.
When the sub-division was done not all owners settled due to the harsh climatic conditions
(FLNE & WWF, 2001, Lelo et al, 1993). The population of Naivasha district was 225,546 in
2009 (CCN,2009) and according to the population census of 1999 it is growing at an average
of 4.85% annually. This si a high growth rate that has the potential of impacting negatively
on the available natural resources, in view of the semi-arid climate that is prevalent in the
district. The district has population density of 98 persons per square Km for Naivasha
division and 96 persons per square for Gilgil division respectively (CCN, 2009).
3.2 Research Design
A survey research design was conducted for this study from April to August 2011.
Data collection was through the administration of structured questionnaire and researcher’s
observation.
3.3 Data collection
Data was collected through researcher’s observations and administration of
questionnaires The researcher made observations and analysed what was happening in the
study area guided by an observation checklist (Appendix II).The researcher took a transect
walk from Lake Elementaita Lodge to the Lakeshore. This approach is important in
comparing the published information with the actual occurrences in the study area. This was
used to assess variables like trees planted within the individual plots, extent of deforestation,
slope of the land and extent of soil erosion among others. This was necessary in order to
corroborate information got from secondary data and from the key informants. The informal
discussions with people encountered along the route will enrich and clarify various aspects of
resource use. The field notes taken were compiled and documented in a chart format. The

23
method was important to establish the communities pressing problems and opportunities
available to solve the problems.
3.3.1 Questionnaire
A questionnaire consisting of open ended and closed ended questions was
administered to household heads. The questionnaire (Appendix 1) was administered to
household heads randomly selected within the study area. The questionnaire was to provide
socio-economic information about the households related to the lake, degradation trends of
the lake and its environs as well as perceptions of the local communities about the lake. This
included information on land occupancy, land use, land tenure and socio-economic activities
of households among others. The questionnaire was administered after being pre-tested to
ensure it elicits reliable, valid and accurate data.
3.4 Sampling Procedure
Stratified random sampling method was applied to obtain a sample of household
resident within 3 Km from the shores of the lake to the northeastern side, the acacia
woodlands and the settlements bordering Soysambu farm and the area was divided into 3
blocks (see map of study are figure 3) to which the questionnaire was administered to every
2nd household. This is a techniques whereby a group of subjects (a sample) is selected for
study from a larger group (a population). Each individual is chosen entirely by chance and
each member of the population has an equal chance of being included in the sample. Every
possible sample of a given size had the same chance of being selected. The unit of analysis
was the household and the subject of analysis was the household head. A total of 350
households around Lake Elementaita and its environ constituted the sampling frame.
According to Kathuri and Pals, (1993) the sample size used was based on the following
formula:
X2NP(1-P)
S = d2(N-1) + X2P (1-P)
Where:
S = required sample size
N = sample frame (the given population size)
24
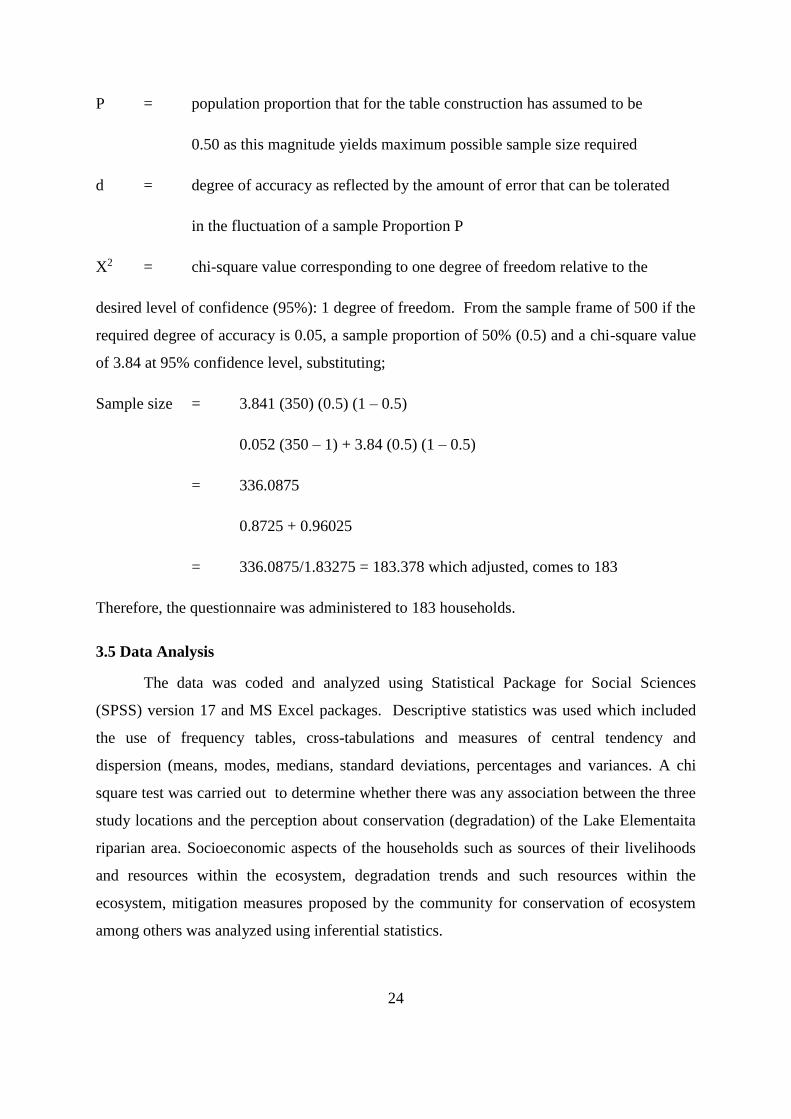
P = population proportion that for the table construction has assumed to be
0.50 as this magnitude yields maximum possible sample size required
d = degree of accuracy as reflected by the amount of error that can be tolerated
in the fluctuation of a sample Proportion P
X2 = chi-square value corresponding to one degree of freedom relative to the
desired level of confidence (95%): 1 degree of freedom. From the sample frame of 500 if the
required degree of accuracy is 0.05, a sample proportion of 50% (0.5) and a chi-square value
of 3.84 at 95% confidence level, substituting;
Sample size = 3.841 (350) (0.5) (1 – 0.5)
0.052 (350 – 1) + 3.84 (0.5) (1 – 0.5)
= 336.0875
0.8725 + 0.96025
= 336.0875/1.83275 = 183.378 which adjusted, comes to 183
Therefore, the questionnaire was administered to 183 households.
3.5 Data Analysis
The data was coded and analyzed using Statistical Package for Social Sciences
(SPSS) version 17 and MS Excel packages. Descriptive statistics was used which included
the use of frequency tables, cross-tabulations and measures of central tendency and
dispersion (means, modes, medians, standard deviations, percentages and variances. A chi
square test was carried out to determine whether there was any association between the three
study locations and the perception about conservation (degradation) of the Lake Elementaita
riparian area. Socioeconomic aspects of the households such as sources of their livelihoods
and resources within the ecosystem, degradation trends and such resources within the
ecosystem, mitigation measures proposed by the community for conservation of ecosystem
among others was analyzed using inferential statistics.

25
CHAPTER FOUR
RESULTS AND DISCUSSION
4.1 Demographic characteristics of the households
The highest (43%) and the lowest (4%) proportions of respondents were drawn from the
viewpoint village within the upper-viewpoint study site.
Figure 4: Distribution of respondents by village

26
Figure 5: Distribution of respondents by age
Thirty four percent of the respondents were within the age bracket of 31-45years, with those
above 56 years old constituting 19.4% (Fig 5).
A majority of respondents were between <30 and <55years.This represents an active
and youthful age bracket that is receptive to new ways of engaging in sustainable livelihoods.
The high utilisation of resources around the lake without knowledge of interrelatedness of
environmental factors of production will impact adversely on the fragile riparian ecosystem
and this will ultimately lead to land degradation. It will be important that their energy is
harnessed towards getting education on conservation and equipped with the requisite
methodologies on Education for Sustainable Development (ESD).
This would enable every community member around Lake Elementaita to acquire the
knowledge, skills, attitudes and values necessary to shape a sustainable future and understand
the interrelatedness between economic development, societal dynamics and environmental
integrity (The UNESCO, 2009).

27
Gender-wise, 55% of the respondents were male while 45% were female (Fig 6).
Figure 6: Gender Distribution of Respondents
The use, accessibility and control of natural resources by male and females are unique
and cannot be generalized. In the developing world, women and girls interact with natural
resources as they carry out their responsibilities of fetching water, firewood and other
domestic chores. The role of male and male child are mainly around taking care of livestock
and supplementing family livelihood with small businesses. Women manage and use natural
resources daily in their roles as farmers and as household providers of resources like firewood
and water. Despite their important role, they have problems on decision making and access
on issues related land use and ownership (FAO, 2011).The results of this research show that
more males than females were interviewed. This invariably means that men have a bigger
stake in terms of how the resources are used around Lake Elementaita. Most of the
environmentally degrading activities like charcoal burning, sand extraction and livestock
grazing around Lake Elementaita are carried out by men thus impacting negatively on the
riparian zone. The decision on what economic activities to undertake are controlled by men.
These findings are in agreement with results by UNICEF (1990) which states that generally
in developing countries, at all levels of decision making, women are not provided equitable
voices in decision making. Women and men are more likely to make environmentally sound
land management decisions when they all have secure ownership entitlement to natural

28
resources. This will reduce the likelihood of severe degradation of areas surrounding Lake
Elementaita.
Sixty one percent of the respondents had at least primary level of education as opposed to
those who had tertiary level of education 5% ( Fig 7).
Figure 7: Education Level of the Respondents
Education is a process of learning and acquiring information either formally or
informally. The community around Lake Elementaita is educated, though there is need to
provide more of environmental education on the relationship between their activities and the
impact on natural resources. The environmental problems like deforestation, pollution, soil
erosion and poor farming methods are a result of lack of understanding by the community.
The level of education and access to information generally with regard to natural resource
management is a barrier that impacts on women more than men in rural areas (Lambrou,
2006). This has implications for sustained gender inequality and continued cycles of chronic
poverty and natural resource degradation. To effectively participate in conservation around
Lake Elementaita the community needs education that will equip them with the requisite
skills that will enable them to ask informed questions on resource use, participate in advisory
and policy making committees and also support sound legislation directed at solving
environmental problems (William B.Sapp,et al,1999).

29
The community around Lake Elementaita is comprised of people who came from
other places and settled here from 1990’s after the giant land buying company GEMA
subdivided the land to its members. This coupled with absentee land owners and limited
conservation knowledge amongst the community calls for relevant environmental education
so that they can make informed choices that will not impact negatively on the riparian area of
Lake Elementaita.
Majority (73%) of the respondents interviewed were married as opposed to singles 26%
(Fig 8).
Figure 8: Marital Status of the Respondents
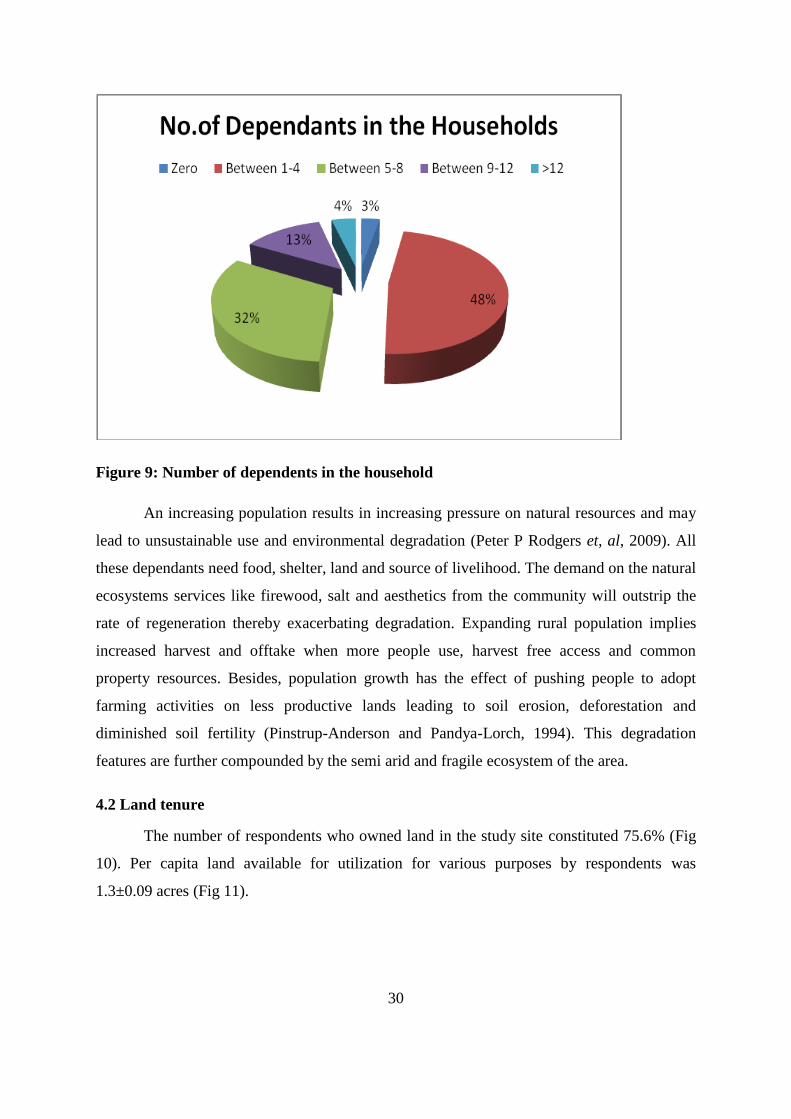
Households with dependents between 1 and 4 constituted the highest (48%) proportion of
respondents whereas those with zero dependants constituted 3 % (Fig 9).
The results (Fig 8) of marital status and (Fig 9) the number of dependents are very closely
linked; thus the impact of population on natural resource use.
30
Figure 9: Number of dependents in the household
An increasing population results in increasing pressure on natural resources and may
lead to unsustainable use and environmental degradation (Peter P Rodgers et, al, 2009). All
these dependants need food, shelter, land and source of livelihood. The demand on the natural
ecosystems services like firewood, salt and aesthetics from the community will outstrip the
rate of regeneration thereby exacerbating degradation. Expanding rural population implies
increased harvest and offtake when more people use, harvest free access and common
property resources. Besides, population growth has the effect of pushing people to adopt
farming activities on less productive lands leading to soil erosion, deforestation and
diminished soil fertility (Pinstrup-Anderson and Pandya-Lorch, 1994). This degradation
features are further compounded by the semi arid and fragile ecosystem of the area.
4.2 Land tenure
The number of respondents who owned land in the study site constituted 75.6% (Fig
10). Per capita land available for utilization for various purposes by respondents was
1.3±0.09 acres (Fig 11).

31
Figure 10: Land Tenure System of the Land Occupied by Respondents

32
Table 1:Acreage of land owned and used
The terms and conditions under which land is held, used and transacted has a lot of
impact on resource use. Land tenure is important in rural development interventions which
place emphasis on building peoples endowments of assets so that they can enjoy sustainable
livelihoods. There are several types of land tenure around Lake Elementaita. Those who are
categorized as squatters and leasers have one thing in common: there is uncertainty on how
long they can hold onto the land parcels they are using. This scenario provides little or no
incentive to manage the resources sustainably thus leading to likelihood of enhancing
degradation.
Those who own the land and have title deeds confers on the owners property rights to
use the resources. Due to long term commitment these owners are more likely to be receptive
to undertake activities that will ensure resources are not degraded .Lands with title deeds and
owned have a positive influence on investment incentives, resource conservation,
productivity and efficiency (Barrows and Roth 1990; Besley, 1995). Those parcels of land
that are owned but have no title still confers on the owner the right to use the resources. The
risk of resource degradation will arise in the event the owner is absent. The absentee landlord
situation creates a scenario where anyone can come in and abstract as much as he or she can
without recourse for sustainability this exacerbates degradation. In all this tenure systems,
there is need for enforcement of rules on the use of natural resources around Lake
Elementaita. This is even more critical considering the small parcels of land owned in this
area and semi arid climate conditions.

33
Table 2: Statistical Tools used in Data Analysis
Research Questions Variables Analysis
What are the major
human activities
practiced in the Lake
Elementaita riparian
zone
Livestock production
Salt/sand harvesting
Farming
Firewood harvesting
Charcoal burning
Frequencies/percentages
and descriptive
Which resources are
exploited by
communities within the
lower and upper
viewpoints
Land for farming
Pasture/grass
Firewood harvesting
Charcoal sales
Frequencies, descriptive
and chi-square test
What are the major
sources of pollution
affecting the riparian
area of lake Elementaita
Soil erosion,
Agrochemicals/pesticides
Domestic
Industrial discharge
Frequencies, Percentages
descriptive
What is the local
community perceptions
towards conservation
issues
Degradation Percentages frequencies
Chi-test
4.3 Human activities
Grazing and farming were the major human activities carried out by respondents in
the entire study area (Table 9). This concurs with the findings of (Stevenson, 1991) who
realized that the common property resources around the rural landscape within developing

34
countries are a set of dependable resources, which provide a variety of economic and
environmental security for the whole community. In common property regimes, the
community or state have the option of putting in place rules of how to use the resource. There
is always a problem of enforcement of conservation measures. The common property
resources and especially those with free open access are at the risk of degradation and
overuse (Ostrom,1990;Oakerson,1992). Although other human activities were minimal, the
harvesting of firewood and other natural products without recourse for direct consumption
and income generation exacerbates environmental degradation (IUCN, 1999).
Table 3: Resource Useage around Lake Elementaita Riparian Zone
Lower view point (n=72)
Upper view point (n=113)

35
4.4 Resources around Lake Elementaita
The most important resources utilized by majority of respondents in the study area
were farmland, grazing land and water, (Figure 3). According to UNEP and World
Conservation Monitoring Centre (WCMC) 2011 report, terrestrial vegetation around Lake
Elementaita consists of upland forest, woodland, dry bushland dominated by Acacia
xanthophloea and Eurphobia candelabrum, scrubland dominated by Olea sp. and
Tarchonanthus camphorates and grassland of Cynodon dactylon, Chloris gayana and
Panicum spp. Marshes located in the southern part of the lake are dominated by Cyperus
laevigatus and Typha spp.
The human activities carried out around Lake Elementaita have far reaching effects on
the survival of the fragile ecosystem. The land degradation and serious soil erosion around
the ecosystem has been enhanced by the residents carrying out agricultural activities that are
incompatible with the climatic conditions that prevail in the area. The situation has been
made worse by overgrazing as a result of large herds of livestock brought in by pastoralists
who come from as far as Narok County and the mining of salt and sand. Potential impacts
related to livestock grazing may include, overgrazing, and trampling of soils and plants. The
significance of these impacts would depend upon the timing, duration, and intensity of
grazing. A decrease in the abundance, distribution, and vigor of plant species resulting from
livestock overgrazing may, in turn, decrease the amount of ground-cover (vegetation and
litter) and soil organic matter, and increase the amount of bare soil. This would inevitably

36
accelerate soil erosion leading to a change in the water quality of the lake. The loss of woody
riparian species (cottonwoods and willows) by livestock is particularly detrimental. The loss
of these species that stabilize river banks (Collins et al. 1998) end up decreasing the areas of
Lake Ecosystems such as Elementaita.
The tree cover of the world is currently at 30% though originally the forests covered
50% of the earth. This is as a result of continued deforestation, land degradation and human
encroachment among other factors.. Forests are homes for millions of animal species ranging
from insects, animals, bacteria and fungus among others making forests rich habitats of
biodiversity. The species find their food and shelter in the forest and are protected from
extinction. Forests are also valuable for humans since they are a source of food and some of
the tree species have medicinal values (Hanson, C.2008). Firewood and charcoal burning as
communities search for fuel is another factor that is aggravating deforestation. The
emergence of commercial charcoal burners has led to massive deforestation as the
businessmen aim to maximize their profits by producing more charcoal and firewood without
consideration of the environment (Clare, 1990).
The high demand for charcoal by the nearby community of Kekopey and Gilgil town
has led to overexploitation of acacia woodlands. This has led to loss of habitats for woodland
birds like the ground hornbills, the rich flora and fauna that epitomizes biodiversity of the
Great Rift Valley. These findings are consistent with a report by the World Resources
Institute (WRI,1999) that states that as early as 1993 one –quarter of the vegetated land area
of the earth had been highly disturbed by unsustainable and uncontrolled exploitation of
natural resources through anthropogenic activities.

37
Level of resource use
0 20 40 60 80 100
Res
ou
rces
aro
un
d L
ake
Ele
men
teit
a
Salt
Firewood
Charcoal
Pasture
Farmland
Water
TourismMost Important
Important
Not important
Figure 11: Resources use in Lake Elementaita riparian zone
The income generated from livestock sales and crop productions are high as compared
to other resources used within the study area. This confirms why pasture and farmland were
perceived to be the major resources used by the majority of the respondents (Tables 9 and
10). According to UNEP and WCMC 2011, extraction of salt and sand occurs along the
northwestern shore of Lake Elementaita and grazing by nomadic pastoralists occurs in the
southern area of Elementaita.

38
Table 4: Income generated from the various human activities around Lake Elementaita
The higher the income realized from crop and livestock production means that more
land is opened up for cultivation and high number of livestock kept or allowed in the area so
as to meet the insatiable demand for these goods. Table 10 shows clearly that livestock
production is the main activity that yields high income. This can be linked to the lucrative
market at Kekopey centre for the meat from travelers on the busy Nairobi-Nakuru highway.
The fact that most land here is owned by absentee landlords lends credence to the possibility
of overstocking which exacerbates overgrazing thus leading to degradation. Other economic
activities like charcoal burning and salt/sand harvesting aggravates the fragile situation. There
is need to have more people engaged in other forms of employment, this would make it
possible to train and educate them on alternative sustainable livelihoods like apiculture,
ecotourism, agroforestry and organic farming which would minimise the degradation of areas
surrounding lake Elementaita ecosystem.
4.5 Pollution in the Lake Elementaita Riparian Zone
Most wetlands are being affected by increasing human population which leads to
more land being opened up for cultivation which then necessitates increased use of pesticide
and other agrochemicals which are eventually washed down through surface run-off leading
to pollution in wetlands (Kitaka,N.2000).. This affects drinking water sources and biological
diversity. Drainage and run-off from fertilized crops and pesticides used in industry introduce
nitrogen and phosphorous nutrients and other toxins like mercury to water sources. These

39
chemicals can affect the health and reproduction of species, posing a serious threat to
biological diversity. From the results, upper view point was overgrazed and high levels of
agrochemical use observed (Figure 4 and 5). This results concurs with the findings of
Mennonite, (1999) who attests that in many parts of the world, overgrazing has resulted in
wide spread soil erosion especially in places of high human population growth and economic
development compounding degradation of wetlands, forests, habitats and air quality
Figure 12: Respondents' perception on soil erosion
Figure 13: Pollution sources

40
As resources are being used in the study area, other negative impacts were being felt,
especially pollution from agrochemicals waste and soil erosion. The Lakes riparian
ecosystems are rich in biodiversity and provide essential livelihood products to their riparian
communities (NWP, 2001). Vegetation around the riparian zone plays an important role in
intercepting surface runoff and store non point pollutants like sediments, nutrients and certain
heavy metals that would otherwise end up in the lake. The overstocking and the resultant
overgrazing from livestock lives the ground bare Surface run off from agrochemicals used on
crops and pesticides used on livestock are easily washed down to Lake Elementaita as a result
of soil erosion. These pollutants end up distorting the food chain and reproduction of species
within and around the ecosystem thus destroying biodiversity (WWF, 2001). This ecosystem
is faced with rising demand for food, energy and other supplies to sustain the increasing
population within and adjacent to these area. This has led to a situation where acacia forests
are cleared for charcoal burning to make room for agricultural activities and settlement.
Siltation and pollution of the wetlands is a critical problem in most lakes of the great rift
valley like Lake Nakuru,Bogoria,Naivasha due to change in hydrological regime within the
catchment ( Kimani. et al,1992).
4.6 Perception on conservation issues in the lake Elementaita riparian zone
More than 72% of respondents were of the opinion that there has been decrease in
land productivity while about sixty seven percent of believed that soil erosion has increased
over the years (Table 5).

41
Table 5: Perception of conservation issues
Statement
(%) Degree of agreement
Strongly
disagree
Disagree Not sure Agree Strongly agree N
Land productivity has been decreasing
in the last ten years
4 17 7 56 16 190
Quality of water in streams and rivers
has been reducing
3 23 6 55 13 183
Amount of water in streams, rivers and
lake has been reducing
4 20 5 57 14 186
Grass/vegetation cover around the lake
has been reducing
7 28 8 45 12 187
Amount of tree cover in forests around
has been decreasing
5 31 11 41 12 185
Number and types of birds has been
decreasing in and around the lake
6 22 21 36 15 190

42
Number and type of wild animals in and
around the lake has decreased
7 25 24 29 14 187
Availability of forest materials has been
decreasing
4 14 11 51 20 187
Soil erosion has been increasing 5 22 7 47 20 185
Availability of livestock feeds
grass/browse has been decreasing:
5 23 11 49 13 186
Number of livestock grazing around the
lake has increased
9 25 13 44 9 188
River, stream and spring water use for
irrigation is causing the lake to dry
13 15 13 44 15 191
Use of agrochemicals can affect water
quality in streams rivers and the lake
16 18 10 41 15 189
Cutting of trees in the forest can affect
the flow of streams and rivers
9 9 11 55 16 189

43
Destruction of the forests around can
increase soil erosion
6 10 11 53 20 187
Grazing animals around the lake can
affect the wetland ecosystem negatively
6 21 22 38 12 190
Overgrazing increases soil erosion 9 14 6 53 18 187
Abstraction of streams entering the lake
cannot affect the survival of the lake
Are you willing to carry out
conservation of Lake Elementaita ?
29
3
33
4
12
14
19
58
7
21
189
190

44
Wetlands have the potential of contributing significantly to the socio-economic
development of any country, but they face diverse threats. These threats include among
others inappropriate human activities within the catchments and in the wetland riparian
zones, lack of coordinated and holistic policy guidelines and climate change. The threats
have induced changes that have eroded the ecological and socio economic values and
services derived from wetlands. The underlying threat remains lack of knowledge and
understanding of their importance (KWF, 2010).
The results from the research corroborate the information. The fact that the
community members have noted evidence of environmental degradation around Lake
Elementaita and the fact that there is a decline of ecosystem services both in quality and
quantity as shown by their perceptions results (Table 11) is a clear indicator of their
concern. A majority (72%) of the community around Lake Elementaita are in agreement
that their land productivity has declined. They are very much aware of the fact that high
population in creating a huge demand for food, wood fuel and sand/salt harvesting. The
interrelatedness between the activities being carried out, semi arid climatic conditions and
decline in land productivity may not be clear to them unless they are exposed to
environmental education.
The community living around is willing to conserve Lake Elementaita as shown by more
than 79% of the respondents, a demonstration of their awareness of the need to do
something to arrest further decline. This positive perception of the community towards
environmental issues is important since they will be part of solving environmental
problems affecting the area.
The positive attitude will make it feasible to develop a holistic conservation
programme that will be embraced by all inhabitants so as to reduce the negative impact of
human activities on the surrounding areas of the lake and ensure sustainable development
for posterity.

45
4.7 Chi-Square Test
Two major research questions were investigated in this study. To test these research
questions a chi test was done to compare association between the study sites and
perception about the importance of resources.
A chi-square test was carried out to determine whether there was any association between
the three study locations and the perception about conservation (degradation) of the
riparian area. As shown in the table below, there was no significant association in the
perceptions on conservation of the residents in the three sites (X2 =5.881, d.f=4,p=.208).
This means that perception about conservation in the study area were similar amongst
residents of the three sites.
Firewood as important resource derived from Lake
Elementaita and its environs
Total
Respondent site of
residents Most important Important Not important
Upper-View point 24 48 14 86
Lower-View point 17 30 27 74
Soysambu 4 16 6 26
Total 45 94 47 186
X2 =5.881, d.f=4, p=.208;
Chi-square test for association between perceptions about the importance of resources for
residents in the three sites. The table below shows that it is only perception about
importance of firewood that was significantly associated with the site of residence of the
respondents
Dependent Independent Chi-SquareValue df
Asymp. Sig. (2-sided)(p-
value)
Firewood
The three sites
10.414 4 .034
Grazing land 7.910 4 .095
Farmland 4.920 4 .296
Water 8.282 4 .082
Note: Significant association is resent when the p-value is less than 0.05

46
CHAPTER FIVE
CONCLUSION AND RECOMMENDATIONS
5.1 Conclusion
Based on the findings of this study the following conclusions were drawn:
1. Livestock rearing and crop production constituted the most important human
activities carried out by the residents of Lake Elementaita riparian zone.
Therefore, these activities necessitate increased demand for more land to be
opened up for food production to satisfy the increasing human population. The
presence of a busy meat market at the Kekopey centre has led to more livestock
coming into the area to graze thus exacerbating degradation.
2. Water, grazing land and farmland were identified as the main resources utilized
by the residents.
3. Soil erosion and pollution from agrochemicals were considered to be the foremost
causes of land degradation in the study area and hence the need for soil
conservation measures and education on proper farm practices to reduce
pollution
5.2 Recommendations
Based on the results of this project, the following recommendations are made:
1. Encourage appropriate modern farming methods to avoid degradation of the
riparian zones. The community should be exposed through training to alternative
environmentally friendly farming methods like apiculture. The youth should be
encouraged to form community based organizations so as to engage in income
generating activity like ecotourism. This is a viable venture in this area
2. The community around Lake Elementaita should be trained in alternative
environmentally friendly farm practices like afforestation with correct tree species

47
and agro-forestry practices to increase vegetation cover and reduce soil erosion
around the riparian zone.
3. There is need to increase the use of biopesticides, reduce the use of agrochemical,
increase the use of organic fertilizers and integrated pest control practices on the
parcels of land around Lake Elementaita.
4. There is need for further research to establish the magnitude and impact of human
activities within the riparian zone and establish how it is affecting the wetland.
48
REFERENCES
Ashley, C. (1999). Livelihood Impacts of Butterfly Farming at Arabuko-Sokoke, African
Foundations, Nairobi.
Ashley, C. (1998). Biodiversity as a Business, Kipepeo project at Arabuko Sokoke,
Ecotourism Magazine, Nairobi.
Acc.,(ed), (2002). African Conservation Centre Article on Ecotourism Options in Kenya
Aboud,A.A.(1992).Population Pressure, Environmental Degradation and Farmers
Adaptive Strategy in Nakuru.PhD Thesis,University of Illinois.
Atte, O. D. (1992) Indigenous Local Knowledge a Key to Local Development
Possibilities, Constraints and Planning Issues. In the Context of Africa Studies in
Technology, and Soil Change No. 20, Iowa State University, USA
Allan, G. (1995). Indigenous Soil and Water Conservation in Djeine, Mali Cultural
Dimensions of Development, London Press
Anon, (2007).Definition of Environmental Degradation. Http://www.google.co.za/url,
accessed on 4th May ,2011
Barbier, B.and Edward (1994). Valuing Environmental Functions: Tropical Wetlands.
Journal of Land Economics, May 1994, 70 (2): Pg. 155-173
Barrows, R. and Roth, M. ( 1990).Land Tenure and Investment in African Agriculture:
Theory and Evidence. The Journal of Modern African Studies,28,2,265-97
Becks, T. (1998). “Excluding the Poor from Their Rights: The Case of Natural
Resources in West Bengal”, Paper Presented at International Association of the
Study of Common Property, Vancouver, Canada
Beopoulous,N.(1996): The Impact of Agricultural Activities on the Environment.-In the
environment in Greece,1991-1996.Athens
Berry, R. J. (1993). Environmental Dilemmas; ethics and Decisions. Chapman & Hall,
London, United Kingdom
Berkes, F. (ed) (1989). “Common Property Resources – Ecology and Community Based
Sustainable Development”. London: Belhaven Press
Botkin, D. B. & Keller, E. A.(1985). Environmental Science: Earth as a Living Planet,
Second Edition. John Wiley & Sons Inc. Toronto, Canada

49
British Petroleum. Conservation Programme, (2003). Options in Yala Wetland
Management for Sustainable Development and Biodiversity Conservation Kenya
2003
Bromley, D. W. (1989). The Management of Common Property Natural Resources:
Some Conceptual and Operational Fallacies, World Bank Discussion Paper (57),
The World Bank, Washington, D. C.
Curry, N. (1997). Providing New Environmental Skills to British Farmers Journal of
Environmental Management, Vol.50(2) Pages 211 – 222
Doust, L. L. & Doust, J. L. (1995). Wetland Management and Conservation of Rare
Species. Canadian Journal of Botany, Vol. 73, pages 1019 – 1028
Dove, M. r. (1993). “A Revisionists View of Tropical deforestation and Development”.
Environment Conservation, Vol. 20, pp:17-24
Collins, S. L., A. K. Knapp, J. M. Briggs, J. M. Blair, and E. M. Steinauer.(1998).
Modulation of diversity by grazing and mowing in native tall grass prairie.
Science 280:745–747
Costanza,R.W.et al.(1989). The Value of the World’s Ecosystem Services and Natural
Capital.Nature 387.253-260
CCN, 2009.County Council of Nakuru,2009 Information department
Gilliam, J. W. (1994). Riparian Wetlands and Water Quality. Journal of Environmental
Qaulity, vol. 23, pages 896 – 900FAO Gender Programme
FAO,2011. Gender Programme Food and Agriculture Organization of the United Nations
Fisher, R. J., Maginnis, S., Jackson, W. J.,(2005). Poverty and Conservation. IUCN
Publication, Zurich, Switzerland
GoK, (1994).Government of Kenya The Kenya National Environmental Action Plan
(NEAP) Report. Ministry of Environment and Natural Resources. Nairobi,
Kenya
Hanson C, Ranganathan J.(2008) Mainstreaming Ecosystem Services Initiative: What are
ecosystems doing for you (World Resources Institute, Washington DC
Harper, D. M. (2003). Aquatic biodiversity and saline lakes: Lake Bogoria National
Reserve, Kenya. Hydrobiologia, 500: 259-276
Herlocker, D. (1994). Range Management Handbook of Kenya Vol.II. An Introduction
to Rangeland Development in Kenya. Republic of Kenya, Nairobi

50
Hollis ,T.T.&Bedding,J.(1994):Can we stop the wetlands from drying up-New
scientist,2nd July,No.1932,pp.31-35.
IUCN,(1999).International Union for the Conservation of Nature,Global Water
Programme
Jansen, D.J. (1990). Sustainable wildlife utilization in the Zambezi Valley of Zimbabwe:
economic, ecological and political trade-offs (paper presented at Ecological
Economics Sustainability: an International Interdisciplinary Conference).
Washington, D.C., World Bank
Jaetzold, R. & Schmidt, H. (1983). Farm Management Hadbook of Kenya. Vol. II.
Natural conditions and Farm, management Information. Part B, Central, Kenya.
(Rift Valley & Central Provinces), Ministry of Agriculture, Nairobi
Jodha, N. S. (1986). “Common Property Resources and the Rural Poor in Dry Regions of
India” Economic and Political Weekly. Vol. 21 pp: 169 – 181
Jodha, N. S. (1988). “Population Growth and the Decline of Common property Resources
in Rajasthan” Population and Development Review, Vol.II (2), pp: 247 – 264
Kotze, D. E. (1995). Wetland Losses in S. Africa. In Cowan, G. I. Wetlands of South
Africa. Department of Environmental Affairs and Tourism Journal, Pretoria, S.
Africa. Pp. 263 – 272
Kiai,H.and Maillu (1992): Kenya Country paper: Wetland classification for Agricultural
Development in Eastern and Souther Africa.
Kimani,P.K., et a.1992.Hydrology and Land Use of Lake Nakuru Catchment.The World
Wide Fund for Nature and Egerton university
Kitaka,N.(2000) .Phosphorous Supply to a Shallow Tropical Lake and its Conseqences-
Lake Naivasha,Kenya PHD Thesis,University of Leicester,Leicester 190pp.
Kitetu J. and Rowan, (1999): Environmental Assessment Applied to River Sand
harvesting in Kenya. In Kirkpatrick, C and Sustainable Development in a
Developing World, Edward Elgar Cheltenham, UK, Northampton, USA
Kosturov J. (1972), Wagner T. (1985). Geology and Geography of Sand Grade
production in Louisiana article in Aggregate Resources, London press
KWF, (2006). Report of Fact Finding Mission to lake Elementaita Wetlands by East
African Wildlife Society, Nairobi
KWF,(2010). Kenya Wetlands forum report on Sustainable use and Management of
Wetlands.East African Wildlife Society. Nairobi

51
KWS and FNLE (2000): Management Plan for Lake Elementaita Ecosystem (Draft): by
Kenya Wildlife Service and Friends of lake Nakuru and Elementaita
(Unpublished)
KWS and NWP, (2000). Integrated Management Plan for Lake Ol Bolossat
Conservation Area (Draft) by Kenya Wildlife Service and Naivasha Wetlands
Programme (Unpublished)
Lake Elementaita lodge, (2000): Lake Elementaita Financial Report (Unpublished)
Lelo, F. K. and Ayieko, J. O. (1993): People, Drought and Wildlife: A PRA Case Study
of Gilgil Community, Nakuru
Lambrou, Y and G Piana. (2006). Gender: The Missing Component of the Response to
Climate Change. Food and Agriculture Organization. Rome.
LNDP, (1998). Lake Nakuru Development project Fuelwood Report. Nakuru Press
Mathus, M. H. (1986). Administering Development in the Third World, Sage Publishers,
India
MacNally, R. M. and Bennet, A. R. (1997). Species-specific Predictions of the Impact of
Habitat Fragmentation: Local Extinction of Birds in the box-ironbark forests of
Central Australia. Biological Conservation Biology 81: pp: 221 – 231
Martin, F. (1986). Communal Area Management program for Indigenous Resources,
Zimbabwe
Montalembert, D. E. (1983). Fuel Wood Supplies in Developing Countries, FAO, Rome;
Mennonite,J.(1999).PovertyandEnvironmentaDegradation. Http://www.restoringeden.org
accessed on 12th October, 2011.
Mfudisi, K. B. (2003). Analysis of Carbon pools and Human impact in the Yala Swamp
(W. Kenya): A Landscape Approach. www.zef.de accessed on 12th
October,2011.
Mireri,C. (2005). Challenges facing the Conservation of Lake Naivasha, Kenya. Dept of
Environmental Planning and Management, Kenyatta University, Nairobi
Mironga,J.M.(2003):Effects of Farming Practices on Wetlands of Kisii District,Kenya.
Faculty of Environment and Resource Development,Egerton University, Njoro
Murphy T. (1998). Aggregate Resources, London Press

52
Mwaura, F. and Ogendo, R. B., (1993). Some Vegetation Characteristics in the High
Altitude Tropical lake Elementaita Drainage Basin, kenya. Eastern & Souther
Africa Geographical Journal, 4.
National Environment Secretariat.Nakuru District Environment Report,1987.
NDDP, (2002). Nakuru District Development Plan, Demography: pp 12 – 18
NWP, (2001). Naivasha Wetlands Programme, World Wide Fund Ecoregions, Gland
Switzerland
OECD, (1986). Water Pollution by Fertilisers and pesticides. Oxford & IBH Publishing
Company PVT. Ltd., New Delhi
Ostrom, E. (1990). “Governing the Commons: The Evolution of Institutions for
Collective Action” Cambridge University Press
Okerson,R.J. (1992) Analysing the Commons: A Framework. In D.W. Bromley(ed)
Making Commons Work:Theory,Practice and policy.San Francisco|;ICS Press
Pinstrup-Andersen,P.and Pandya-Lorch,R.(1994).Alleviating Poverty, Intensifying
Agriculture and Effectively Managing Natural Resources. Washington, DC:IFPRI
PRSP, (2004). Poverty Reduction Strategy paper, Government of Kenya, Government
Printer, Nairobi
Pyrovetsi, M. and Daoutopolos, G. (1999). Farmers’ Need for Nature Conservation
Education in Greece. Journal of Environmental Management. Vol. 56 pg. 147 –
157
Pimentel, D. C.(1994).Water Resources: Agriculture the environment and Society”,
Bioscience (In Press)
Peter, P. Rodgers (2009).An introduction to Sustainable development Glen Educational
Foundation,Inc.UK
Quintana, L.(1998). Neighbourhood Taking Actions: Linking Community Action and
Local Participation in Kenya and Massachusetts
Raini, J. (1995).The Impact of Agriculture Activities in the Catchment on Lake Nakuru
Ecosystem: Lake Nakuru Development Project Report, Nakuru Press
Ribot, J.C. (1999), Accountable representation and power in participatory and
decentralized environmental management, Washington: World Resources
Institute; available online from http://www.fao.org/documents accessed on 5th
April,2011

53
Ramsar, (2003). What are wetlands? In: D. Peck (Editor), Ramsar Information paper
No. 1 Ramsar, Gland
Royal Society and National Academy of Sciences, (1992). The Royal Society and The
National Academy of Sciences on Population Growth and Sustainability,
Population and Development Review 18 (2): 375 – 378
Sustainable Livelihoods in Southern Africa team (SLSA, 2003), "Decentralisations in
practice in Southern Africa", IDS Bulletin vol. 34, no. 3, July 2003
State of Environment, (2003). State of the Environment Report. Page 199 – 224, NEMA,
Nairobi
State of Environment, (2004). State of the Environment Report. Page 112 – 125, NEMA,
Nairobi
Stevenson, G. G. (1991). “Common Property Economics: A General Theory and Land
Use Application”. Cambridge University Press
Sumawa project, (2003). Sand harvesting in River Njoro, Baruti Area, Nakuru District,
PRA Report, Egerton University, Kenya (Unpublished)
The East African (2003).‘Tiomin Granted License to Mine in Kwale” Article in The East
African Newspaper, July 2003 Page 13 – 17
Environment Impact Assessment, Tiomin Incorporated, (2002).Coastal and
Environmental Services newsletter: Key issues Report Vol. 4. (Unpublished)
Thomas, D. B. (1997).Soil and Water Conservation Manual for Kenya. Soil and Water
Conservation Branch, Ministry of Agriculture, Livestock Development and
marketing; Republic of Kenya
Tolba, M. K. (1988).Evolving Environmental perceptions: From Stockholm to Nairobi.
Butterworths, London, United Kingdom
UNCED (1992).United Nations Conference on Environment and Development Agenda
21 Rio, Brazil, UNEP Nairobi, Kenya
UNEP and WCMC (2011).Kenya Lake System in the Great Rift Valley. UNEP
UNEP (1991).United Nations Environment Development, State of the Environment.
Nairobi, Kenya
UNESCO (2009).UNESCO World conference on Sustainable Development 31st March-
2nd April, Bonn, Germany

54
UHAI (1996). A Model of Sustainable Livelihood and Natural Resources Management
in Africa Kengo, Nairobi, Kenya
UNDP (2004). United Nation Development Programme: Home Employment and
Sustainable Livelihoods. Report, Nairobi, Kenya
USEPA,(1995).United States Environmental Protection Agency. Americas Wetlands:
Our Vital Link Between Land and Water. Washington, DC : Office of Wetlands,
Oceans and watersheds
UNRISD (1994). Environmental Degradation and Social Integration, Briefing paper 3,
UNRISD, World Summit for Social Development, November, 1994
William, H. Patrick (1994).From Wastelands to Wetlands. Journal of Environmental
Quality: Vol. 23: page 892 – 896
Williams, M. (1990). Wetlands: A Threatened Landscape. Blackwell Publishers,
Oxford, UK
William, B. Stapp, (1999). The Concept of Environmental Education, Journal of
Environmental Education,Vol.1 No.1 30-31.Heldref Publications,1319 Eighteenth
Street, NW, Washington ,DC 20036
William, M.(1991): Wetlands: A Threatened Landscape/Oxford, Basil Blackwell
Wilson, G. A.(1996):Farm Environmental Attitudes and ESA Participation.-Geoform
27:115-131
World Bank (2002). Making Sustainable Commitments: An environmental Strategy for
the World Bank. World Bank, Washington DC
Wyckoff-Baird, B. (1997), "Decentralising and devolving government" in Borrini-
Feyeraband, G. (ed.,1997), Beyond Fences: Seeking Social Sustainability in
Conservation, Geneva: International Union for the Conservation of Nature
WWF (1995). Lake Nakuru Development Project Report, Nakuru press
WWF (1999) and WWF (2001). Worldwide Fund for Nature: Living Planet Report,
Gland, Switzerland
WWF (2002): World Wide fund for Nature: Bogoria conservation project, newsletter,
Nakuru

55
APPENDIX 1
QUESTIONAIRE
These questions are for research purposes only. The information you provide will be
treated with utmost confidentiality. Your assistance in answering the questions truthfully
and accurately will be high appreciated.
Division: ……………Location: ………….. Village: ……………Site…………….……
A: RESPONDENTS PERSONAL INFORMATION
Name (optional):……………………………………………………………..
Age: (a) Above 56 years
(b) 46 – 55 years
(c) 31 – 45 years
(d) <30 years
3. Sex: (a) Male
(b) Female
4. Educational level
(a) Tertiary Level
(b) Secondary Form 5 – 6
(d) Secondary Form 1 – 4
(e) Standard 4 – 8

56
(f) < Standard 4
5. Marital Status
(a) Single
(b) Married
(c) Divorced
(d) Widowed
(e) Widower
6. Number of dependents
(a) 1 – 4
(b) 5 – 8
(c) 9 – 12
(d) > 12
7. What are your main sources of income?
(a) Salt/Sand Selling
(b) Charcoal Business
(c) Employment
(d) Livestock, (e) Others (specify)
SECTION A
8. Are you the owner of this land which you occupy?

57
(a) Yes
(b) No
If yes:
9. What is the size of your farm?.....................................(Acres)
(a) Cultivated land…………………...(Acres)
(b) Pasture land………………………(Acres)
If no:
10. Who is the owner of the land you occupy?......................................................
11. For how long have you occupied this land?
(a) 0 – 5 years
(b) 6 – 10 years
(c) 11 – 15 years
(d) More than 16 years
12. Under what land ownership is your land?
(a) Squatter
(b) Leased
(c) Borrowed
(d) Communal
(e) Own land without title deed

58
(d) Own with title deed
13. How far is your land from the Lake Elementaita?
(i) How far is your land from lake Elementaita?
(a) < 1 km
(b) 1 – 2 km
(c) 2 – 3 km
(d) > 3 km
14. What are the most important resources you derive from Lake Elementaita and
it environs?
Firewood
Charcoal
Grazing land/pastures
Farming Land
Water
Other (specify)
15. What are the major land degradation problems in your farm?
(a) Soil erosion
(b) Overgrazing
(c) Others (specify)

59
16. Which grazing system do you practice around Lake Elementaita?
(a) Zero grazing/stall feeding
(b) Overgrazing
(c) Others (specify)
17. What is the condition of your grazing areas?
(a) Very eroded
(b) Tethering
(c) Moderately eroded
(d) Not eroded
18. State the type of crops that you cultivate around Lake Elementaita
(a) …………………………………..
(b) ………………………………….
19. Which of the following soil fertility methods do you use in your farm?
(a) Organic manure
(b) Chemical fertilizers
(c) Burning of trash
(d) Others (specify)
20. What are some of the chemicals you use?:……………………………….

60
21. What are the sources of pollution into the Lake?
(a) From domestic sewerage
(b) herbicides and pesticides used on the farm
(c) Soil erosion debris washed into the lake
(d) Other (specify)
22. Which of the following resources do you use and where do you obtain them?
Form of energy Source Distance
Firewood
Charcoal
Crop remains
Others
23. What are the main sources of water for domestic consumption?
(a) Rain
(b) Well
(c) Spring
(d) Borehole
(e) Swamp
(f) Dam
(g) River/Stream
(h) Lake

61
24. Who makes decision regarding what farming operation be undertaken?
(a) Husband
(b) Wife
(c) Husband/Wife jointly
(d) Elder son
(e) Others (specify)
25. How much do you make from the above named sources (state whether on monthly or
on annual basis)?
Source Amounts (Kshs.)
Salt/Sand selling
Livestock
Charcoal business
Employment
Others (Specify)
Providing labout
State whether you:
Strongly disagree
Disagree
Not sure
Agree
Strongly agree with the following statement

62
26. The productivity of land has been decreasing in the last ten years:
(a) Strongly disagree
(b) Disagree
(c) Not sure
(d) Agree
(e) Strongly Agree
27. The quality of water in the streams and rivers around has been reducing:
(a) Strongly disagree
(b) Disagree
(c) Not sure
(d) Agree
(e) Strongly agree
28. The amount of water in the streams, rivers and lake has been reducing:
(a) Strongly disagree
(b) Disagree
(c) Not sure
(d) Agree
(e) Strongly agree
29. The grass/vegetation cover around the lake has been reducing:
(a) Strongly disagree

63
(b) Disagree
(c) Not sure
(d) Agree
(e) Strongly agree
30. The amount of tree cover in forests around has been decreasing:
(a) Strongly disagree
(b) Disagree
(c) Not sure
(d) Agree
(e) Strongly agree
31. The number and types of birds has been decreasing in and around the lake:
(a) Strongly disagree
(b) Disagree
(c) Not sure
(d) Agree
(e) Strongly agree
32. The number and type of wild animals in and around the lake has decreased:
(a) Strongly disagree
(b) Disagree
(c) Not sure

64
(d) Agree
(e) Strongly agree
33. The availability of forest materials (firewood, construction materials) has been
decreasing:
(a) Strongly disagree
(b) Disagree
(c) Not sure
(d) Agree
(e) Strongly agree
34. Soil erosion has been increasing:
(a) Strongly disagree
(b) Disagree
(c) Not sure
(d) Agree
(e) Strongly agree
35. Availability of livestock feeds (grass, browse) has been decreasing:
(a) Strongly disagree
(b) Disagree
(c) Not sure
(d) Agree
65
(e) Strongly agree
36. The number of livestock grazing around the lake has increased:
(a) Strongly disagree
(b) Disagree
(c) Not sure
(d) Agree
(e) Strongly agree
37. Use of water from fivers, streams and springs entering the lake for irrigation is
causing the lake to dry:
(a) Strongly disagree
(b) Disagree
(c) Not sure
(d) Agree
(e) Strongly agree
38. Use of chemical fertilizers and pesticides can affect the water quality in streams,
rivers and the lake:
(a) Strongly disagree
(b) Disagree
(c) Not sure
(d) Agree

66
(e) Strongly agree
39. Cutting of trees in the forest around can affect the flow of streams and rivers:
(a) Strongly disagree
(b) Disagree
(c) Not sure
(d) Agree
(e) Strongly agree
40. Destruction of the forests around can increase soil erosion:
(a) Strongly disagree
(b) Disagree
(c) Not sure
(d) Agree
(e) Strongly agree
41. Grazing animals around the lake can affect the wetland ecosystem negatively:
(a) Strongly disagree
(b) Disagree
(c) Not sure
(d) Agree
(e) Strongly agree

67
42. Overgrazing increases soil erosion:
(a) Strongly disagree
(b) Disagree
(c) Not sure
(d) Agree
(e) Strongly agree
43. Abstraction of streams entering the lake cannot affect the survival of the lake:
(a) Strongly disagree
(b) Disagree
(c) Not sure
(d) Agree
(e) Strongly agree
44. Please rank in order of importance (using 1, 2, 3 with 1 being the most important) the
benefits you derive from the wetland:
(a) Strongly disagree
(b) Disagree
(c) Not sure
(d) Agree
(e) Strongly agree

68
45. Please rate your hold wellbeing in comparison to when you settled and presently:
(a) Dropping
(b) Constant
(c) Improving
46. Would you and your household be willing to participate on the conservation of Lake
Elementaita?
(a) Yes
(b) No
47. What mitigation measures do you propose to be implemented at the household level
to conserve the ecosystem?
………………………………………………………………………………………
………………………………………………………………………………………
……………………………………………………………………………………...