effect of farm size on farm productivity: empirical
TRANSCRIPT

EFFECT OF FARM SIZE ON FARM PRODUCTIVITY:
EMPIRICAL EVIDENCES FROM INDIA Anupama GV and Thomas Falk
1
ABSTRACT
Our study provides evidence on land tenure related issues in India. We use the Village Dynamics in South
Asia (VDSA) panel dataset for the years 2010 to 2015 covering 1129 households in 9 states of India. We
specifically test two hypotheses: 1) plot size is positively related to farm productivity; 2) owner operated
lands have higher farm productivity. We calculate Hierarchical Mixed Effects Models in order to take the
nested structure of the data into account. Transformation parameters are included in order to
accommodate non-linear relationships between our variables. Our results confirm a positive relation
between the average plot size and the agricultural productivity from cultivation. They provide supporting
arguments for key aspects of ongoing land reform processes in India. In particular the land consolidation
and ceiling policies should support an increase in agricultural productivity.
INTRODUCTION
More than half of the rapidly growing population in India is engaged in farming. Chakravorty et al.
(2016) show that: (a) income inequality in India's agricultural sector is very high, and (b) about half of the
income inequality is explained by the household-level variance in income from cultivation, which in turn
strongly depends on farming productivity and land tenure. Inheritance rules which lead to ever new
subdivision of land holdings continue to increase the number of parcels (Thapa et al., 2008). There is
much evidence that this land fragmentation negatively affects agricultural productivity as it increases
production cost (Manjunatha et. al., 2013; Deininger et al., 2017). At the same time it can reduce parcel
related risks (Ali et al., 2015). It is a common phenomenon in India that a household has a reasonable
operated agricultural land area which is split into small scattered units. In response to the widely
acknowledged challenges, the Government of India introduced policies and laws to consolidate
fragmented land holdings (Ghatak and Roy, 2007). The objective of the consolidation process is to merge
smal1 scattered pieces of land into compact units. There are divergent opinions in the literature on the
1 Innovation Systems for the Drylands Program, International Crops Research Institute for Semi-Arid Tropics (ICRISAT), Patancheru 502324,
Telangana, India. Corresponding author’s email: [email protected]

relation between farm size and productivity. Some provide evidence of the inverse relation (e.g. Sial et
al., 2012; Banerjee, 1999; Sen, 1966; Mazumdar, 1963; C.H.H. Rao, 1966, 1970), whereas others argue
that no systematic relationship can be established between land size and productivity (e.g. A.P. Rao,
1967, Rudra and Bandopadhyay, 1973). Besley and Burgess (2000) claim that India’s land consolidation
has had a positive impact on agricultural productivity.
Land tenure security in connection to the relation between land owners and tenants is another major
challenge in the Indian agriculture. Many plots are not farmed by owners but by tenants under short-term,
informal, often oral lease agreements. Land owners hesitate to formalize lease agreements as the current
land legislation gives strong rights to long-term tenants. The owners are quickly at risk of losing their
land rights to the tenants. This land tenure situation provides little incentives for tenants to make even
moderate investments. There is empirical evidence that households managing owned land are more
productive and having higher income than households managing leased plots (Smith, 2004; Walker et. al.,
1988).
With this study we intend to deepen the understanding of the link between land tenure and farm
productivity in India. We are not studying land reform schemes of any kind but assess to which extend
variables which are typically the target of land reform projects affect different outcome variables. We use
the Village Dynamics in South Asia (VDSA) panel dataset for the years 2010 to 2015 covering 1129
households in 9 states of India. We test hypotheses related to farm productivity, plot size and agricultural
management which are discussed in the next section.
HISTORICAL EVIDENCE AND THEORETICAL CONSIDERATIONS
In pre-independent India, Zamindars were the large landowners with tax collection rights (Ghatak and
Roy, 2007). British authorities did not reform land tenure during colonial times. Only after independence,
serious efforts were made to reform land tenure. As per the first five year plan, land reform was
considered a fundamental issue of national importance. Primarily, four elements constitute land reform
legislation in India: tenancy reform, abolition of intermediaries, land ceiling and land consolidation.
These reforms were enacted with four primary objectives: 1) to improve the productivity of land by
improving incentives for farmers and tenants to invest in and improve agricultural land; 2) to ensure
distributive justice and to create an egalitarian society by eliminating all forms of exploitation; 3) to create
a system of peasant proprietorship with the motto of land to the tiller; and 4) to transfer the incomes of the
few to many so that the demand for consumer goods would be created (GOI, 2015). In this paper we
focus mainly on the productivity objective while keeping the other objectives closely in mind.

An important historical milestone of improving productivity through land consolidation was the
Zamindari Abolition and Land Reform Act, 1951 which led to the Consolidation of Holdings Act, 1953
being implemented in many states like Punjab, Uttar Pradesh, Haryana, West Bengal and Kerala. Other
relevant laws are the Bombay Prevention of Fragmentation and Consolidation of Holdings Act, 1948
(GOI, 1948a); the East Punjab Holdings (Consolidation and Holding) Act, 1948 (GOI, 1948b); The UP
Consolidation of Holdings Act, 1953 (GOI, 1953); The Rajasthan Holdings (Consolidation and
Prevention of Fragmentation) Act, 1954 (GOI, 1954); The Madhya Pradesh Land Revenue Code, 1959
(GOI, 1959); The Jammu and Kashmir Consolidation Holdings Act, 1962 (GOI, 1962) etc. Similar laws
were enacted in Bihar (1956) (GOI, 1956), Asom (1960), Andhra Pradesh (1956), Himachal Pradesh
(1953) (GOI, 1971) and other states during 1970s.
Typical measures to prevent fragmentation and encourage consolidation of holdings are: 1) very small
plots may only be transferred to owners of neighbouring plots; 2) very small plots may only be leased out
to farmers cultivating neighbouring plots; 3) land may not be partitioned and transferred in a way that a
small land fragment is created (GOI, 1948). In addition, the state government on its own initiative or upon
the request of at least seven farmers owning land not exceeding 0.4 ha can initiate land consolidation
projects. The government may acquire land which is fragmented against paying compensation, rearrange
the plots into consolidated units and reallocate them to farmers whose land has been acquired. The
reallocation needs to ensure that farmers get land of similar quality and value (GOI, 1999).
State governments typically take the following steps in the process of land consolidation schemes: 1)
Select the district or local area to conduct consolidation. (2) Notify land owners and managers about the
upcoming consolidation process. After this notification is given, transfers of land are prohibited. The
announcement also gives farmers the chance to postpone major investments into land. In addition, the
consolidation office is officially assigned with the responsibility for all matters related to the preparation
and correction of the annual land registers and maps. 3) The Consolidation Officer visit each of the
concerned villages and shall, in consultation with the village committee proceed to prepare a scheme for
the consolidation of holdings which include statements, records and maps as may be prescribed. 4) The
allotment of plots would be determined based on rental values (Elder, 1962).
By 2006, more than 660.000 km2 of fragmented land has been consolidated all over India. Strongest
efforts were made in northern Indian states such as Uttar Pradesh, Haryana and Punjab (ICAR, 2017).
Nevertheless, there are frequent reports about farmers being reluctant to land consolidation in view of the
uncertainty whether they would be allotted land of equally good quality in return for their parcels that
they were forced to sell or swap with the land of fellow farmers (Thapa and Niroula, 2008). Soil

heterogeneity is a critical factor hindering exchange of plots. Walker et. al. (1988) observe that land
consolidation was more likely to be successful in areas with more homogeneous soils such as in the north
western parts of India.
A case study of the village Rajpur in Uttar Pradesh documents a decrease in agricultural production in the
initial years after consolidation. This negative effect was associated with uncertain perceptions of farmers
as to whether the government would indeed implement the consolidation scheme. Nevertheless, the study
also suggests that after the initial adjustment phase the land consolidation supported productivity
increases (Elder, 1962).
Bonner (1987) reported in a private sector funded study of two villages in Haryana an increase of land
productivity at the family level in relation to the implementation of a land consolidation scheme. He
further observed a reduction of landless farmers and lower incidences of land disputes. On the community
level the cultivated area expanded, a larger area became irrigated, more intensive agricultural practices
were used and farmers moved more strongly towards producing cash crops. This effect was partially
financed by credits and the households’ debt burden increased. It was reported that the education levels
and general standard of living of farmers improved. A regional market economy replaced the previous
strong subsistence orientation.
We believe that more evidence is required to better understand the causalities related to land
consolidation. Based on impacts reported in the literature we formulate the following hypotheses which
will be tested using our panel dataset:
H1) The average plot size is positively related to the productivity of cultivation activities as well
as to the overall agricultural productivity (including livestock). The marginal productivity gain
decreases with increasing plot size.
The formal expression is:
Eq1: Yit = β1 +β2Xr2it + β3X
s3it + β4X4it + uit
where Yit represents
the productivity of land exclusively from cultivation activities computed as the net income from
crop cultivation (returns to land, family labor and management) divided by the operated area
(INR/ha) OR

the productivity of all agricultural activities computed as the net income from crop cultivation
plus the net income from livestock production divided by the operated area (INR/ha),
i stands for the household and t for the observed year,
X2it represents the average plot size of ith
household in year t,
X3it represents the operated area of household i in year t,
X4it is a vector of controls namely: non-land endowment in 2010, income diversity, age of
household head, years of education of household head, member of scheduled caste or tribe, net
state domestic product, ratio of operated area used to grow cash crops, work hours per hectare,
annual rainfall in mm and
uit is the error term.
Transformation parameters r and s are included in order to accommodate non-linear relationships between
the variables.
Our data also allow us to look deeper into intermediary effects which are influenced by land consolidation
and which affect agricultural productivity. Multiple advantages of establishing compact blocks of land
managed by one family are reported: boundary lines would be reduced in number and extent, saving land
and diminishing boundary disputes; saving time related to commuting to the fields; realising economies
of scale related to mechanisation. Further, costs per hectare are lower to protect larger pieces of land by
natural or artificial borders in order to prevent trespassing, thieving, and gleaning. This could encourage
more investments into the land. Also, the management of irrigation and drainage water as well as of pests
and disease would be easier (Elder, 1962). Inspired by such arguments we formulate and test the
following hypotheses:
H2) The larger the average plot size the higher the machinery investments.
H3) The larger the average plot size the more investments in water infrastructure are made.
H4) The larger the plot size higher is the farm equipment owned by the household.
H5) The larger the average plot size the more intensive the pest and disease control.
The formal expressions of H4 and H5 are:
Eq2: Yit = β1 +β2Xr2it + β3X
s3it + β4X4it + uit

where Yit represents the
the total value of owned farm equipment in constant prices INR OR
the value of pesticide used per ha in constant prices INR
i stands for the household and t for the observed year,
X2it represents the average plot size of ith
household in year t,
X3it represents the operated area of household i in year t,
X4it is a vector of controls namely: non-land endowment in 2010, income diversity, age of
household head, years of education of household head, member of scheduled caste or tribe, net
state domestic product, ratio of operated area used to grow cash crops, work hours per hectare,
annual rainfall in mm and
uit is the error term.
The formal expressions of H2 and H3 are:
Pr(Yit = 1 | xit) = F(β1 + β2Xr
2it + β3Xs3it + β4X4it)
where Yit represents
the use of tractor OR
the access to a bore well by household i in year t
i stands for the household and t for the observed year,
X2it represents the average plot size of ith
household in year t,
X3it represents the operated area of household i in year t,
X4it is a vector of controls namely: non-land endowment in 2010, income diversity, age of
household head, years of education of household head, member of scheduled caste or tribe, net
state domestic product, ratio of operated area used to grow cash crops, work hours per hectare,
and annual rainfall in mm.
In addition to the impact of plot size, we are also interested in the role of land ownership. Secure
ownership rights support that today’s investments will generate future returns (Meinzen-Dick and

Pradhan, 2002; Fenske, 2011) and are, therefore, long-term incentives for investing in and maintaining
resources (Demsetz, 1967; Place, 2009). Higher levels of investment should theoretically lead to
productivity increases (Holden and Yohannes, 2002; Smith, 2004). In addition, land titles are often
accepted as collateral and, in this way, should facilitate access to credit (Deininger, 2003; Place, 2009;
Fenske, 2011). Financial organisations prefer land as security because the risk of losing the asset creates
commitment, which helps to take the contracting partner seriously (De Soto, 2000). Many Indian states
made efforts to transfer ownership rights to tenants. By the end of 2010, 12.586 million tenants received
secure land titles covering 67637.89 sq. km (ICAR, 2017).
Despite very logical theoretical relations, the empirical evidence on the link between property rights and
land productivity is very ambiguous, confusing and contradictory (Carter and Olinto, 2003; Smith, 2004;
Bromley, 2009; Do and Iyer, 2008; Markussen, 2008; Place, 2009; Besley and Ghatak, 2010; Fenske,
2011). Some studies claim that reforms in tenancy laws resulted in enhanced productivity in most states
(Banerjee et al., 1998; Banerjee et.al., 2002; ICAR, 2017). Banerjee et al. (1998) argue that increasing
security of leasehold rights encourages investment by the tenants. Deininger et. al. (2009) stated that land
reforms had a significant and positive impact on income growth and accumulation of human and physical
capital in India (see also Manjunatha et. al., 2013). Nevertheless, Ghatak and Roy (2007) rather see a
significant negative effect of reforms in tenancy laws on agricultural productivity. They further observe
increased inequality in operational land holdings. Walker et al. (1988) found in their study of Indian semi-
arid villages no evidence for an economic polarization in relation to the ownership of land. Nevertheless,
they observed that mixed tenants cultivated own land significantly more intensively than the land they
sharecropped. Suboptimal utilization of labour and bullock draft per unit of land in tenant farms was the
main reason for this inefficiency. We use our available data to test our last hypothesis.
H6) There is a high positive correlation between the size of land owned as well as the share of the
operated area owned and the farm productivity, the access to credit and the investments in non-
land assets.
DATA AND METHODOLOGY
We use the Village Dynamics in South Asia (VDSA) panel dataset generated by the International Crops
Research Institute for the Semi-Arid Tropics (ICRISAT) in partnership with Indian Council of
Agricultural Research (ICAR) Institutes. We use VDSA data collected between 2010 and 2015 in 30
villages of 9 states of India (Andhra Pradesh, Bihar, Gujarat, Jharkhand, Karnataka, Madhya Pradesh,
Maharashtra, Odisha and Telangana). The sampling followed a stepwise strategic approach. First of all,
the sample covered six agro-ecological zones of the semi-arid and humid tropics of India defined by the

Length of Growing Period (FAO, 1996). Typical districts within the agro-ecological zones were selected
based on soil and climate parameters. An additional criterion for the district selection has been that a
significant share of the agricultural land is used to cultivate ICRISAT mandate crops (sorghum, pearl
millet, pulses and groundnuts). A similar strategy was used to select two villages within each chosen
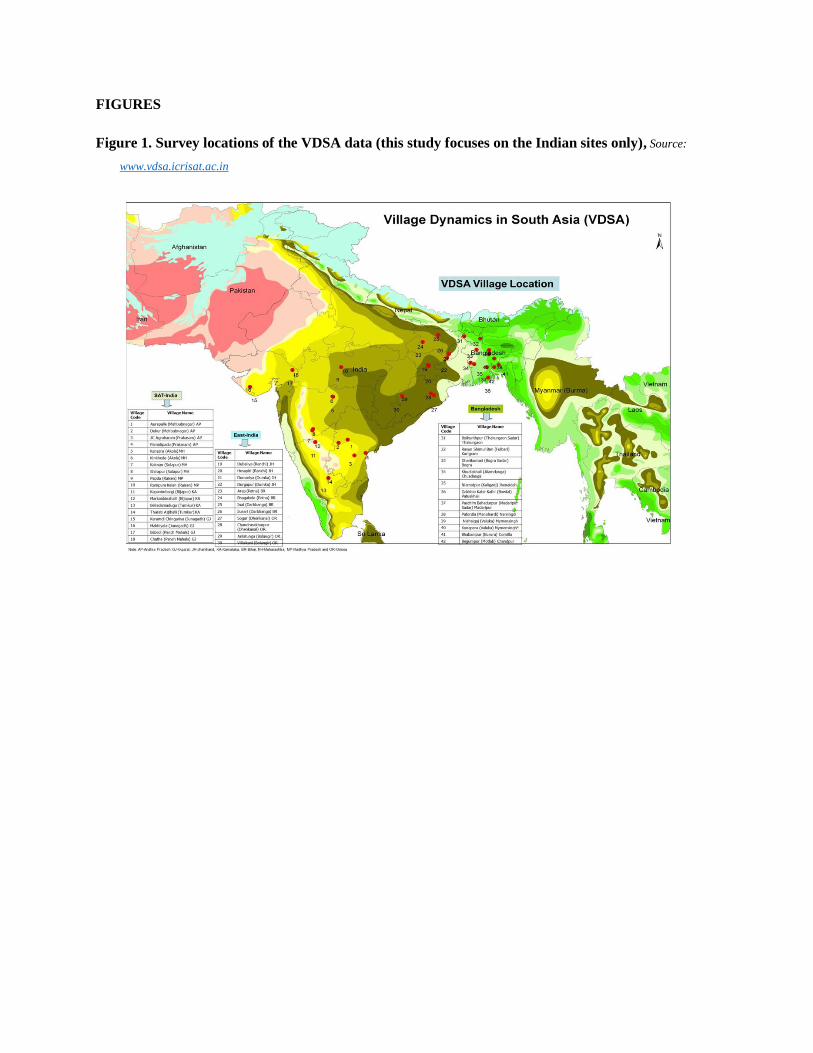
district. Figure 1 illustrates the location of the VDSA villages. In each of the 30 villages 40 households
were selected based on a stratified sampling. Baseline surveys were used to classify households according
to their land holding (landless, small, medium and large landholding groups). Households within each of
these groups were drawn randomly (Binswanger and Jodha, 1978; Rao et al., 2015). In this particular
study we only use data of VDSA households who are actively cultivating any land.
Figure 1 about here
The VDSA dataset contains a wide range of variables related to agriculture and rural development. All
questionnaires are accessible under http://vdsa.icrisat.ac.in/vdsa-microdoc.aspx. Intensively trained
village resident investigators periodically revisit the same households over the years to collect the data.
We calculate Fixed Effects and Hierarchical Mixed Effects Models in order to take the nested structure of
the VDSA data into account. We suspect non-linear relations between agricultural productivity and plot
size as well as operated area. We use the Fractional Polynomial (fp) procedure implemented in STATA
14 in order to find best fitting variable transformations (Royston and Sauerbrei, 2008). F-tests are used to
identify the best fitting variable transformations.
RESULTS
Half of our sample households operate fields of less than 1.2 ha and 95 percent manage less than 6.5 ha.
The plot size is on average 0.6 ha (Figure 2). The average annual income per ha from cultivation in
constant prices was approximately USD 580. Taking all agricultural activities into account, the income
per hectare was on average USD 800.
Figure 2 about here
Hardly any of the household heads in our sample is female. This is the reason why sex is not controlled
for in our analyses. The household heads are on average 49 years old and went five years to school.
Farmers have a cash crop ratio of on average 30 percent. We take into account the overall economic
environment by controlling for the Per capita net state domestic product. There is a high variance in this
value with a minimum of below USD 350 in year 2013 for the state Bihar and more than USD 2300 in

year 2012 for the state Maharashtra. Also the agro-ecological conditions are very diverse in our sample.
We take this into account by controlling for the rainfall (Table 1).
Table 1 about here
The mixed effects models (Table 2) reveal a steep decline of productivity for very small plots. Already at
a plot size below half a hectare the marginal effect is very small (Models 1 and 2, Appendix 2).
Nevertheless, the plot size of more than half of our sample is in this very small range (Figure 2). At the
same time, we observe a steep decline in productivity as the total operated area of the household increases
in the range of the operated area managed by most of our households (<6 ha). The effect fades out for
larger farms (Models 1 and 2, Appendix 2).
Our results further indicate that younger farmers are more productive at least when taking all agricultural
activities into account. A higher level of formal education did, however, not contribute to higher
productivity. Structurally disadvantaged groups are less productive. The households endowment with
physical capital measured in non-land assets positively affects agricultural productivity. The overall
economic environment had no significant impact (Models 1 and 2).
Table 2 about here
The models in Table 3 indicate that farmers with larger plots more likely use tractors while especially
owners of smaller plots use a borewell. The value of pesticide used per ha is high especially for very
small plots while marginal effect fades out for moderate plot sizes. We observe a higher probability of
tractor use amongst structurally disadvantaged households, despite the fact that they have an overall lower
physical capital base. They also use less pesticides. In general, the physical capital base positively affects
the probability of using a tractor or owning a bore well. Farmers growing cash crops more often use
tractors and pesticides. Tractor usage is more frequent in economically strong states while bore wells are
more common in the poor ones. The Random effects parameters indicate a rather low sample variance on
the state level but a high one on the village and household level.
Table 3 about here
Our correlation analyses shows that households owning more land have a higher household income from
agriculture but surprisingly a lower productivity (taking all agricultural activities into account). There is a
positive correlation between physical and natural capital. Land ownership supports credit access. The
more land a household owns the more it leases out. Interestingly, the lower the agricultural productivity

the more likely the household leases out land (Pairwise correlation coefficient = -0.0455, 1 percent
significance level). Farmers operating larger areas lease a larger share of it (Table 4).
Table 4 about here
DISCUSSION
Referring to Hypothesis 1, we observe a strong impact of a household’s plot size on the agricultural
productivity in the range of very small plots. Half of the households in our sample manage such small
plots of less than half a hectare. Confirming Hypothesis 2, tractors are more likely used on larger plots
while we find no relation to farm equipment in general (H4). The value of agricultural inputs is higher
rather on smaller plots (H5). We assume this can be explained by less efficient use e.g. of fertilisers and
pesticides. Surprisingly, also borewells are more frequent on smaller plots (H3). Probably larger plots
require different irrigation techniques. The effect of the plot size on the agricultural productivity is
negligible for plot sizes above half a hectare. Our results support land consolidation policies of really
small land holdings.
At the same time, we see steep productivity decreases in the range of small operated areas. It is a common
observation that agricultural productivity decreases with increasing land size (Heltberg, 1998; Mazumdar,
1963; Sen, 1964, 1966; C.H.H. Rao, 1966, 1970; Bhattacharya and Saini, 1972; Manjunatha et. al., 2013).
Small farms are more efficient especially in poor, labour abundant agricultural systems (Bhalla and Roy,
1988; Hazell, 2005). Ghatak and Roy (2007) come to contrasting conclusions arguing that the Indian land
ceiling legislation had a negative impact on farm productivity. We cannot make any statements about the
impact of land ceiling policies but we find evidence in our data set for decreasing farm productivity as the
operated area increases. This can be interpreted as support for land ceiling in general.
Though land ownership facilitates credit access and is positively related to physical capital, it does not
have a positive effect on agricultural productivity (H6). This raises the question why land owners cannot
capitalise on the better incentive structures related to secure land tenure. Land ownership seems to allow
the emergence of land markets. Less productive land owners in our sample more likely lease out land.
This is in result with other evidence indicating that well-functioning leasehold markets increase the
productivity of agriculture (Deininger, 2003). They enable the transfer of land eventually to the most
productive user (Place, 2009, Fenske, 2011). Our results should not be interpreted as an argument that
improving land tenure security is of low importance in India. The authors strongly believe that the
opposite is the case. For us it rather indicates further research needs to better understand why the positive
effects of land ownership do not translate into improved productivity in India.

CONCLUSION
Our results provide supporting arguments for key aspects of land reform processes in India. In particular
the land consolidation and ceiling policies should support an increase in agricultural productivity. We
repeat the call of Walker et. al. (1988) from 30 years ago to invest in consolidating fragmented land plots
and avoiding further fragmentation. The focus should be on really tiny plots as losses are highest there.
There are promising trials of alternative approaches where fragments are not formally exchanged but
where cooperation between neighbouring farmers is supported to reduce the negative effects of small
plots. Chowdry et al. (2000) report on a project in Andhra Pradesh implemented by the state government
which promotes and demonstrates flexible cooperative agricultural frameworks. It tries to create
cooperate management of pooled individual land holdings. Nevertheless, also these trials face many
challenges.
Our study provides another evidence for the observation that small farmers are more productive. This
leads to the conclusion that land ceiling leads to higher outputs on the large scale, decreases the yield gap
and reduces wealth inequalities. The result is an indication that Indian agriculture is still marked by low
cost of labour (compare with Bhalla and Roy, 1988). We observe at the same time significant increases of
rural labour costs over the last years. It will be interesting to see whether this development will change the
relation between farm size and productivity in future.
Further research is required to better understand why land owners do not manage to translate the
advantages of holding land titles into higher productivity. They have better credit access and better
physical capital. Still, the productivity is even rather lower than the one of leasehold farmers.

REFERENCES
Ali, D. A., Deininger, K., & Ronchi, L. (2015). Costs and benefits of land fragmentation: evidence from
Rwanda. (June 3, 2015). World Bank Policy Research Working Paper No. 7290. Available at SSRN:
https://ssrn.com/abstract=2614186
Banerjee, A. V. (1999), 'Prospects and Strategies for Land Reforms', in B. Pleskovic and J. Stiglitz
Annual World Bank Conference on Development Economics 1999, Washington, DC, World Bank,
253-84.
Banerjee, A. V., Gertler, P. J., & Ghatak, M. (2002). Empowerment and efficiency: Tenancy reform in
West Bengal. Journal of political economy, 110(2), 239-280.
Banerjee, A., Gertler, P., & Ghatak, M. (1998). Empowerment and Efficiency: The Economics of
Agrarian Reform (No. 98-22). Massachusetts Institute of Technology (MIT), Department of
Economics.
Besley, T., & Burgess, R. (2000), ‘Land Reform, Poverty Reduction, and Growth: Evidence from India’,
Quarterly Journal of Economics, 115(2), 389–430
Besley, T., & Ghatak, M. (2010). Property rights and economic development. In Handbook of
development economics (Vol. 5, pp. 4525-4595). Elsevier.
Bhalla, S. S., & Roy, P. (1988). Mis-specification in farm productivity analysis: the role of land quality.
Oxford Economic Papers, 40(1), 55-73.
Bhattacharya, N., & G. R. Saini. (1972). "Farm Size and Productivity: A Fresh Look." Economic and
Political Weekly, Jun. 1972, pp. A63-72
Binswanger, H. P., & Jodha, N. S. (1978). Manual of instructions for economic investigators in
ICRISAT's Village Level Studies. Village Level Studies Series Economic Program v. 2. ICRISAT,
Patancheru, India.
Bonner, J. P. (1987). Land consolidation and economic development in India: A study of two Haryana
Villages. The Riverdale Company.
Bromley, D. W. (2009). Formalising property relations in the developing world: The wrong prescription
for the wrong malady. Land Use Policy, 26(1), 20-27.
Carter, M. R., & Olinto. P. (2003) Getting Institutions “Right” for Whom? Credit Constraints and the
Impact of Property Rights on the Quantity and Composition of Investment. American Journal of
Agricultural Economics 85(1):173–186.
Chakravorty, S., Chandrasekhar, S., & Naraparaju, K. (2016). Income generation and inequality in India's
agricultural sector: The Consequences of land fragmentation (No. 2016-028). Indira Gandhi Institute
of Development Research, Mumbai, India.

Chowdry, K.R., Rao, A.P., Shankari, U. (2000). Corporate and Contract Farming at Kuppam. Report of
the Andhra Pradesh Coalition in Defence of Diversity. http://ddsindia.com/www/kuppam.htm.
Website accessed: 14th February 2018.
De Soto, H. (2000). The mystery of Capital. Basic books, New York, New York, USA.
Deininger, K. (2003). Land policies for growth and poverty reduction. The World Bank and Oxford
University Press, Washington, D.C., USA.
Deininger, K., Jin. S. & Nagarajan, H.K. (2009). Land Reforms, Poverty Reduction, and Economic
Growth: Evidence from India. The Journal of Development Studies. Vol. 45, Iss. 4, 2009
Deininger, K., Monchuk, D., Nagarajan, H. K., & Singh, S. K. (2017). Does Land Fragmentation Increase
the Cost of Cultivation? Evidence from India. The Journal of Development Studies, 53(1), 82-98.
Demsetz, H. (1967). Toward a Theory of Property Rights. American Economic Review 57(2):347–359.
Do, Q.-T., and L. Iyer (2008). Land Titling and Rural Transition in Vietnam. Economic Development and
Cultural Change 56:531–579.
Elder, J. W. (1962). Land consolidation in an Indian village: a case study of the Consolidation of
Holdings Act in Uttar Pradesh. Economic Development and Cultural Change, 11(1), 16-40.
FAO. (1996). AEZ map of the developing world. FAO-UN - Land and Water Division (CBL) FAO,
Rome, Italy.
Fenske, J. (2011). Land Tenure and Investment Incentives: Evidence from West Africa. Journal of
Development Economics 95(2): 137-56.
Ghatak, M., & Roy, S. (2007). Land reform and agricultural productivity in India: a review of the
evidence. Oxford Review of Economic Policy, 23(2), 251-269.
Government of India (GOI). (1948a). Bombay Prevention of Fragmentation and Consolidation of
Holdings Act, 1948
Government of India (GOI). (1948b). The East Punjab Holdings (Consolidation and Holding) Act, 1948
Government of India (GOI). (1953). The Uttar Pradesh Consolidation of Holdings Act, 1953
Government of India (GOI). (1954). The Rajasthan Holdings (Consolidation and Prevention of
Fragmentation) Act, 1954
Government of India (GOI). (1956). The Bihar Consolidation Holdings Act, 1956
Government of India (GOI). (1959). The Madhya Pradesh Land Revenue Code, 1959
Government of India (GOI). (1962). The Jammu and Kashmir Consolidation Holdings Act, 1962
Government of India (GOI). (1971). The Himachal Pradesh Consolidation Holdings Act, 1971
Government of India (GOI). (1999). The West Bengal land reforms act, 1955
http://wbrsrsa.org/exam_pdf/West%20Bengal%20Land%20Reforms%20Act,%201955.pdf). Website
accessed: 7th January 2018

Government of India (GOI). (2015). Five Year Plans. Planning Commission,. Yojana Bhavan, Sansad
Marg, New Delhi - 110001. http://planningcommission.nic.in/plans/planrel/fiveyr/index1.html
Hazell, P. B. (2005). Is there a future for small farms? Agricultural Economics, 32(s1), 93-101.
Heltberg, R. (1998). Rural market imperfections and the farm size—productivity relationship: Evidence
from Pakistan. World Development, 26(10), 1807-1826.
Holden, S, and Yohannes H. (2002). Land Redistribution, Tenure Insecurity, and Intensity of Production:
A Study of Farm Households in Southern Ethiopia. Land Economics. 78(4): 573-90
ICAR (2017). Handbook of Agriculture. Indian Council of Agricultural Research (ICAR), Govt. of India,
New Delhi Edition : 6th edition 2013, reprint Nov.2017 ISBN : 9788171640966
International Crops Research Institute for the Semi-Arid Tropics (ICRISAT). (2014). Dataset of the
Village Dynamics in South Asia (VDSA). http://vdsa.icrisat.ac.in/vdsa-microdoc.aspx. Website
accessed: 1st February 2018.
Manjunatha, A. V., Anik, A. R., Speelman, S., & Nuppenau, E. A. (2013). Impact of land fragmentation,
farm size, land ownership and crop diversity on profit and efficiency of irrigated farms in India. Land
Use Policy, 31, 397-405.
Markussen, T. (2008). Property Rights, Productivity, and Common Property Resources: Insights from
Rural Cambodia. World Development 36(11):2277–2296.
Mazumdar, D. (1963). "On the Economics of Relative Efficiency of Small Farmers." Econ. Weekly, Jul.
1963, pp. 1259-63. - . "Size of Farm and Productivity: A Problem of Indian Peasant Agriculture."
Economica 32(1965): 161-73
Meinzen-Dick, R., and Pradhan, R. (2002). Legal Pluralism and Dynamic Property Rights. CAPRi
Working Paper No. 22. International Food Policy Research Institute, Washington, D.C., USA.
[online] URL: http://www.capri.cgiar.org/pdf/CAPRIWP22.pdf.
Place, F. (2009). Land Tenure and Agricultural Productivity in Africa: A Comparative Analysis of the
Economics Literature and Recent Policy Strategies and Reforms. World Development. 37(8): 1326-
1336.
Rao, A. P. (1967). Size of Holding and Productivity. Economic and Political Weekly, Nov. 1967, pp.
1724
Rao, C. H. H. (1966). "Alternative Explanations of the Inverse Relationship between Farm Size and
Output per Acre in India." Indian Economic Review. 1(1966):1-12.
Rao, C. H. H. (1970). "Uncertainty, Entrepreneurship, and Share Cropping in India." Journal of Political
Economy. 79(1971):578-95.

Rao, Y.M., Chand, K.R., Kiresur, V.R., Deb, U.K.D., & Bantilan, M.C.S. (2015). Documentation of
Village Dynamics Studies (VDSA) in South Asia (2009-11), Patancheru 502 324, Andhra Pradesh,
India: International Crops Research Institute for the Semi-Arid Tropics. 145 pp.
Royston, P., & Sauerbrei, W. (2008). Multivariable model-building: a pragmatic approach to regression
anaylsis based on fractional polynomials for modelling continuous variables (Vol. 777). John Wiley
& Sons.
Rudra, A., & Bandopadhyaya, B. (1973). "Marginalist Expla- nation for More Intense Labour Input in
Smaller Firms." Econ. and Polit. Weekly, Jun. 1973, pp. 989-94.
Sen, A.K. (1964). "Size of Holdings and Productivity." Economics Weekly, Feb. 1964, pp. 323-6.
Sen, A.K. (1966). "Peasants and Dualism with or without Surplus Labour." Journal of Political Economy
74(1966):425-50.
Sial, M. H., Iqbal, S., & Sheikh, A. D. (2012). “Farm size-productivity relationship: Recent Evidence
from Central Punjab”. Pakistan Economic and Social Review, 139-162.
Smith, R. E. (2004). Land tenure, fixed investment, and farm productivity: Evidence from Zambia’s
Southern Province. World Development, 32(10), 1641-1661.
Thapa, G. B., & Niroula, G. S. (2008). Alternative options of land consolidation in the mountains of
Nepal: An analysis based on stakeholders’ opinions. Land use policy, 25(3), 338-350.
Walker, T. S., Singh, R. P. & Vallabh, V. (1988). Agrarian change, farm size, tenancy and land
fragmentation in India's semi-arid tropics. www.oar.icrisat.org

TABLES
Table 1: Descriptive statistics of the variables used in regressions; source: own
calculations
Variables Obs Mean Std. Dev. Min Max
Age of the household head in years 4,225 49 12 16 90
Years of education of household head 4,221 5 5 0 19
Average of household’s plot size in ha 3,971 0.59 0.6 0 5
Operated area per household in ha 4,225 2.05 2.8 0 36
Share of operated area which is owned by
household 4,225 0.89 0.3
Number of income sources 4,225 4.3 2 0 10
Annual average household income from
cultivation per ha in constant prices
(USD/ha) 4,173 580 830 -4188 21819
Annual average household income from all
agricultural activities per ha in constant
prices (USD/ha) 4,130 864 1435 -12635 39494
Ratio of cash crops in total cropped area 3,960 0.3 0.4
Per hectare working hours dedicated to
cultivation of a household per year 3,965 742 762 3 20419
Value of non-land household assets in 2010
(‘000 USD) 4,225 6 8 0.15 94
Per capita net state domestic product (USD) 4,225 1144 526 331 2219
Annual rainfall in the village in millimeters 4,194 768 322 86 2132

Table 2: Mixed-Effects models describing the productivity of
households between 2010 and 2015; all monetary values in constant
prices; standard errors in parentheses; *p<0.05, **p<0.01, ***p<0.001;
source: own calculations
Model 1
HH income from
cultivation per ha
in INR
Model 2
HH income from
all agricultural
activities per ha in
INR
1 / Average plot size in ha
-1063* (420) -2861*** (758)
ln of operated area in ha -6774**(2132) -18333*** (3704)
Age of head in years -29.48 (47.64) -279.6** (91.42)
Years of education of household head -135.3 (159.6) -474* (218)
SC/ST caste (1=SC/ST) 108.6 (873.3) -21741* (10568)
Non-land assets in 2010 in INR 0.011** (0.004) 0.015*** (0.005)
Income diversity -15446*** (2410) -8954 (5811)
Ratio of cash crops in total crop area 13321* (66287) 10058 (8230)
Work hours per hectare 15.76** (5.66) 16.25*** (4.702)
Annual rainfall in mm 9.230** (3.382) 9.681* (4.543)
Per capita NSDP in INR 0.0725 (0.177) 0.150 (0.159)
Constant 12821 (13068) 44720** (15585)
Random effects parameters State 9.205***
(0.415) 9.520***
(0.378)
Random effects parameters Village 9.576***
(0.302) 9.885***
(0.127)
Random effects parameters Household 10.85***
(0.166) 10.91***
(0.140)
Random effects parameters Residual 10.81***
(0.106) 11.10***
(0.0954)
Observations 3923 3880
No. of household observations 1124 1121

Table 3: Models describing agricultural management and assets aspects; all monetary values
in constant prices; standard errors in parentheses; *p<0.05, **p<0.01, ***p<0.001; source: own
calculations
Model 3 Model 4 Model 5 Model 6
Using tractor
(logit model)
Having borewell
(logit model)
Total farm
equipment value in
INR (mixed-effects
model)
Value of
pesticide used
per ha in INR
(mixed-effects
model)
Average plot size in ha 4.643*** (0.79) -1.484*(0.634) 11576.9 (10896.8)
1 / Average plot size in ha
-6.250* (2.840)
Operated area in ha -0.0155 (0.150) 0.108 (0.107) 16487.5***
(1473.2) 5.616 (3.236)
Age of HH head in years 0.027** (0.010) 0.0089 (0.030) -29.52 (204.9) -1.407 (1.298)
Years of education of
household head 0.048 (0.026) 0.112 (0.0876) 1684.6 (886.1) -2.450 (1.903)
SC/ST caste (1=SC/ST) 1.695** (0.603) -1.972 (1.872) -10381.0**
(3414.8) -45.27* (17.74)
Non-land assets in 2010 in
1000 INR 0.001* (0.0005) 0.01*** (0.003)
0.006 (0.023)
Income diversity 1.088** (0.361) 1.248 (0.763) -8562.4 (19474.6) -32.33 (70.69)
Ratio of cash crops in
total crop area 2.216*** (0.57) 0.288 (0.670) 15317.1 (10401.5) 169.7* (81.45)
Weeks of work per ha -0.003 (0.006) 0.025* (0.01) 220.0 (135.1) 13.63** (4.454)
Annual rainfall in 100 mm 0.0399 (0.0267) -0.239*** (0.05) -568.7 (692.6) 4.634 (5.131)
Per capita NSDP in 1000
INR 0.074*** (0.01) -0.056*** (0.01) -270.5 (200.9) -0.164 (1.205)
Constant -4.90*** (0.72) -6.697* (3.012) 6085.1 (23265.6) 135.6 (96.94)
Panel-level variance 1.379*** (0.2) 4.696*** (0.23)
Random effects
parameters State -1.172 (1353.7) -3.598 (63.74)
Random effects
parameters Village 9.937*** (2.337) 5.209*** (0.21)
Random effects
parameters Household 11.21*** (0.635) 5.050*** (0.55)
Random effects
parameters Residual 11.18*** (2.372) 6.452*** (0.32)
Observations 3927 3927 3092 3928
No. of household
observations 1,072 1,072 1,054 1,125

Table 4: Pairwise correlation coefficients of land ownership
and related variables; all monetary values in constant prices; (*
p < 0.05, ** p < 0.01, *** p < 0.001); source: authors
Total area
owned by HH
in ha
Share of operated
area which is
owned by HH
Share of operated area which is
owned by HH 0.1479*
HH income from cultivation in
INR 0.5505* -0.0469*
HH income from cultivation per
ha in INR -0.02 -0.004
HH income from all agricultural
activities in INR 0.5613* -0.0577*
HH income from all agricultural
activities per ha in INR -0.0542* 0.013
Net material (non-land) asset
value in INR 0.1602* -0.0195
Value of HH liabilities in INR 0.3645* -0.0039
Operated area of HH in ha 0.8947* -0.1027*
HH's leased out land in ha 0.2832* 0.0561*
FIGURES
Figure 1. Survey locations of the VDSA data (this study focuses on the Indian sites only), Source:
www.vdsa.icrisat.ac.in

Figure 2: Average plot size in ha of
VDSA sample; source: authors

Appendix 1: Fixed-Effects models describing the productivity of
households between 2010 and 2015; all monetary values in constant
prices; standard errors in parentheses; *p<0.05, **p<0.01, ***p<0.001;
source: own calculations Model A1
HH income from
cultivation per ha
in INR
Model A2
HH income from
all agricultural
activities per ha
in INR
Average plot size-2
-33.60*** (8.950) -27.12* (10.61)
Ln of operated area in ha -12624* (6217) -29053** (9133)
Income diversity -17800** (5782) 34.54 (10843)
Ratio of cash crops in total cropping area 7900.5 (5962.4) 14399 (7471)
Work hours per hectare 15.14*** (2.330) 8.789* (3.780)
Annual rainfall in mm 9.851*** (2.153) 11.46** (3.935)
Per capita NSDP in INR 0.0929 (0.0552) 0.186* (0.0844)
Constant 17051*** (4504) 19992** (6783)
Observations 3927 3884
No. of household observations 1071 1068
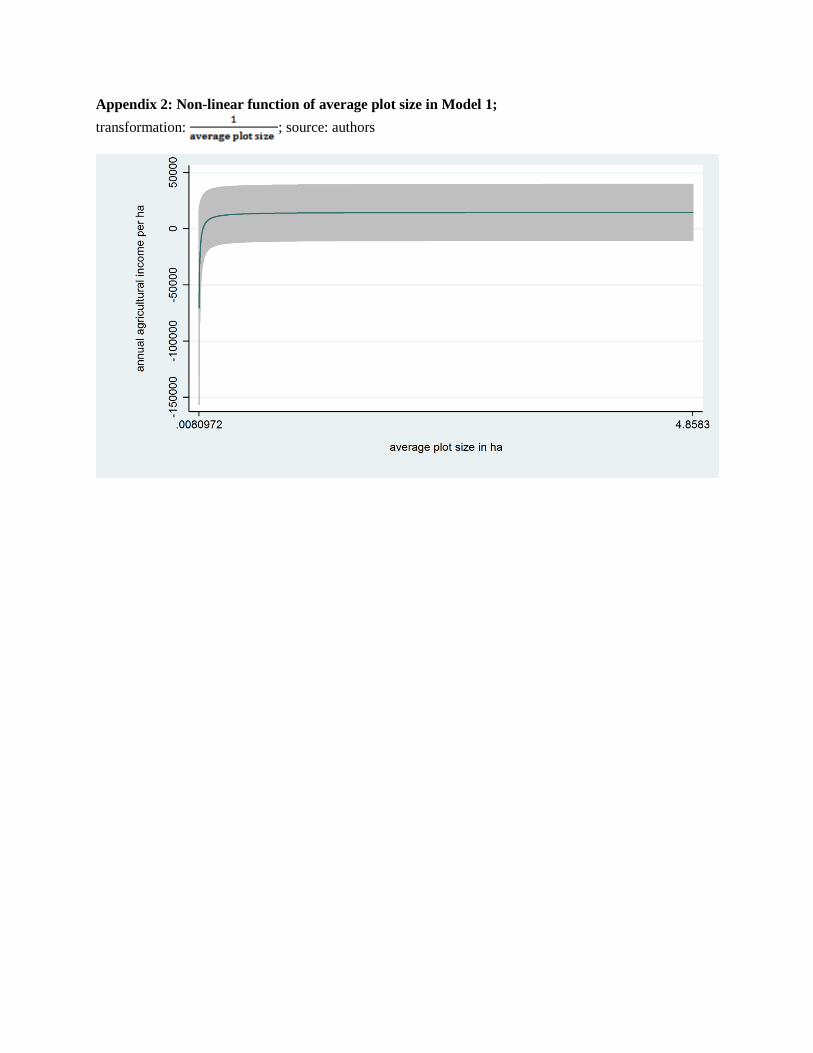
Appendix 2: Non-linear function of average plot size in Model 1;
transformation: ; source: authors

Appendix 3: Non-linear function of operated area in Model 1;
transformation: logarithm of operated area; source: authors