effect of enzyme dynamics on catalytic...
TRANSCRIPT

Effect of enzyme dynamics on catalytic activity
DIMITRI ANTONIOU, JODI BASNER, SARA NUNEZ and STEVEN D. SCHWARTZ
Department of Biophysics, Albert Einstein College of Medicine, Bronx, New York,
USA
1 Introduction 3152 Proton transfer and rate-promoting vibrations 317
Quantum theory of proton transfer 317Rate-promoting vibrations 320Computational signature of promoting vibrations 325Experimental signature of promoting vibrations 326Four objections to promoting vibrations 326
3 Examples of rate-promoting motions in enzymatic systems 328Horse liver alcohol dehydrogenase 328Lactate dehydrogenase 330Human purine nucleoside phosphorylase 335
4 Description in atomic detail of correlated protein motions 342Transition path sampling 342Essential dynamics 347
5 Conformational fluctuations 353Dihydrofolate reductase 354A proposed scheme for searching the conformation space 356
References 359
1 Introduction
It is widely accepted that the catalytic properties of enzymes are a consequence ofbinding energy differences between reactants and transition state (TS), arising fromthe arrangement of residues in the active site. There are two versions of this concept,both of which have experimental support. In the TS binding picture,1 the config-uration that binds most strongly to the enzyme is assumed to be at the top of theuncatalyzed barrier to reaction. This binding releases energy that stabilizes theTS, lowering the energetic barrier to reaction. In the ground state destabilizationpicture2 the role of the enzyme is to make the reactants less stable, leading again to alower barrier to reaction.
In the last few years it has been suggested by us and other groups that enzymedynamics may play a role in catalysis. We do not claim that these dynamical effectscontribute more to catalysis than the standard binding energy effects, but thatthey should be taken into account in the interpretation of, for example, kineticisotope effects (KIE) measurements3 and that they may provide insight to somepuzzling data. In particular, our work on the relation between catalysis and enzymedynamics originated in the effort to understand some unusual properties of the
315
ADVANCES IN PHYSICAL ORGANIC CHEMISTRYVOLUME 41 ISSN 0065-3160 DOI: 10.1016/S0065-3160(06)41006-6
r 2006 Elsevier Ltd.All rights reserved

D. ANTONIOU ET AL.316
following three systems:
1.
It is now widely accepted that for some enzymes (e.g., liver alcohol dehydrogenase,thermophilic alcohol dehydrogenase, etc.) proton transfer proceeds through quan-tum tunneling. The high activation barriers in these systems were consistent withtunneling. However, the KIE were modest, when tunneling would seem to implyhigh KIE.2.
The enzyme lactate dehydrogenase (LDH) catalyzes the interconversion of lactateto pyruvate. There are two isoforms in the body to accommodate differentsubstrates. Despite the fact that the active site is identical in these two isoforms,one favors the production of lactate and the other production of pyruvate.3.
Crystal structures of human purine nucleoside phosphorylase with several TSanalogs showed an unusual geometric arrangement of three oxygens, lying in aclose stack. One may question whether this geometry serves a catalytic purpose.We will show that the answers to all the three of these puzzles involve the dynamicsof the enzyme. There has recently been a disagreement among some authorsregarding the meaning of the term ‘‘dynamical’’, with some suggesting that theterm should be reserved for non-equilibrium motions, while others would use it forequilibrium motions. For clarity, we will define the meaning we give to the term‘‘dynamical’’ in this review.
Let us assume that a variable A(t) is coupled to the reaction coordinate and that(A) is its mean value. If a measurement of some property P depends on (A), but noton the particular details of the time dependence of A(t), then we will call it a‘‘statistical’’ dependence. If the property P depends on particular details of thedynamics of A(t) we will call it a ‘‘dynamical’’ dependence. Note that in this defi-nition it is not the mode A(t) alone that causes dynamical effects, but it also dependson the timescale of the measured property P. Promoting vibrations (to be discussedin Sections 2–4) are a ‘‘dynamic’’ effect in this sense, since their dynamics is coupledto the reaction coordinate and have similar timescales. Conformation fluctuationsthat enhance tunneling (to be discussed in Section 5) are a ‘‘statistical’’ effect: thereaction rate is the sum of transition state theory (TST) rates for barriers corre-sponding to some configuration, weighted by the probability that the system reachesthat configuration. This distinction between dynamic and statistical phenomena inproteins was first made in the classic paper of Agmon and Hopfield.4
We will discuss three kinds of motions:
1.
‘‘Rate-promoting’’ quasi-harmonic motions, a fast sub-ps effect we and otherhave proposed (Section 3).2.
Other kinds of sub-ps motions that involve correlated motions of several residues(Section 4).3.
Conformation fluctuations (Section 5).The structure of this review is as follows. In Section 2 we will review the concept of‘‘rate-promoting’’ vibrations. We will first need to review briefly the theory of
Effect of enzyme dynamics on catalytic activity 317
quantum hydrogen/hydride transfer, because it is the large proton mass (relative toan electron) that makes the reaction rate very sensitive to motions that modulate itstransfer distance. We will then identify the experimental and computational signa-tures of these promoting vibrations. We will close with investigating some objectionsto the possibility of existence of such promoting vibrations. In Section 3 we willapply the theory of Section 2 to the three enzymatic systems that we mentionedearlier in the Introduction.
In Section 4 we will use two theoretical techniques (transition path sampling(TPS) and essential dynamics (ED)) to analyze molecular dynamics trajectories. Wewill explain how we were able to identify in atomic detail collective motions thataffect catalysis.
Finally, in Section 5 we will briefly discuss recent work by Truhlar, Brooks, andHammes-Schiffer on the relation of conformation fluctuations and catalysis indihydrofolate reductase (DHFR) and we will propose a new method for studyingmuch slower motions (such as conformation fluctuations) that may affect catalysis.
This review is not meant to be comprehensive of all work on enzyme dynamicsand catalysis. The emphasis will be on the work done by our group, mainly on fastsub-ps enzyme motions, while other groups have studied mostly conformationalfluctuations. When necessary, we will provide brief descriptions and references to thecurrent work by other groups.
2 Proton transfer and rate-promoting vibrations
We first identified rate-promoting vibrations in enzymatic systems where protontransfer proceeds via quantum tunneling (in this theoretical section, we will use theterms hydrogen, hydride, proton as if they were equivalent). In order to understandwhy systems with proton tunneling are good candidates for identifying promotingvibrations, we must review the modern theory of quantum charge transfer in con-densed phase, which will be the subject of this section.
Excellent recent reviews of the experimental work in tunneling in enzymes havebeen written by Scrutton,5 Romesberg and Schowen,6 and Kohen.7
QUANTUM THEORY OF PROTON TRANSFER
The reaction rate of proton transfer in condensed phases depends on several para-meters: temperature, potential barrier height, transfer distance, reactant frequency,strength of coupling to the environment. For different values of these parameters,different physical mechanisms dominate which have been described by differenttheoretical models, in the chronological order they were studied, the parameter re-gions were:
Region I: The dynamics is over the barrier (as described by TST) or just below thebarrier (small quantum corrections).
Region II: The dynamics takes place by tunneling from excited energy states in thereactant well (moderate to large quantum effects).

D. ANTONIOU ET AL.318
Region III: The dynamics takes place by tunneling from the ground state in thereactant well (large quantum effects).
Special care must be taken if one attempts to draw conclusions from the tem-perature dependence of the rate, because the rate has Arrhenius form in all the threeregions, but the activation energy has different meaning in each regime.
Region I: Small quantum corrections
This region is often studied with the methods described in the book by Bell,8 eventhough it is not really correct to use gas-phase approaches in condensed phasereactions. An assumption is made that there are several energy levels below the topof the barrier and that over the barrier transfer is described by classical dynamics.The TST result for the transfer rate is:
k ¼kBT
2p1
Z0ebV (1)
where b ¼ 1/kBT is the inverse temperature and Z0 is the partition function for anoscillator of frequency oH. If we describe the motion at the reactant well quantummechanically (QM), then
1
Z0¼ 2sinh
boH
2
(2)
If boH/251, one arrives at the familiar textbook TST result for the transfer rate,k ¼ (oH/2p) exp(bV). However, a typical frequency for a proton–carbon bondvibration is 3000 cm–1, so in the present case the opposite limit boH/2b1 is relevant.In this limit 1/Z0Cexp(boH/2) and the semiclassical result for the rate is obtained by:
k ¼ AHebðVoH=2Þ (3)
Equation (3) predicts a KIE (assuming AH ¼ AD):
lnkH
kD¼
b2ðoH oDÞ ¼
b2
1
ffiffiffiffiffiffiffimH
mD
r oH (4)
For C–H bond cleavage, Equation (4) predicts a KIE equal to kH/kD7 at roomtemperature. In the limit where the semiclassical theory is valid, experimentalistsmeasure the Schaad–Swain exponent, ln(kH/kT)/ln(kD/kT). In the special case that thepre-Arrhenius factor AL is the same for all isotopes (which is not true in most cases)then semiclassical theory predicts for this exponent a value 3.26. Deviations from thisvalue are often interpreted as signs of increased tunneling, but in our opinion this lineof argument is based on an oversimplified model of quantum transfer in condensedphases. Note that in tunneling reactions where the ratio AH/AD6¼1, the semiclassicaltheory predicts an exponent that is not equal to 3.26 and is temperature dependent.
Region III: Large quantum effectsWhen the energetic barrier is very high, tunneling takes place from the ground
state. In this limit, the Marcus–Levich–Dogonadze theory9 has been used in the

Effect of enzyme dynamics on catalytic activity 319
study of electron transfer in solution and biomolecules. It is assumed that the en-vironment can be described by a 1-dimensional (1-D) coordinate (a questionableassumption when details of environment dynamics are important) and one exploitsthe fact that in the deep tunneling limit the tunneling matrix element D can be usedas a small parameter in a perturbative approach and find a transfer rate equal to:
k D2ebðErþÞ2=4Er (5)
where Er is the reorganization energy of the environment, e is the exothermicity andD is the tunneling matrix element. Note that the quantum result Equation (5) pre-dicts an Arrhenius form for the rate, similarly to the TST result. In this theory, theKIE is equal to kH=kD D2
H=D2D, which in the deep tunneling limit has a value of
the order 103–104, much larger than the measured KIE in biological systems. How-ever, we will see later in this section that the Marcus theory approach, while valid forelectron transfer, has to be modified for proton transfer.
Region II: Moderate quantum effectsThis is the case when tunneling takes place from excited states, but not close to the
barrier top, and had eluded solution for decades because there is no small parameteravailable (as in the previous two cases). Finally, this problems was numericallysolved in the mid 1990s10 and the solution was analytically verified with a differentmethod by our group.11
It is instructive to have a feeling for when and how the semiclassical theory fails.In Table 1 we compare some exact results10 with the predictions of the semiclassicalmodel Equation (3). There is a range of values for the exact result, because the ratedepends on friction (an effect that cannot be captured in the semiclassical model).We note that when the reactant frequency becomes large, the semiclassical theory ofthe rate fails (we should note that despite the failure in predicting the rate, thesemiclassical model gives reasonably good prediction for the KIE).
We will briefly describe how it became possible in the 1990s to describe QM thisregion of moderate quantum effects. One assumes that the classical charge transferproblem is adequately described by the Langevin equation:12
m€s ¼ dV ðsÞ
ds
Z t
0
dt0gðt t0Þ_s þ F envðtÞ (6)
where s is the reaction coordinate and V(s) is the potential energy surface (PES). Theinfluence of the enzymatic environment in Equation (6) is represented by the randomforce Fenv(t), which is related to the friction g(t) through the fluctuation–dissipationtheorem.13
Table 1 The ratio of rates kexact/ksemiclassical
o/R/kBT Exact Semiclassical
3.2 0.8–1.8 1.54.8 2.0–3.8 2.39.6 30–1000 12.9

D. ANTONIOU ET AL.320
A most important result in rate theory was the proof14 that the classical dynamicsof s governed by the Hamiltonian equation:
H ¼p2
s
2ms
þ V ðsÞ þX
k
P2k
2mk
þX
k
1
2mko2
k qk cks
mko2k
2
(7)
is described by Equation (6). The harmonic oscillators ok constitute a fictitiouseffective environment that is constructed to generate the correct friction kernel g(t).We must emphasize that there is no approximation in using harmonic oscillators todescribe an anharmonic environment, since these oscillators are an effective mediumthat is really a Fourier decomposition of the friction kernel g(t), and are only in-directly related to protein dynamics. The approximation lies in assuming that theLangevin equation is a good approximation for describing the classical chargetransfer. The advantage of casting the problem in terms of the Hamiltonian Equa-tion (7) is that there are many tools for solving quantum Hamiltonians that haveharmonic terms, while there are no methods for solving the quantum version of theLangevin equation.
The beautiful point of this formulation is that the Marcus–Levich–Dogonadzeresult Equation (5) is the solution of the Hamiltonian Equation (7) in the deeptunneling limit. In addition, the solution of the Hamiltonian Equation (7) in theclassical limit reproduces the TST result, corrected for recrossings of the barrier andfor memory effects.12 These results mean that the Zwanzig Hamiltonian provides aunified description of proton transfer reactions in all the three parameter regionsdefined earlier in this section.
Finally, we should mention that the approach described above is not the onlypossible for studying quantum proton transfer in condensed phases. Truhlar andcoworkers have followed a different methodology, based on variational TST, sum-marized in detail recently by Truhlar.15 An advantage of that methodology is that itsinputs are related naturally to quantities that are obtained in quantum chemistrycalculations. On the other hand, because of its phenomenological character, onecannot easily understand when its approximations are justified.
RATE-PROMOTING VIBRATIONS
The theory outlined in the previous subsection is appropriate for electron transfer,but has to be modified for proton transfer. In this section we will describe thephysical justification and mathematical formalism that incorporates these effects.
Hynes’ theory of promoting vibrations
In the early 1990s, in their studies of proton transfer in solution using Marcus’ ratetheory Equation (5), Hynes and coworkers16,17 noticed the following limitation. If Q
is the tunneling distance, it can be shown that the tunneling matrix element thatappears in Equation (5) has the form DeaQ. For typical electron transfer reactions

Effect of enzyme dynamics on catalytic activity 321
a C1 A–1, while for typical proton transfer reactions aC30 A–1. This means thatwhile electron transfer rates are insensitive to variations of the tunneling distance Q,proton transfer rates, because of the large value of a, depend strongly on motionsthat possibly reduce the transfer distance Q.
Hynes assumed that the deviation dQ of the transfer distance from its equilibriumvalue has a harmonic time dependence, dQ ¼ dQ0 cos(Opvt), and calculated the rateusing Fermi’s golden rule (i.e. the same level of approximation as Marcus’ theory).He found for the rate:
k ¼ D20 ebEM e2a
2=bMpvO2pv (8)
where D0 is the tunneling splitting that corresponds to the equilibrium transferdistance, EM is the activation energy of the ordinary Marcus theory and Mpv, Opv
are, respectively, the mass and frequency of the promoting vibration.In the previous section we mentioned that Marcus’ theory is not a plausible model
for describing proton transfer because it predicts a KIE kH=kD ¼ D2H=D
2D, that is
very large, since the tunneling splittings decrease exponentially with the square rootof the mass. This problem is remedied by Hynes’ work, since the KIE in the presenceof a promoting vibration becomes:
kH
kD¼
D2H
D2D
exp a2D a2HbMpvO
2pv
( )(9)
Since a scales likeffiffiffiffim
p, the exponential in Equation (9) reduces significantly the KIE.
Recently, Hynes reviewed18 his approach, with emphasis on applications to enzymes.
Benderskii’s theory of promoting vibrations
Hynes’ formulation is intuitively very appealing, but there are some drawbacks. Theenvironment is described by a 1-D coordinate and the promoting vibration is anartifact that was introduced to modulate the tunneling splitting. In a series of paperson gas-phase proton transfer,19–21 Benderskii had examined the same effect, tun-neling rate modulated by fluctuations of transfer distance, using a Hamiltonianformalism. We will briefly summarize his approach.
Let us assume a symmetric double well PES, V(s) ¼ as4bs2. Its barrier height isb2/4a and the transfer distance
ffiffiffiffiffiffiffiffiffiffi2b=a
p: Let us assume that a harmonic mode Q(t)
is coupled to s through a term cs2Q. Effectively, the parameter b of the original PESis replaced by bcQ(t). As Q(t) oscillates, the transfer distance also oscillates aroundits equilibrium value. In addition, when the transfer distance decreases, the barrierheight is lowered. In summary, the simple, symmetric with respect to s, functionalform cs2Q of the coupling reproduces the desired behavior of a PES whose barrier islowered as the transfer distance decreases.
Benderskii managed to solve this problem in the deep tunneling limit using theinstanton method. Roughly speaking, an instanton is the most probable among the

s
Q
− s0 + s0
Fig. 1 The PES surface in Benderskii’s model. The dark circles are the reactant/productminima and the open circle is the saddle point. The double line is the MEP. The solid line isthe instanton tunneling path for H, and the dashed line for D. Because D is heavier, it tunnelscloser to the saddle point where the barrier is lower. As a result, the KIE is relatively low, eventhough the reaction proceeds through tunneling.
D. ANTONIOU ET AL.322
possible classical trajectories when one solves the problem QM. We summarizeBenderskii’s results in Fig. 1.
The double line represents the minimum energy path (MEP), which is the reactionpath assumed by TST. The single line represents the instanton trajectory for protontunneling and the dashed line the instanton trajectory for deuteron tunneling. Theheavier deuteron tunnels closer to the MEP, where the barrier is lower. These dis-tinct instanton paths are the reason for the lowering of the KIE by the promotingvibration that we mentioned earlier.
There are other important features in this seemingly simple diagram. The instan-ton trajectories cross the TS parallel to the s-axis, which means that tunneling ishappening instantaneously in the timescale of the promoting vibration. But this doesnot mean that the frequency of the promoting vibration does not play a role! In fact,the result depends on the ratio of the promoting vibration frequency over the barrierfrequency Opv/ob. We have to distinguish between the following limits:22
When 2Opv/ob51, we are in the ‘‘fast-flip’’, or ‘‘sudden approximation’’, or ‘‘cor-ner-cutting’’, or ‘‘large curvature’’ limit, where the reaction coordinate followstheMEP, but before it reaches the saddle point it tunnels along the s coordinate ina time that is short compared to the timescale of the Q vibration. When 2Opv/obb1, we are in the ‘‘slow-flip’’, or ‘‘adiabatic’’, or ‘‘small curvature’’limit, where the Q vibration adiabatically follows the s coordinate and transfertakes place along the MEP path (i.e. at the saddle point).Therefore very fast promoting vibrations do not affect the rate, and we shouldexpect to see an effect when 2Opv/ob51, i.e. when Opv is smaller than roughly500 cm–1, which explains why we mentioned earlier that we studied sub-ps motions.
Theory of promoting vibrations in condensed phase
The formulation of promoting vibrations by Benderskii is very satisfactory becauseit formulated the problem in a Hamiltonian language. On the other hand, the Hynes

Effect of enzyme dynamics on catalytic activity 323
formulation, even though it uses an ensatz for the promoting vibration, has theadvantage that includes interaction with the environment (with the limitation of theMarcus model, i.e. that the environment is represented by a single degree of free-dom). We can incorporate these two theories into the Zwanzig Hamiltonian equa-tion (7) and obtain a theoretically satisfying framework for the description of protontransfer in condensed phases, coupled to a promoting vibration.22
We add a term cs2Q þ 12MQ O2
pv in Equation (7), to obtain the Hamiltonian:
p2s
2ms
þ V ðsÞ þ cs2Q þ1
2MQO
2pv þ
Xk
P2k
2mk
þX
k
1
2mko2
k qk cks
mko2k
2
(10)
This incorporates the advantages of Benderskii’s and Hynes’ ideas, and in ad-dition contains a more realistic description of the environment. One importantdifference is that Hynes and Benderskii studied systems in which the oscillator Q wasa bond vibration, while in Equation (10) Q(t) can be any variable that modulates thePES, for example, it can be a distance between the donor and a nearby residue thatchanges in time because of equilibrium fluctuations of the enzyme.
To establish a relationship between the Hamiltonian equation (10) and the actualenzymatic system one performs a molecular dynamics simulation to obtain the forceF(t) acted upon the reaction coordinate. Then the force autocorrelation function/F(t)F(0)S, which is proportional to the friction kernel g(t), is related to theparameters of the fictitious medium of Equation (10) through
gðtÞ ¼1
kBThF ðtÞF ð0Þi
XN
k¼1
c2kmko2
k
cosðoktÞ (11)
This equation permits the mapping of the computed force F(t) to the parametersof our Hamiltonian.
To obtain some insight into the behavior of the solutions of the Hamiltonianequation (10), we performed a numerical simulation of a model system:23 weassumed that V(s) is a symmetric double well, we coupled s to 1000 harmonicoscillators ok with frequencies ranging from 10 to 1000 cm–1, and symmetrically toone oscillator Opv. Even though the simulation is completely classical, we obtainedinstructive results that illustrate several of the points we have mentioned in thissection.
The next two figures show results for proton transfer in a symmetric double wellpotential that has barrier height equal to 6 kcalmol1 and transfer distance 1 A; theproton is coupled symmetrically to an oscillator of frequency 300 cm1. In Fig. 2we show the progress of the reaction coordinate from reactants to products. Thevery fast oscillations are bond oscillations in the reactant/product wells. The sloweroscillation that envelopes the bond oscillations is the promoting vibration. Note thatthe promoting vibration is fast enough that the time the barrier is lowered is not longenough for a reactive event to occur, i.e. it requires several oscillations of the pro-moting vibration for the charge transfer to occur. Once the crossing over the barrierhappens though, it is practically instantaneous in the timescale of the promotingvibration.

0 1 2 3 4time (ps)
-2
-1
0
1
2
s (Å
)
Fig. 2 An example of a reactive trajectory. The TS is at the s ¼ 0 line and the reactant/product wells at the s ¼ 1 lines.
0 0.2 0.4 0.6 0.8 1 1.2 1.4Q (Å)
0
0.05
0.1
frac
tion
of r
eact
ive
traj
ecto
ries
ΩQ = 300 cm-1
Fig. 3 A histogram of the values of the promoting vibration coordinate Q, as the reactivetrajectories cross the TS. The dashed line corresponds to the location of the saddle point.
D. ANTONIOU ET AL.324
In Fig. 3 we plot a statistics of the values of the promoting vibration coordinate asthe reactive trajectories cross the TS. The saddle point in Fig. 1 corresponds to thevalue of Q shown with a dashed line in Fig. 3. We note that the reactive trajectoriesdo not pass through the saddle point, but rather through a broad region centered atthe saddle point. This picture shows that the dynamics cannot be described by asingle TS. The deeper reason for this is that the assumption of separability fails:24
the promoting vibration is strongly coupled to the reaction coordinate in the TSregion and the frequency of the promoting vibration is comparable to the invertedbarrier frequency, so there is no separation of timescales.

Effect of enzyme dynamics on catalytic activity 325
Finally, in our opinion, there is an open question in quantum theories of protontransfer. The theories we have been discussing use a mean field potential as the PES.This is undoubtedly correct when the environment relaxes quickly in the timescale ofthe reaction. However, the transfer step in quantum tunneling is very fast, and it isnot certain that all the configurations that enter the mean field potential are sam-pled. This point was first raised by Hynes25 and implemented in studying protontransfer in solution by Hynes and Wilson.26
COMPUTATIONAL SIGNATURE OF PROMOTING VIBRATIONS
In a realistic system there are many other motions present, so there is no guaranteethat the effect of the promoting vibration will not be masked by other interactionsthat are present in an enzyme. We need a diagnostic that when we perform acomputer simulation of the dynamics of an enzyme, will allow us to identify whethera promoting vibration is present.
We have found27 such a computational signature in the framework of theLangevin equation (6). Let us recall that if we compute from a simulation the forceF(t) on the reaction coordinate, then the friction kernel g(t) is proportional to theautocorrelation of that force. We have shown that if we add a term cs2Q þ 1
2MQO
2pv
to the Langevin equation, and allowing the promoting vibration to be coupled to theenvironment with coupling strength z, the friction kernel becomes
gpvðtÞ ¼ gðtÞ þ4c2
MO2pv
sðtÞsð0Þ cosð ~OpvtÞ þz
2 ~Opv
sinð ~OpvtÞ
" #ezt=2 (12)
Here g(t) is the friction of the original Langevin equation and ~Opv ¼
ffiffiffiffiffiffiffiffiffiffiffiffiffiffiffiffiffiffiffiffiffiffiO2
pv z2=4q
is the effective frequency of the promoting vibration, modified due to its coupling tothe environment.
Equation (12) provides the diagnostic we have been looking for. Note that thecorrection to the friction kernel due to the promoting vibration is proportional tos(t)s(0). Suppose we perform a simulation where we have imposed constraintsto keep the transferred proton fixed, so that the correction term is proportional tos(0)2. If we keep the proton fixed near the TS, s ¼ 0, the correction term will bevery small. If we keep it fixed away from the TS (most simply, at the reactant orproduct configuration), the correction term will be nonzero. In addition, if we takethe Fourier transform of Equation (12), the presence of the trigonometric terms inthe correction term will produce large peaks at the frequency of the promotingvibration.
In conclusion, if we perform simulations with the transferred proton fixed nearand away the TS, and then take a Fourier transform of the calculated friction kernel,if we see sharp peaks for the latter simulation that are absent when the proton is heldfixed near the TS, then we have evidence that a promoting vibration is present, andthe position of the peak is an indication of its frequency. In the next section we willdiscuss examples of enzyme simulations where this diagnostic was successful.

D. ANTONIOU ET AL.326
EXPERIMENTAL SIGNATURE OF PROMOTING VIBRATIONS
The discussion in this section has suggested a clear experimental signature for thepresence of promoting vibrations. Hynes’ formalism, Benderskii’s formalism andour quantum calculations using the Hamiltonian equation (10) all predict a lowKIE, i.e. much lower than what one would expect for transfer through tunneling. Infact, the initial resistance to accepting that tunneling can occur in enzymes wasexactly the low values of KIE. As mentioned earlier, Hynes has recently reviewed18
the topic of influence of promoting vibrations on KIE, but with a perspectivedifferent than ours.
Furthermore, the tunneling rate depends exponentially on the reorganizationenergy of the environment, which for an enzymatic system depends strongly on therigidity of the enzyme. This raises some intriguing possibilities for the interpretationof certain experiments on thermophilic enzymes. Thermophilic enzymes show lowenzymatic activity at mesophilic temperatures, and the conservation of the active sitestructure and chemical mechanisms suggests that the same chemical mechanism ispresent at both thermophilic and mesophilic temperatures. One possible interpre-tation focuses on the temperature-dependent motions of proteins, because exper-iments have shown that the rigidity of thermophilic proteins is less at thermophilicrather than at mesophilic temperatures.28
The work that is of interest with respect to promoting vibrations is a study29 ofhydrogen tunneling in alcohol dehydrogenase from Bacillus stearothermophilus. Theunusual features of this system are (i) the activation energy is smaller in the thermo-philic regime, which in a naive interpretation would imply that tunneling is enhancedwith increasing temperature; (ii) the primary KIE is small and temperature-independent in the thermophilic regime, but larger and temperature-dependent inthe mesophilic regime. We have shown30 that by assuming the presence of a pro-moting vibration in the thermophilic regime, and assuming that it freezes out in themesophilic regime, one is able to reproduce all the trends mentioned earlier in thisparagraph. Reproducing trends is not definite proof, but at the very least it is areminder that the presence of a minimal dynamical element makes the problemsufficiently complex, that conclusions derived by studying Arrhenius plots shouldnot be trusted.
Anomalous values of the secondary KIE have been interpreted as indications oftunneling. The reader should consult the arguments regarding secondary KIEs inreviews of experimental literature.6,7
FOUR OBJECTIONS TO PROMOTING VIBRATIONS
The real protein dynamics is not harmonic
‘‘Proteins are very anharmonic systems, so what is the justification of modeling theprotein environment as a set of harmonic oscillators in Equation (10)?’’ The realapproximation we have made is modeling the proton transfer by the Langevin

Effect of enzyme dynamics on catalytic activity 327
equation (6). One expects this to be a good approximation for the short timescalesrelevant for barrier crossing. Within the Langevin equation, the effect of the en-vironment on the proton is captured through the friction kernel, which is the forceautocorrelation function. No approximation is made regarding this friction kernel, itis what is obtained from a simulation. This time-dependent friction kernel can bedecomposed into Fourier components, which are the harmonic oscillators appearingin Equation (10). That is, these oscillators are fictitious quantities introduced toreproduce the exact form of the friction kernel, therefore no simplification regardingthe protein anharmonic dynamics is made.
The promoting vibration is quickly dephased
‘‘If we embed a harmonic oscillator in a medium, it will be very quickly dephased.
Therefore, the identification in an enzyme of a promoting vibration with a definite
frequency is not plausible.’’ Here, the misunderstanding is that the promotingvibration is not a harmonic oscillator embedded in the enzymatic environment.
The motion of a protein on its PES can be described as anharmonic motions nearlocal minima (i.e. conformations), with rare hops between conformations. While thesystem executes this motion, we can record, for example, the distance Q(t) betweentwo residues. If the Fourier transform of Q(t) is relatively peaked, then the distancebetween these residues varied in time like a damped harmonic motion. The quantityQ(t) is not an oscillator with energy levels, that is embedded in the enzyme, rather itis an internal distance of, for example, residues that participate in the equilibriumfluctuations of the enzyme.
In simple model calculations we can mimic this effect by writing a Hamiltonianlike Equation (10) in which Q(t) appears as an independent oscillator, but it must beunderstood that this Hamiltonian is a simplified model designed to produce a fluc-tuating PES, and Q(t) is a quantity that parametrizes this fluctuation. However, it istrue that one cannot assume beforehand that the distance Q(t) is harmonic, one hasto calculate it, Fourier transform it and check whether it is peaked at some fre-quency, as we will do in the examples in the next section.
Parenthetically, we would like to use this opportunity to correct a misunder-standing that is common in enzymatic literature. Highly anharmonic potentials donot necessarily exclude harmonic dynamics! An example is water: the interatomicpotential is extremely anharmonic (hard spheres), but water supports harmonicwaves (sound). The resolution of the paradox is that the variable that describessound waves (density) is not the variable that enters the anharmonic interatomicpotentials, so it is possible for equilibrium fluctuations, like sound, to have harmonicdynamics.
The promoting vibration is much faster than the turnover rate
‘‘The turnover rate for enzymes has timescales ms– ns, but the promoting vibration has
ps-timescale, therefore they can’t be related.’’ This argument is correct for some gas-phase reactions, but it is not valid for condensed phase reactions.

D. ANTONIOU ET AL.328
Let us look at a simple condensed phase reaction, electron transfer in liquids,which is described by Marcus’ theory equation (5). As is well known, electrontunneling takes place only when the interaction with the solvent symmetrizes thePES. The reorganization energy required for the solvent to reach its configurationthat will symmetrize the PES of the electron, is the activation energy appearing inEquation (5). Once the PES is symmetrized, the probability that the electron willtransfer is proportional to the square D2 of the tunneling matrix element. Therefore,even for simple transfer reactions in condensed phases, several events of widelyvarying timescales contribute to reaction and the turnover rate is not simply relatedto the timescale of a single event.
The method was designed to identify ps-timescale motions
‘‘The reason this method identified promoting vibrations for some systems is that
by construction it searches only for fast ps motions, and therefore it cannot identify
e.g., slower conformational motions that possibly affect the reaction rate.’’ This crit-icism is absolutely correct, if there are conformations that bring donor and acceptorclose together thus enhancing tunneling, they are outside the grasp of a method thatis based on Langevin equation. In Section 5 we will outline some ideas for searchingthe conformation space for configurations that affect the reaction rate.
3 Examples of rate-promoting motions in enzymatic systems
We will now present examples of enzymatic systems where we applied the ideasand formalism of the previous section, and we were able to identify rate-promotingvibrations.
HORSE LIVER ALCOHOL DEHYDROGENASE
The first system in which we identified a promoting vibration was horse liver alcoholdehydrogenase (HLADH).31 The active site and surrounding residues are shown inFig. 4. The suspicion that dynamics may play a role existed because two specificmutations had been identified, Val203-Ala and Phe93-Trp, which significantlyaffect enzyme kinetics. Both residues are located at the active site. Val203 impingesdirectly on the face of the nicotinamide ring in the nicotinamide adenine dinucleo-tide (NAD) cofactor distal to the alcohol substrate. Additionally, there is evidencefrom molecular dynamics simulations,32 that Val203 forces the nicotinamide ring ofNAD+ into closer proximity to the substrate, thus facilitating the hydride transferto produce the corresponding aldehyde. These facts suggest that motions of theseresidues may play an important role in catalysis.
In the previous section we found a computational signature for the existence ofpromoting vibrations: fix the transferred proton at the TS and away from it, andcompare the magnitude of the Fourier transform of the forces on the proton, as it is

Fig. 4 Active site of HLADH: Val203, the NAD cofactor and the alcohol substrate.
Effect of enzyme dynamics on catalytic activity 329
held fixed at different positions. Since the location of the TS is unknown, we triedseveral intermediate positions and selected the one for which the spectral density issmallest, i.e. a position of minimum coupling.
We shall present results from simulations for three configurations – reactants (R),products (P), and minimal coupling (MC):
The R configuration consists of NAD+ and the deprotonated benzyl alcohol(PhCH2O).
The P consists of NADH and benzaldehyde. In the third configuration MC, we have NAD+ and PhCH2Owith the pro-Rhydrogen restrained so that it is equidistant from the hydroxyl a-carbon (hydridedonor) and the C4 carbon (hydride acceptor) in the nicotinamide ring.
We performed a 30-ps simulation and saved the time series for several distancesbetween atoms. In Fig. 5 we plot, for all three configurations, the Fourier transformof the donor–acceptor distance. We see a peak at ca. 100 cm1, common to all threeconfigurations, signifying that the two motions appear to be in resonance.
The Fourier transform of the force on the reaction coordinate is shown in theright panel of Fig. 5. Again, the peak at ca. 100 cm1 is common to both config-urations. This is a strong indication that the motion of the transferred proton is

0 100 200 300 400 500 600 700 800frequency (cm-1)
0
1e-06
2e-06
3e-06
4e-06
RPMC
0 100 200 300 400 500 600 700 800
frequency (cm-1)
0
5e-06
1e-05
RPMC
Fig. 5 Left: the spectral density for the donor–acceptor relative motion in the wild type; itmonitors the donor–acceptor distance. Right: the spectral density for the reaction coordinate,in the wild type. The three lines represent the reactants configuration (R), the productsconfiguration (P), and the minimal coupling configuration (MC).
D. ANTONIOU ET AL.330
coupled to the relative motion between the alcohol and the nicotinamide ring. Onthe scale of the graph, the spectral density for MC appears as the flat line close to thehorizontal axis, which shows that the spectral density is position-dependent, aspredicted by Equation (12). Furthermore, if we had shown the MC line in mag-nification we would see that although the high frequency peaks in the P and C arestill present in MC, the peak at ca. 100 cm1 is almost absent in MC. These resultsstrongly suggest that the reaction coordinate is coupled to an oscillation of fre-quency ca. 100 cm1.
In view of our earlier analysis, our results indicate that the reaction coordinate iscoupled to the alcohol-NAD motion, which in turn is coupled to Val203, whose sidechain impinges directly on the face of the nicotinamide ring. It is thus shown that inHLADH this dynamic coupling is central to the catalytic process. Finally, we shouldpoint out that Cui and Karplus33 used our concept of symmetrically coupledvibrations and performed a simulation on HLADH following a different method,and found results that are in agreement with the results presented here.
LACTATE DEHYDROGENASE
The next system we studied was the isoforms of human LDH. The first part ofthe calculation was similar to HLADH. However, we encountered interesting com-plications.
LDH catalyzes the interconversion of lactate and pyruvate with the coenzymeNAD (see Fig. 6). This enzyme plays a fundamental role in respiration, and multipleisozymes have evolved to enable efficient production of substrate in different mi-croenvironments. Two main subunits, referred to as heart and muscle, are combinedin the functional enzyme as a tetramer, and subunit combinations range from pureheart to pure muscle. The kinetic properties of the heart and muscle isoforms are

Fig. 6 Diagram of the binding site of LDH with bound NADH and pyruvate showinghydrogen bonds between the substrate and key catalytically important residues of the protein.The catalytic event involves the hydride transfer of the C4 hydrogen of NADH from the pro-R side of the reduced nicotinamide ring to the C2 carbon of pyruvate and protein transferfrom the imidazole group of His-193 to pyruvate’s keto oxygen.
Effect of enzyme dynamics on catalytic activity 331
distinct: the heart favors production of lactate and the muscle of pyruvate. Despitethis difference, the domain structure, subunit association, and amino acid contentof the active sites of the two isoforms are almost identical, leading to the puzzleof what is the cause of their difference in activity. We propose that placement of theTS, coupled with a promoting vibration, can influence kinetic control of hydridetransfer.
Results will be presented for the following configurations: the heart and muscleisoform each with lactate and NAD+ bound; the heart and muscle isoform eachwith pyruvate and NADH bound; two simulations of the heart isoform with lactateand NAD+ bound where the hydride distance was restrained at a point betweendonor and acceptor carbons. In the following figures, in the language of the previoussubsection, the reactant configuration for the heart isoform is the line ‘‘lactate’’ andthe product configuration is the line ‘‘pyruvate.’’ And vice versa, the reactant con-figuration for the muscle isoform is the line ‘‘pyruvate’’ and the product configu-ration is the line ‘‘lactate.’’
In Fig. 7 we show results for the heart LDH isoform: (1) the Fourier transform ofthe force on the transferred hydride (left); (2) the Fourier transform of the relativemotion between the substrate C2 carbon and carbon C4N of the nicotinamide ringof the cofactor NAD+/NADH (right). In Fig. 8 we show the corresponding figures

0 100 200 300 400 500 600 700 800 900 1000frequency (cm-1)
0
0.00025
0.0005
0.00075
0.001
0.00125
0.0015 MCPyruvateLactate
0 100 200 300 400 500 600 700 800 900 1000frequency (cm-1)
0
0.00025
0.0005
0.00075
0.001
0.00125
0.0015
LactatePyruvateMC
Fig. 7 Wild-type heart LDH isoform: Fourier transform of the force on the reaction co-ordinate (left) and Fourier transform of relative donor–acceptance distance (right).
0 100 200 300 400 500 600 700 800 900 1000frequency (cm-1)
0
0.00025
0.0005
0.00075
0.001
0.00125
0.0015
LactatePyruvate
0 100 200 300 400 500 600 700 800 900 1000frequency (cm-1)
0
0.00025
0.0005
0.00075
0.001
0.00125
0.0015
LactatePyruvate
Fig. 8 Wild-type muscle LDH isoform: Fourier transform of the force on the reactioncoordinate (left) and Fourier transform of relative donor–acceptance distance (right).
D. ANTONIOU ET AL.332
for the muscle LDH isoform. Similarly, to the HLADH simulation we found clearevidence of the presence of a promoting vibration:
(1)
The spectral density is much lower when the hydride is near the TS, as predictedby Equation (12) (line MC in the Figure).(2)
The peaks of the Fourier transform of the force on the hydride, are in resonancewith the peaks of the Fourier transform of the relative donor–acceptor motion.These results show strong evidence for the presence of a promoting vibration, butthey are symmetric for both isoforms, so they don’t resolve the paradox why oneisoform favors the production of pyruvate and the other of lactate. However, there isa hint: in the left panels of Figs 7 and 8, the pyruvate peak is higher for the heartisoform and the lactate peak higher for the muscle isoform. Recall that the heightof the spectral density is proportional to the force on the reaction coordinate.According to Equation (12), what may lead to bigger force, is bigger s(t), i.e. biggerdeviation from the TS. Since the lines ‘‘lactate’’ and ‘‘pyruvate’’ in Figs 7 and 8correspond to the hydride bound to the donor/acceptor (and vice versa for the other

0 5 10 15 20 25 30time (ps)
3
3.5
4
4.5
5Å
Lactate (avg 3.77)Pyruvate (avg 4.34)
0 5 10 15 20 25 30time (ps)
3
3.5
4
4.5
5
Å
Lactate (avg 3.86)Pyruvate (avg 3.29)
Fig. 9 Donor–acceptor distance for the wild-type human heart LDH isoform (left) and themuscle isoform (right).
Effect of enzyme dynamics on catalytic activity 333
isoform), it would be interesting to see what is the average distance of donor–ac-ceptor in the two isoforms.
In Fig. 9 we show the results of a 30-ps simulation for the donor–acceptordistance, i.e. the distance between the C2 carbon of substrate and carbon C4N of thenicotinamide ring of the cofactor NAD+/NADH. Fig. 9 shows that the averagedonor–acceptor distance is shorter for the heart isoform when lactate and NAD+
are bound, and for the muscle isoform when pyruvate and NADH are bound. Wepropose that the different kinetic activity of the two isoforms is due to the reduceddonor–acceptor distance when lactate is bound to the heart isoform and pyruvate isbound to the muscle isoform.
The next question is to identify residues near the active site that may modulate thedonor–acceptor distance. In Fig. 10 we show the active site and some nearby res-idues. In the spirit of the previous results, in order to predict the degree that themotion of these residues is correlated with the donor–acceptor motion, we cancalculate the Fourier transform of the autocorrelation of the residue motion, andthen order the residues according to the height of the peak of the spectral density.34
In Fig. 11 we show one result, the spectral densities for the motion, projected firstalong the residue–donor axis and then along the donor–acceptor direction, of threeresidues, two of them strongly correlated and one not correlated.
Finally, to bring our argument to its logical conclusion, we can test for the con-sistency of our interpretation: we substituted residue 31, Valine, with a less bulkyone, Alanine. If our interpretation is correct, we expect that the Fourier transform ofthe force on the hydride would have a higher peak in the wild type than in themutant, since the bulkier Valine is more efficient in pushing the nicotinamide ring ofthe NAD+, and as a result the average donor–acceptor distance would be smallerfor the wild type than in the mutant. In Fig. 12, we show the results of the simu-lation, which are consistent with our prediction. As we mentioned earlier, the peakof the spectral density can be lowered either because the coupling to the reactioncoordinate is weaker, or because the reaction coordinate is fixed closer to the TS.The right panel of Fig. 12 shows that the average donor–acceptor distance is larger

0 100 200 300 400 500 600 700 800 900 1000frequency (cm-1)
0
5e-05
0.0001
0.00015
0.0002
23831193
Fig. 11 Spectral density of motion of three residues in the wild-type human heart LDHisoform with lactate and NAD+ bound: residue 238 is the most strongly correlated residue, 31is strongly correlated and substituted in the mutagenesis simulation, and residue 193, theessential active site histidine, is poorly correlated.
Fig. 10 The structure of the heart isoform with lactate and NAD+ bound.
D. ANTONIOU ET AL.334

0 100 200 300 400 500 600 700 800 900 1000
frequency (cm-1)
0
0.00025
0.0005
0.00075
0.001
0.00125
0.0015
Wild TypeMutant, V31A
0 5 10 15 20 25 30
time (ps)
3
3.5
4
4.5
5
Å
Wild Type (avg 3.77)Mutant, V31A (avg 4.1)
Fig. 12 Left, spectral density for the reaction coordinate in the wild type and mutant humanheart LDH isoform with lactate and NAD+ bound: the solid line is the wild-type config-uration where residue 31 is Valine, and the dashed line is the mutant configuration whereresidue 31 is Alanine. Right, donor–acceptor distance for the wild type and mutant humanheart LDH isoform with lactate and NAD+ bound: the solid line represents the wild-typeconfiguration where residue 31 is Valine and the dashed line represents the mutant config-uration where residue 31 is Alanine.
Effect of enzyme dynamics on catalytic activity 335
for the mutant result, therefore the lower peak of the spectral density in the left panelnecessarily means that the coupling is weaker for the less bulky Alanine.
HUMAN PURINE NUCLEOSIDE PHOSPHORYLASE
Up to this point, all the examples we discussed, concerned protein motions thataffect reactions that involve a light particle transfer. However, rate-promotingenzymatic motions can also exist in other types of reactions. For example, we haveshown35 that such motions can influence catalysis by acting through electron densityfluctuations caused by geometrical changes. The system we investigated is humanpurine nucleoside phosphorylase (hPNP), which catalyzes reversible bond cleavageof 6-oxopurine nucleosides to form phosphorylated a-D-ribose products in thepresence of phosphate, as seen in Fig. 13.
The cleavage of the C-10–N-9 ribosidic bond (for atom terminology see Fig. 14)occurs in a dissociative mechanism that forms a TS with a substantial oxycarbeniumion character. The phosphate provides an electrostatic stabilization of this oxy-carbenium ion, encouraging TS formation.36,37 As the N-ribosidic bond is cleaved,electron density is expelled by the oxygen-stack compression towards the purinering, and improves electrostatic interactions with nearby residues and facilitates theabstraction of a proton from a close-by proton donor, making the purine a betterleaving group and accelerating catalysis. In summary, oxycarbenium stabilization,increased phosphate ionization and purine ring activation, contribute in concert tocatalytic acceleration. Crystallographic data of several hPNP complexes with TSanalogs, showed an unusual geometric arrangement of the atoms O-50, O-40, and OP,lying in a close threeoxygen stack (Fig. 14), which was later corroborated by

NH
NN
N
O
O
OHOHH
P
OH
-O
O
O
-
phosphate
inosine
4'
5'
1'
9NH
NN
HN
O
O
OHOHH
OH
PO
OH-O
O
transition state
δ+
δ-
NH
NN
HN
O
O
OHOHH
PO
OH-O
O
hypoxanthine
α-D-ribose 1-phosphate
δ+
OH
OH
Fig. 13 hPNP-catalyzed phosphorolysis of the purine nucleoside. The guanine leaving groupand phosphate nucleophile are well-separated from the oxycarbenium ion, defining a highlydissociative TS. Note the oxygen stacking, indicated by the rectangle, of O50, O40, and thephosphate nucleophile OP.
N1
N3
N7
O6
N9
C1'O4'
C4'
HOOH
C5'O5'H
NH2
OPHO
OP
O
Fig. 14 Atomic nomenclature of the purine nucleoside and phosphate nucleophile.
D. ANTONIOU ET AL.336
extensive experimental KIE analysis.38 We have shown35 that protein motions inhPNP and its substrates cause the O-50, O-40, and OP oxygens to squeeze togetherand push electrons towards the purine ring, stabilizing the oxycarbenium characterof the TS.
The starting point of our computations was the 2.5 A resolution structure of hPNPcomplexed with the TS analog ImmH and phosphate. Following standard compu-tational procedures for enzymes we performed both classical molecular dynamicssimulations and hybrid quantum/molecular simulations.35
The enzymatic system was divided into two concentric zones. These consisted ofthe QM region, containing the atoms being treated QM, and the molecular mechanics

Effect of enzyme dynamics on catalytic activity 337
(MM) region, in which the atoms were treated with a MM potential. In the caseof the simulation of the E?S complex, the QM region contained the substratesguanosine and phosphate, and the conserved catalytic water. For the E?I complex,the QM region contained ImmG, phosphate and a catalytic water. The AM1 semi-empirical Hamiltonian was employed as the QM potential, and the all-atom forcefield of CHARMM22 was used to describe the atoms in the MM region.
For example, for the E?S complex, we chose the QM/MM model shown sche-matically in Fig. 15. The residues N243 and E201 are actively involved in catalysisby stabilization of the TS, but since they are not directly involved in the acidcatalysis, they were not included in the QM region due to computational limitationsof QM/MM methods. However, their contribution to the stabilization of the TSstructure is introduced by the QM/MM electrostatic term of the Hamiltonian. Wewere interested in the last step of the reaction, the cleavage of the N-ribosidic bondand protonation of the purine ring to yield the protonated guanine and phosphory-lated a-D-ribose. It is essential that a good reaction coordinate be used in orderto represent the enzymatic reaction properly to obtain meaningful PESs. After in-vestigating a variety of reaction coordinates, we found that a suitable reaction co-ordinate to describe the phosphorolysis reaction was the interatomic C-10–N-9 andC-10–OP distances (Fig. 15).
Fig. 15 QM/MM model used to obtain the PES. The reaction coordinate used to producethese surfaces is shown with dashed lines in the figure.

D. ANTONIOU ET AL.338
Results: dynamics
During the classical MD simulation we saved the values of the O-50–O-40 andO-40–OP distances. We found that these distances are quite stable, deviating only upto 0.3 A from their average value. This implies that the O-50–C-50–C-40–O-40 dihedralis not rotating freely as it does in aqueous solution, but is restricted by the enzymaticenvironment. We show the time series for that dihedral in both the enzymatic en-vironment and in aqueous solution in Fig. 16. We note that the mean value in eachcase is different, and that there is a higher deviation from the mean value in solution,verifying that this dihedral’s motion is restricted in the enzyme.
In Table 2 we show the average O-50–O-40 and O-40–OP distances and standarddeviations, for the WT and for several mutants of hPNP complexed with guanosineand phosphate (the maximum fluctuation of the O-50–O-40 distance is 0.6 A, there-fore a difference of, for example, 0.2 A in the average distance is substantial). Foreach mutation the changes in compression of the oxygen stack were different. Forexample, we found that for the H257G mutant, the average O-50–O-40 distance wasconsiderably higher than that of the WT, meaning that the residue H257 plays a rolein keeping the two oxygens compressed.
We now move to a dynamical analysis of the time series for these distances. In theleft panel of Fig. 17, we show the Fourier transforms of the O-50–O-40 distanceautocorrelation function, and of the O-50–O-40, O-40–OP distance–distance correla-tion function. The spectra are very similar, indicating that O-50O-40 and O-40–OP
0 20 40time (ps)
-100
-50
0
50
dihe
dral
(de
gree
s)
E·S complexSubstrates in aqueous solution
Fig. 16 O-50C-50C-40O-40 dihedral (degrees) of the ribose ring during the WT classicalMD simulation in aqueous solution and in the E?S complex.
Table 2 Average O-50O-40 and O-40OP distances (A) for the WT and mutated hPNPs
Distance WT E201G V260G H257G
O-50O-40 2.8170.08 2.8870.11 2.7870.08 3.0470.08O-40OP 4.3470.10 6.5870.11 3.9070.11 4.6970.10
0 200 400 600 800 1000frequency (cm-1)
0
0.001
0.002
0.003
0.004
0.005
O-5’-O-4’ with O-4’-OPO-5’-O-4’
0 200 400 600 800 1000frequency (cm-1)
0
0.0002
0.0004
0.0006
0.0008
0.001
quantum/classical MDclassical MD
Fig. 17 Left: Comparison of the spectra of the O-50O-40 distance autocorrelation functionand the O-50O-40 and O-40OP distance–distance correlation function. Right: The similarityof the spectra of the O-50O-40 distance autocorrelation function for the E?S complex basedon the classical and quantum/classical MD simulation, shows an agreement to the classicalsimulations.
0 200 400 600 800 1000frequency (cm-1) frequency (cm-1)
0
0.0005
0.001
0.0015
unsolvated substratesE·S complex
0 200 400 600 800 10000
0.002
0.004
0.006
0.008
Fig. 18 Left: spectra of the O-50O-40 distance autocorrelation function for hPNP andunsolvated substrates. Note that the natural vibration of the oxygen centers, i.e. 285 cm1, isaltered in the presence of the enzyme. Right: the power spectrum of the H257G mutant of theE?S complex shows a distinct peak at 333 cm1, very similar to the result for the solvatedsubstrate.
Effect of enzyme dynamics on catalytic activity 339
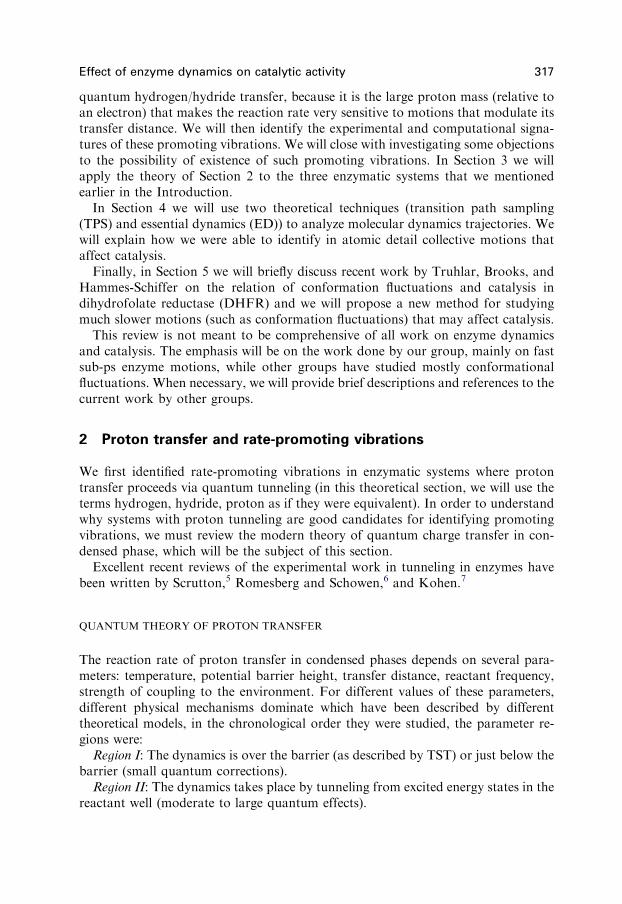
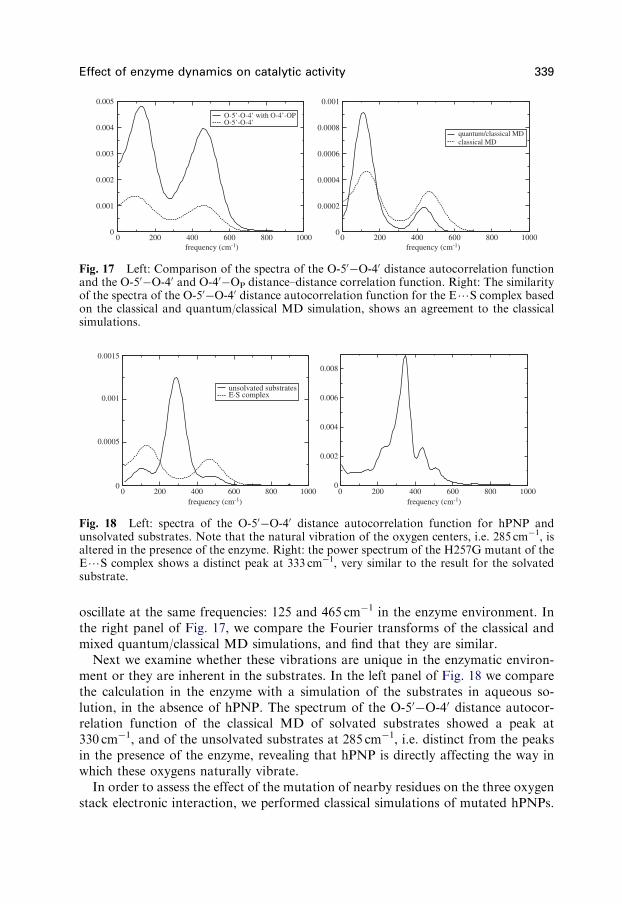
oscillate at the same frequencies: 125 and 465 cm1 in the enzyme environment. Inthe right panel of Fig. 17, we compare the Fourier transforms of the classical andmixed quantum/classical MD simulations, and find that they are similar.
Next we examine whether these vibrations are unique in the enzymatic environ-ment or they are inherent in the substrates. In the left panel of Fig. 18 we comparethe calculation in the enzyme with a simulation of the substrates in aqueous so-lution, in the absence of hPNP. The spectrum of the O-50O-40 distance autocor-relation function of the classical MD of solvated substrates showed a peak at330 cm1, and of the unsolvated substrates at 285 cm1, i.e. distinct from the peaksin the presence of the enzyme, revealing that hPNP is directly affecting the way inwhich these oxygens naturally vibrate.
In order to assess the effect of the mutation of nearby residues on the three oxygenstack electronic interaction, we performed classical simulations of mutated hPNPs.

D. ANTONIOU ET AL.340
We studied whether changes in protein structure have an influence on the pattern ofspectra discussed above for WT hPNP. In particular, we mutated F200G, E201G,H257G, H257A, V260G, and L261G. The spectrum of the O-50O-40 motion for theF200G, E201G, V260G, and L261G mutated hPNPs was very similar to that of theWT. However, as can be seen in the left panel of Fig. 18, the H257G was very similarto that of the unsolvated substrates, giving further evidence that H257 is responsiblefor modifying the power spectrum in the E?S complex.
Results: energetic barrier
We turn our attention to the coupling of the rate-promoting motion we have beendescribing, to the reaction coordinate. We used the hybrid QM/MM method de-scribed earlier to obtain the PES for the phosphorolysis reaction for various E?Scomplexes, for a range of O-50O-40 and O-40–OP interatomic distances. We havepresented elsewhere35 detailed results for the activation energies (kcalmol1) as afunction of oxygen interatomic distances of the E?S complex and the E?TScomplex. This is collection of structures covered a wide range of geometries, withO-50O-40 ranging from 2.78 to 3.64 A and O-40OP ranging from 3.35 to 4.30 A.Thus, these structures were sufficient to represent the different E?S geometries thatcan be found in the PES.
To quantify this correlation between lower activation energy and compression ofthe oxygen distances, we fitted the results for the activation energies to a functionthat had up to quadratic terms, as seen in Fig. 19 (a parabolic fitting had smaller w2
than the also plausible linear fitting). The parabolic dependence of the activation onenergy on distance may have a simple interpretation: as the distances between theoxygen increases the energy rises as carbocation stabilization is lost, but at shorterdistances, as we approach distances equal to twice the van der Waals radius, elec-tron–electron repulsion will compete with the stabilization and there is a point wherethere are no further reduction of the activation energy. From the values of the
6.4 6.6 6.8 7 7.2 7.4sum of distances (Å)
44
46
48
50
52
54
56
58
Act
ivat
ion
Ene
rgy
(kca
l/mol
)
Fig. 19 Activation energies (kcal mol1) versus the sum of O-50O-40 and O-40OP distances(A) for the E?S complex.

Effect of enzyme dynamics on catalytic activity 341
curvature of the parabolic fittings we can obtain a spring constant, and by using amass equal to the reduced mass of OO, we can obtain an effective harmonicfrequency associated with the parabolic fittings shown in Fig. 19. This effectivefrequency was equal to 180 cm1, in surprising agreement with the position of thepeaks of the spectra of the oxygen motions.
In conclusion, the protein motion that compresses the oxygen stack, is one of thefactors which makes the reaction possible, leading up to a 20% decrease in barrierheight.
Results: charge fluctuations
In addition, we have studied39 charge fluctuations in the ribose and purine groupsof the enzyme-bound ribonucleoside. If these fluctuations are resonant with theoxygen-stack promoting motion, it would further validate the hypothesis that thepromoting motion pushes electrons across the ribosidic bond.
Partial charge calculations were employed to follow changes in electron densityin the substrate guanosine, using Gaussian98 at the B3LYP level of theory withthe 6-31G(d,p) basis set. Partial charges for each atom were calculated using theCHELPG algorithm. Charges for the ribose and purine ring components ofthe ribonucleoside substrate were calculated by adding up the partial charges of theconstituent atoms of each.
We generated time series for the partial charges, and as usual took the Fouriertransforms, shown in the left panel of Fig. 20. The two spectra nearly overlap,demonstrating that the charge fluctuations in the ribose are resonant with the chargefluctuations in the purine ring, with a dominant peak at 450 cm1 and a smaller peakat 160 cm1. Recalling that the spectrum of the oxygen-stack compression motionhad peaks 125 and 465 cm1, we note that the partial charge spectra are clearlyresonant with those of the oxygen motion.
In addition, we probed fluctuations across the N9-C10 ribosidic bond, since this isthe bond that is broken in this reaction. The spectra are shown in the right panel ofFig. 20. They are resonant with each other and with the spectra for ribose and purine
0 100 200 300 400 500 600frequency (cm-1) frequency (cm-1)
0
1e-07
2e-07
3e-07
4e-07
5e-07
6e-07
7e-07
ribosepurine ring
0 100 200 300 400 500 6000
5e-07
1e-06
1.5e-06
2e-06
2.5e-06
3e-06C1’N9
Fig. 20 Left: Power spectra for ribose and purine ring partial charge time series. Right:Power spectra for atoms C10 and N9 partial charge time series.

D. ANTONIOU ET AL.342
ring, and also feature peaks at 160 and 450 cm1, i.e. they contain the signature peaksof the oxygen-stack compression spectra. These results confirm that the oxygen-stackcompression is the cause of these partial charge fluctuations.
4 Description in atomic detail of correlated protein motions
In this section we will examine other kinds of correlated protein motions (with ps- orns-timescales) and methods that can identify them. The rate-promoting vibrations weexamined in the previous section are just one example of correlated protein motions.Because promoting vibrations involve residues in the immediate vicinity of donor andacceptor, it was relatively easy to identify them. In the more general case of extendedcorrelated motions, it would be a challenge to identify residues that take part in them.In this section we describe two methods that have been successfully used for iden-tifying atomic motions of interest, the TPS and the ED method. We will apply themto two enzymes we already studied in the previous section, LDH and PNP.
TRANSITION PATH SAMPLING
TPS was originally developed for studying rare reactive events. The most difficultproblem in studying reactive events, which is hidden by the wide acceptance of TST,is to define an appropriate reaction coordinate and find the location of the TS. Inaddition, if one tries to simulate rare reaction events using a molecular dynamicssimulation, most of the trajectories that start from the reactants will not cross tothe products, and as a consequence the calculation becomes computationally notfeasible, because the time step that must be used in the MD simulation is muchsmaller than the timescale of interest.
TPS40,41 addresses these problems by performing a Monte Carlo search in thetrajectory space. It can simulate rare events without the knowledge of a reactioncoordinate or the TS. TPS needs another algorithm (molecular dynamics) to gen-erate trajectories, while TPS itself is an algorithm for searching the trajectory space.The essence of TPS is that the chaotic nature of classical multi-dimensional systemsguarantees a fast Monte Carlo search of the trajectory space.
A brief description of the algorithm follows. Let us assume a transition between Rand P (i.e. reactants and products). Since R and P are long-lived states, they canaccommodate equilibrium fluctuations, and can be characterized by a variable,called ‘‘order parameter’’, which can be used as a criterion for deciding whetherthe system is localized in R or P. Let us further assume that we somehow know onereactive trajectory that starts from R and ends in P. In the TPS algorithm werandomly select a time slice along this reactive trajectory, we perturb slightly allmomenta at that time slice, and starting from that time slice and using the newmomenta, we propagate (‘‘shoot’’) forward and backward in time, examiningwhether the new trajectory is reactive or not. In the usual Monte Carlo fashion, the

Effect of enzyme dynamics on catalytic activity 343
new trajectory is accepted or not, according to some probability distribution.Because of the ergodicity of classical dynamics, new trajectories are guaranteed toquickly deviate from old ones, leading to a fast sampling of the trajectory space.
An ensemble of reactive trajectories in LDH
We have applied42 the TPS algorithm to LDH, i.e. to the enzyme in which weidentified a rate-promoting vibration, as discussed in the previous section. This work,along with a paper by Schlick43 were the first that applied the TPS algorithm to arealistic protein. By finding common features in all the harvested trajectories, one canget insights for defining an appropriate reaction coordinate, and for identifying ex-perimental targets for future studies. Recall that LDH catalyzes the interconversionof the hydroxy-acid lactate and the keto-acid pyruvate with the coenzyme NAD. Thereaction involves a double transfer: a proton transfer between the active site histidineand the C2 substrate oxygen and a hydride transfer between NC4 of the coenzymeand C2 of the substrate (see Fig. 6). In fact, there was a controversy regardingwhether the transfer steps are concerted or sequential, that our study was able toresolve. Since the reaction involves bond cleavage we must use a quantum potentialfor describing the reactive potential surface. The details of our choice for the quan-tum description are explained elsewhere.42 Below we briefly define the variables andconcepts that our TPS simulation used.
Definition of the order parameter. The first step in the TPS algorithm is to define an‘‘order parameter,’’ i.e. a variable that describes whether the system is in the re-actants, products or in an intermediate region, as shown schematically in Fig. 21.The pyruvate and lactate regions were defined by the values of the appropriate bondlengths.42
Decorrelation of trajectories. The goal of TPS is to generate reactive trajectoriesthat span the whole trajectory space. We must ensure that the ensemble of trajectories
Fig. 21 Schematic representation of the TPS algorithm. The shaded regions are identified bythe order parameter as reactants and products. The solid line is a reactive trajectory. A‘‘shooting’’ move is shown: a time slice was chosen along the reactive trajectory, momentawere perturbed, and then the system was propagated forward and backward in time, resultingin a non-reactive trajectory shown with the dashed line.
D. ANTONIOU ET AL.344
we generated do not lie ‘‘near each other’’ in the trajectory space. The variable thatmonitors this is an autocorrelation function of the appropriate variable. This auto-correlation function is shown in Fig. 22. As can be seen, the trajectories becameuncorrelated after about 30 successful iterations of the algorithm.
Results: atomic description of relevant catalytic motions
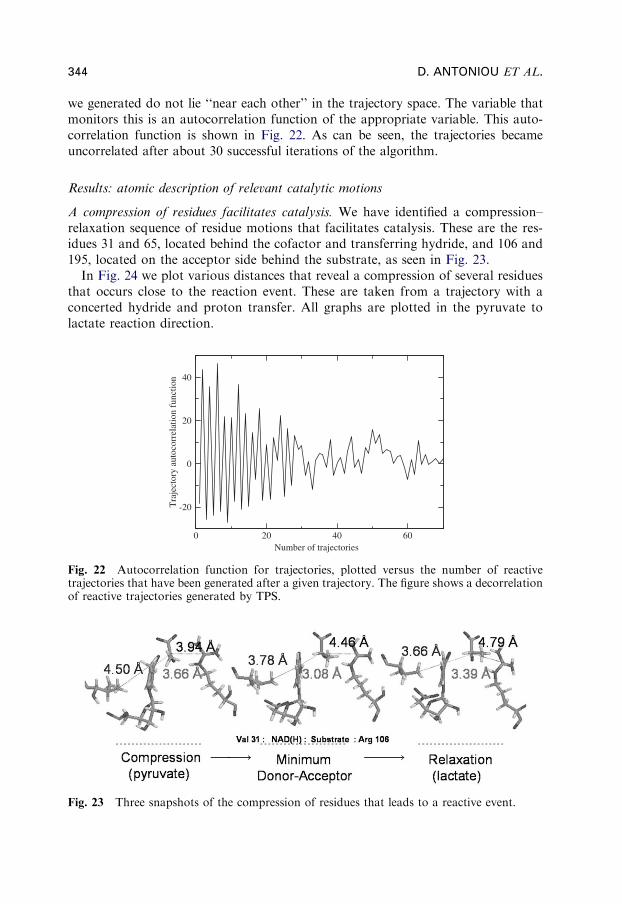
A compression of residues facilitates catalysis. We have identified a compression–relaxation sequence of residue motions that facilitates catalysis. These are the res-idues 31 and 65, located behind the cofactor and transferring hydride, and 106 and195, located on the acceptor side behind the substrate, as seen in Fig. 23.
In Fig. 24 we plot various distances that reveal a compression of several residuesthat occurs close to the reaction event. These are taken from a trajectory with aconcerted hydride and proton transfer. All graphs are plotted in the pyruvate tolactate reaction direction.
0 20 40 60Number of trajectories
-20
0
20
40
Tra
ject
ory
auto
corr
elat
ion
func
tion
Fig. 22 Autocorrelation function for trajectories, plotted versus the number of reactivetrajectories that have been generated after a given trajectory. The figure shows a decorrelationof reactive trajectories generated by TPS.
Fig. 23 Three snapshots of the compression of residues that leads to a reactive event.

0 2000 4000 6000 8000 10000 12000Time (fs)
0
1
2
3
4
5D
ista
nce
(Å)
Hydride : Cofactor (NC4)Proton : Histidine (NE2)
(a) Hydride and proton transfer
0 2000 4000 6000 8000 10000 12000Time (fs)
3
3.5
4
4.5
Dis
tanc
e (Å
)
(b) Donor - acceptor distance: hydride
8.8
9
9.2
9.4
9.6
9.8
Dis
tanc
e (Å
) : R
31
Residue 31
(c) Residue distance from active site
0 2000 4000 6000 8000 10000 12000Time (fs)
24
24.5
25
25.5
26
Dis
tanc
e (Å
) : R
65
Residue 65
8.8
9
9.2
9.4
9.6
9.8
10
Dis
tanc
e (Å
) : R
31
Residue 31
4000 5000 6000 7000 8000Time (fs)
6
6.2
6.4
6.6
6.8
7
7.2
Dis
tanc
e (Å
) : R
106
Residue 106
(d) Compression - relaxation across the donor-acceptor axis
Fig. 24 Comparison of motions of donor–acceptor and surrounding residues reveals acompression-relaxation motion. See text for description of the panels.
Effect of enzyme dynamics on catalytic activity 345
The panels of Fig. 24 describe the following:
(a)
Plots the distance of the hydride from the cofactor reactive carbon and thedistance of the proton from the histidine reactive nitrogen. At time ¼ 6100 fs theatoms begin to transfer to the substrate.(b)
Plots the donor–acceptor distance for the hydride. The minimum distance of thedonor–acceptor distance, and the distance of residues Valine 31 and Arginine106 from the active site are marked by solid circles. The hydride donor–acceptordistance reaches its minimum at time ¼ 6132 fs. A similar plot can be drawn forthe proton transfer.(c)
Plots the distance of residues 31 and 65 from the active site. They are locatedbehind the cofactor and transferring hydride.(d)
Plots the distance of residues 31 and 106 from 4 to 8 ps. Residue 106, responsiblefor polarization of the substrate carbonyl bond via hydrogen bonding, initiallycompresses towards the active site reaching a minimum distance at 6043 fs(marked by solid circle). By 6153 fs (marked by solid circle) residue 31 hasreached its minimal compression towards the active site.The compression towards the active site revealed in Fig. 24 is what causes thedonor–acceptor distances for the hydride and proton transfers to reach their mini-mum. When they reach their minimum, interactions across the donor, transfer-ring atom, and acceptor are initiated. The events that occur next are critical for

D. ANTONIOU ET AL.346
completion of the reaction. The continued compression of the donor side residuestowards the active site, are not only involved with bringing the donor–acceptordistance closer together, but also with shifting the entire enzyme. While the do-nor–acceptor distances increase again, it will be the motion of the surroundingresidues that ultimately determine whether the atoms transfer. In particular, thecompression of the donor side residues cause the acceptor side residues to relax awayand the reaction to complete.
Concerted vs. stepwise transfers. We now address the question of whether thehydride and proton transfers are concerted, or whether the hydride transfer precedesthe proton in the pyruvate to lactate reaction direction. Our TPS study showed thatboth mechanisms are possible. In Fig. 25 we show the distribution of the time lagbetween the hydride and proton transfer for all reactive trajectories. We note thatboth concerted and sequential transfers are possible, and that 74% of the trajectorieshave a time lag greater than 10 fs, indicating that the majority of reactive trajectorieshave sequential transfer steps.
Figure 26 compares two trajectories: one for concerted hydride and protontransfers with one for sequential transfers, as seen in panel (a). In panel (b) we cansee that the donor–acceptor distance for the stepwise trajectory reaches its minimumfirst, due to the earlier combined compression of residues 31 and 106. Why does theproton take longer to transfer? If we look at panel (c) at the distance of residue 31after it reaches its minimum, it jumps back away from the active site causing a delayin the relaxation of residue 106, as seen in panel (d), and a delay in the increase of theproton donor–acceptor distance. Soon after, panel (d) shows that residue 106 relaxesaway from the active site while the donor–acceptor distance increases, completingthe reaction.
Perturbation of the donor– acceptor axis and compression reaction coordinate. Wewill now demonstrate the effects of disrupting the compression–relaxation of thedonor–acceptor axis residues close to the reactive event. For the perturbation weused the coordinates and velocities of a time slice 160 fs away from the reactive event
0
10
20
30
40
50
60
70
80
10 30 50 70 90 110
130
150
170
190
210
230
250
270
time lag (fs)
# of
traj
ecto
ries
Fig. 25 Distribution of the time lag between the hydride and proton transfer.

4000 5000 6000 7000 8000Time (fs)
0
1
2
3
4
Dis
tanc
e (Å
)
concertedsequential
(a) Distance of proton from histidine (NE2)
4000 5000 6000 7000 8000Time (fs)
2.5
3
3.5
4
4.5
Dis
tanc
e (Å
)
concertedsequential
(b) Donor-acceptor distance: proton transfer
4000 5000 6000 7000 8000Time (fs)
8.8
9
9.2
9.4
9.6
9.8
10
Dis
tanc
e (Å
)
concertedsequential
(c) Distance of residue 31 from active site
4000 5000 6000 7000 8000Time (fs)
6
6.2
6.4
6.6
6.8
7
7.2
Dis
tanc
e (Å
)
concertedsequential
(d) Distance of residue 106 from active site
Fig. 26 Comparison of motions of donor–acceptor and surrounding residues reveals whenthe double transfer is sequential and when it is concerted. See text for description of thepanels. The circles in the residue trajectories in the lower panels, highlight the moment thetransfer event happens.
Effect of enzyme dynamics on catalytic activity 347
of a concerted transfer trajectory. The momenta of residue 31 were perturbed alongthe residue-active site axis, 1 A away from the active site.
Figure 27 contrasts the original reactive trajectory to the perturbed one, shown inpanel (a). Panel (b) shows that after a delay, the hydride donor–acceptor distancebegins to deviate from the original reactive trajectory, unable to reach its minimumwithout the full compression of the donor side residues, i.e. 65 shown in panel (c) andthe perturbed 31 (not shown). Additionally, the absence of the compression preventsthe relaxation of the acceptor side residues, for example, of 106 shown in panel (d).The donor–acceptor distance comes closer, since at that time residue 106 is stillcompressing and the perturbed residue 31 has a weaker, delayed compression. Due tothis, the hydride starts to transfer. However, since the compression–relaxation tran-sition does not occur, the reaction is not completed.
ESSENTIAL DYNAMICS
ED (or principal component analysis), is a method commonly used for identifyinglarge scale motions in proteins, e.g., protein folding or substrate binding. A sum-mary of the method follows. Let ~R ¼ ðR1;x;R1;y; . . . ;RN ;zÞ be the positions of the

5600 5800 6000 6200 6400Time (fs)
0
1
2
3
4
5
Dis
tanc
e (Å
)
Reactive: Hydrice - Cofactor (NC4)Perturbed: Hydride - Cofactor (NC4)Reactive: Proton - Histidine (NE2)Perturbed: Proton - Histidine (NE2)
(a) Hydride and proton transfer
5600 5800 6000 6200 6400Time (fs)
2.5
3
3.5
4
4.5
Dis
tanc
e (Å
)
Reactive Trajectory Perturbed Trajectory
(b) Donor-acceptor distance: hydride
5600 5800 6000 6200 6400Time (fs)
24
24.5
25
25.5
26
Dis
tanc
e (Å
)
Reactive Trajectory Perturbed Trajectory
(c) Distance of residue 65 from active site
5600 5800 6000 6200 6400Time (fs)
6
6.2
6.4
6.6
6.8
7
7.2
Dis
tanc
e (Å
)
Reactive Trajectory Perturbed Trajectory
(d) Distance of residue 106 from active site
Fig. 27 How perturbation of a residue makes a trajectory nonreactive.
D. ANTONIOU ET AL.348
protein atoms. One assumes that the solution of Newton’s equation of motion canbe written in the following approximate form:
~RðtÞ ’X3N
m¼1
amðtÞ~Zm (13)
One then tries to find the coefficients and basis functions am, ~Zm that providethe best approximation (in a least-squares sense) of ~RðtÞ to the exact solution ofNewton’s equation of motion. This condition is satisfied by choosing the spatialbasis set ~Zm to be the eigenfunctions of the covariance matrix
Cij ¼ hðRi hRiiÞ ðRj hRjiÞi (14)
where h i denotes time average over the entire MD trajectory. When a few eigen-values of the covariance matrix are much bigger than the rest, the correspondingeigenvectors dominate the dynamics. When sorted by their eigenvalues, the EDmodes are sorted according to their contribution to the total mean-square fluctu-ation. These few dominant modes are designed to provide a good fitting to thetrajectory. In a protein, there may be concerted motions of groups of atoms (e.g.,loop motions) which provide a significant number of covariant matrix elements Cij,and therefore dominate the principal eigenvectors of the covariant matrix. In thiscase, ED separates the conformational space into an essential subspace containing

Effect of enzyme dynamics on catalytic activity 349
only a few dominant collective modes, and a remaining space which contains ran-dom atomic fluctuations.44,45
In Section 3, we found that protein motions in hPNP accelerate the chemical step.Now we will present an application of the ED method, used to identify proteinmotions that increase turnover by creating substrate binding affinity. In particular,we have studied46 the conformational change in the 241–265 loop, and identifyvariations in its orientation, which is crucial in determining the substrate accessi-bility to the active site.
Substrate binding in PNP
As a reference for the discussion below, in Fig. 28 show a plot of the active siteof PNP. We will present the experimental reasons that led us to focus our attentionon the 241–265 loop. If one assumes that each X-ray crystal structure representsa possible conformation in solution, considering several crystals and their relativeatomic B-factors presents an experimental view of the conformational flexibility ofthe protein at an atomic resolution. The relative B-factors of the Ca atoms of apohPNP, and hPNP complexed with the TS analog Immucillin-H show that the loopresidue E250 is the centroid of highly mobile region, while residues G63 and E183are centroids of more localized mobile regions. Additionally, from the structuraldifferences between the crystal pairs of apo hPNP–hPNP guanine (formation of theMichaelis complex), and apo hPNP–hPNP ImmH (formation of the TS analog
Fig. 28 Active site of hPNP with the TS analog ImmH and the phosphate nucleophile.

0 50 100 150 200 250 300residue number
0
2
4
6
8
RM
SD (
Å)
apo hPNP -- hPNP·guanineapo hPNP -- hPNP·ImmH
Fig. 29 Detailed root-mean-square displacement (RMSD) A, per residue, of the geometricdifference between the apo hPNP–hPNP?guanine (black), and apo hPNP–hPNP?ImmH(red) crystal structure pairs. The different RMSDs of both pairs of crystals, provide evidencethat the TS analog is bound to hPNP much tighter than the substrate analog.
D. ANTONIOU ET AL.350
complex), it has been questioned whether correlated motions exist to allow thenecessary conformational change of the 241–265 loop for substrate binding andturnover. It is accepted that reorganization of this flexible loop, which makes uppart of the active site, is essential for allowing different substrates/inhibitors to enterthe active site.47 The loop displacement is conjectured to push the substrates towardsthe active center favoring more reactive configurations. In Fig. 29 we show theroot-mean-square deviation of the Ca geometric difference between the apohPNP–hPNP guanine, and the apo hPNP–hPNP ImmH pairs. The same geometri-cal difference trend appears for any combination of two apo hPNP structureswith six substrate/TS analogs, confirming the substantial loop rearrangement uponsubstrate analog/TS analog binding.
We used principal component analysis to identify correlated motions in differentforms of hPNP, namely, its apo and complexed forms, and assess whether theyfacilitate the 241–265 loop rearrangement prior to the subsequent phosphorolysisreaction. We compared the principal components for the apo and complexed hPNPsimulations, and examined the different correlated motions for each form of theenzyme, comparing directly to the crystallographic B-factors. Finally, via experimen-tal site-directed mutagenesis, several residues implicated in the correlated motion weremutated, and the kinetic constants kcat and KM (fingerprints of catalytic efficiency),were measured to weigh the impact of these residues in the phosphorolytic efficiency.
Results: mobile residues in the active site
We performed molecular dynamics simulations for the APO, ES, and EI-APOmodels. The objective of the EI-APO simulation is to capture putative concerted

Effect of enzyme dynamics on catalytic activity 351
motions in hPNP during the loop conformational change taking place upongoing from an ‘‘E?I geometry’’ towards an ‘‘apo hPNP geometry’’, which revers-ibly translates into existing motions in hPNP during substrate binding and TSformation.
For the APO simulations, from the first few eigenvectors, we observed prominentcorrelated motions in the neighboring residues F159 and P150, adjacent to thepurine substrate. Moreover, it is not surprising that G63 and E183 also show strongmotions, granted their large B-factors. Additionally, to a lesser extent, the active siteresidues S33, H84, H86, and F200 display high mobilities. These concerted motionswere observed both in a 1-ns vacuum simulation and in a solvated simulation.Overall, the most significant feature of the APO simulations is the correlated mo-tions found in the spatially neighboring F159 and P150 residues.
In the case of the ES simulations, we found that there exist correlated motionsaround the F200 and E250 residues, the latter being the epicenter of the loopdynamics. To a lesser extent, residues S33 and P150 also showed concerted behavior.It is not surprising that residues H183 and N121 are involved in dynamics grantedtheir high mobilities implied by its high B-factors. We found differences in theconcerted motions between the APO and ES models of hPNP: the APO modelpresents concerted dynamics around the F159 and P150 residues, while for thesimulation of the Michaelis complex (ES), concerted motions are mostly foundaround the active site residue F200 and loop residue E250. This in turn suggestedthat dynamics in the apo enzyme is concentrated around the residues F159 andP150, though once the substrate enters the active site, these become dormant, andactive site residue F200 and loop residue E250 (embracing the purine substrate),come into action.
For the EI-APO simulations, the correlated motions were again found around theneighboring residues F159 and P150, as well as around F200, E250, and S33. Thisbehavior resembles a combination of the APO and ES models. These results suggestthese residues are coordinated in the enzyme so that it can successfully accommodatethe substrate in the active site and achieve TS formation.
We observe that the three computational models (APO, ES, and EI-APO) presentdistinct characteristics in their correlated motions. Some similarities are found, forexample, in the high mobilities of G63 and E183, in agreement with their highcrystallographic B-factors. However, other residues which had not been seen ashighly mobile based on their B-factors (namely F159, P150, H230, and F200), havebeen found to have correlated dynamics. This implies that observation of crystallo-graphic structures alone may not be enough to infer important dynamic behavior inproteins, and that additional MD studies are needed to identify correlated dynami-cal modes. Finally, we have been able to successfully recognize correlated motionson the 241–265 loop, particularly present in the simulations of the Michaelis com-plex, and in a lesser extent in the EI-APO simulations. This suggests that the loopmay have a favorable role in capturing the substrate as well as in the chemical step.Fig. 30 highlights the residues that were identified by the principal componentanalysis: note the presence of residues F159 and F200, whose involvement in bindingwas not obvious from B-factors alone.

Fig. 30 hPNP with marked residues that show correlated motions: S33 (brown), H64(brown), H86 (brown), P150 (magenta), F159 (blue), H230 (pink) and 241–265 loop (red).
Table 3 Experimental kinetic parameters for different mutants which show correlated mo-tions in hPNP
Mutant WT F200G F159G H230G N121G
KM (mM) 76.8 1580 2260 145 64.9kcat (s
–1) 32.4 3.8 2.3 2.6 33.0kcat/KM (105s1M1) 4.2 0.024 0.01 0.1 5.0
D. ANTONIOU ET AL.352
Experimental site-directed mutagenesis
The X-ray crystal structures indicate that all direct contacts between hPNP and thesubstrates guanosine and phosphate are through amino acid side chains. Our site-directed mutagenesis strategy replaced each residue with glycine in order to assessthe contribution of the residue’s side chain to substrate binding and/or catalysis.Results from the kinetic studies (Table 3) indicate that substrate binding affinity wasmost sensitive to the F159G and F200G mutations. In the phosphorolytic direction,an increase of ca. 400-fold in KM (and modest change in kcat) is observed for the

Effect of enzyme dynamics on catalytic activity 353
F159G mutant. Loss of the herringbone-type interaction between the b-face of theribose and the hydrophobic surface created by this residue is important for substratebinding, thus essential for hPNP activity. Additionally, the H230G mutant showedmodest changes in both KM and kcat, unexpectedly given its long distance from theactive site. Finally, the N121G mutant, did not show any relevant change in catalyticefficiency, regardless of proving substantial concerted dynamic behavior during theMichaelis complex simulation.
5 Conformational fluctuations
The motions we examined in the previous sections had ps- or ns-timescales, thereforethey were accessible with ordinary molecular dynamic simulations. However, it iswell known that conformation fluctuations are sometimes coupled to the reactioncoordinate. From a computational point of view, such effects are practicallyimpossible to study directly. To understand the reason, let us recall the shape of theenergy landscape of a protein (a description of the modern energy landscape view ofbiomolecules can be found in the recent textbook of Wales48). It consists of a verylarge number of local minima (conformations), separated by barriers whose heightranges from moderate to high (left panel of Fig. 32). The time evolution of thesystem in this landscape consists of relatively long periods of oscillations in the localminima, separated by hops between conformations (Fig. 31).
The rate-promoting vibrations we examined earlier are fluctuations within asingle conformation. The problem we want to address is, whether there are someconformations which favor catalysis, for example, because in them the average
-6 -4 -2 0 2First principal component
-4
-3
-2
-1
0
1
2
Seco
nd p
rinc
ipal
com
pone
nt
Fig. 31 A 100 ps MD trajectory of PNP, plotted in the plane of the two largest principalcomponents. The two darker regions, where the trajectory fluctuates locally, are two con-formations. If we are interested in sampling many conformations, the long time the systemspends in local fluctuations in a given conformation, is a waste of resources.

D. ANTONIOU ET AL.354
donor–acceptor distance is shorter. To study this problem, we would like to haveour molecular dynamics trajectory visit as many conformations as possible. How-ever, the system spends most of its time in fluctuations within a conformation localminimum, and only rarely hops to a different conformation minimum. Therefore,MD simulations may be useful for studying other problems, but they are not apractical tool for searching the conformation space. However, there are other tech-niques that may be useful. In the rest of this section, we will first briefly review recentwork on conformation fluctuations that enhance tunneling in DHFR; we will closewith a computational scheme we propose for studying this class of problems.
DIHYDROFOLATE REDUCTASE
DHFR catalyzes the reduction of 7,8-dihydrofolate (DHF) to 5,6,7,8-tetrahydrofo-late (THF) through the oxidation of the coenzyme NADPH. DHFR has beenstudied extensively due to its role in maintaining intracellular pools of THF, which isan important component of several metabolic pathways. The reaction catalyzed byDHFR is thought to involve transfer of a proton followed by a hydride to DHF.
It has been shown through nuclear magnetic resonance (NMR) studies49,50 thatthe catalytic cycle involves conformational changes of the M20 loop. This mobileloop is close to the active site and is assumed to play an important role in binding ofthe cofactor and substrate to DHFR. Also, mutational studies have identified distalresidues51 that affect catalysis. These studies strongly suggest that conformationalchanges are related to catalysis.
In addition, classical MD simulations52 have identified correlated domain motionsin the reactant DHF complex but not in product complexes, indicating they arerelated to catalysis. These domains are in the same regions highlighted by the NMRstudies.
We will only present a very brief review of theoretical studies on this system andrefer to reader to publications of the groups that have studied it.53–55 Since thecatalytic step involves a hydride transfer, a major difficulty is how to treat quantumeffects. These works followed different paths.
Truhlar, Gao, and Garcia-Viloca53 use a geometric reaction coordinate, thedifference between acceptor-hydrogen and donor-hydrogen distances. The system isdivided into a small primary zone at the active site, and a secondary zone. Theresults are averaged over several secondary zone configurations. Electronic quantumeffects are included with a semi-empirical QM/MM potential that is augmented witha valence bond term, parametrized to fit the experimental free energies. The freeenergy profile is calculated with an umbrella sampling along the above reactioncoordinate. Brooks and Thorpe,55 also used a semi-empirical QM/MM potential.Only structures from the reactant side were used, and those with donor–acceptordistance smaller than 2.5 A were used in the QM/MM calculations. For each ofthese configurations, a QM/MM optimization was performed for a series of fixedhydrogen-acceptor distances. Only atoms within 10 A from the transferring hydro-gen, were allowed to move. Hammes-Schiffer54 used as a reaction coordinate the

Effect of enzyme dynamics on catalytic activity 355
energy difference between reactant and product diabatic states, averaged over theground state of the vibrational wavefunction of the transferred hydrogen. Electronicquantum effects are included through an EVB potential, parametrized to fit exper-imental free energies of activation. The free energy profile is generated by samplingover the entire range of that collective reaction coordinate. Once the energy profileis found, they used TST to calculate the reaction rate. Note that in real timethe protein dynamics may need e.g., 1 ms to move along the reaction pathway ofthe reactive coordinate used in these works, so the generation of the energy profileallowed them to describe an event that requires time longer than any feasible mole-cular dynamics trajectory.
There is a long-standing debate whether approaches that calculate the free energybarrier using a geometric reaction coordinate can sufficiently sample protein con-formations and whether methods that use the energy gap as the reaction coordinateare superior. In the present system, it has been shown53 that the two methods gen-erate equivalent results. In fact both methods produced similar free energy profiles.
Coming back to the work of Truhlar and coworkers,53 and Hammes-Schiffer,54
after they generated a free energy profile along their choice of reaction coordinate,the next step was to examine the ensemble of conformations used to generate a pointon the energy profile, and generate statistics and comparisons for various geometriccharacteristics along the energy profile. They both found a correlation of structuralchanges as the system approaches the TS, which show a tightening of some hydro-gen bonds and of the donor–acceptor distance.
We should emphasize that the structural changes found in those works were notmotions in real time. Even if it is true that conformational changes affect catalysis, itis not clear if the enhancement of the rate is due to a coupling to the motion of thehydride, or due to different thermodynamic averages, for example, because thetransfer distance became shorter. The fact that in the calculations of Thorpe andBrooks,55 most of the enzyme was held fixed, is an indication that the effect isstructural rather than dynamical. In this last work, a wide range of barrier heightswas found, which led to questioning whether approaches that are based on meanfield potentials can capture the range of protein conformations that led to that rangeof energy profiles. Various opinions on these questions can be found in the originalpapers.
To avoid semantic confusion we should clarify that Hammes-Schiffer uses the term‘‘promoting motion’’ to describe an ensemble of conformations that, for example,have a shorter donor–acceptor distance. The ‘‘motion’’ in her case is the impliedintra-conversion among these conformations. The ‘‘promoting vibration’’ we de-scribed earlier refers to fluctuations within a single conformation. The two effects aredifferent and occur in separate timescales.
The identification of the way conformation fluctuations in DHFR affect parti-cular distances at the TS, is a significant achievement. There are some details thatmaybe improved, but we should emphasize that the point we will make this is not acriticism of those works, but rather of the limitations of simulations that are cur-rently possible. These simulations identified distances that change in the TS, but theycan’t distinguish if they must change in a particular order (e.g., as found with TPS in

D. ANTONIOU ET AL.356
LDH). Also, they generated an ensemble of conformations near the TS, but sincethey have no notion of time, they cannot give details of how the system samples theconformations. In the next section we will propose a scheme that may provide astarting point for a discussion that will address these questions.
A PROPOSED SCHEME FOR SEARCHING THE CONFORMATION SPACE
It would be desirable to have a more systematic method for searching for confor-mation fluctuations that are coupled to the reaction coordinate. In the rest of thissection, we will propose a computational scheme that tries to address this problem.This scheme is unpublished work. It consists of three elements:
(1)
Fig.
the
The topological structure of the conformation space.
(2) A computational scheme (kinetic Monte Carlo) for describing dynamics in theconformation space.
(3) An algorithm (string method) for calculating energetic barriers between confor-mations.
The topological structure of conformation space
It is well known that conformations that have similar geometries have similarenergies, but the opposite is not true, conformations that are unrelated may acci-dentally have similar energies. In addition, long MD runs that visit several confor-mations, sample geometrically similar conformations. The above observations suggestthat conformations populate their configuration space in some structured way. Thestructure of the conformation space was studied by Berry and Kunz,56 Becker andKarplus,57 and Becker.58 They termed it ‘‘topological’’ structure because the key inthe description is neither geometrical similarity nor energy, but rather a connectivityconcept, i.e. given a conformation, which other conformations are accessible to it, andhow many saddle points are crossed by the pathway that connects them.
Their main conclusions are summarized in Fig. 32. In the left panel, we see a freeenergy profile. At the energy level marked as ‘‘–1,’’ the conformations that are
Ene
rgy
0
+1
-1
A CBA B C
A B
C
32 The topological structure of conformation space. Left: the energetic profile. Middle:connectivity graph. Right: the clustering of conformations into basins.

Effect of enzyme dynamics on catalytic activity 357
clustered under A are accessible to each other by crossing a single saddle point. Thesame is true for the conformations under B and under C. At the energy level markedas ‘‘0,’’ one can go from A to B by crossing one saddle point. A group of con-formations like the ones clustered A or B, is called a ‘‘basin.’’ There are three basinsvisible in the diagram: A, B, and C. At the energy level marked as ‘‘+1,’’ one can gofrom A to B, but to go from basin B to basin C, one has to cross another saddlepoint. We say that A and B belong to the same ‘‘superbasin,’’ but C belongs to adifferent superbasin. The above structure is depicted in the ‘‘connectivity graph’’shown in the middle panel, that shows how the various conformations and saddlepoints are connected. An easier to understand schematic picture is shown in the rightpanel: the solid dots are conformations and they are grouped in their basins. Solidlines represent transitions through a single saddle point, possible either betweenconformations in the same basin, or between basin A and B. Basins A and Bare connected to basin C by a dashed line, in order to signify that they belong toa different superbasin and one has to cross 2 saddle points instead of 1, for atransition to C.
Becker and Karplus57 classified in this manner all the minima and saddle pointsof a small peptide, met-enkephalin, and found the topological structure shown inFig. 32. It should be noted that Frauenfelder and Wolynes,59 from their analysis ofexperimental data, had predicted earlier that the energy landscape of proteins wouldhave the topological structure shown in Fig. 32. In addition, they found that con-formations that belong to the same basin are separated by low barriers of a few kBT.Basins are separated from each other by a high barrier. That is, a basin consists ofgeometrically similar conformations that are separated by low barriers, and is sep-arated from another basin by a high barrier. This structure explains the observationsmentioned at the beginning of this section. A constellation of basins can have var-ious structures,48 one of which corresponds to the well-known ‘‘funnel’’ landscape ofproteins.60
From the dynamic point of view, the system frequently hops among conforma-tions in the same basin, and it rarely hops to a different basin.
Basin hopping in the conformation space
In the beginning of this section we mentioned that even an MD trajectory that isseveral ns long, can sample only a few conformations. With the help of the basinpicture, we now realize that the conformations sampled by MD run, all lie in thesame basin. The reason is that, by definition, only these conformations are separatedby low barriers, which can be overcome in the timescale accessible to MD runs. Asimple corollary is that the MD run would be able to sample more conformations, ifit could somehow be able to hop to a neighboring basin.
Now, imagine that we have two conformations that belong to different basins,and that we know the height of the barrier that separates these two conformations.Things become more interesting if we recall that the conformations that belongto the same basin are geometrically and energetically similar to each other, thereforewe can pick any conformation as representative of that basin. We can make the

D. ANTONIOU ET AL.358
following assumption, first suggested by Berry56 (he recently applied it to a study ofsmall peptide61): each basin is represented by any conformation in it, and hoppingamong basins can be approximated by transitions among their representative con-formations. In our case, one can use TST to describe these transitions.
This is a summary of the proposed scheme for studying dynamics in conformationspace:
(1)
Generate many protein conformations. (2) Classify them into basins, and keep one representative conformation for eachbasin.
(3) Find the energetic barriers between these representative conformations (see nextsubsection).
(4) Once a set of conformations and the rates of conversions among them have beendetermined, we can use a standard algorithm (e.g., kinetic Monte Carlo62) todescribe the dynamics of hopping in the conformation space.
What we gained compared to standard MD simulations, is that the extremely longtrajectories required until the system hops to a different basin, have been replaced bya transition described by TST and kinetic Monte Carlo. In this way, one is able tosample many more conformations than with an ordinary MD simulation.
To connect these abstract concepts with the subject of this review paper, let usimagine that in an enzyme where proton is transferred through tunneling, there aresome conformations that have donor–acceptor distance that is on average closerthan other conformations. Then, conformation fluctuations that bring the proteintowards these favorable for reaction conformations, will strongly enhance the rate.Unlike the rate-promoting vibrations we discussed earlier, whose timescale were sofast that several oscillations were needed before the proton is transferred, once theprotein reaches a conformation in which donor and acceptor are close, it stays inthat conformation for long enough time that tunneling takes place in that con-figuration of donor–acceptor.
The string method for finding reaction pathways
In order to implement the algorithm suggested in the previous subsection, we need amethod for identifying the energetic barrier between two conformations. This is aspecific case of a more general problem: given two states that lie in local minima ofthe energy landscape, find the MEP that connects them. This is a difficult problemthat has attracted a lot of activity in the last decade.
The most successful method for identifying the MEP and energetic barrierbetween two stable states, is the ‘‘nudged elastic band’’ method.63 This elastic bandis a collection of system images that connect in configuration space the initial andfinal stable states. Adjacent system images are connected with fictitious harmonicstrings. If this elastic band lies along the MEP, the force on it is equal to zero. If it isdisplaced from the MEP, then the forces acting on it (arising from the proteinpotential) will tend to return it towards the MEP. If there were no fictitious springs

Effect of enzyme dynamics on catalytic activity 359
that connected the adjacent system images, the images would relax towards eitherthe initial or final stable states, i.e. the function of the springs is to keep the systemimages well separated. The presence of the fictitious springs guarantees that theelastic band will slide towards the MEP. The computational procedure is concep-tually simple (but difficult to implement in practice): interpolate a few images be-tween initial and final states; connect them with fictitious springs; use the proteinpotential to calculate the forces on the system images; Newton’s equations of motionwill make the elastic band slide towards the MEP.
The elastic band method has been applied with remarkable success.63,64 However,it cannot be applied to problems that have rugged energy landscapes, like proteins.Recently, a similar method has been developed, that was designed to be applicableto rugged landscape systems. It is called the ‘‘finite-temperature string method’’.65
The difference with respect to the nudged elastic band method is the following:again, a chain of system images that connect the initial and final stable states isformed, but instead of connecting them with fictitious springs, the system images areassumed to be elements of a string of uniform density. Similarly to the elastic band,Newtonian dynamics using the protein potential makes the string slide towards theMEP, and during its descent it stretches, while keeping its property of uniformdensity.
The advantage of setting up the chain of images as a string rather as an elasticband, is that while for the elastic band the dynamics of the fictitious springs have tobe solved explicitly (causing difficulties in rugged landscapes where the springs getstuck), the string dynamics that keeps its density uniform can be implemented withthe standard SHAKE algorithm of molecular dynamics.
Recently, the string algorithm was used for finding the transition path in Alaninedipeptide. If one can apply it successfully to a large protein, then this will be the finalmissing link in the scheme outlined above for studying dynamics in conformationspace.
References
1. Pauling, L. (1948). The nature of forces between large molecules of biological interest.Nature 161, 707–709
2. Jencks, W. (1975). Binding energy, specificity, and enzymic catalysis: the Circe effect. Adv.Enzym. 43, 219–310
3. Schramm, V. (2005). Enzymatic transition states: thermodynamics, dynamics and ana-logue design. Arch. Biochem. Biophys. 433, 13–26
4. Agmon, N. and Hopfield, J. (1983). CO binding to heme proteins: a model for barrierheight distributions and slow conformational changes. J. Chem. Phys. 79, 2042–2053
5. Masgrau, L., Basran, J., Hothi, P., Sutclifie, M. and Scrutton, N. (2004). Hydrogentunneling in quinoproteins. Arch. Biochem. Biophys. 428, 41–51
6. Romesberg, F. and Schowen, R. (2004). Isotope effects and quantum tunneling inenzyme-catalyzed hydrogen transfer. Part I. The experimental basis. Adv. Phys. Org.Chem. 39, 27–77
7. Kohen, A. (2005). Probes for hydrogen tunneling and coupled motion in enzymatic sys-tems. In: Schowen, R., Klinman, J. and Hynes, J. (eds), Handbook of Hydrogen, Vol. 2:Biological Aspects of Hydrogen Transfer. Wiley, Weinheim

D. ANTONIOU ET AL.360
8. Bell, R.P. (1980). The Tunnel Effect in Chemistry. Chapman and Hall, New York9. Marcus, R.A. and Sutin, N. (1985). Electron transfers in chemistry and biology. Biochim.
Biophys. Acta. 811, 265–32210. Topaler, M. and Makri, N. (1994). Quantum rates for a double well coupled to a di-
ssipative bath: accurate path integral results and comparison with approximate theories.J. Chem. Phys. 101, 7500–7519
11. Schwartz, S.D. (1996). Quantum activated rates: an evolution operator approach.J. Chem. Phys. 105, 6871–6879
12. Hanggi, P., Talkner, P. and Borkovec, M. (1990). Reaction-rate theory: fifty years afterKramers. Rev. Mod. Phys. 62, 251–341
13. Straub, J.E., Borkovec, M. and Berne, B.J. (1987). Calculation of dynamic friction onintramolecular degrees of freedom. J. Phys. Chem. 91, 4995–4998
14. Zwanzig, R. (1973). Nonlinear generalized Langevin equations. J. Stat. Phys. 9, 215–22015. Truhlar, D. (2005). Variational transition state theory and multidimensional tunneling for
simple and complex reactions in the gas phase, solids, liquids, and enzymes. In: Kohen, A.and Limbach, H. (eds), Isotope Effects in Chemistry and Biology. Marcel Dekker,New York
16. Borgis, D. and Hynes, J.T. (1989). Proton transfer reactions. In: Cooper, A., Houben, J.and Chien, L. (eds), The Enzyme Catalysis Process. Plenum, New York p. 293
17. Borgis, D. and Hynes, J.T. (1991). Molecular dynamics simulation for a model non-adiabatic proton transfer reactions in solution. J. Chem. Phys. 94, 3619–3628
18. Kiefer, P. and Hynes, J. (2004). Kinetic isotope effects for nonadiabatic proton transferreactions in a polar environment: 1 Interpretation of tunneling kinetic isotopic effects. J.Phys. Chem. A. 108, 11793–11808
19. Benderskii, V., Goldanskii, V. and Makarov, D. (1990). The theory of cryochemicalreaction rates in the Leggett formalism. Chem. Phys. Lett. 171, 91–96
20. Benderskii, V., Goldanskii, V. and Makarov, D. (1991). Low-temperature chemical re-actions. Effect of symmetrically coupled vibrations in collinear exchange reactions. Chem.Phys. 154, 407–424
21. Benderskii, V., Makarov, D. and Wight, C. (1994). Chemical dynamics at low temper-atures. Adv. Chem. Phys. 88, 1–385
22. Antoniou, D. and Schwartz, S.D. (1998). Activated chemistry in the presence of astrongly symmetrically coupled vibration. J. Chem. Phys. 108, 3620–3625
23. Antoniou, D., Abolfath, M.R. and Schwartz, S.D. (2004). Transition path sampling studyof classical rate-promoting vibrations. J. Chem. Phys. 121, 6442–6447
24. Miller, W.H. (1976). Importance of nonseparability in quantum mechanical transitionstate theory. Acc. Chem. Res. 9, 306–312
25. van der Zwan, G. and Hynes, J.T. (1983). Nonequilibrium solvation dynamics in solutionreactions. J. Chem. Phys. 78, 4174–4185
26. Bergsma, J.P., Gertner, B.J., Wilson, K.R. and Hynes, J.T. (1987). Molecular dynamics ofa model SN2 reaction in water. J. Chem. Phys. 86, 1356–1376
27. Caratzoulas, S. and Schwartz, S.D. (2001). A computational method to discover theexistence of promoting vibrations for chemical reactions in condensed phases. J. Chem.Phys. 114, 2910–2918
28. Zavodszky, P., Kardos, J., Svingor, A. and Petsko, G. (1998). Adjustment of confor-mational flexibility is a key event in the thermal adaptation of protein. Proc. Natl. Acad.Sci. USA 95, 7406–7411
29. Kohen, A., Cannio, R., Bartolucci, S. and Klinman, J. (1999). Enzyme dynamics andhydrogen tunneling in a thermophilic alcohol dehydrogenase. Nature 399, 496–499
30. Antoniou, D. and Schwartz, S.D. (2001). Internal enzyme motions as a source of catalyticactivity: rate promoting vibrations and hydrogen tunneling. J. Phys. Chem. B 105,5553–5558

Effect of enzyme dynamics on catalytic activity 361
31. Caratzoulas, S., Mincer, J.S. and Schwartz, S.D. (2002). Identification of a protein pro-moting vibration in the reaction catalyzed by horse liver alcohol dehydrogenase. J. Am.Chem. Soc. 124, 3270–3276
32. Luo, J., Kahn, K. and Bruice, T.C. (1999). The linear dependence of log(kcat/km) forreduction of NAD+ by PhCH2OH on the distance between reactants when catalyzed byhorse liver alcohol dehydrogenase and 203 single point mutants. Bioorg. Chem. 27,289–296
33. Cui, Q. and Karplus, M. (2002). Promoting modes and demoting modes in enzyme-catalyzed proton transfer reactions: a study of models and realistic systems. J. Phys.Chem. B 106, 7927–7947
34. Basner, J.E. and Schwartz, S.D. (2004). Donor–acceptor distance and protein promotingvibration coupling to hydride transfer: a possible mechanism for kinetic control inisozymes of human lactate dehydrogenase. J. Phys. Chem. B 108, 444–451
35. Nunez, S., Antoniou, D., Schramm, V.L. and Schwartz, S.D. (2004). Promoting vibra-tions in human PNP: a molecular dynamics and hybrid quantum mechanical/molecularmechanical study. J. Am. Chem. Soc. 126, 15720–15729
36. Lewandowicz, A. and Schramm, V.L. (2004). Transition state analysis for human andplasmodium falciparum purine nucleoside phosphorylases. Biochemistry 43, 1458–1468
37. Schramm, V.L. (2003). Enzymatic transition state poise and transition state analogues.Acc. Chem. Res. 36, 588–596
38. Fedorov, A., Shi, W., Kicska, G., Fedorov, E., Tyler, P.C., Furneaux, R.H., Hanson,J.C., Gainsford, G.J., Larese, J.Z., Schramm, V.L. and Almo, S.C. (2001). Transitionstate structure of PNP and principles of atomic motion in enzymatic catalysis. Biochem-istry 40, 853–860
39. Mincer, J.S., Nunez, S. and Schwartz, S.D. (2004). Coupling protein dynamics to reactioncenter electron density in enzymes: an electronic protein promoting vibration in humanpurine nucleoside phosphorylase. J. Theor. Comp. Chem. 3, 501–509
40. Dellago, C., Bolhuis, P., Csajka, F. and Chandler, D. (1998). Transition path samplingand the calculation of rate constants. J. Chem. Phys. 108, 1964–1977
41. Dellago, C. and Chandler, D. (2003). Bridging the time scale gap with transition pathsampling. In: Nielaba, P., Mareschal, M. and Ciccotti, G. (eds), Bridging the Time Scales:Molecular Simulations for the Next Decade (Vol. 605 of Lecture Notes in Physics).Springer Verlag, New York
42. Basner, J.E. and Schwartz, S.D. (2005). How enzyme dynamics helps catalyze areaction, in atomic detail: a transition path sampling study, J. Am. Chem. Soc. 127,13822–13831
43. Radhakrishnan, R. and Schlick, T. (2004). Orchestration of cooperative events in DNAsynthesis and repair mechanism unraveled by transition path sampling of DNA polym-erase b’s closing. Proc. Natl. Acad. Sci. USA 101, 5970–5975
44. Amadei, A., Linssen, A.B.M. and Berendsen, H.J.C. (1993). Essential dynamics of pro-teins. Proteins 17, 412–425
45. de Groot, B.L., Amadei, A., Scheek, R.M., van Nuland, N.A.J. and Berendsen, H.J.C.(1996). An extended sampling of the configurational space of HPr from E. coli. Proteins26, 314–322
46. Nunez, S., Wing, C., Antoniou, D., Schramm, V.L. and Schwartz, S.D. (2006). Insightinto catalytically relevant correlated motions in human purine nucleoside phosphorylase,J. Phys. Chem. A 110, 463–472
47. Erion, M.D., Takabayashi, K., Smith, H., Kessi, J., Wagner, S., Honger, S., Shames, S.and Ealick, S.E. (1997). Purine nucleoside phosphorylase. 1. Structure-function studies.Biochemistry 36, 11725–11734
48. Wales, D. (ed.), (2003). Energy Landscapes: Applications to Clusters, Biomolecules andGlasses. Cambridge University Press, Cambridge, UK

D. ANTONIOU ET AL.362
49. Osborne, M., Schnell, J., Benkovic, S., Dyson, H. and Wright, P. (2001). Backbonedynamics in dihydrofolate reductase complexes: role of loop flexibility in the catalyticmechanism. Biochemistry 40, 9846–9859
50. Sawaya, M. and Kraut, J. (1997). Loop and subdomain movements in the mechanism ofE. coli dihydrofolate reductase: crystallographic evidence. Biochemistry 36, 586–603
51. Rajagopalan, P., Lutz, S. and Benkovic, S. (2002). Coupling interactions of distal residuesenhance dihydrofolate reductase catalysis: mutational effects on hydride ransfer rates.Biochemistry 41, 12618–12628
52. Radkiewicz, J. and Brooks, C.L. (2000). Protein dynamics in enzymatic catalysis: explo-ration of dihydrofolate reductase. J. Am. Chem. Soc. 122, 225–231
53. Garcia-Viloca, M., Truhlar, D. and Gao, J. (2003). Reaction-path energetics and kineticsof the hydride transfer reaction catalyzed by dihydrofolate reductase. Biochemistry 42,13558–13575
54. Hammes-Schiffer, S. (2004). Quantum-classical simulation methods for hydrogen transferin enzymes: a case study of dihydrofolate reductase. Curr. Opin. Struct. Biol. 14, 192–201
55. Thorpe, I. and Brooks, C. (2004). The coupling of structural fluctuations to hydridetransfer in dihydrofolate reductase. Proteins: Struct. Funct. Bioinf. 57, 444–457
56. Berry, R.S. and Kunz, R. (1995). Topography and dynamics of multidimensional inter-atomic potential surfaces. Phys. Rev. Lett. 20, 3951–3954
57. Becker, O. and Karplus, M. (1997). The topology of multidimensional potential energysurfaces: theory and application to peptide structure and kinetics. J. Chem. Phys. 106,1495–1517
58. Becker, O. (1997). Geometrical versus topological clustering: insight into conformationmapping. Proteins: Struct. Funct. Genet. 27, 213–226
59. Frauenfelder, H., Sligar, S. and Wolynes, P. (1991). The energy landscapes and motionsof proteins. Science 254, 1598–1603
60. Wolynes, P. (2005). Energy landscapes and solved protein-folding problems. Phil. Trans.Roy. Soc. Lond. A 363, 453–464
61. Despa, F., Fernandez, A., Berry, R.S., Levy, Y. and Jortner, J. (2003). Interbasin motionapproach to dynamics of conformationally constrained peptides. J. Chem. Phys. 118,5673–5682
62. Fichthorn, K. and Weinberg, W. (1991). Theoretical foundations of kinetic Monte Carlosimulations. J. Chem. Phys. 95, 1090–1096
63. Henkelman, G., Johannesson, G. and Jonsson, H. (2000). Methods for finding saddlepoints and minimum energy paths. In: Schwartz, S.D. (ed.), Theoretical Methods in Con-densed Phase Chemistry. Kluwer Academic Publishers, Dordrecht, The Netherlands
64. Evans, D. and Wales, D. (2003). The free energy landscape and dynamics of met-enkephalin. J. Chem. Phys. 119, 9947–9955
65. Weinan, E., Ren, W. and Vanden-Eijnden, E. (2005). Finite-temperature string methodfor the study of rare events. J. Phys. Chem. B 109, 6688–6693